analysis and simulation of continuous food frying...
TRANSCRIPT

Citation: Wu, Hongwei, Tassou, Savvas, Karayiannis, T. G. and Jouhara, H. (2013) Analysis and Simulation of Continuous Food Frying Processes. Applied Thermal Engineering, 52 (2). pp. 332-339. ISSN 1359-4311
Published by: Elsevier
URL: http://dx.doi.org/10.1016/j.applthermaleng.2012.04... <http://dx.doi.org/10.1016/j.applthermaleng.2012.04.023>
This version was downloaded from Northumbria Research Link: http://nrl.northumbria.ac.uk/24624/
Northumbria University has developed Northumbria Research Link (NRL) to enable users to access the University’s research output. Copyright © and moral rights for items on NRL are retained by the individual author(s) and/or other copyright owners. Single copies of full items can be reproduced, displayed or performed, and given to third parties in any format or medium for personal research or study, educational, or not-for-profit purposes without prior permission or charge, provided the authors, title and full bibliographic details are given, as well as a hyperlink and/or URL to the original metadata page. The content must not be changed in any way. Full items must not be sold commercially in any format or medium without formal permission of the copyright holder. The full policy is available online: http://nrl.northumbria.ac.uk/policies.html
This document may differ from the final, published version of the research and has been made available online in accordance with publisher policies. To read and/or cite from the published version of the research, please visit the publisher’s website (a subscription may be required.)

at SciVerse ScienceDirect
Applied Thermal Engineering 53 (2013) 332e339
Contents lists available
Applied Thermal Engineering
journal homepage: www.elsevier .com/locate/apthermeng
Analysis and simulation of continuous food frying processes
H. Wu, S.A. Tassou*, T.G. Karayiannis, H. JouharaSchool of Engineering and Design, Brunel University, Uxbridge, Middlesex UB8 3PH, United Kingdom
a r t i c l e i n f o
Article history:Received 27 November 2011Accepted 6 April 2012Available online 15 May 2012
Keywords:Frying processesDynamic simulationControlEnergy consumption
* Corresponding author. Tel.: þ44 0 1895 266865;E-mail address: [email protected] (S.A. T
1359-4311 � 2012 Elsevier Ltd.doi:10.1016/j.applthermaleng.2012.04.023
Open access under CC B
a b s t r a c t
Frying is a very energy intensive process as it invariably involves the evaporation of significant quantitiesof water from the food product. The process is also complex to control due to the variability of rawmaterials, the large number of parameters involved and the interactions between these parameters.Good control of the process is, however, important as it determines not only the final product qualityattributes but also has a significant influence on energy consumption. This paper presents a quasi steadystate model for the simulation of a continuous frying system. The model which was implemented in theMATLAB/Simulink environment has been shown to reproduce data from an industrial crisp productionline with a reasonable degree of accuracy. The model can be used to investigate the impact of differentdesign and control strategies on energy consumption.
� 2012 Elsevier Ltd. Open access under CC BY license.
1. Introduction
With rapidly increasing energy prices and globalisation, foodmanufacturers seek opportunities to reduce production costswithout adversely affecting output, profitability and the quality oftheir finished products. Investment in energy-efficient technolo-gies can make a significant contribution towards reducingproduction costs. Energy-efficient technologies can also offeradditional benefits, such as quality improvement, and improvedenvironmental performance in terms of reductions in CO2 emis-sions and other pollutants.
The food and drinks industry is a significant user of resourcessuch as water, energy, and packaging materials and generatessubstantial quantities of waste and emissions. For these reasons itfaces increased pressure from national governments and interna-tional organisations to improve resource use. The greenhouse gasfootprint of the UK food chain is in the region of 160 MtCO2e andfood manufacturing is responsible for around 13 MtCO2e andprimary energy consumption of 42 TW h [1]. In foodmanufacturingapproximately 68% of the energy is used by fuel fired boilers anddirect heating systems for process and space heating. From theremainder, 16% is electrical energy used by electric motors, 8% isused by electric heating, 6% by refrigeration equipment and theremainder 2% by air compressors [2].
Frying is a common process in food manufacture and is also oneof the oldest food preparation methods in existence. A wide range
fax: þ 44 0 1895 269803.assou).
Y license.
of fried food products have been developed over the years, whichinclude convenience foods such as chicken and fish products,doughnuts, potato chips, and a rapidly expanding range of snackfoods such as potato crisps andmany other products based on corn,rice and wheat. Frying is a process in which food is cooked whilstfloating or being immersed in hot oil. The latter is also known asdeep fat frying and, in essence, is a fast dehydration process, inwhich water is removed from the food by rapid heating in oil. Inaddition to providing heat for cooking, the frying oil also becomesa component of the end product. The quantity of oil in the productcan vary from as little as 10% by weight in breaded fish sticks to 40%in potato chips [3]. The quantity of oil absorbed by the food isa function of many factors which influence the heat and masstransfer between the oil and the food. These factors include thetype of food, the characteristics of the oil and frying conditions.
Potato crisps are by far the largest single category of savourysnack food in the UK with annual sales in excess of £2.0 billion [4].Crisps are normally produced commercially in a continuous fryingprocess which is fed by a serial production line. In the line,described in more detail by Wu et al. [5], the raw potatoes are firstwashed, then peeled and sliced, with the slices washed again anddewatered before they are fed to the fryer. The continuousproduction requires tight control of throughput and high degree ofreliability to avoid process disruptions and production losses. Thisis complicated by variability in the raw material properties, forexample, size and water content of potatoes, and nonlinearitiesarising from the chemical reactions taking place during frying. Inthe production of potato crisps, the frying system consumes morethan 80% of the total processing energy requirement so the greatestpotential for energy savings is offered by design and control
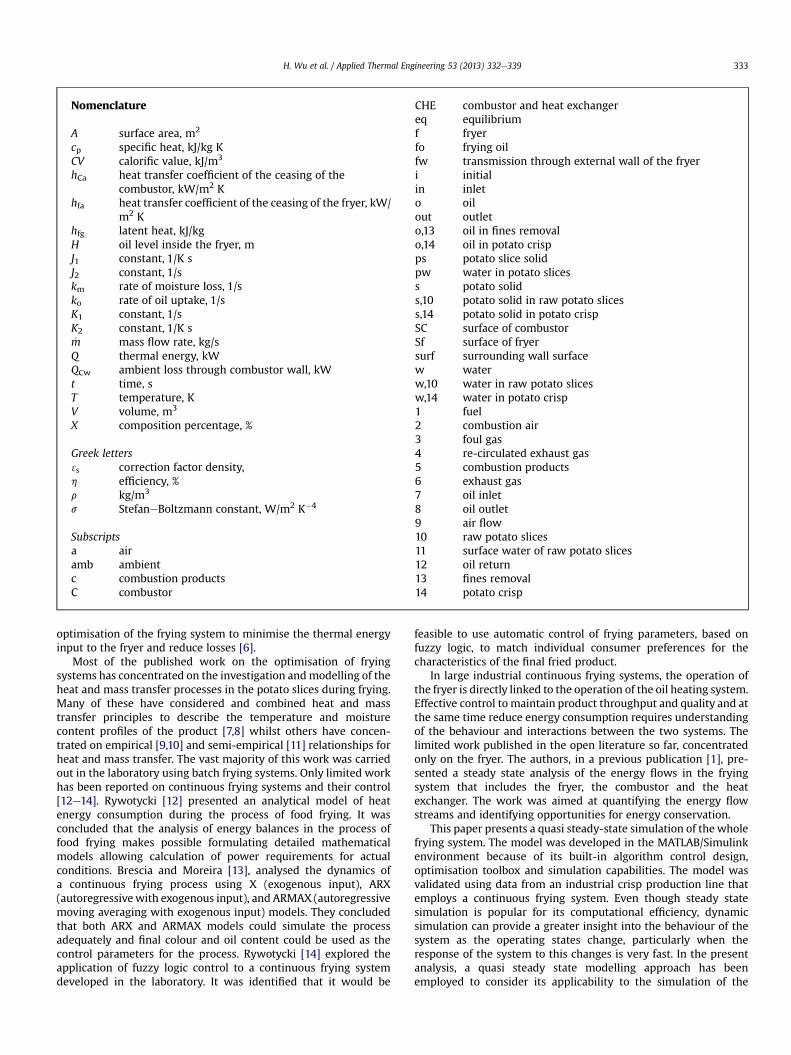
Nomenclature
A surface area, m2
cp specific heat, kJ/kg KCV calorific value, kJ/m3
hCa heat transfer coefficient of the ceasing of thecombustor, kW/m2 K
hfa heat transfer coefficient of the ceasing of the fryer, kW/m2 K
hfg latent heat, kJ/kgH oil level inside the fryer, mJ1 constant, 1/K sJ2 constant, 1/skm rate of moisture loss, 1/sko rate of oil uptake, 1/sK1 constant, 1/sK2 constant, 1/K s_m mass flow rate, kg/sQ thermal energy, kWQCw ambient loss through combustor wall, kWt time, sT temperature, KV volume, m3
X composition percentage, %
Greek letters3s correction factor density,h efficiency, %r kg/m3
s StefaneBoltzmann constant, W/m2 K�4
Subscriptsa airamb ambientc combustion productsC combustor
CHE combustor and heat exchangereq equilibriumf fryerfo frying oilfw transmission through external wall of the fryeri initialin inleto oilout outleto,13 oil in fines removalo,14 oil in potato crispps potato slice solidpw water in potato slicess potato solids,10 potato solid in raw potato slicess,14 potato solid in potato crispSC surface of combustorSf surface of fryersurf surrounding wall surfacew waterw,10 water in raw potato slicesw,14 water in potato crisp1 fuel2 combustion air3 foul gas4 re-circulated exhaust gas5 combustion products6 exhaust gas7 oil inlet8 oil outlet9 air flow10 raw potato slices11 surface water of raw potato slices12 oil return13 fines removal14 potato crisp
H. Wu et al. / Applied Thermal Engineering 53 (2013) 332e339 333
optimisation of the frying system to minimise the thermal energyinput to the fryer and reduce losses [6].
Most of the published work on the optimisation of fryingsystems has concentrated on the investigation andmodelling of theheat and mass transfer processes in the potato slices during frying.Many of these have considered and combined heat and masstransfer principles to describe the temperature and moisturecontent profiles of the product [7,8] whilst others have concen-trated on empirical [9,10] and semi-empirical [11] relationships forheat and mass transfer. The vast majority of this work was carriedout in the laboratory using batch frying systems. Only limited workhas been reported on continuous frying systems and their control[12e14]. Rywotycki [12] presented an analytical model of heatenergy consumption during the process of food frying. It wasconcluded that the analysis of energy balances in the process offood frying makes possible formulating detailed mathematicalmodels allowing calculation of power requirements for actualconditions. Brescia and Moreira [13], analysed the dynamics ofa continuous frying process using X (exogenous input), ARX(autoregressivewith exogenous input), and ARMAX (autoregressivemoving averaging with exogenous input) models. They concludedthat both ARX and ARMAX models could simulate the processadequately and final colour and oil content could be used as thecontrol parameters for the process. Rywotycki [14] explored theapplication of fuzzy logic control to a continuous frying systemdeveloped in the laboratory. It was identified that it would be
feasible to use automatic control of frying parameters, based onfuzzy logic, to match individual consumer preferences for thecharacteristics of the final fried product.
In large industrial continuous frying systems, the operation ofthe fryer is directly linked to the operation of the oil heating system.Effective control to maintain product throughput and quality and atthe same time reduce energy consumption requires understandingof the behaviour and interactions between the two systems. Thelimited work published in the open literature so far, concentratedonly on the fryer. The authors, in a previous publication [1], pre-sented a steady state analysis of the energy flows in the fryingsystem that includes the fryer, the combustor and the heatexchanger. The work was aimed at quantifying the energy flowstreams and identifying opportunities for energy conservation.
This paper presents a quasi steady-state simulation of the wholefrying system. The model was developed in the MATLAB/Simulinkenvironment because of its built-in algorithm control design,optimisation toolbox and simulation capabilities. The model wasvalidated using data from an industrial crisp production line thatemploys a continuous frying system. Even though steady statesimulation is popular for its computational efficiency, dynamicsimulation can provide a greater insight into the behaviour of thesystem as the operating states change, particularly when theresponse of the system to this changes is very fast. In the presentanalysis, a quasi steady state modelling approach has beenemployed to consider its applicability to the simulation of the
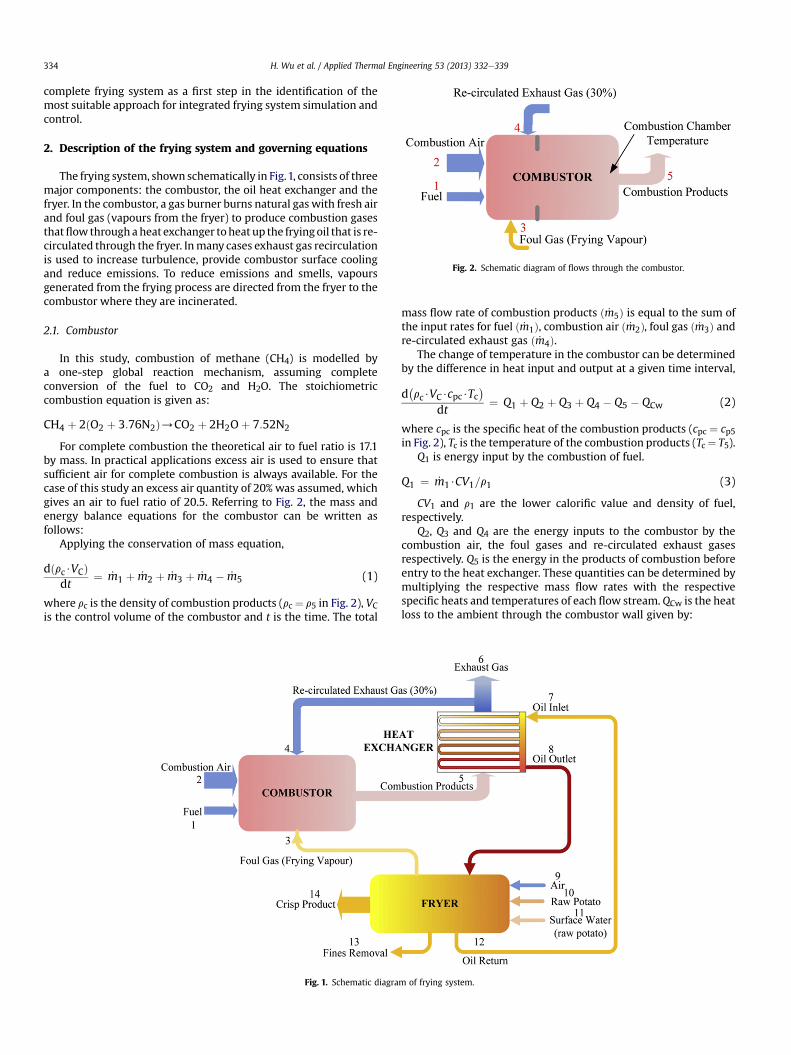
Fig. 2. Schematic diagram of flows through the combustor.
H. Wu et al. / Applied Thermal Engineering 53 (2013) 332e339334
complete frying system as a first step in the identification of themost suitable approach for integrated frying system simulation andcontrol.
2. Description of the frying system and governing equations
The frying system, shown schematically in Fig.1, consists of threemajor components: the combustor, the oil heat exchanger and thefryer. In the combustor, a gas burner burns natural gas with fresh airand foul gas (vapours from the fryer) to produce combustion gasesthatflow throughaheat exchanger toheat up the fryingoil that is re-circulated through the fryer. Inmany cases exhaust gas recirculationis used to increase turbulence, provide combustor surface coolingand reduce emissions. To reduce emissions and smells, vapoursgenerated from the frying process are directed from the fryer to thecombustor where they are incinerated.
2.1. Combustor
In this study, combustion of methane (CH4) is modelled bya one-step global reaction mechanism, assuming completeconversion of the fuel to CO2 and H2O. The stoichiometriccombustion equation is given as:
CH4 þ 2ðO2 þ 3:76N2Þ/CO2 þ 2H2Oþ 7:52N2
For complete combustion the theoretical air to fuel ratio is 17.1by mass. In practical applications excess air is used to ensure thatsufficient air for complete combustion is always available. For thecase of this study an excess air quantity of 20% was assumed, whichgives an air to fuel ratio of 20.5. Referring to Fig. 2, the mass andenergy balance equations for the combustor can be written asfollows:
Applying the conservation of mass equation,
dðrc$VCÞdt
¼ _m1 þ _m2 þ _m3 þ _m4 � _m5 (1)
where rc is the density of combustion products (rc ¼ r5 in Fig. 2), VCis the control volume of the combustor and t is the time. The total
Fig. 1. Schematic diagra
mass flow rate of combustion products ð _m5Þ is equal to the sum ofthe input rates for fuel ð _m1Þ, combustion air ð _m2Þ, foul gas ð _m3Þ andre-circulated exhaust gas ð _m4Þ.
The change of temperature in the combustor can be determinedby the difference in heat input and output at a given time interval,
d�rc$VC$cpc$Tc
�dt
¼ Q1 þ Q2 þ Q3 þ Q4 � Q5 � QCw (2)
where cpc is the specific heat of the combustion products (cpc ¼ cp5in Fig. 2), Tc is the temperature of the combustion products (Tc¼ T5).
Q1 is energy input by the combustion of fuel.
Q1 ¼ _m1$CV1=r1 (3)
CV1 and r1 are the lower calorific value and density of fuel,respectively.
Q2, Q3 and Q4 are the energy inputs to the combustor by thecombustion air, the foul gases and re-circulated exhaust gasesrespectively. Q5 is the energy in the products of combustion beforeentry to the heat exchanger. These quantities can be determined bymultiplying the respective mass flow rates with the respectivespecific heats and temperatures of each flow stream.QCw is the heatloss to the ambient through the combustor wall given by:
m of frying system.

Fig. 3. Schematic diagram of flow streams through the heat exchanger.
H. Wu et al. / Applied Thermal Engineering 53 (2013) 332e339 335
QCw ¼ hCa$ASC$ðTC � TambÞ þ 3sC$ASC$s$�T4C � T4surf
�(4)
where hCa is the convective heat transfer coefficient of the casing ofthe combustor, ASC is surface area of the combustor, TC is thetemperature of the external combustor wall, 3sC is the emissivity(dimensionless) of the combustor and s is the StefaneBoltzmannconstant (5.669 � 10�8 W/m2 K4). Tamb is the average ambienttemperature for the location at which the system under consider-ation operates and Tsurf is the temperature of the surrounding wallsurfaces. In this analysis Tamb and Tsurf were assumed to be 25 �Cand 15 �C respectively.
Substituting Eqs. (3) and (4), into Eq. (2) gives:
r5$VC$cp5dT5dt
¼ _m1$CV1=r1 þ _m2$cp2$T2 þ _m3$cp3$T3
þ _m4$cp4$T4 � _m5$cp5$T5
�hhC/a$ASC$ðTC � TambÞ
þ 3sC$ASC$s$�T4C � T4surf
�i(5)
2.2. Heat exchanger
Large industrial frying systems normally employ an indirect oilheating system where the oil is heated in a heat exchanger by theexhaust gases from the combustor. These heat exchangers arenormally of the cross-counter flow type and are designed tomaximise the heat transfer area whilst reducing the volume of oilcontained in the tubes and the temperature difference between theexhaust gases and the oil. The fluid flow streams in the heatexchanger are illustrated in Fig. 3.
Since the oil outlet temperature of the heat exchanger playsa key role on the determination of the heat supply to the fryer, it isimportant to predict this temperature with respect to the fuel flowrate and re-circulated exhaust gas.
Fig. 4. Schematic flow diagram of
Assuming a constant oil mass flow rate and specific heat, no heatlosses to the surroundings and applying the energy balance equa-tion to the heat exchanger gives:
Q ¼ _m5$cp5$ðT5 � T6Þ ¼ _m7$cpo$ðT8 � T7Þ (6)
where Q is the thermal duty of the heat exchanger and cpo is thespecific heat of oil.
According to Eq. (6), the oil outlet temperature at 8 can bedetermined from:
T8 ¼ _m5$cp5$ðT5 � T6Þ_m7$cp7
þ T7 (7)
The efficiency of the oil heating system (combined combustorand heat exchanger) can be calculated from:
hCHE ¼ _m7$cpo$ðT8 � T7Þ_m1$CV1r1
(8)
2.3. Fryer
Fig. 4 shows a schematic diagram of the fryer and themass flowsin and out of the system. Potato slices are fed into the fryer bya conveyor from the dewatering system which is designed toremove surface water from the slices, after the hot wash, beforefrying [1]. The potato slices are kept submerged in oil by paddles,which also control the flow of the slices through the fryer along thesame direction as the oil flow. The rotational speed of the paddlescan be changed to adjust the residence time of the slices in the fryerwhich, alongside other parameters, determines the final propertiesof the potato crisps exiting the fryer. The moisture content of thecrisps, measured on a wet basis is a control parameter that deter-mines the residence time in the fryer.
2.3.1. Energy conservation for oilApplying the energy balance equation to the oil in the fryer
gives:
ro$Vfo$cpodTfodt
¼ Q8þQ9�Q12�Q13�QpsþQpw�Qo;14�Qfw
(9)
where Tfo is the average oil temperature in the fryer, Q8 is the totalenergy input to the fryer by the frying oil, Q9 is the energy removedby theair entering the fryer andwithdrawnwith the foul gases,Q12 isthe energy lost through fines removal from the fryer, Q13 is theenergycarried awayby theoil return to theheat exchanger,Qps is theenergy needed for heating the raw potato slice during frying, Qpw isthe energy needed for heating and evaporation of the water
an industrial continuous fryer.

Table 1Parameters used to fit the moisture content and oil content in Eqs. (13) and (15).
Symbol Value Symbol Value
J1 0.001 K1 �0.14J2 �0.136 K2 9.8 � 10�4
H. Wu et al. / Applied Thermal Engineering 53 (2013) 332e339336
associatedwith the rawpotato, includingwater in the potato aswellas surface water on the potato slices, Qo,14 is the energy associatedwith the oil in the final crisp product, and Qfw is the thermal energylost through the external wall of the fryer to the environment:
Qfw ¼ hfa$ASf$�Tf � Tamb
�þ 3sf$ASf$s$
�T4f � T4surf
�(10)
where hfa is the convective heat transfer coefficient of the casing ofthe fryer, ASf is the surface area of the casing of the fryer, Tf is thetemperature of the fryer external wall, and 3sf is the emissivity.
Substituting Eq. (10) into Eq. (9), gives the variation of theaverage fryer oil temperature with time.
0
50
100
150
200
250
300
350
400
0
100
200
300
400
500
600
Fuel
flo
w r
ate
(m³/
hr)
Tem
pera
ture
(°C
)
CombustionchambertemperatureFuel flow rate
130
150
170
re (
°C)
Oil temperature at HX outletOil temperature at HX inlet
ro$cpo$Af$Hfo$dTfodt
¼ _m8$cpo$T8 � _m9$cpa$ðT3 � T9Þ � _m12$cpo$T12 � _mo;13$cpo$T13 � _ms;10$cps$ðT14 � T10Þ � _mo;14$cpo$T14
� �_mw;10 þ _mw;11 � _mw;14
�$hcpw$ðT3 � T10Þ þ hfgw
i�hhf/a$ASf$
�Tf � Tamb
�þ 3sf$ASf$s$
�T4f � T4surf
�i(11)
The final moisture and oil content of the crisps can be deter-mined either from detailed transient modelling of the heat andmass transfer processes during frying [15,16], or from empiricalrelationships established from experimental investigations [17,18].The latter approach has been employed in this paper. The generalform of the relationships proposed by Krokida et al. [18] and givenin Eqs. (12) and (14) has been used but with the indices adjusted tofit data from the frying plant considered in this investigation.
The moisture content of the crisp for a frying time, t, can bedetermined as a function of the initial moisture content of thepotato, the equilibriummoisture content at an ‘infinite’ frying time,Xw,eq, and the rate of moisture loss during the process, km, whichcan be expressed as a function of average frying temperature [18].
Xw;14 ¼ Xw;eq þ�Xw;i � Xw;eq
�$e�km$t (12)
where,
km ¼ J1$Tfo � J2 (13)
The oil content of the crisp for a frying time, t, can be determinedas a function of the equilibrium oil content at an ‘infinite’ fryingtime, Xo,eq, and the rate of oil uptake, ko, which can also beexpressed as a function of frying temperature [18].
Xo;13 ¼ Xo;eq ��1:0� e�ko$t
�(14)
where,
ko ¼ K1 þ K2$Tfo (15)
The constants J1, J2 and K1, K2 obtained from the test data and aregiven in Table 1.
To generalise themodelling approach the authors are now in theprocess of developing a 2-Dimensional model of the frying systemthat should lead tomore accurate representation of the process andrelationships between the variables.
70
90
110
0 10 20 30 40 50 60 70 80 90 100
Tem
pera
tu
Processing time (min)
Stack temperatureFoul gas temperature
Fig. 5. Variation of combustion and heat exchanger parameters from a real continuousfrying system.
3. Data from a frying system
The data used in this study were obtained from a real contin-uous frying system. The average throughput from the fryer wasapproximately 0.28 kg/s of crisps for an input of 1.1 kg/s of rawpotatoes and average gas energy input to the combustor of around2600 kW. The key control parameters in a continuous crisp fryer arethe final moisture content of the crisps which is desired to be in the
range between 1% and 2% by mass on a wet basis, the temperatureof the frying oil and the resulting oil content by mass, in the range30%e40% on a wet basis.
Steady state parameters for the fryer and the variation of theseparameters during a 45 min period during which the flow of potato
slices to the fryer is switched off are shown in Figs. 5 and 6. Fig. 5shows the variation of combustion and heat exchanger parame-ters. It can be seen that during steady state operation the fuel flowrate is around 280 m3/h, and the temperature of the combustorbefore the heat exchanger is 510 �C. The heat exchanger inlettemperature is 155 �C the outlet temperature 174 �C and the stacktemperature 168 �C. The foul gas temperature is around 107 �C. Onstoppage of the flow of potato slices to the fryer, the combustorburner is switched to 20% fuel flow rate (80% turndown) and thisreduces the combustor temperature to around 200 �C. The oil flowto the fryer is maintained constant and the absence of load on thefryer equalizes the oil temperature in the system to around 168 �C.This temperature remains fairly constant during the nonfryingperiod which indicates that the energy input to the system duringthis period is approximately equal to the losses from the system.
On restart of the frying process, the fuel flow initially increasesfrom 20% to 50% which causes the combustor temperature and the

0
5
10
15
20
25
30
35
40
45
0
1
2
3
4
5
6
0 10 20 30 40 50 60 70 80 90 100
Oil
con
tent
(%
)
Moi
stur
e co
nten
t (%
)
Processing time (min)
Moisture content
Oil content
Fig. 6. Variation of moisture content and oil content of potato crisps in a realcontinuous frying system.
150
200
250
300
350
400
450
500
550
600
58 63 68 73 78 83
Com
bust
ion
cham
ber
tem
pera
ture
(°C
)
Processing time (min)
Simulated combustionchamber temperature
Plant combustionchamber temperature
Fig. 8. Comparison of actual and predicted combustor temperature.
H. Wu et al. / Applied Thermal Engineering 53 (2013) 332e339 337
oil temperatures in the system to increase, reaching the oil flow set-point of 174 �C very quickly. This causes a reduction in the fuel flowrate back down to 20% before the potato slices begin to flow into thefryer again. This causes the oil temperature to drop initially andthen rises again as the fuel flow rate increases to maximum and thesystem reaches steady state.
Fig. 6 shows the resulting variation of the moisture contentand oil content of the potato crisps during the same time period.The moisture and oil content were measured with a NIR (NearInfrared Reflection) gauge which is a well-established method ofon-line measurement for monitoring and control in the snacksindustry. A PID control system uses these values to control theflow of potato slices through the fryer (the paddle, hold downand take out speeds), to maintain the final moisture content ofthe crisps at around 1.5% and oil content at around 35%. Beforefrying stopped, the moisture content of the potato crisps was 1.7%and the oil content 32%. The potato slices stopped flowing to thefryer at around minute 20 in the cycle at which time the moisturecontent of the crisps began to fall and the oil content rise. Atminute 27 all crisps exited the fryer with both the moisture andoil content reading zero. The restart of frying sees both themoisture and oil content rise to their steady state values withina couple of minutes.
Fig. 7. Schematic block diagram of fr
4. Model implementation and discussion
The model of the frying system was implemented in the MAT-LAB/Simulink environment, version R2009a. MATLAB/Simulinkwas selected because of its general-purpose nature and its exten-sive use by the thermal modelling and control community [19,20].Fig. 7 shows a representation of the inputs and outputs from themodel. The inputs to the open loop-model, apart from thegeometric and thermo-physical characteristics of the frying system,as well as other design and operating parameters such as oil flowrate, are the raw potatomass flow to the fryer and the fuel flow rateto the combustor. Main model outputs are the moisture and oilcontent of the crisps on awet basis as well as operating parametersat different points in the system.
Fig. 8 shows a comparison between the simulated and actualtemperature of the combustor at the restart of the frying process,minute 63 in Fig. 5. It can be seen that the model predicts the actualcombustor temperature before the oil heat exchanger quite well.Small differences can be due to a number of factors, including theassumption of constant potato slice flow rate and moisture andsurface water content at the start of frying. In reality there will besome variation in these parameters which will have some influencein both the quantity of foul gas which is an input to the combustor
ying system model in Simulink.

0
5
10
15
20
25
30
35
40
45
0
1
2
3
4
5
6
58 63 68 73 78 83
Oil
con
tent
(%
)
Moi
stur
e co
nten
t (%
)
Processing time (min)
Simulated moisturecontentPlant moisture content
Simulated oil content
Plant oil content
Fig. 9. Comparison of actual and predicted crisps moisture and oil content.
200
220
240
260
280
300
320
340
Fuel
flo
w r
ate
(m³/
hr)
Plant fuel flow rateLower limit of fuel flow rateUpper limit of fuel flow rate
0
1
2
3
4
5
6
0 30 60 90
Moi
stur
e co
nten
t (%
)
Processing ti
Plant moisture contentUpper limit of moisture contentLower limit of oil content
Fig. 10. Variation of combustor fuel flow rate and mo
H. Wu et al. / Applied Thermal Engineering 53 (2013) 332e339338
model as well as the properties of the final product. In this simu-lation the actual fuel flow rate is an input to the model and hencethe fluctuations in the combustor temperature mirror the fluctua-tions in the fuel flow rate.
Fig. 9 shows a comparison between the simulated and actualmoisture and oil content during the restart of frying. It can be seenthat again the model predicts the average moisture and oil contentof the crisps quite well. The simulation results do not show fluc-tuations in the two crisp properties because the model, at thisstage, does not incorporate the PID control used in the real system.
The variation of the fuel flow rate and the resulting oil andmoisture content of the crisps during a 3 h period of continuousoperation of the fryer is shown in Fig. 10. It can be seen that atsteady state conditions, the fuel flow rate fluctuates in the rangebetween 240 m3/h and 310 m3/h, the moisture content between1.2% and 2.2% by mass on a wet basis, and the oil content between31% and 37% bymass. The variation in the fuel flow rate is a result ofthe control of the oil temperature entering the fryer tomaintain themoisture and oil content of the crisps within desirable limits. Theselimits, also shown in Fig. 10, are between 1.2% and 2.2% by mass on
10
15
20
25
30
35
40
120 150 180
Oil
cont
ent (
%)
me (min)
Lower limit of moisture contentPlant oil contentUpper limit of oil content
isture and oil content at steady state conditions.

0
5
10
15
20
25
30
35
40
0
1
2
3
4
5
6
58 61 64 67 70 73 76 79 82 85 88 91 94 97 100 103 106
Oil
cont
ent (
%)
Moi
stur
e co
nten
t (%
)
Processing time (min)
Fuel flow rate (260 m³/hr)
Fuel flow rate (320 m³/hr)
Plant moisture content
Plant oil content
Fig. 11. Variation of moisture and oil content with time and impact of step changes tocombustor fuel flow rate.
H. Wu et al. / Applied Thermal Engineering 53 (2013) 332e339 339
a wet basis for the moisture content and between 30% and 37% bymass for oil content.
Fig. 11 shows the changes in the moisture and oil contentresulting from a step increase in the fuel flow rate from 290m3/h to320 m3/h and a step decrease from 290 m3/h to 260 m3/h respec-tively, predicted by the model. It can be seen that operation withinthe range of fuel flow rate of �30 m3/h results in moisture and oilcontent within the acceptable range for the process achieved by theplant as shown in Fig. 10. The predictions do not show any fluctu-ations because the impact of controls has not been included in thesimulation at this stage. Never the less, they demonstrate thata more stable control system operating with a much narrowerdead-band, will be able to achieve energy savings whilst main-taining the properties of the final product within the desired limits.In the case of this example, a 30m3/h reduction in the fuel flow ratefrom 290 m3/h to 260 m3/h will produce a 10% reduction in energyconsumption, whilst maintaining the crisp oil content at 36% andthe moisture content at 1.6%. Of course, with any control system,however sophisticated, some perturbations will be introduced, buteven with these it is reasonable to assume that at least 5% energysavings will be possible. Futurework will focus on the developmentand testing of more advanced control techniques and demonstratetheir potential to achieve better product consistency a well asenergy savings.
5. Conclusions
A quasi steady state model has been developed for the simula-tion of the behaviour of a continuous frying system. The modelwhich includes sub-models of the 3 major components, thecombustor, heat exchanger and fryer was developed in the MAT-LAB/Simulink environment to facilitate investigation of the impactof design and control parameters on the energy consumption of thesystem.
For simplicity, and as a first approximation, a number ofassumptions were made such as to ignore the thermal mass of thewalls of the combustor, the fryer and the heat exchanger. This wasjustified from the very fast response of the actual system to changesin operating conditions.
The results show that the model can accurately represent theoverall behaviour of an industrial frying system and the processes
occurring in the major components of the system. The dynamicsimulation provides insights into the sensitivity of the response ofthe main variables of the process to perturbations in the systemwhich occur frequently in commercial frying lines. It is alsoshown that better control of the combustion fuel flow rate inresponse to final product parameters such as moisture contentand oil content can produce energy savings of the order ofbetween 5% and 10%. This information will be useful in theinvestigation of controls that can reduce control perturbationsand energy consumption.
Acknowledgements
The authors would like to acknowledge the financial supportfrom the RCUK’s Energy Programme and contributions from theindustrial partners and academic collaborators from the Universi-ties of Newcastle and Northumbria. The Energy Programme isa Research Councils UK cross council initiative led by EPSRC andcontributed to by ESRC, NERC, BBSRC and STFC.
References
[1] HM Government, Department of Environment Food and Rural Affairs (Defra)Food 2030 strategy, January, 81 pp. (2010) http://www.defra.gov.uk/foodfarm/food/pdf/food2030strategy.pdf
[2] FDF (Food and Drink Federation), Defra Public Consultation on Draft FoodIndustry Sustainability Strategy Overall Comments, 6 pp. (2006) https://www.fdf.org.uk/responses/CCWG-031-10.pdf
[3] M. Nicolaou, Control of snack food manufacturing systems, IEEE Control Syst.Magazine 26 (2006) 40e53.
[4] Crisps and Salty Snacks-UK-January 2011, Mintel Oxygen. http://oxygen.mintel.com/sinatra/oxygen/display/id¼562362.
[5] H. Wu, H. Jouhara, S.A. Tassou, T.G. Karayiannis, Modelling of energy flows inpotato crisp frying processes, Appl. Energy 89 (2012) 81e88.
[6] European Snack Food Association. http://www.esa.org.uk/europe_statistics.php (accessed 26, 2011).
[7] B.E. Farkas, Modelling Immersion Frying as a Moving Boundary Problem, Ph.D.Thesis, Davis, USA, University of California, 1994.
[8] R.G. Moreira, J. Palau, X. Sun, Deep-fat frying of tortilla chips: an engineeringapproach, Food Tech. 49 (1995) 146e150.
[9] M.H. Gamble, P. Rice, J.D. Selman, Relationship between oil uptake andmoisture loss during frying of potato slices from c.v. record U.K. tubers, Int. J.Food Sci. Tech. 22 (1987) 233e241.
[10] P. Rice, M.H. Gamble, Technical note: modelling moisture loss during potatoslice frying, Int. J. Food Sci. Tech. 24 (1989) 183e187.
[11] N. Mittelman, S. Mizrahi, Z. Berk, Heat and mass transfer in frying (Chapter 2),in: B.M. McKenna (Ed.), Engineering and Food, Elsevier Applied SciencePublishers, 1984.
[12] R. Rywotycki, A model of heat energy consumption during frying of food,J. Food Eng. 59 (2003) 343e347.
[13] L. Brescia, R.G. Moreira, Modelling and control of continuous frying process:a simulation study. Part 1: dynamic analysis and system identification, FoodBioprod. Process. 75 (1997) 3e11.
[14] R. Rywotycki, Food frying control system, J. Food Eng. 59 (2003) 339e342.[15] R. Yamsaengsung, R.G. Moreira, Modeling the transport phenomena and
structural changes during deep fat frying part I: model development, J. FoodEng. 53 (2002) 1e10.
[16] R. Yamsaengsung, R.G. Moreira, Modeling the transport phenomena andstructural changes during deep fat frying part II: model solution & validation,J. Food Eng. 53 (2002) 11e25.
[17] B. Baumann, F. Escher, Mass and heat transfer during deep-fat frying of potatoslicesd I. Rate of drying and oil uptake, Lebensm.-Wiss. U.-Technol. 28 (1995)395e403.
[18] M.K. Krokida, V. Oreopoulou, Z.B. Maroulis, Water loss and oil uptake asa function of frying time, J. Food Eng. 44 (2000) 39e46.
[19] P. Nevriva, S. Ozana, M. Pies, Simulation of power plant superheater usingadvanced simulink capabilities, Int. J. Circuits Syst. Signal. Process. 5 (2010)86e93.
[20] A. Haryanto, K.S. Hong, Modeling and simulation of an oxy-fuel combustionboiler system with flue gas recirculation, Comput. Chem. Eng. 35 (2011)25e40.