analysis - defense technical information center · * analysis procedures ' "dtic ielecte...
TRANSCRIPT

US Army Corpsof EngineersErgneer kwtute forWater Resources
AD-A 1 6 0 076
BusinessDepth-Damage
* AnalysisProcedures
' "DTICIELECTE
OC* 1985J
September 1985 Research Report 85-R-5ThI" docunt hasi been apwa~rdow!p", cru=,onh o* m_1. 85 10 10 025
[==d .= - ,= . L .. *

[. .
UNCLASSIFIEDSECURITY CLASSIFICATION OF THIS PAGE (When Dole Entered)
READ INSTRUCTIONSREPORT DOCUMENTATION PAGE BEFORE COMPLETING FORMI. REPORT NUMBER 2. GOVT ACCESSION NO. 3. RECIPIENT'S CATALOG NUMBER
Research Report 85-R-5
4. TITLE (mad Subtitle) 5. TYPE OF REPORT & PERIOD COVERED
Business Depth-Damage Analysis Procedures
6. PERFORMING ORG. REPORT NUMBER
85-R-57. AUTHOR(s) 8. CONTRACT OR GRANT NUMBER(&)
• "Stuart A. Davis
* 9. PERFORMING ORGANIZATION NAME AND ADDRESS 10. PROGRAM ELEMENT. PROJECT, TASKAREA & WORK UNIT NUMBERS
Water Resources Support Center
Institute for Water ResourcesCasey Building, Ft. Belvoir, VA 22060-5586
11. CONTROLLING OFFICE NAME AND ADDRESS 12.. REPORT DATE
Water Resources Support Center September 1985Institute for Water Resources 13. NUMBEROF PAGES
Casey Building, Ft. Belvoir, VA 22060-558614. MONITORING AGENCY NAME & 1ODDRESS(If different from Controlling Office) 1S. SECURITY CLASS. (of this report)
UnlcassifiedIS.. DECLASSIFICATION/DOWNGRADING
SCHEDULE
16. DISTRIBUTION STATEMENT (of thie Report)
Approved for public release; unlimited
17. DISTRIBUTION STATEMENT (of the abstract entered In Block 20, If different from Report)
IS. SUPPLEMENTARY NOTES
19. KEY WORDS (Continue on reverse side if necessary mad Identify by block number)
Water resource economics, flood control, flood plain management, flood damagealleviation, depth-damage functions, business flooding, cost-benefit analysis
20. AB5"R ACT ( amthmwe a reves ab Itf nawaey ai identify" by block number)
This report reviews procedures used by Corps of Engineers and other agenciesfor applying flood depth-damage functions used primarily in tenefits-cost analysis.Tools and data sources for computation and application are given. Areas forfurther research and information transfer are defined.
DD Iol 147 EDTI0 OF NOV 65 IS OSOLETE UNCLASSIFIED
SECURITY CLASSIFICATION OP THIS PAGE (Pen Date Entered)
l" .'..'.. . " ". ...• -'- % o .' ''-.-.'.'-•'-'..' ". ".•'.-o o •, % .. " .'.o.... ...... .. , ,.°... ... . . .. o........ ... • .

BUSINESS DEPTH--DAMAGE ANALYSIS PROCEDURES
by
Stuart A. Davis
Institute for Water ResourcesWater Resources Support Center
U.S. Army Corps of Engineers
Ft. Belvoir, Virginia 22060-5586
Aecesslon For
NTIS t A[DTIC TA:H
UBy _ _ V40Y
~Availabilit, CodesDst r bulAvlil an~d/or
Dist Specl
September 1985 Research Report -85-R-5

TABLE OF CONTENTS
Page
Introduction 1
The Depth-Damage Function
Computation of Depth-Damage Relationships 7
Regulation and Guidance 11
Special Problems in Analysis of Business Property 15
Procedures for Business Depth-Damage Analysis 19
Tools for Analysis 25
- District Depth-Damage Evaluation Procedures 31
Sources of Information Outside the Corps of Engineers 43
Comparison of District Depth-Damage Functions 45
General Access Data Base of Business Flood Damagesand Depth-Damage Functions 47
- Conclusions & Recommendations 49
Bibliography 55
* Appendix A Flood Damage Function Comparisons 59
Appendix B Apartment, Commercial and Industrial, Government, 73.Transportation, and Utilities Flood Damage Questionnaire
' Appendix C Building Collapse Curves 95
V
-.. . . .
-q ", '- 'Q'=' ; "- '-, •"o - ",- -- - ,qi b- .*".t*-*" * " , * . * .° •-"- •. " . .* s * *

INTRODUCTION
*Purpose
% )This research is a comprehensive examination of business depth-damage analysis
in the United States. Previous research on business depth damage is detailed,but limited to specific geographic areas within individual Corps of Engineerdistricts. This study describes and compares these efforts. It describesparameters that significantly affect depth-damage relationships and develops aframework for predicting incidence of business flood damages.
Time, money and personnel constraints make flood damage surveys difficult forindividual districts to conduct. This study is intended to help districteconomists by describing the process, comparing methods and contrasting thedepth-damage function measurement criteria in use by various districts. Theinformation in this report can be used to find sources that verify consistencyand accuracy of damage functions and provide references for derivingmathematical functions.
This report is primarily intended for economists responsible for the economicevaluation of flood control measures. The survey of procedures described hereshould broaden the choices for appropriate procedures for evaluating businessdepth-damage relationships. Planners and hydrologists should gain theknowledge and understanding of the process and considerations economists mustmake in establishing or choosing, and applying these relationships, which arecentral to estimating flood damage. /[ - -
VIP" scope of AStudy
This research examines methods used to assess flood damage to commercial,industrial, and institutional property. Information sources within andwithout the Corps, including flood damage estimation tools, data bases, anddamage function measurements now in use have been analyzed. Procedures forestimating commercial and industrial damages and attitudes of districteconomists toward further work in this area are assessed.
Contributions came from each Corps of Engineer district office and two
divisions offices, the Small Business Administration (SBA), Federal InsuranceAdministration (FIA), and Soil Conservation Service (SCS). A literaturesearch included many district reports of flood damage computation.
Flood damage estimating procedures are summarized and compared by region. Bycomparing damage functions for a limited number of enterprises, the reader canfind wide variations that occur between the districts.
" 1

THE DEPTH-DAMAGE FUNCTION
A typical depth-damage function could take the following form:
Y - a + bX + cX2 + dX3 + U
where "Y" is the dependent variable representing percent damage to structureor content. "a" is a constant representing the percent damage at the firstfloor level, "x" is a variable representing various powers of water height.Each new power is an inflection point where there is a change in the directionof the curve; "b", "c", and "d" are coefficients representing the relativeimportance of each power of water height to the regression. Any number ofvariables with appropriate coefficients can be added to the regression as longas each new variable is significant and is not too highly coorelated withother independent variables.
"U" represents a random disturbance. The random disturbance includes bothpositive and negative deviations from the regression line. One cause of this
*disturbance is sampling error. The sample may be biased towards a particulargroup in the population. A second type of error is in specification. Thiscan be due to omitting variables, adding variables that do not belong, or byhaving the incorrect mathematical format of the equation (i.e., the correct
. powers of variables should be specified, or the equation sometimes should bein a logarithmic form.) Finally, there are errors of measurement. Theseerrors may have occurred while surveying, coding, or rounding. The errorsdescribed above can never be completely eliminated. Whenever regressionanalysis is used, it is necessary to apply some judgement in screening thedata and interpreting the results. Post-flood data is not often plentiful forwater heights outside the range of minus 4 to 5 feet above the first floor.
* When the data is sparse, little can be done except make an educated judgementof the likely damage. Screening is also necessary to eliminate extreme valuesthat seem to have no basis in reality.
It should be noted that there are alternatives to regression analysis indetermining the depth-damage relationship. Depth-damage curves can bedetermined by simply making a breakdown between water height and percentdamage. Curves may be drawn using scattergrams of other curve-fittingtechniques. These methods, however, are limited to one explanatory variable.These methods also do not give the t statistic for testing the significance ofeach variable. Also, they do not give confidence intervals for determiningthe range of values. The true value of a population is likely to fall withina confidence interval for a given probability. Finally, only regressionanalysis gives the R squared statistic, coefficient of determination, whichshows the percentage of variance in the curve that is explained by theexogenous variable.
PREVIOUS PAGE
3 IS BLANK
.Sj . . . .- ..... . . . . . . .

Use of Depth-Damage Functions
Whenever depth-damage relationships are computed, it is initially presumedthat there is a reliable correlation between depth of water in businesses orpublic buildings and the percentage of flood loss to the value of thebuilding's contents and structure. Predictable depth-damage relationships canbe used to estimate the amount of damage from any given level of flooding, andconsequently, assess the benefits of flood damage alleviation. There areseveral business depth-damage relationships now in use throughout the Corps ofEngineers. These procedures developed from the special needs of eachdistrict, with relationships varying with geography and particularly with thetype of flood which was typical of each region.
Depth-damage functions are used to compute the probable damage from a givenlevel of flooding. Depth-damage functions are computed separately fromstructure and content for various categories of enterprise. The functions are
predictors of either direct-dollar loss or percent value lost through a floodevent. Damage functions can be applied to structures on an individual basis.The use of depth damage functions can be further illustrated by several graphs(Figures 1-4) that show how damages are determined by frequency for eachreach. Figure 1 is the elevation-frequency curve, which tells us thefrequency of flooding for each elevation. The graph indicates the percentchance of each elevation being inundated in any given year. Field surveys arethen used to determine the value of property for each elevation. Value shouldbe determined for each structure type and type of business for both structureand contents. Depth-damage functions are then applied to determine thepotential damage for each elevation. This information is then combined withthe elevation-frequency functions to establish a damage/frequency curve. Formost districts, calculations are now performed using one of the computerprograms described later in this report.
,4
4

.I
Cc
0 w
Fiur I.iur3
* Q,
kl~ VoL
FeInnainFrequency(Aoeo eo is l)(Percent Chance of ccurring n Particular Year) CuuaieVleoaFodPoePoet
Figure 1 Figure 2
!:1
COMPUTATION OF DEPTH-DAMAGE RELATIONSHIPS
Depth-damage relationships can be computed by a regression equation with thepercent-damage to structure or percent-damage to content as the dependentvariable. Water height is the most important, and can be the only independentvariable, in the regression. Water height accounts for the greatest variation
*in the percent damage-equation. Other variables that may be important in theregression are type of construction material, structure, age and condition ofthe building, square-footage; and velocity, sedimentation, salinity, andduration of the flood waters. However, except for structure type, these
* variables have seldom been isolated for any flood damage analysis in theUnited States. Sometimes structural and content-damage are computed as acombined total. Business inventory damages are often computed separately fromdamage to equipment and other fixtures.
For residential damage analysis, depth-damage computations are computedseparately by structure-type. Structure-type categories are determined by thenumber of stories, and whether or not there is a basement. Basements areanother factor. For commercial and industrial areas, depth-damage functionsare computed for each type of business or activity. The business types can bebroken-down by two, three, four, or even five-digit Standard IndustrialClassification (SIC) codes or a rough equivalent of SIC codes that groupsbusinesses with homogeneous damage relationships.
Actual dollar damage can be computed as an alternate percent-damagerelationship. Where actual dollar loss is used as the independent variable,the price level needs to be adjusted by the time elapsed from the time andplace of computation to application. A price index should be selectedcarefully. A useful national index would be the Department of CommerceComposite Construction Index, published monthly in the Survey of CurrentBusiness. Marshall and Swift Inc., the Boeck Company, and the American
*. Appraisal Company all publish regional construction cost indexes. Forexample, if Vicksburg District wanted to make use of flood dollar damagecurves for New Orleans in 1977, it would need to adjust the price level to itsstudy area for 1983.
Categories of Building Structure
Residential damage functions are generally divided into seven categories, asmodeled after the Federal Insurance Administration's original work: singlestory with and without basement, two or more stories with and withoutbasement, split level with and without basement, and mobile homes.Significantly different damage relationships have been identified for allthese categories. There is no reason to suspect that non-residential propertycannot be divided into similar categories; although non-residential propertymay differ in the proportion of structures having basements, there may be aconsiderable proportion of business property more than two stories high, andthere are very few non-residential properties occupying mobile homes.Similarly, separate damage functions can be established for constructionmaterial. For example, Mobile District's damage functions for the Pearl Riverinclude brick and block, wood, and metal structures, single and multiplestories.
7
pREvIOUS PAGE
S 'S :8LA N K
%-. - ." - - -.
-- .:.- .- , ,

Any category can be added to this list where there is a significant populationof structures and a predictable relationship can be established for thestructure type.
Critical Variables Affecting Business Daage Functions
Business depth-damage relationships are influenced by a number of variables.If variables are tested and found to be significant, they can be used tocompute more reliable depth-damage relationships. Type of business andrelative size of the structure are critical to any business-damage functions.Many types of commercial businesses - such as clothing and liquor stores -share structural damage curves but have different content curves. At the sametime, a library and a bookstore might share the same content damage functions.
Size is a significant variable. Depth-damage relationships for a small foodstore may vary more from a large supermarket than a small pharmacy. Eachbusiness damage relationship should distinguish between small, medium, andlarge businesses.
Other important variables directly affecting structure damage includeconstruction material, age and condition of the buildings. These arevariables that have received little attention in the United States. However,Penning-Rowsell and Chatterton (see Bibliography) have isolated some of thesefactors and built them into separate depth-damage functions at least forresidential property. The homogeneity of the flood occurrence in GreatBritain, in contrast to the great variety in the nature of flooding in theUnited States, makes it easier to isolate the non-hydraulic factors thataccount for variability in the depth-damage relationship.
The following is a table of factors: hydrologic, structural andinstitutional, that significantly effect the extent of damage from a givenflood elevation. People involved in flood damage assessment are probablyaware of most of these factors. However, with a few exceptions, these factorshave never been given close analysis in terms of quantifying the effect that
*these factors actually have. Development of coefficients for these factors,or separate damage functions, would be an extremely expensive task. Even ifthe effects of these factors could be measured, they may not always beconsistent enough for general application. That is something we have littledata on; it still needs to be tested. Until such time when the effect ofthese factors can be adequately quantified, it is important to be aware ofthem, their direction, and relative magnitude. They can prove useful inselecting the most appropriate functions to apply in judging the validity ofsurvey data.
8
.. .-... . . . ..... . .. ' . . . . •-,-, ... i / m i i i m u n m

".1
Table 1Variables in the Depth-Damage Relationship
VARIABLE EFFECTS
Hydrologic Variables
velocity Velocity is a minor factor aggrevating structure andcontent damage. It limits time for emergency floodproofing and evacuation. Additional force createsgreater danger of foundation collapse and forcefuldestruction of contents.
duration Duration may be the most significant factor in thedestruction of building fabric. Continued saturationwill cause wood to warp and rot, tile to buckle, andmetal objects and mechanical equipment to rust.
sediment Sediment can be particularly damaging to the workingsof mechanical equipment and in creating cleanupproblems.
frequency Repeated saturations can have a cumulative effect onthe deterioration of building fabric and the workingof mechanical equipment. However, people exposed tomore frequent flood situations may be more likely torespond to flood emergency warnings.
Structural Variables
building material Steel frame and brick buildings tend to be moredurable in withstanding inundation and lesssusceptible to collapse than other material.
inside construction Styrofoam and similar types of insulation are lesssusceptible to damage than fiberglass and woolfiberinsulation. Most drywall and any plaster will crumbleunder prolonged inundation. Waterproof drywall willhold up for long floods. Paneling may be salvageablewhen other wall coverings are not.
condition Even the best building materials can collapse understress if the construction is poor or the condition isbad. Building condition should be a major determinateof depreciated replacement value.
age Age may not be a highly significant factor in itself,except that it may serve as an indicator of conditionand building material. It would be more accurate tosurvey the other factors separately.
9
," , i- - -, , ° , " , ' .-......... ".... "......'.".".."."..."."'""""."."'"."'."""......."""."..._-.-.'. ...- ....-.

P Table 1 (con't)
arrangement of Content location is an important factor in determiningcontents depth-damage relationships. These relationships could
be expected to be somewhat homogenous for commercialbusiness, particularly chain stores. Industrialproperty should be surveyed individually to determinehow the arrangement of contents will affect thedepth-damage relationship.
Institutional Factors
flood warning Major redu-tions in both content and structural losscan be made through flood fighting and evacuationactivities when there is adequate warning.
10

REGULATION AND GUIDANCE
The Federal directive on flood reduction benefit calculation is found in theWater Resource Council's Economic and Environmental Principles and Guidelinesfor Water and Related Land Resource Implementation, approved by the President,3 February 1983. The Principles and Guidelines (P & G) are intended to serveas guidance and not as specific or stringent planning evaluation requirements.Corps' district offices have latitude in the planning and evaluationprocedures as long as the general guidelines are followed.
The procedures in the P & G most relevant to business flood damage analysis
are as follows:
STEP ONE: DELINEATE AFFECTED AREA
The affected area is broadly defined as the entire metropolitan area whenindustrial property is involved. Otherwise, the affected area is confined tothe floodplain and nearby areas considered as alternative sites for theactivity that would use the floodplain, if protected.
STEP TWO: DETERMINE FLOODPLAIN CHARACTERISTICS
The floodplain should be surveyed to determine all relevant hydrologic,environmental, and economic characteristics. In addition to defining theactual flood boundaries, the likely depth, duration, and debris loads of thestream should be defined. Transportation and utilities are important for theeconomist to define in predicting potential damage. Most important is aninventory of existing activities that defines activity type (land use), valueand age of structure in the floodplain, and more generally, the density peracre of each type of development.
STEP THREE: PROJECT ACTIVITIES IN AFFECTED AREA
Forecasting should begin with a look at existing demographic and economicprojections. The P & G emphasize that new projections may depend on how planscan affect potential uses of the floodplain and the sensitivity of the plan toprojections. Local officials should be consulted, in any case, to verifyhistorical trends.
STEP FOUR: ESTIMATE POTENTIAL LAND USE
In this stage, estimates of land use potential are examined at a level ofdetail that is consistent with project needs.
STEP FIVE: PROJECT LAND USE
Land use projections should be made for both with and without projectconditions. The characteristics of the land with and without the projectshould be compared with those characteristics sought by potential users.Floodplain use should only be identified cases where there is significanteconomic advantage, and that advantage is significant enough to justify theflood control plans.
11
d " ... .=. . . ., . . ,* .. - * . ~. . . . . ,*" ". . .

STEP SIX: DETERMINE EXISTING FLOOD DAMAGES
The P & G stress the need to scrutinize historical flood data and to obtainup-to-date property appraisals. They encourage using area-specificdepth-damage information. However, t'ley also recognize the possibledeficiencies of historical records due either to changes in hydraulicconditions, new development or lack of flood experience. Damages by activitycan be estimated using "integration techniques and computer programs thatrelate hydrologic flood variables such as discharge and stage to damages andto the probability of occurrence of such variables." Previous Corps'Engineering Regulations did not specifically endorse the use of standarddepth-damage relationships. But in practice, OCE and the Board of Engineersfor Rivers and Harbors (BERH) encourage use of well-substantiated standarddepth-damage functions, even if the functions are generic national curves orrelationships developed for another area of the country.
STEP SEVEN: PROJECT FUTURE FLOOD DAMAGES
The P & G require a complete explanation of the projected flood damage forprojects that are no'- economically justified on the basis of existingconditions, or where projected benefits may significantly alter the costallocation for cost-sharing arrangements. Otherwise, the description of thefuture benefits can be abbreviated. The P & G further describe how future
* benefit evaluation must depend on estimating the number, size, value, andsusceptibility of future units.
An increase in the value of residential contents can be expected from floodprotection. An increase in income level of project area residents, known asthe "affluence factor," can be used to increase projected content values up to
*75 percent of the structural values, and beyond 75 percent if substantiated byempirical evidence. Regulation specifically states that the residentialcontents procedures does not apply to commercial or industrial property.There is, however, "recognized precedence," for a business affluence factor.An example is in the BERH review of the Phase 1 General Design Memorandum forthe James River Basin at Richmond, Virginia. The Board acknowledged a 1.9percent real growth rate in the value of non-residential property. Whileneither the existing guidelines nor previous E.R.s encourage use of acommercial/industrial affluence factor, the projected content value increaseswere accepted, based on information from area business leaders and historicaldata on increases in industrial and commercial contents. (Anderson, Thomas,"Summary of Issues and Coordination during BERH review of Phase I GeneralDesign Memorandum, James River Basin, Richmond, Virginia," Memorandum forRecord, Ft. Belvoir, Va. June 1981). In 1977, IWR published the study: AnEmpirical Investigation of the Existence and Magnitude of a Commercial andIndustrial Affluence Factor. This study of content-labor ratios on the OhioRiver found insufficient data to make any judgement regarding commercialproperty. Industrial data indicated that there was a tendency to upgradeindustrial equipment beyond what might be expected, but the results were notconclusive enough to establish an industrial affluence factor. More researchwas advocated. Once future value estimates are established, districts areencouraged to consider local flood characteristics of velocity, duration,
12
.. . . . . . . •. .- ,, .-* ,.-. *. -* %
-.. "--.* _'. ... - .- - . - .... .. , 'lgm m= m ~ imlinlll*

volume, debris load, and salinity along with the construction material and thenature of flood-proofing and flood-warning activities. In practice, whendepth-damage functions can be found that are comparable to those that wouldoccur in the study area, the functions have been accepted in the reviewprocess. Income loss reduction for business firms in the area where the lossoccurred can be counted when the loss cannot be recovered at another locationor at another time by the same firm.
STEP EIGHT: DETERMINATION OF OTHER COSTS OF USING THE FLOODPLAIN
The P & G give examples of costs of occupying the floodplain other than directflood loss. These may include flood proofing, flood insurance cost, and thecost of modifying the use of the property.
STEP NINE: COLLECT LAND MARKET VALUE AND RELATED DATA
This step includes the procedure for calculating the benefits of a project dueto changes in land use or more intense use of existing development.
STEP TEN: COMPUTE NATIONAL ECONOMIC DEVELOPMENT BENEFITS
This step summarizes the National Economic Development Benefits (NED),benefits categorized from an urban flood protection project. The categoriesinclude inundation reduction benefits, intensification benefits which reflecta more intense use of property with the same land use, and location benefitswhich reflect an increase in property market value and income level due tochanges in land use brought on by the project.
13
--t --= a~w a~m.. . . . . . . . . .. . . . . . . . . . . . . . . . . . . . . . .. ..... **J ... "' '' ' ' - ' ".* .. *... "-" .

SPECIAL PROBLEMS IN ANALYSIS OF BUSINESS PROPERTY
Relative Importance of Non-residential Damage
- While standardized depth-damage functions are usually applied to residential"* flood damage, business depth-damages are far more often assessed on an
individual basis. Business damages deserve more attention per unit becausethe character and susceptibility of non-residential property can vary widelyfor each type of business. The value per unit is also much higher.Commercial development is the highest economic use of property because it isvalued higher per square foot than any other land use. It is also susceptibleto the greatest flood damage per square foot.
Variability of Flood Damage
Content Damage
In their 1977 report, The Benefits of Flood Alleviation, Penning-Rowsell andChatterton (Ibid., p. 38) put potential loss to a typical grocery store in
" England at nearly 250 pounds per square meter - or nearly $50 a square foot -
for inundation of six feet of floodwater. Content damage was analyzed by D.J. Parker in 1973. Susceptibility ranged from 55 percent for liquor stores to100 percent for perishable food and reading material in property that wascompletely submerged (ibid, p. 40-41).
Business structural damage is more homogeneous than content damage.Huntington District, for example has recently adopted standard structuraldamage functions for both industrial and commercial property. It also hasrejected standard content damage functions. Huntington's standard structural
"* damage functions are based on construction material and square feet. BuffaloDistrict's structural surveys, which were done by the Hydrology Branch,include a very detailed analysis of variance in the first floor level andpermeability of the building fabric and entryways.
Industrial Damage
Industrial property damage also relates to products and equipment.Penning-Rowsell and Chatertton's estimates ranged from 33 British pounds persquare meter (or more than $6 a square foot) for mean damage to the food,drink and tobacco industries. Mean damage was more than 84 British pounds persquare meter (or $16 square foot) for the metal and engineering industries.These figures compare to an average of about 50 pounds a square meter or
* approximately $9.50 per square foot for residential property.
Industrial and institutional damage analysis is complicated by the limitedexperience of each Corps' district. Every district has a wealth of experiencein working with residential and commercial property, but many have not had todeal with a variety of industrial properties. Several Corps' districts,including Galveston and Fort Worth, use general damage curves to estimatecommercial damage. But they would not consider such generalizations forindustrial property since each location is so different. Other districteconomists are inclined to adopt standard commercial damage functions, butalso would not consider standard industrial relationships.
:. 15
PREVIOUS PAGEIS BLANK
• . . . .o .... . .
, . . • m...t - , .... *-.- . '* * -- , .. ,. * ... ,. ., i*k~ m .n * m - - - - . . .• - - * - - ' -, .. ' " .- ,.' ,. ... ~..., .. ,,..i .

II
Production Loss
Other "business losses" include the costs of unused capital, labor, and lostprofit or non-recoverable production or sales. "Non-recoverable" is a termwith no absolute definition. Several district economists classified
determination of non-recoverable business loss as an "art" and not a"science".
One major criterion is whether the firm has the time to make up the productionloss, or lost sales. For example, a manufacturer who operates on a 24-hourproduction schedule would have a difficult time making up the loss. In theother extreme (in a flooded clothing store), customers could either delaybuying the product or the sales could be made by another outlet of the chainin the vicinity. When a customer has to travel extra distance to make hispurchases, or a product has to be brought in from a distant location,business loss would be computed from the additional transportation expenses.
Robert Kates gave a thorough explanation of production loss determination inhis study, Industrial Flood Loss Damage Estimation in the Lehigh Valley,University of Chicago Press, 1965. Kates was encouraged that the similarityof the production process between industries should make it easier todetermine and apply flood production loss functions. Field interviews wereused to estimate potential production downtime and the amount of capital stockand labor that would be idle. Production losses were then determined bycombining stage outage functions with daily production. Kates distinguishedbetween loss to the establishment and loss to the nation. Permanentproduction losses and the costs of deferred or transferred production wereconsidered national costs. Permanent loss included the fixed and variable
*: costs, profits, and returns to the employees. These costs can be estimated by*: determining the value added by the activity. Deferred or transferred costs
were estimated at two percent of the value of product. (Kates, ibid, p.53)
Damage to Business Records
Unfortunately, many businesses keep their only copies of tax, sales, andinventory records in flood-prone locations. When flood waters destroyrecords, it takes many days to replace them. Costs should be estimated bycomputing the opportunity value of the labor required to replace the records.
Non-physical and Emergency Costs
One of the most thorough studies of non-physical property loss was LouisvilleDistrict's post-1978 flood study in Frankfort, Kentucky. This studycalculated that non-physical damage accounted for nearly $10 million dollars,or approximately 20% of the total damages in the 1978 flood. Over half ofthose costs were the loss of employee wages and costs borne by governmentagencies during administration of flood damage repair and non-emergencydisaster relief programs. The Frankfort study also made a thorough accountingof income, rental, and employment loss to businesses, transportation costs,income loss, administrative cost and repair costs for public utilities.
16
. . . .. ........ ........... ... . ... . ..............................-........ ,.,..-,-...-..-:.

' Emergency costs were distinguished from other non-physical costs. Theyaccounted for $6.6 million or 13% of the total costs of the 1978 flood.Emergency costs included the administrative costs of disaster relief agencies,the direct costs for flood fighting activities, evacuation, transition, andreoccupation costs (which are primarily related to residential costs); lawenforcement and health related activities; and the administrative costs ofhandling the emergency.
*Louisville District developed non-physical and emergency damage functions forflood fighting on the Kentucky River at Frankfort. The damage functions are
- aggregations and cannot be applied directly to other areas. What can befollowed, however, is the thorough exercise of counting all the emergency,administrative, and other non-physical costs which are often not assessed.
Care should be taken to insure all the variables are well-defined and that
none of the costs are double-counted.
17
" ° ° - , , ° - ' . , " . ". ° ° .o ° .' " o . . .o . . . o . . . . o • ° ° ° . . ° - , o o . . ' ° ° '. o ° % ', . ° . . . . • . ° . ° . - , ° . - ° ° ...

PROCEDURES FOR BUSINESS DEPTH-DAMAGE ANALYSIS
There are .three basic measures for estimating depth-damage relationships forindividual projects. These include the applications of generalized damagefunctions, post-flood damage surveys, and synthetic depth-damage estimation.All three of these generalized measures are well-used and have their ownadvantages and drawbacks. This section describes how each of these measuresare used and gives suggestions on how they can be implemented.
An important factor in determining depth-damage functions is that they areseldom linear relationships. Curves will most often be quadratic or cubic,with one or two inflection points indicating a change in the marginal rate offlood damage at that water height. The shape of damage functions is anexcellent guide to test the validity of each application.
Generalized Damage Functions
Generalized damage functions can be computed from either post-flood surveys orsynthetic estimates. In some instances, application of generalized curves canbe just as accurate as building-by-building estimations, and it is always farless expensive and less time-consuming to apply. Generalized functions can bedeveloped by a district for one project - or at the other extreme -- can bedeveloped for the whole nation. For example, most residential analysis within
• "the Corps is based on flood damage functions from the Federal InsuranceAdministration's (FIA) flood claims file for 1974. Whenever generalized
"- curves are applied, they should be field-checked. Every area should besurveyed to determine if the damage functions are applicable. Buildingmaterial and condition of the structures are particularly important. Masonrystructures, for example, can generally withstand flood damages much betterthan cinder block and frame buildings.
*[ Seasonality can also be an important factor in application of commercial andindustrial damage content functions. Building material is a prime example ofa product that might be stocked more heavily in the spring and the summer.Dry good inventories are especially high just before Christmas. The user ofthese procedures should be aware of whether the generalized damage functionsapply to any particular season. Just as with agricultural damages, commercialand industrial damages can vary with seasonal probability.
A final problem with the application of generalized damage functions is thedifficulty in accounting for the effects of flood warning. Content damage anddamage to outside vehicles can both be substantially reduced when there issufficient time available. In his 1964 book, Choice of Adjustments to Floods,Gilbert White describes his study of LaFollette, Tennessee, in which hedetermined the percent dollar damage loss avoidable at various water heightsto residents, restaurants, and groceries. He also accounted for the effectsof the number of hours lead-time, duration of flooding, flood frequency, andflood velocity in determining avoidable flood damage. White's estimates aremerely an example of what a district might use in analysis of potentialeffects of flood warning.
1 9 I s BLXN ,19
* .. . . . . . . . . . . . . . . * . . *
. . . .. . -..,. -. ,, , ' d W d~m , * .• .. •. .. . *p ,*. . o.. .,. *..- *.

Post-Flood Damage Surveys
Post-flood damage surveys have long been believed to be the most reliable wayof predicting flood damage. The post-flood sui,eys that have been doneprovide a wealth of information. When there has been an opportunity toconduct them, the surveys have been very thorough, and can be of greater valuefor estimates of future damage. Even so, detailed flood damage surveys arefar from being a matter of course. There are often inadequate funds and timeto do the job, or just lack of specific authorization to study the area.
Post-flood surveys, like all other large surveys done by the Government, mustbe done with a set of questions approved by the Office of Management and
- Budget (OMB) to comply with Public Law 77-831, the Federal Reports Act of1942, as interpreted by Army regulation 335-15. In 1979, OCE gained approvalfor several sets of questions which included nearly, everything anyone wouldwant to ask in a post-flood study. The questions are published in a
*compendium of OMB approved questions (U.S. Army Engineer Institute for WaterResources, 1984). The approved questions are found in Appendix A of thisreport. The questions must reference OMB approval No. 49-R0363. Questionsshould be selected carefully. The questionnaire should not be too long, yetit should still be thorough enough to cover all important details about flooddamage and the nature of the flood hazard.
Post-flood surveys, potentially, at least, elicit greater cooperation fromthose being interviewed than in synthetic damage analysis. People are awarethat they have a flooding problem - having just experienced one - and aregenerally more than willing to talk about it. The flood victim can betterjudge the full extent of his loss than someone who is making a synthetic
* estimate. Occasionally, someone may be concerned that his casualty loss claimto the Internal Revenue Service is being investigated.
*- Penning-Rowsell and Chatterton claim, however, that post-flood damage*assessment is notoriously unreliable. They claim that post-flood damage
surveys tend to underestimate damage that may not be apparent until months* .after the flood event (Penning-Rowsell and Chatterton, 1979, p.2). This claim
was borne out by the experiences of this author in post-flood surveys of RiverDes Peres in St. Louis, Missouri. Many victims claimed that damages tofurnaces, refrigerators, floors, walls, carpeting and insulation did not show
- up until it was too late for them to make flood relief claims. The "hiddendamage problem" would be largely solved by waiting until one year after theevent so that most heating and air conditioning equipment and insulation willhave a chance to operate. The effects of rust, mildew, and warping, will thenhave run their course. The memory of loss, and the damage record should stillbe around after a year.
Post-flood surveys yield only one damage point for each building. For damagecategories with limited cases, it may be necessary to combine post-floodsurveys with synthetic damage-estimates to obtain depth-damage functions.
Synthetic flood Damage Approximation
Where there is no recent flood history, damage estimates can be synthesized bysurvey of damage potential at various water heights.
20
* -h. .

Synthetic damage analysis is often the only way to compute flood losspotential. This type of survey has gained a great acceptance and is used bymost Corps' districts in figuring cost/benefit or specific control projects.Synthetic damage surveys can be done with the same set of OMB-approvedquestions described previously for post-flood surveys. Damages can becomputed at several levels of potential inundations, an adequate number todetermine damage functions for every structure.
Synthetic damage estimates have a number of difficulties. The most severe isthe time and money involved. Synthetic flood surveys can take anywhere from30 minutes for a small commercial structure to two days for a large industrialcomplex.
- Due to their hypothetical nature, synthetic damage relationships should bedone by people very experienced in post-flood surveys. The surveyor should befamiliar with what is and isn't damaged in a flood. Direct loss to buildings,fixtures and inventories is relatively easy to estimate, compared to damage tooutside property, damage to business records, clean-up and emergency costs,business closing costs, and traffic rerouting. Each of these items is much
* simpler to estimate from the benchmark of a previous flood. In any case,attempts should be made to compare the validity of synthetic damage estimates
* with similar post-flood experience.
- Two further problems with the synthetic estimate process are the high*dependency on the store manager's or the plant manager's ability to make
susceptibility estimates and their cooperation in making these estimates.Both these problems are particularly serious with synthetic damage estimates.
A refinement of the synthetic damage estimation process was suggested byRobert W. Kates in his 1965 study of the Lehigh Valley. Citing the 1960Stanford Research Institute's report on flood loss in California, Katescommented on the problem of high variance in the nature of flooding andsusceptibility in using generalized functions. In his report, Kates describedthe process that was used in a detailed synthetic survey of the LehighValley. The study included taking elevations at several points within each
- building, noting window elevation and critical damage levels for equipment,other fixtures, and inventory. Plant officials gave the gross values ofbuildings and contents. Depreciation was then deducted from the value ofbuildings and equipment and salvage values were determined for merchandise andraw material. Depth-damage curves were then computed for each structure withinflection points determined by critical points of damage for equipment,storage of valuable inventory and the height of building openings. Katesshowed equipment and inventory damage functions for one industrial plant.Both curves had two inflection points where there were significant changes inthe rate of property damage increase. These damage functions were combined
. for structure, content and production loss for a series of selected flood*stages.
. Many Corps' districts use procedures similar to that used by Kates. The*" surveys have the same general purpose, but vary significantly in detail,
particularly in questions dealing with secondary or indirect flood loss, suchas production loss or transportation rerouting.
21
* * . .: - : * =..-. . .. : .. ;•- . .. ,:-& .......-... -.... ,, .-.... . *--..*'* .** .. .-.- :.'.;

Flood Survey Variables
For the purposes of consistency in business post-flood and synthetic damagesurveys, it is suggested that a set of variables with standard definitions beestablished for business damage surveys. Below is a proposed set ofdefinitions. These should not be taken to preclude any other definitions forvariables that might be applicable to business damage surveys.
Name of Business
Type of Business - One to four word description of the type service providedor the nature of the product manufactured, transferred, or sold.
SIC Code - Three digit product code as defined by the 1972 Standard IndustrialClassification Manual, published by the Office of Management and Budget.
Community - City, town, or county (as specific as possible).
" State
Drainage Basin - specific stream of immediate drainage basin, and the majorriver basin of which it is a part.
Type of Flooding - Check all that apply: overbank flooding, poorly drainedland, high groundwater, hurricane or tropical storm, flash flooding from heavyrainstorm, area of consistently heavy rain, snowmelt and ice blockage,tsunami, sedimentation, non-permeable soil, rock and earth slide, stormsurges, over-irrigation, and sheet flooding.
*" Complicating Factors - Frequency of inundation (percent chance of floodingoccurring in any one year), duration of flooding (the amount of time thestructure is inundated per given flood frequency), velocity (probable cubicfeet per second at the building location for given elevation flood), sedimentload, and poorly defined flood plans (victim unaware of flood threat).
Value of Buildings - Depreciated replacement value of buildings (exclusive ofany land value).
Description of Buildings - Single story with or without basement, two or morestories with or without basement, split level with or without basement, andtrailer.
Construction Material - Outside material: brick, wood (indicate type ofsiding used), steel, or block.
Condition - GoodFairPoor or Dilapidated
Size - Number of square feet for each building.
22
* .. o . . ° *o .* - . * -.. **. *. . .. - . . . . .,* ...... * .* .*,.*. * * **. * ~ *. . • •.. -., - -

Age - Number of years since building opened.
Value of Inventory - Depreciated value of merchandise or raw materials. Valueis figured at costs to business or institution.
Description of Inventory - Brief description of material used in production,or handled or sold by business or institution.
Value of Equipment and Fixtures - Items not legally defined as real estate,but permanently stored or used by business or institution. Value isdetermined by depreciated replacement cost to business or institution.
Description of Equipment and Fixtures - Listing of types of equipment and*fixtures used in business operations.
Value of Contents - Combined value of inventory and equipment.
Damage to Structure - Estimated cost of restoring building to pre-floodcondition.
Damage to Inventory - Depreciated replacement value of damaged inventory lessmarketable salvage value.
Damage to Equipment and Fixtures - Depreciated replacement value of damagedequipment less marketable salvage value.
Damage to Contents - Combined total of inventory, equipment, fixture damage.
Water Height - Number of feet above or below the first floor of eachstructure.
-. Cleanup Hours - Number of hours spent for each given salary level. This wouldinclude additional administrative tasks, as well as actual cleanup expenses.
*i Cleanup costs - Product of hours spent by salaries of individuals involved.Cleanup costs should also include material costs, plus the costs of any
* contract services.
" Closing time - The amount of time the operations were either shut down, or the
capacity was limited to some degree.
. Payroll Loss - Number of employees out of work, length of time, and wages.
Unutilized investment - Estimated value of land, buildings, inventory,fixtures and equipment, multiplied by the amount of down time, the interestrate, and the probablL return on investment.
Emergency Hours - The number of hours spent to minimize the potential floodloss, by attempting to prevent the floodwaters from entering the building, andby moving potentially damageable items.
Emergency Costs - Product of hours spent in emergency operations and the*salaries of the individuals involved.
23
. * .•. *
.. .......... .. . --- .... . . -;« 9 ,. , , ."...... ".. ... ., .. " ' **J" ..- ,'',-..,

TOOLS FOR ANALYSIS
The following is a set of tools important for business depth-damage analysis.
Real Estate Appraisal
Accurate flood damage assessment cannot be done without property appraisal.Detailed flood surveys of every building can be made based on historical floodlosses or damage estimates made for hypothetical flood levels. However, anyapplication of depth-damage relationships, whether for general use or oneparticular study, requires an accurate property appraisal. Appraisal is asimportant as hydraulic frequency curves and depth-damage functions inaccurately determining the benefits of a flood control project. Appraisalsare easily obtained from community real estate assessments. Assessments areusually given separately for land and improvements. Where land andimprovements are listed together, real estate agents can generally furnishappraisals of undeveloped lots of comparable size and with access toutilities in the same areas.
Very often the appraisal information is significantly out-of-date.Adjustments can be made in the price levels to account for the time periodssince the appraisals. When appraisals are made, they may not have been madeat 100 percent of the market value. Sometimes a fixed percentage is used andadjustments can be made accordingly. In any case, discussions should be heldheld with local real estate agents to compare the average market values ofbusinesses of various sizes and conditions.
Another source that is used by several districts is the Marshall ValuationService. Marshall and Swift documents can be used for obtaining replacementcosts for building construction in various parts of the country. Localconstruction cost multipliers are listed for masonry and frame constructionfor all state and large metropolitan areas and most medium-size communities.Square and cubic foot construction costs are given for foundations, flooring,walls, roofing, heating systems, plumbing, building appliances, as well asgarages and outside property. The guides are updated quarterly and availableon computer.
The service can be particularly useful in hypothetical flood damageassessment. The cost of replacing nearly every type of building fabric can bedetermined. At various elevations, susceptibility indexes and values can beapplied to determine the cost of replacing the building material.Susceptibility indexes are described below. Marshall Valuation Service is
published by the Marshall and Swift Company in Los Angeles, California.
Field Sampling Procedures
Sampling procedures can generate enormous cost and time savings with littlesignificant loss to the accuracy of the final product. The potential ofseveral sampling techniques should be evaluated for various types of floodloss. This work unit would focus on flood damage assessment toboth urban and agricultural property. Comprehensive surveys would be made of
25 2, I ~PREVIOUS PAGE IBLN
,ill ~ ~ ~ ~ ~ ~ ~ ~ ~ ~ ~ ~ ~ ~ ~~~i BLANKlli l/ I'' ' °"'''' ' '' "" '

the study areas for both post-flood and synthetic damage situations. Post-flood surveys can include a number of areas that were flooded during late 1982and 1983.
Various types of sampling techniques can then be applied and evaluated for thereliability at which the samples compare to the comprehensive surveys.Formulas for computing optimal survey size would be recommended, along withways of determining sampling groups and damage classification. This workwould require the heavy involvement of field offices that have experiencedrecent flooding and are willing to try new methods for flood damageassessment.
Susceptibility Indexes
Susceptibility indexes are a measure of destruction to the value of a productwhen it is inundated. D.J. Parker's susceptibility indexes do no more thanany depth-percent damage function at levels of inundation. What Parker'ssusceptibility index does illustrate is that many items have salvage valueafter inundation. Other than this, there has never been any thorough study ofthe salvage value of various building materials, equipment or inventories.Educated judgments of material losses are made for hypothetical flood damageestimates. Corps' economists and even insurance adjusters that are makingthese estimates may have a wealth of experience on which to base theirjudgments, but they are still made without a statistical basis. Adequatesusceptibility indexes can be developed from post-flood samplings of buildingmaterials, fixtures, and inventories. Surveys should be done far enoughfollowing a flood event that all the flood damage is apparent. Susceptibilityindexes should be applied to hypothetical flood damage estimates to verifygeneralized damage functions.
Building Collapse Curves
The variability in the susceptibility of building materials is wellillustrated in the Portland District's building collapse curves developed forits study of the Willamette River System. The curves are found in Appendix C.The report estimates the condition that would be likely to cause a completecollapse for four classes of buildings for given depths and velocity offlooding, and number of stories of buildings. The building collapse curvesindicate that velocities of up to 6 feet per second can make even thestrongest buildings collapse when the water is 10 feet above ground. This setof building collapse curves is specific to the hydraulic conditions and thebuilding construction in the Willamette Valley area.
Fire Insurance Rate maps
The Sandborn Map Company of Pelham, New York maintains a series of detailedmaps that cover every city in the United States. The maps show the outline ofevery permanent structure at the scale of one inch to 50 feet for centralbusiness districts to one inch to 200 feet for less congested areas. The mapsgive the use, construction material, and number of stories of each building.The maps are drawn to scale so that physical dimensions can be measured fromthe maps. The age of the maps varies considerably, but there are many largecities that are updated annually.
26
.. . .. . .. ........ . . .

Flood Damage Computation Programs
Many Corps' districts have their own computer programs to calculate flooddamage. The programs have advantages and limitations geared to the needs ofeach district. This section describes the programs district economists maywant to consider in analyzing commercial and industrial flood damage.
HEC Programs
The Hydrologic Engineering Center (HEC) has three flood damage evaluationprograms. Structural Inventory for Damage Analysis (SID), Damage Reach StageDamage Calculation (DAMCAL) and Expected Annual Flood Damage Computation(EAD). The linkage of these programs is shown in Figure 5, taken from the SIDUsers' Manual.
SID is the newest of the three programs. It has been applied *n Detroit, NewYork, St. Louis and Little Rock Districts. SID was developed as analternative to DAMCAL. It can be used to assess damage to individual or smallgroups of structures. SID can be used with spatial data management systems.Input to SID includes: (1) a structure ID, (2) a damage reach assessment, (3)the reference flood elevation, (4) the stage damage function assignment, (5) astructure reference elevation, and (6) a damage category assignment. Theoutputs of SID are elevation damage functions for each damage category.
DAMCAL accomplishes the same output as SID, with somewhat grosser input.DAMCAL uses existing and future land use categories and average values atvarious elevations of damage categories. DAMCAL was written to feed into theEAD program for managing spatial data for use in quick comparison ofalternatives for structural or nonstructural plans.
* SID and DAMCAL are linked to EAD, either manually or through a linkage programcalled HECDSS. EAD computes average annual damages and inundation reductionbenefits based on information on flood plain management plans and stagefrequency values. Damages are shown by land use and reach for existing
*conditions with and without the projects.
Baltimore District
DAPROG II was recently developed by Baltimore District to compute stage damagefigures for commercial and residential property. It also computes utility andemergency costs. Estimated replacement values and elevations of eachstructure are calculated for the program along with stage frequency anddepth-damage functions. The results are entered manually into HEC's EADprogram to compute average annual damages.
0Fort Worth District
Fort Worth District uses a series of flood damage programs that are amodification of a model developed by Albuquerque District. The program can beused to compare the average annual benefits of a range of flood controlalternatives. Stage damage curves can be determined from a sampling ofcommercial, industrial, and public buildings or taken from damage functionsthat are otherwise used by Fort Worth District.
27

FUNCTION FIELD SURVEY
INVENTORYPROCEDURE
SELECTION
ELEVATION -DAMAGE 1FUNCTION SID DAMCAL
PROGRAM PROGRAM 1PROGRAM,
RESULTS
ELEVATION-DAMAGE AGGREGATED ELEVATION-FUNCTION DEVELOPMENT DAMAGE FUNCTIONS BY
DAMAGE CATEGORY ANDREACH
LIKGSHECDSS . PRINTOUTLINKAGES
TO OTHER AUTOMATIC FILE
PROGRAMS LINKAGES MANUAL LINKAGES
EXPECTED
ANNUAL DAMAGE
INUNDATION DAMAGE ANALYSIS O14ER
ASSESSMENT PROGRAMS ANNUALo EAD PROGRAM
DAMAGE
4/PROGRAMS/
o nEC-1 PROGRAM MANUAL
1OMPUTATIONI
EXPECTED ANNUAL DAMAGE RESULTS
AND BENEFIT RESULTS EXPECTED ANNUAL DAMAGE
REDUCTION AND SENEFITS
BY CATEGORY AND REACH
.1/ Hydrologic Engineering Center, 1879a
L/ Hydrologic Engineering Center, 1980 Figure 5V_./ Hydrologic Engineering Center, 1977 Overview Flood Damage Analysis Procedures
fj Hydrologic Engineering Center, 1981
28

,.-
One program is used to develop Stage Damage Functions for flood conditions bystream or reach, by flood zone, by property type and by contents andstructures of the buildings. Any number of streams or river reaches can berun sequentially during the program and river reaches can be selected bydamage centers and backwater profiles. Output of the program is made bytwo-digit SIC codes. The next program determines average annual damages byintegrating stage dollar damage curves with the stage frequency curves.Recent enhancement of the program has been made to evaluate up to tenprofiles, including 1- and 2-year floods. Average annual benefits can bedetermined for evacuation and flood warning schemes.
Los Angeles District
The Los Angeles District uses two programs to estimate average annual flooddamages. These programs work much in the same way as HEC'S SID and EADprograms. The first program, DEPREP, is used to calculate stage damagerelationships by flood zone, use, and reach from data which is made availablefor individual structures, and by stage frequency relationships. Theinformation from DEPREP is linked to the second program DAMAGES manual. Thelinkage is done manually so that the economists can understand exactly whatthe problems are in each individual area and so they can also betterunderstand any problems with the data. The DAMAGES program is then used tocompute average damages and flood damages prevented for each plan.
Soil Conservation Service (SCS)
The SCS uses a program called URB I to compute average annual damages tobuildings and structures. The URB I has basically combined the capabilitiesof SID and EAD. Characteristics of each individual unit are entered into theprogram along with the hydraulic characteristics of each reach. Averageannual damages are computed for the entire area between each cross section andbroken down by structure and contents.
29
.. ... .. . ,, .. *. ... * **. *. ** * * .-. , -. .. , . ,- , . . * :.. ,,..-.. ..-.. ......

I.DISTRICT DEPTH-DAMAGE EVALUATION PROCEDURES
Corps' Districts use a wide variety of procedures in evaluatingnon-residential flood damages. Table 2 illustrates this diversity. Allapplicable procedures are marked in the table. Some districts use either a
* combination of measures or are in a transition period where they may be*[ adopting a set of generalized damage curves.
There is a predominance of districts that compute depth-damage relationshipsfor every nonresidential structure and make no generalization whatsoever.However, there is a growing number of districts which are using generalizedcurves or have taken major flood damage surveys that could be a basis foradopting standard damage functions.
Lower Mississippi Valley
Memphis District
Memphis District economists use the damage functions developed by the
Tennessee Valley Authority in 1969 for commercial and industrial depth-damageestimates. They have found these functions to be consistent with surveys done
"- in its own district, and more realistic than other functions it has seen.They also believe that the survey, which included over 40 communities in theTennessee Valley, would be particularly applicable to the Memphis regioncontent functions combined over 100 categories of businesses. Separatecontent functions were developed for some of the more common types ofbusinesses. Other businesses were consolidated into "S" and "U" shapedcurves. Structural damage functions were further consolidated into kinkedcurves which have a steep linear rise, until damages reach 60 to 80 percentand top out. The curves recognize separate building collapse elevations forframe and masonry structures. (See the section on damage function comparison(Pg. 37) for further illustration).
PREVIOUS PAGE
IS BLANK31

TABLE 2Procedure Used for Computation of Non-residential Depth-Damages
0 a ~CA tv~c nOC rOO~ Crc2 0 tCfl c 0 Vn a" U
Coe Misisip Vale Division ce 1 0C
Cto ICO 0 c*OP. 0. Io 0c 0 0 R C
to. aoi Ditr7 M X. & 0&M0 MCo
W1 " 1 0 CL 1 C -1 a 0C C
"I rr * *1-
Lower MissiPPi Valley DivisionMemphis District xNew Orleans District x X XSt. Louis District x X XVicksburg District x
Missouri River DivisionKansas City District XOmaha District x
New England Division xNorth Atlantic DivisionBaltimore District X XNew York District XNorfolk District x xPhiladelphia District x
North Central DivisionBuffalo District XChicago District XDetroit District X XRock Island District xSt. Paul District x
North Pacific DivisionAlaska District*Portland District x xSeattle District xWalla Walla District x
aOhio River DivisionHuntington District X X XLouisville District xNashville District X X xPittsburgh District X
Pacific Ocean Division XSouth Atlantic Division
Charleston District x X X xJacksonville District X xMobile District xSavannah District xWilmington District x
South Pacific DivisionLos Angeles District xSacramento District xSan Francisco District x
Southwestern DivisionAlbuquerque District XFt. Worth District XxGalveston District X x XLittle Rock District XTulsa District X
TOTALS 13 13 6 3 4 17
*N4o Flood Control work at this time.
34

New Orleans District
In 1979, rainstorms brought water pounding into the New Orleans area. Apost-flood survey and hypothetical flood estimates were used to developbusiness depth damage relationships based on type of business. Thesedepth-damage relationships may be used on other New Orleans District floodcontrol projects. The New Orleans' survey does not measure industrial flooddamage, which will still estimated by interviews. Although information wascollected for both structure and content damage, the results were usedprimarily to develop content depth-damage relationships. Only two separatestructure-damage functions were computed. Content damages were felt to be abigger problem to assess, subject to more variation, but varying somewhatconsistently with the type of structure.
The survey is one of few, if not the first, to make a thorough comparisonbetween fresh water and salt water flood damage. Separate fresh and saltwater functions were computed for each category of 15 commercial and publicuses. The survey found consistently higher damages for salt water flooding.
St. Louis District
The St. Louis District developed its own commercial flood damage curves aspart of the Blue Waters Ditch General Design Memorandum in East St. Louis,Illinois. The damage functions are indicative of a broad range of floodingproblems that are common throughout the St. Louis region, including overbankriver flooding, localized storm drainage, small stream flash flooding, andhigh groundwater levels. Hypothetical industrial flood damages are determinedfrom interviews and on-site plant surveys. In the past, insurance adjustershave estimated industrial damage.
Vicksburg District
Vicksburg District uses the damage functions Stanford Research Institutedeveloped for the California Office of the U.S. Soil Conservation for allcommercial and industrial damage calculations. The functions are consideredto accurately approximate the type of damage found in the Vickburg District.The cost of detailed surveys are believed to be greater than the possiblegain.
Missouri River Division
Kansas City District
In 1977 a flash flood struck one of Kansas City's commercial districts, the"first shopping center in America". The Kansas City District surveyeddamages, gathering information for commercial curves. However, Kansas CityDistrict still makes thorough surveys as part of ongoing depth-damageanalysis. Experience in Kansas City District has shown inconsistentcommercial depth-damage relationships. Clothing stores were mentioned ashaving significant variance. Drugstores and supermarkets can have contentdamage in excess of flood level. A small amount of moisture can contaminate
33
...... *i....... . . .. -. ... ............ ...... .

- food and drug, and state regulations strictly prohibit resale. The onlyexception would be small gas stations and other small businesses wherestandard relationships are computed and applied for individual studies.Interviews at each industrial plant are considered essential.
Omaha District
Omaha District has compiled depth-damage functions for 79 types of businessesand public buildings. Curves were derived primarily from other Corps'districts. The Marshall and Swift evaluation method is used to establish thereplacement value of each property. Industrial property is evaluated on anindividual basis.
New England Division
*- New England Division does not rely on generalized damage functions. Samplingis done to compute project-by-project depth-damage functions for lightcommercial businesses, such as self-service gas stations and fast-foodrestaurants. Larger commercial damage relationships are studied on anindividual basis. Expected loss on all other property is estimated frominterviews with plant managers or comptrollers. The division distributes aquestionnaire which estimates project's business losses and emergency costs.
North Atlantic Division
Baltimore District
Baltimore District uses a modification of the damage functions it developedafter a massive 1963 post-flood survey of the Susquehanna River Basin. Themost recent and extensive post-flood survey study is the Baltimore District'swork on the Wyoming Valley in Pennsylvania. Between 3,500 and 4,000commercial and industrial properties were included in a 1978-79 survey. Mostbuildings in the sample were damaged in the flooding from the 1972 TropicalStorm Agnes. (Actual flood damage estimates were used to establish a total offour points. In the damage function, estimates of replacement costs werebased on Marshall-Swift Appraisal Manuals.) The results of the survey have
*" been used only in the Wyoming Valley General Design Memorandum. Baltimorepersonnel would like to investigate the potential of applying the WyomingValley data to generalized damage curves, but this would require additionalfunding. The study also lack information on structure and content value.Values can be estimated only in square feet by type of business.
New York District
New York District has also performed a recent and extensive survey ofpotential flood damage. The Passaic River Basin is a heavily urbanizedwatershed, and is susceptible to catastrophic flood damage. Interviews werecompleted for 652 commercial properties and 753 industrial properties.Depth-damage relationships were computed for 10 categories of commercial
_. business and 35 categories of industrial properties based on type of businessoperation, product or service with which the company dealt. These categoriesare further broken down by size and type of foundation. The survey was
34

conducted in 1980 and early 1981. Some parts of the survey represent actualexperience from 1977 to 1979 flooding and the rest is based on hypotheticaldamages at selected water heights.
Norfolk District
Norfolk District has done limited flood control work in recent years involvingindustrial and commercial structures. A comprehensive survey of large
. industrial plants was completed in 1980 on the James River through Richmond,Virginia. The businesses were considered too large and too important for use
* of generalized curves. Depth-damage relationships were developed for small,medium and large commercial establishments such as drugstores, banks andhardware stores. It is not known whether the Richmond survey will beapplicable to Norfolk District work.
Philadelphia District
The Philadelphia District conducts a comprehensive survey for potentialcommercial and industrial flood damage on every project. Questions areselected from the set questions approved by OMB in 1979. The focus of theinterviews may vary based on type of business being surveyed and the resultsof the surveys are checked for reliability against the 1963 Baltimore curves.
North Central Division
Buffalo District
Interviews are done for every commercial and industrial establishment.Damages are estimated for hypothetical flood elevation. Buildings in theflood survey may not have consistent first floor elevations and so care istaken to insure that each point on the damage survey reflects a consistent
*elevation of flooding and a consistent height above or below the first floor.This precaution is more important with large businesses than with smallerresidential property. Where appropriate, inventory levels are adjusted fortime of year, and estimates are made of probable damages in projectingbusiness loss. Interviews vary in length from 30 minutes for small commercialstructures to several days for a large manufacturer.
Chicago District
Chicago District's flood control studies are extensively residential. Wherecommercial and industrial buildings are involved, each unit is considered
* unique and unit-by-unit surveys are considered necessary.
Chicago District has developed a model for estimating flood induced travel," costs. The model was used to calculate indirect business losses on the Little" Calumet Basin in Indiana.
Detroit District
Detroit uses 1974 Federal Insurance Administration (FIA) damage curves for all*structure damage estimates. The most appropriate residential curve is applied
35
b. *
~~~~~~~~~~~~~~~~~~~~~~~. . . .......... ....- : - , - 2 - L ''',..:. ' t . . . " . . " " ' .' ": , & , _ .

to the business structure which is being evaluated. The content value of eachbusiness is appraised and adjustments are made in FIA content damage curvesafter an open-ended interview with representatives of each business. A set ofgeneralized damage curves were just developed for the lower portion of theClinton River study after a structure by structure survey. The results ofthat study were applied to the Upper Clinton River Basin, which is under asurvey level study detailed enough for project authorization.
Rock Island District
Rock Island District uses a standard interview format to estimate commercial- and industrial flood damage. Standard commercial damage relationships are
computed for each project, based on the interview sample. Benchmarks are thenapplied to each commercial structure, based on size in square feet. Wheneverpossible, historical records are used to estimate potential flood damage.
Rock Island District's industrial survey groups firms by SIC code. Specificquestions are related to value of raw material, production, finished material,plant, inventory, and equipment. Output and employment questions are used toestimate business loss, with the extent of benefits determined by whether thepercent of the product that the firm supplies within that industry. Anyexpansion or moving plans are noted to aid in estimating future benefits.
St. Paul District
In survey level studies, St. Paul District surveys every type of existing. business. Damages are estimated for hypothetical flood heights. Letters are
sent in advance explaining the purpose and format of the interview. A personfamiliar with the entire operation is requested to be available to answerquestions on value of building and contents, gross revenue, nature ofemployment, number employed. For some national firms, it will be necessary tocontact the regional office to determine the necessary information. St. Paulhas a large collection of damage records from recent flood surveys in thedistrict. There is the possibility of using the information to computedepth-damage curves for general use in the district data base.
North Pacific Division
Alaska District
The Chena River Study Project is the only flood control study undertaken by. Alaska District in recent years. There was very little industry and a number- of commercial and public buildings in the survey. No damage curves were"" involved in the study. AJaska District has recently done an appraisal of ice
jam flooding from the Kiuskokwin River at the Community of Aniak, Alaska.Primarily one story homes are affected and no project-specific depth-damagerelationships have been established.
Portland District
Most commercial damage in Portland District is estimated from a modifiedversion of the 1963 Baltimore depth-damage functions. The Baltimore study may
36

have been the largest flood damage survey ever undertaken in the UnitedStates, since more than 60,000 structures were included in this survey of theSusquehanna Basin. Portland economists made significant changes in the curvesafter a survey of Oregon's Willamette River system. Changes were primarilydue to differences in construction material. In particular, far less brickand more frame construction is used in the Pacific-Northwest than the East,and so structural damages tend to be higher in the Northwest. To illustratethese differences, Portland District developed a set of building collapsecurves which indicate the elevation and velocity that it would take to causethe collapse of a structure. (See page 21 and appendix C for furtherdescription).
Seattle District
Seattle District surveys all commercial and industrial property. It ispresumed that even the same type of businesses have wide differences ininventory and fixtures. Survey forms are used to determine the inventory andvalue of each building. The Marshall and Swift Real Estate Appraisal Manualis used to determine current building costs. The Fire Insurance Rating Boardmanuals are used for data on building construction to determine replacementcosts and separate replacement costs are estimated for each building material.
These figures are checked against estimates provided by building appraisals.Questionnaires are delivered one day prior to the interviews. Up to eightinterviews at large commercial or industrial sites can be completed in a day,provided the business are in the general proximity of one another.
Walla Walla District
* Walla Walla District uses Baltimore District's 1963 depth-damage functions;because of the size and quality of the survey, the percent damage functionsare believed to be appropriate for Walla Walla. District economists estimatedstructure values from county tax records. Adjustments in appraisals may bemade after field-checking a building's condition. Walla Walla does not have agreat number of industrial properties in its flood control studies.Industrial content value is gathered from field interviews. There were minormodifications made in the Baltimore data after a comparison with flood damagefrom major floods in Southeastern Idaho.
Ohio River Division
Huntington District
Huntington District has recently developed a set of business structuralflood-damage functions, based on a survey following the 1977 flooding alongthe Tug Fork River Basin. The new set of structural functions will be used onall business flood damage analysis. Content damages will still be determinedby interview at each property.
Louisville District
Louisville District computes its depth-damage functions from interviews. Acomplete inventory is taken for every major flood survey. Hypothetical flood
37

damage is estimated at every business in a detailed study. Public enthusiasmfor the survey is not a problem because of recent major floods. The surveyform is brief and straightforward: structural description, flood condition(up to five levels of flooding can be described), physical damages, loss inprofessional wages and emergency costs. The average commercial property canbe surveyed in 30 minutes. Large industries require approximately threehours.
Nashville District
Nashville District uses the most appropriate of the 1970 Federal InsuranceAdministration's depth-damage curves for computing commercial and industrialstructure damage. Damage is estimated from open-ended interviews with no setformat. Where a significant number of flood claims have occurred, the localoffice of the Small Business Administration supplies records of damage claimedand paid.
Pittsburgh District
Pittsburgh District uses information gathered by personal interviews incomputing depth-damage relationships. There is no standard set of curves.However, a large damage survey was undertaken for the Upper Sewickley CreekBasin in Westmoreland County, Pennsylvania. The flood survey was done after1972 Tropical Storm Agnes. Damage functions were established for 13 land usecategories including open space, five categories of residential land use,urban and suburban commercial property, industrial, agricultural, pasture,infrastructure, and institutional facilities. Four categories of undevelopedland use were identified as not subject to any damage.
The generalized damage curves were applied in a spatial analysis of the basinin one of the first flood control studies to use the aid of the aforementionedSID program developed by the Hydrologic Engineering Center.
Pacific Ocean Division
Pacific Ocean Division has a variety of flood experiences that includetsunamis (severe tidal waves), and areas with almost continual heavy rain tonear desert conditions. These extremes make it difficult to project flooddamage based on generalized functions for Hawaii, let alone on data from otherstates. Flood damage relations are estimated by SIC code for each project.Most commercial structures are concrete block with steel frame. Structuredamage generated by the same type of flood should have a fairly consistentdepth-damage relationship. Inventory value and damage are viewed as much lessconsistent and less likely to be subject to reliable curves. POD has anextensive collection of business depth-damage information which was collectedthrough interviews conducted in many parts of Hawaii and Guam.
38
...........* *.... .

South Atlantic Division
Charleston District
All industrial damage and commercial content damage are estimated byinterview. Commercial structure damage functions were obtained from theWilmington District. Field interviews are completed for commercial damage.The average 30-minute industrial interview follows OBM-approved questions.Charleston has few industries in the floodplain. Questionnaires are sent outin advance. Charleston uses a program based on percent damage. Thisinfluenced the decision to use curves based on percent damage rather thanactual dollar loss.
Jacksonville District
Jacksonville District uses the most recent set of commercial and industrialdepth-damage functions from the Galveston District. Industrial relationshipsare determined entirely through interviews.
The Puerto Rico Office, in an area which is subject to even a greater degreeof high-velocity, short-duration flooding than the rest of the district, hasdeveloped its own set of commercial and industrial curves.
Mobile District
The Mobile District has developed depth-damage relationships for 1979 and 1980flooding on the Pearl River. The depth-damage functions include 20 categoriesof commercial, industrial and public buildings. The relationships weregleaned from a survey of approximately 1,000 buildings. It has not beendetermined whether the Pearl River Survey will replace the Galveston functionswhich Mobile still uses for most of its depth-damage calculations.
Savannah Dis.-ict
Savannah District now uses depth-damage functions taken directly from MobileDistrict's survey of the 1977 flooding. It is anticipated that thesefunctions will be used to compute all Savannah commercial and industrial flooduamages. The functions list percent of damage by relative size of building
*. from 0 to 12 feet above the first-floor level. Each function has an averagereplacement value of structure and contents and average square feet of eachtype of enterprise.
Wilmington District
Industrial and large commercial business damages are estimated from surveys ofevery structure. These damages are derived from a series of unstructuredinterviews with no standard list of questions. The interviews are done in
* *person and average one hour to complete. The Wilmington Commercial programhas over 50 depth-damage curves adopted from the Galveston District. Thecurves show depth/percent-damage by 1-foot intervals from 0 to 14 feet.
39
7..

South Pacific Division
Los Angeles District
Los Angeles District uses the interview process to determine the depth-damagerelation for each business and institutional property. No special commercialand industrial curves are used. Equipment damage, which often accounts formuch of the business flood loss, is believed to be extremely unpredictable.The location and the portability of the equipment are important factors.Flood warning and evacuation lead times can also make a great difference inthe extent of business loss. The example of a Baltimore district study forthe Harrisburg, Pennsylvania area was cited as documenting a large evacuationpotential. Business losses and traffic rerouting costs are also determined bythe open-ended interview process. Interviewees are selected on the phoneseveral days before the interview. The interviewers are provided worksheetsas a guide on information to solicit.
Sacramento District
Sacramento District economists conduct complete surveys of floodplain propertywhenever possible. When resources do not permit complete surveys, they usedepth-damage relationships developed by the Department of Housing and UrbanDevelopment for the Tennessee Valley Authority in 1969. These functions havestructure and content damage functions for groups of businesses with varying"tU"s and "S" shaped damage functions. Whenever one of these damage functionsis applied, spot checks are made to test the applicability to the localsituation. Building collapse curves are applied when there is evidence that
*1 water depth and velocity may combine to cause a structure to fail. Interviewsare conducted for all industrial properties except when doing reconnaisance
*. reports.
San Francisco District
San Francisco District uses a set of depth-damage functions from the StanfordResearch Institute Report entitled A Study of Procedures in Estimating FloodDamage to Residential and Industrial Properties in Caliornia. Districteconomists compiled composite damage functions for commercial and industrialproperty.
Southwestern Division
Albuquerque District
Adobe construction is common for small retail buildings in the southwesternUnited States. Adobe is easily destroyed by floodwater. Concrete, cinderblock and steel typical in the rest of the United States are common forAlbuquerque's industrial and large commercial structures. Commercial damagecurves are adapted from those used by Galveston District, with localadjustments made after a flood survey in Pueblo, Colorado. Industrial
40

. •,
property damage is assessed by individual survey. Albuquerque uses a programdeveloped by Los Angeles District to compute the expected annual flooddamages.
Fort Worth District
Fort Worth District has adapted damage curves developed by Galveston District.There are over 200 different commercial, industrial and institutional damagecurves. They have separate functions for structure, inventory and equipmentOn very detailed studies, the Fort Worth economists will conduct interviews atthe industrial plants, each requiring between six and eight hours to severaldays.
Galveston District
Galveston began keeping a large file of flood damage records in 1968 under acontract with the Federal Insurance Administration, using FIA claim forms.The intial survey was very comprehensive, with 10,000 properties included. Athorough room-by-room survey was made for every building. The damagefunctions that were computed have been continuously kept up-to-date with newflood damage information, including a survy of the 1979 study of flood damagesfrom Hurricane Claudette. Galveston maintains 145 different types ofnonresidential flood damage functions, 85 of which are business curves. Therest are public and institutional property. There are separate functions forstructure, fixtures and inventory. The condition and age of all property isconsidered in application of all damage functions. Galveston economists havefound that the time of year can make a big difference in the amount andcomposition of inventory at some businesses.
Little Rock District
Little Rock began developing its depth-damage functions after the survey of amajor flood in Little Rock. A library of 40 to 50 commercial curves weredeveloped from questionaires and extensive interviews in the Ft. Smith,Arkansas, area.
Tulsa District
Tulsa District uses damage coefficients derived from Galveston District's[ program which they can access via the Southwest Division Computer System in
Dallas. The Galveston commercial functions were adapted with minor
modifications after a recent application to the Mingo Creek Study in the Tulsaarea.
41

4
SOURCES OF INFORMATION OUTSIDE THE CORPS OF ENGINEERS
Soil Conservation Service
SThe Soil Conservation Service (SCS) has done extensive work with commercialand industrial flood damage assessment, and is the best source of this type ofinformation outside the Corps. A major SCS effort was a set of depth damagefunctions developed in 1961 for the State of California with the help ofStanford Research Institute (SRI). The SRI report is still being used by SanFrancisco District for its commercial flood damage analysis.
*Although SCS work has traditionally been in rural areas, the increasing urbanflood problems have brought SCS to work in areas such as Cook County,Illinois, and San Jose, California. As in the Corps, SCS state and countyoffices have a great deal of latitude in depth-damage analysis procedures.Coordination should be made with nearby offices to compare procedures.
Small Business Administration and Federal Insurance Administration
The Small Business Administration (SBA) and the Federal InsuranceAdministration (FIA) maintain large files of flood damage claims. Both would
* be extremely useful for computation of national and regional curves.* Unfortunately, the SBA file does not give information on depth of flooding and
the FIA file does not distinguish the type of small business in recordingflood claims. The SBA data has been useful to Nashville District inundertaking flood surveys where the street address and flood elevation can betraced to information in the SBA file. Some districts have made use of themust appropriate FIA residential structure damage curves to apply to businessstructures. One district applies FIA's small business curves to compute
* commercial structure and content damages. The FIA data would be useful inproducing nationwide damage functions if businesses were identified by theproduct or service they provided or by the two-digit SIC code.
Tennessee Valley Authority (TVA)
* The Tennessee Valley Authority uses a family of small business flood damage* functions that were developed by the Department of Housing and Urban
Development (HUD) in 1969. This information is detailed in a report entitled,Small Business Research for Flood Insurance Rate-Setting. Modifications have
* been considered to these damage functions, but have never been executed.Open-ended interviews are used to determine potential industrial and large
* commercial damages.
,-
43
Si
* ~ * ** . .n*. . . . . . .. . . . . . . . . . . . . . . . . . . . . .. . . . . . . . . .

=! 7 - -- o
COMPARISON OF DISTRICT DEPTH-DAMAGE FUNCTIONS
This section contains a series of depth-damage function comparisons forseveral districts. Damage functions are shown for inventory; equipment andfixtures; structure; and content, which is a combination of inventory, andequipment. Damage function comparisons are shown for Ft. Worth, Sacramento,Mobile, New Orleans, and the Tennessee Valley Authority. The contentcomparisons are illustrated for the same types of businesses and structuralcurves are shown for the same construction types. The reader should becautioned that although these curve comparisons may represent a large numberof enterprises, the sampling of data bases should be much larger before anystatistical inference is made. Such inference cannot take place without acentralized compilation of the raw data. The conclusions reached from thesecomparisons are as follows:
1. As could be predicted, damage functions are much higher in nearly allcases for inventory than either equipment and fixtures, or structural damage.
*Some perishable commodities may not have to get inundated, sometimes a little*i moisture can be enough to do a good deal of damage. Inventory is less likely
to have significant salvage value than building fabric or more permanentcontents, particularly since it is generally for sale and not for continued
.* use on the premises. Nearly all inventory functions in this sample had overfifty percent damage at five feet and above. (See Figures A-i through A-5 inAppendix A.)
2. Inventory damage relationships were homogenous in shape, but not inmagnitude. Department stores, restaurants, clothing stores, and groceries,all had very similar shaped curves with inflection points close to the samelevels of inundation and roughly the same slopes.
3. Differences between damage function at lower levels can beparticularly significant in application to benefit estimation. The greatmajority of all flood events never get more than two feet above the firstfloor level. Because of the disparity in percent damage for lower levels ofinundation, noted above, field checks are highly recommended beforeapplication of any curves. Note that damage functions for Mobile Districtshow significant damages at the first floor level. Since the probability offlooding is particularly high at this level, there is a big difference in theaverage annual damages.
4. It should be noted in Figures A-16 through A-21, that the contentdamage functions derived by the Tennessee Valley Authority and New OrleansDistrict were very similar, both in shape and in magnitude for almost everytype of enterprise. While this is not large enough a comparison from which tomake any significant generalization, it does show that there can be a certainamount of consistency in damage function generation.
5. Figures A-22 and A-23 are a comparison of industrial structuredamage function that were developed by Mobile District for the Pearl RiverStudy. Comparisons are shown for wood, masonry, and metal buildings and forboth single and multiple story buildings. In both cases, masonry structures
PREIOU PGE
45

suffered less damage than either metal or wood structures, and wood structures*suffered the most. The differences appear to be significant enough to justify* separate damage functions.
6. Differences in the damage functions may be due to a number offactors. Geographic differences are related to the nature of flood events orto the nature of the buildings involved. Typical building fabric may vary
*' between regions, and the building fabric typical in one region can affectcontent as well as structural loss. Business practices, building layout,involvement in flood warning and emergency activities are also determinants.Other significant factors would be the data collection procedures, and the
- definition of the damage variables used by the individual districts and their* contractors.
7. Note that damage functions for drug store and food store inventory asnoted in Figure A-8 may depend as much on state health codes as actual damage.Protection against consumption of contaminated food and drugs may requirecomplete disposal, even with minimal flooding with inundation well below the
* level of food and drug stock.
'.4
46
, -. . -. ..-. .-.- .-: ..-..- , "_. ..' .,. .. - -'.. -....- ... .....- .- -... .. .........- .-. ,. .,' .'., ' -..-..-...-.-..-. .-. -, .-..-. 1

GENERAL ACCESS DATA BASE OF BUSINESSFLOOD DAMAGES AND DEPTH-DAMAGE FUNCTIONS
The following is a proposal to create a data base of nonresidential flooddamage for general Corps of Engineers' access. The data base would enabledistrict economists to compare their damage estimates with other districts inthe same region and with other districts with similar flooding problems. The
* information could also be used for computation of business depth-damagefunctions where no better source of information existed. This nonresidentialdata base would initially include flood records from as many as eight Corps ofEngineers' districts. These are New York, Baltimore, Huntington, Mobile, NewOrleans, St. Paul, Galveston, and Detroit. These districts have recentlycompleted large, comprehensive surveys of flood damage, or potential damage,to nonresidential property. A description of the information they collectedis in table 3. More recent information from these and other districts can beadded to the data base as it becomes available.
-- The Corp's computer network would be used to create the central file. The
* data would not have a standard format since the nature of the variables changefrom district to district. Separate record types would be created for eachdistrict or each separate data format. The data base user would have theoption of combining information from various data bases with common variables.For example, if New Orleans and Mobile data bases both have information on
* water height, structure type, property damage, and property value, the recordtypes could be combined for processing to determine standard damage levels forthe South/Gulf Coast area. The data base preprocessor could be used toisolate damage records for unique types of industries. The table belowdescribes the type of information available on each of the district flooddamage files, and illustrates the potential strength of being able to makeselections based on individualized need.
Just as a central data base of flood losses can be useful for computing damagefunctions tailored to particular situations, it could also be useful in givingindividuals the opportunity to choose between an array of damage functions.
* Damage functions would be collected from Corps of Engineer field offices, theSoil Conservation Service, Tennessee Valley Authority, state government, orany academic source that may have conducted research on this subject. Thedamage functions would be illustrated periodically in reports that woulddescribe the flood conditions upon which each set of functions is based,definitions of variables used in computing the damage functions, and the datesthat damage surveys were undertaken. The damage functions would also be setup for interactive computer access. They would afford an up-to-date file ofdamage functions immediately accessible for flood damage calculation programs.
47
[ . . " . .S. 1 - - . -

TABLE 3Categories of Information Found in District Depth-Damage Data Bases
"'--game of Businessor Institution >4 X
Type of Business
or Institution X X X X x X
'" SIC Code
" ::Communi ty X > x4
,..StateXX X XRiver Basin X X X X X X X
Type of Flood
Value of Buildings X
. Description of Buildings X x × XrConstruction Material
X x x
Condi tion
"-Size XX >Value of Inventory
Description of Inventory
Value of Equipment and
-Fixtures >4 X X
Description of Equipmentand Fixtures i n X
Value of Contents X
Description of Contents × X
-•.Damage to Structure >
Damage to Inventory X >4 X XDamage to Equipment and
Fixtures X X X
Damage to Contents > X e X
Water Height
~~~Clean Up Hours × × x
eClean Up Costs Xx
aagClostng Timer e × >
Payroll and No. ofEmployees < > > ×
-CleaingU Costs - - - " - -
=~Closi*ngim
Emergency Costs
48
. . . ..|. . . . .. . . . . . - . . . . . . . . . . . . . . . .

.4,
CONCLUSION & RECOMMENDATIONS
Residential damage evaluation has been given considerable attention primarily
from the analysis and application of Federal Insurance Administrationnationwide functions. The national FIA functions are used more than all otherresidential damage functions combined. Business damage analysis has beengiven far less attention than residential damage functions. There is more
skepticism of the consistency of business damage relationships. But thebiggest problem has been the lack of any organization to serve as a clearinghouse for business damage information.
There has probably never been a nationwide set of depth-damage relationshipsfor commercial, industrial and institutional property, other than the FIA'sdamage functions which combine all businesses together. This subject hasnever received comprehensive study in the United States. Commercial andindustrial properties are prone to more damage per unit and more damage per
square foot than residential property; therefore, for more accurate results,it is essential that business damage be given close attention. Funds fordetailed study are becoming scarce. Therefore, it has been the goal of this
* research, and should be the goal of any future research, to develop moreaccurate methods of projecting flood damage with the limited funds that willbe available for comprehensive study.
It should be noted that lack of a comprehensive flood damage data base is notdue to any lack of interest. Many economists throughout the Corps would likethe cost-savings and reliability of a national data base. There is aconsensus of district economists of the need for a central nonresidential data
base for various types of structural damage and homogenous types of commercialcontents for business such as fast food restaurants and self-service gasstations. Standard damage functions depend on a demonstrated reliability.There is no interest in any imposed set of national curves. Corps' economistswill still want a choice of damage functions. There is also a good deal of
skepticism about any set of industrial content damage functions. The nearlyunanimous belief is that industrial content damages are variable for any type
of consistent relationship.
The current situation is that there is a plethora of procedures for evaluatingnon-residential flood damages. The various procedures have been summarized inthis report. The number of procedures in use, and apparent differences
between them, does not imply a deficiency in the system. It does imply thatthere are a lot of untapped sources of information and that referencing, andthe possibility of a centralized data source, may be useful.
49
S]

Some of that referencing has been done in this report. This report may beused as a vehicle to facilitate sharing of information and technology betweenCorps of Engineers' field offices. Its intent is to encourage Corps'
economists to contact their counterparts in other districts directly to sharethe use of damage functions, data bases, survey procedures, and otherinformation. In sharing this information, economists can compare informationon the type of flood situation they are evaluating, i.e., the typicalvelocity, duration, and sediment load, along with the construction material
used in most structures.
A set of variables for depth-damage surveys, along with a suggested set ofstandard definitions is provided in this report. District economists areencouraged to collect information on each of these variables so that more canbe known about the extent and reliability of these variables to thedepth-damage relationship. It is suggested that general acceptance be made ofthese, or another set of standard definitions, so that when the effects of thevariables are analyzed it can be assumed that the same variables are being
analyzed for each study.
* Based on the findings of this study, it is concluded that a great deal morecan be done to assist Corps of Engineer field offices in determining accurate
- depth-damage relationships. The following are recommended actions that wouldprovide valuable assistance to Corps' economists:
1. Compile District Damage FunctionsWe propose development of a data base of business damage functions asreferences for districts throughout the Corps. The data base could beused by districts to compare their own depth-damage functions with thoseof other districts, or to compute damage functions based on their ownneeds and geographic areas. The damage functions would be available inreports and on micro-computer disks. The reports will explain the methodof calculation, including whether the functions were based on actualdamages or synthetic, the geographic area for which the functions werecalculated, the type of flooding involved, and the price level on whichthe functions were based. If the functions are given in absolute dollaramounts, the base price year will be given. The micro-computer disk willbe in a format that would have compatibility when transferred by modeum,with most Corps micro- and mini-computers.
This effort would take approximately four months and cost $40,000. Thiscost includes $25,000 for compilation and documentation, $10,000 forprogramming, $2,500 for illustration, and $2,500 for printing anddistribution.
2. Compare Damage FunctionsDamage curve comparisons have been made for several types of businesses indifferent regions of the country. The functions contain a high degree of
50

variance between districts for the same type of business. Future work canmake more detailed statistical comparisons between damage functions, andexplore reasons for this variance. In further study, it may turn out thatseveral sets of commercial and institutional damage curves emerge asparticularly reliable and could be recommended for national or regionaluse.
This effort would take approximately four months and cost approximately$25,000. This cost includes $20,000 for analysis and documentation,$2,500 for illustration, and $2,500 for printing and distribution.
3. Establish a Cooperative Depth-Damage Collection EffortA valuable source of depth-damage information would be a coordinatedeffort to evaluate potential and actual post-flood damages. This effortwould be established so that every district involved is using similarquestions with the same terminology. District representatives would meetto determine what OMB-approved survey questions should be used, whatquestions may need to be added to the survey lists, how terms found inthese questions should be defined, and what might be the appropriateformat to use for storing and processing the data. There would be a listof Corps' questions that districts would be encouraged to use in theirdamage surveys. Additional questions could be added to meet the needs ofspecific studies. Data would be formated for the Corps of Engineers'central mainframe computer system. The data could be used to calculategeneralized national and regional damage functions. It is recommendedthat generalized functions be computed for commercial, industrial, andinstitutional structures, based on building material and size. Attemptsshould also be made at computing reliable content damage functions forsome types of homogeneous commercial businesses based on two-digit SICcodes. District offices could access the data directly, or download theinformation to a district computer to calculate their own functions.
Funds should be provided for coordinating this effort, programming andanalysis at the national level. Many districts do not have the funds tocarry out depth-damage surveys, let alone the costs of coordinating theeffort with other districts. Funds should be provided to reimbursedistrict coordination costs and part of the data collection costs for thisresearch and development effort.
Two years and $120,000 are required for this project. That includes$10,000 for central coordination activities; $40,000 for the districts'role in data collection, attending meetings and other contacts during thestudy; $25,000 for calculation of national damage functions anddocumentation of the system and the damage functions into a report;$20,000 for printing and computer processing; $5,000 for printing anddist.ibution of reports, and $20,000 for start-up funds for districtsundertaking new surveys.
4. Calculate Susceptibility Indexes.As a barometer of the susceptibility of flood-prone property, it isrecommended that susceptibility indexes be computed for a range ofcommercial and industrial products and for various building fabrics
51
.- 2 2

completely submerged for various lengths of time. This would be anupdating and expansion of the work done earlier by D.J. Parker. Thisinformation would be useful in computing and verifying depth-damagefunctions. The information could be applied to individual businesses,particularly industrial plants, that have large quantities of a given
stock or type of equipment. This study would make extensive use ofexisting data from insurance companies and agencies that deal withdisaster assistance.
This project would take six months and cost $36,000; including $30,000 fordata gathering and analysis, $5,000 for computer programming, and $1,000for printing and distribution of the findings.
5. Develop Field Sampling Techniques.Field sampling techniques to develop accurate estimates of potential flooddamage with limited samples should be vigorously pursued. As statedearlier, these techniques may become necessities in the future if studyfunds continue to dwindle. Sampling procedures would be the product of ajoint effort of statisticians and economists experienced in flood damagesurveys. The goal would be to reduce the necessary work, withoutdrastically reducing the reliability of the product. This research willattempt to answer such questions as, when sampling techniques can beapplied, how to select representative businesses, how to judge the degreeof accuracy of a given sample, and what statistical procedures arenecessary to analyze sample data.
This project would take one year and cost $73,000. The estimate includes$15,000 for initial conceptualization and survey design, $10,000 for asampling of damages of a particular project, $15,000 to complete a surveyof the entire population for the project area, $10,000 to analyze andcompare the sample and population surveys, $20,000 to reconcile thedifferences and establish sampling procedures, and $3,000 for printing anddistributing information.
6. Clarify Procedures for Evaluating Secondary Flood Control Benefits.A great deal more needs to be done to clarify the procedures used forevaluating secondary flood control benefits. As an example, there is awealth of resources available for evaluating business losses.Nevertheless, some confusion exists as to when potential business loss canbe counted as a benefit and what the best procedures are to computebusiness losses. This project will require a review of natural hazardliterature on the quantification of secondary hazard costs, the applicableCorps' regulations, and a sampling of studies that have estimatedsecondary benefits. Proposed guidelines and suggested methods forevaluating secondary benefits would be reviewed by field offices anddiscussed in at least one conference.
This effort would take one year and cost $50,000. The cost includes$15,000 for a literature review, $20,000 to develop and documentprocedures, $12,500 for field review, including conference cost, and$2,500 for printing and distribution.
52
.....................................................................

Summary of Recommended Projects
Costs TimeCompilation of District Damage Functions $40,000 4 monthsComparison of District Damage Functions $25,000 4 monthsCooperative Data Collection $120,000 2 yearsDocumentation of Susceptibility Indexes $36,000 6 monthsDevelopment of Field Sampling Techniques $73,000 1 yearClarification of Secondary Flood Control Benefits $50,000 1 year
Total $344,000
53
,,'.'.'.-'.'.'i."."",.".-"',",",,"..."..-.".....'.........".-...."................ ".. ---.-... -.... ,.... ..- .-- .-.. ........... -.

BIBLIOGRAPHY
1. CH2M HILL. Potential Flood Damages Willamette River System,Section 1, Portland, Oregon: U.S. Army Engineer District,Portland, 1974.
2. Federal Insurance Adminstration. Flood Hazard Function Depth-Damage
Curves, Elevation Frequency Curves Standard Rate Tables,Washington, D.C., 1970.
3. Gordon, Judith Z. Review of the Lake Pontchartrain Hurricane ProtectionPlan Output Data for Additional Contract Requirements, New Orleans:U.S. Army Engineer District, New Orleans, 1980.
4. Gulf South Research Institute. Flood Damage Survey: Sowashee Creek,Mississippi, Mobile, Alabama: U.S. Army Engineer District, Mobile,1982.
5. Gulf South Research Institute. Pearl River Flood Damage Survey, 2 vol.,Mobile, Alabama: U.S. Army Engineer District, Mobile, 1982.
6. Kates, Robert W. Industrial Flood Losses: Damage Estimation in theLehigh Valley, Chicago: University of Chicago Press, 1965.
7. Library of Congress, Reference and Bibliography Section, Geography and MapDivision. Fire Insurance Maps in the Library of Congress: Plans ofNorth American Cities and Towns Produced by The Sanborn Map Company.Washington, D.C.: Library of Congress, 1981.
8. Marshall and Swift Company. Marshall Valuation Service, Los Angeles,(Published annually).
9. McPhadden, David J. Flood Insurance Calculation Computer Program,Washington, D.C.: Flood Insurance Administration (FIA), 1974.
* 10. Northwestern Indiana Regional Planning Commission, Transportation DelayAnalysis, Little Calumet River Project, Indiana, Chicago: U.S. ArmyEngineer District, Chicago, 1982.
11. Penning-Rowsell, Edmond C. and John B. Chatterton. The Benefits of FloodAlleviation and Manual of Assessment Techniques, Westmead, England:Saxon House, 1979.
. 12. Roy, Joseph E. Commercial Property Inventory, Evaluation and ProjectionTechniques for Flood Control Project Analysis, Sacramento,California: U.S. Army Engineer District, Sacramento, 1976.
* 13. Stanley Consultants. Flood Damage Survey for the Tug Fork Valley,Huntington, West Virginia: U.S. Army Engineer District, Huntington,1979.
55
i~~~..i i.. i..... .i. .... ... ....i. ; .i....: . -...... ... .......................... ..... :.... ... ...........

.. ..
14. U.S. Soil Conservation Service. Urban Floodwater Damage EconomicEvaluation (URBI) Computer Application Program, Washington, D.C.,
1982.
15. U.S. Department of Agriculture Soil Conservation Service South RegionalTechnical Service Center. Floodwater Damage Estimates; Residentialand Commercial Property, EWP Technical Guide No. 21 Supplement, Ft.Worth, 1970.
16. U.S. Army Engineer District, Baltimore. Wyoming Valley, Local FloodProtection, Final Phase, General Design Memorandum, Baltimore, 1981.
17. U.S. Army Engineer District, Louisville. Flood Damage Report forFrankfort, Kentucky, Kentucky River, Louisville, Kentucky, 1981.
18. U.S. Army Engineer District, New Orleans. Post Flood Report: Flood of1979, New Orleans, 1980.
19. U.S. Army Engineer District, Norfolk. James River Basin General DesignMemorandum, Phase 1, Norfolk, 1981.
20. U.S. Army Engineer District, Pittsburgh. Expanded Flood Plain InformationReport: Upper Sewickley Creek Basin, Westmoreland County
Pennsylvania, Pittsburgh, 1980.
21. U.S. Army Engineer Hydrologic Engineering Center. DAMCAL (Damage ReachStage - Damage Calculation), User's Manual, Davis, California, 1979.
22. U.S. Army Engineer Hydrol gic Engineering Center. Expected Annual FloodComputation User's Manual, Davis, California, 1977.
23. U.S. Army Engineer Hydrologic Engineering Center. SID (Structural
Inventory for Damage) Ancysis User's Manual, Davis, California,1982.
24. U.S. Amry Engineer Institute for Water Resources. Approved Questionaire
Items for Coll(ction of Planning Data, Washington D.C.: U.S. ArmyEngineers Office of tl.e Chief of Engineers, Directorate of CivilWorks, Planning Division, 1984.
25. U.S. Army Engineer Division, Ohio River. Empirical Investigation ofExistence and Magnitude of a Commercial and Industrial Affluence
Factor, Ft. Belvoir, Virginia: U.S. Army Corps of Engineers,
Institute for Water resources, 1977.
26. Water Resources Council. Economic and Environmental Principles as
Guidelines for Water and Related Land Resource ImplementationStudies, Washington, D.C., 1983.
56
. ...

27. Ward, Roy, Floods, A Geographical Perspective, London: McMillan Press,1978.
28. White, Gilbert F., Choice of Adjustments of Floods, Chicago: Universityof Chicago Press, 1964.
57

APPENDIX A
FLOOD DAMAGE FUNCTION COMPARISON
5 9PREVIOUS PAGE59 IS BLANK

DEPARTMENT %To3.I6
19pE~
D -3--Ft. Worth
-- SAC 1
A 5-- Mobile
FETINUNDAiTION
Figure A-I
Inventory
SCOL
p
ER
A 4@
A 4- MobileE 29 -:- --- Ft. Worth
9 1 2 3 4 5 6 7 8 9 1@
FEET INUNDATION
Figure A-2
Iniven tory
6 1

OFFICE
C -I-SACF- -Mobile :....' -
EN -e- Ft. Worth
DA 4@
G 2@
1 2 3 4 5 6 7 8 9 1@
FEET INUNDATION
Figure A-3
Inventory
RESTAURANTa aT a : a :p --E rc 87f .... /" ..-- -R 8@NT 68 .-"
D I .AA 4 MobileN - SACAI 2:1 .- "i -a-+ Ft. Worth
S * 2 3 4 5 6 7 8 9 19
FEET INUNDATION
Figure A-4
1nventorN
62
0ii
. . .. . " ... ...... . . - ."- . -"-..........". ..... ."..... . .. '.-..-.%.-... .... -...-- . -* *.. ,".-. , "- ." "."...-".,

LODGING
E
ET 60 /
DA 40- -,
A 8, -4- SAC-6- Mobile-e- Ft. Worth
S . , I I I2 3 4 5 5 ? 8 9 is
FEET HINUDTIO1
Figure A-5
Inventory
CLOTEINCzee . _..-. u * : a
P -------
E/N .
D A
A 49-- -4- Ft. WorthA 7 " " 4-SAC
G 2/" -6- Mobile
a 1 2 3 4 5 6 7 8 9 19
FEET IlJNDATIO
Figure A-6
Inventory
63

2'_
.2'
SERVICE STATION166 _..- a a a a a
E Ir
T -- -----Er
6@ ---- /
D
A Ft. Worth
- -#-SAC_ -+- Mobile
. ,, .- - ! I I I I
6 1 2 3 4 5 6 7 8 9 16
FEET INUNDATIOIN
Figure A-7
Inventory
CROCERY STORES106 -- 4o x -- 4
C
E ,
T! 66-'"D . - . -
"/ * SACAG" Ft. Worth
2:- -4r- Mobile8I I I I I ! I
O 1 2 3 4 5 6 7 8 9 16FEE!T IINDATIONI
Figure A-8
Inventory
64
7... . ...... .. ......... ... ......... ..- . -.-. ..% ... ...

DEPARTNENT STORE
IUIt
D7
ASAE 2B Mobile
B 1 2 3 4 5 6 7 8 9 NB
FEET INUiNDTIO4
Figure A-9
Equipment
OFFICE
PIR SC
N
* DN
1 2:-4 Mibile
6 1 2 3 4 5 6 7 8 9 IB
* FEET IiNDAMT[Qt
* Figure A-10
Equipment
65

~RESTAURANT
PIt
7 66
D
S -4- Ft. Worth
c--- Mobile29-- -4- SAC
* I
6 1 2 3 4 5 6 7 8 9 16
FEET INUNDTION
Figure A-11
Equipment
LODCING
PE
INT 66-
NASA
'6
3-E 2: - - M obile
" 1 2 3 4 5 6 7 8 9 I6
FEET INUNHDTION
Figure A-12
Equipment
66
1". ... , ..&t. .. K $:.t.e t-~-......x - .... K .. vx .. V:-... . .

7 7 -
GROCERT STOREP "
89 KE/It Be--"
4- -G-Ft Worth
A -9-SACC ~- Mobile
E 29-
I I ! ,98 1 2 3 4 5 6 7 8 9 Is
FME IMNINTIONI._
Figure A- 13Equipment
CLOTING"
NT69
DA46
-4- Ft. Worth/ "-SAC
E 29 /2/. t I I I I I I
9 1 2 3 4 5 6 7 8 9 19
FEE! IIIN AT!ON
Figure A-14
Equipment
67
. • + . , ,.?+ -+ ,. Z .Z , . . _'+ --+L+.+.. + .*'+ -_. ."
' -', ,+ r " + .- +. - " . --. - ,..... .. .*--"• "

SERIVICE SITION
E
r60-
N 49-- Ft. WorthA .2 -~-Mobile
C / USACE 20
0 1 2 3 4 5 6 7 6 9 to
FEET INMNITIOH
Figure A-15
Equipment
68

IPARTMENT STORE
P I
66-
D4 0--~-
1 fiTVA--a- New Orleans
SI
I I I I I I I
1 2 3 4 5 6 ? 8 9 to
FEET IUIINDATION
Figure A-16
Contents
AtTO SUPPLY
PIt
DA 49-
G / 7 4 TVA
3 1 2 3 4 5 6 7 8 18
FEE INUNDATION
Figure A-17
Contents
69
r ....-. ...........................................
.. .r"' .
.. . . . ..
".
.". .".-"
' ' '' ''' ''' '' :.' ',. "
**.* f....*

RESTAURANT
79--~RC 60
N 50-T
A 1Nq 36-- TVA TVAG; 20 --- -*New OrleansE '"A
9 1 2 3 4 5 6 7 8 ~ 1FEM IMNDATION
Figure A-18
Contents
CLOIIC
E3 8C _______________
E
N - -4-TVA
20Ga New Orleans* 9 -- I I I
* 1 2 3i 4 5 6 7 8 9 1 SFEET IMNDTION
Figure A- 19
Contents
70

CROCI',
It'e-P
y 69
A 49-
F 29-- Now Orleans
FEE! IIINIATIQH
Figure A-20
Contents
5ER11CE STAillS
In
T TVA
23 -e- New Orleans
9 1 2 3 4 5 6 7 8 9 19
FEE ImiNITIOH
h Figure A-21
Contents
71

OFFICE BUILDING: SINGLE STORY, WITHOUT BASEMENT:le P
E
E 4- WoodS41- Metal
T 69 4- Brick and Block
DA 40---
o 1 2 3 4 5 6 7 8 9 16FEET INUNDATION
Figure A-22
Structure
OFFICE BUILDING: MULTIPLE STORY, WITHOUT BASEMENT
PE
CEM -MetalT 6 *9- Brick and Block
DA 4A- -
E26
6 I I I. Io 1 2 3 4 5 6 7 8 9 16
FEET INUNDATION
Figure A-23
Structure
72

APPENDIX B
APARTMENT, COMMERCIAL AND INDUSTRIAL,GOVERNMENT, TRANSPORTATION, AND UTILITIES FLOOD DAMAGE QUESTIONNAIRE
7 3
. . . . . . . . .. . . . . . . .

APART,%ENT, COMMERCIAL & LNDUSTRIAL GOVEXMnTRANSPORTATION, AND UTILITIES
FLOOD DAMAGE QUESTIONNAIREOMB APPROVAL NO. 0702-0016- Expires 31 October 1986
1. What is your address (or township, range, and section)?
2. How long have you been at this address? (Check one)
a. Less than 1 year d. 5 - 6 years
b. 1 - 2 years e. 7 - 8 years
c. 3 - 4 years f. over 8 years (please specify)
3. Regarding the Structures:
a. Principal structure
(1) Type
(2) Age
b. Other facilities
(1) Type(s)
(2) Age(s)
c. Other than principal structure. are there any other highly damageable items
on your property?
(1) Moveable (cars, trucks, trailers, etc).
mat. -_ead±.y-move-ale- (landscaping, electrical equipment, trailer on blocks,etc).
4. What is the size of your property?Square footage under one roof . Site acreage
5. If this is a multi-unit structure, how many units (both residential, indus-
trial, or commercial) are there?
a. How many units are on the ground floor?
b. How many (if any) living quarters units are partly or wholly belowground level?
6. Does the structure have a basement?
Note the number of subbasements if any.
If there is a basement and its square footage is less than the groundfloor, how many square feet?
How many stories are above grade?
P~t4.-
------ ------ ----- ------ -*.4U t4:.. -75
15 . . .

How many stories above ground have the same square footage as theground floor?
How many stories (if any) have less square footage/floor than theground floor? _, square feet/floor
7. What type of sanitary sewage system do you have?
a. Local sewer connection.
b. Septic tank.
c. Private lagoon
d. Other
e. Don't know
8. Please check the type of drainage system used in your area to handlerunoff during heavy rainfall.
a. Storm sewers
b. Ditches or culverts
c. Other
d. Not sure
9. While at this location, approximately how many times did this (type of facility)experience flood damage? (Check one) List dates if p. ible.
a. I time a. Never
b. 2-4 times b. Infrequent (less thznone per year)
c. 5-7 times ORc. Frequent (one to six
d. 8-9 times times pei year)
e. 10-12 times d. More than six times peryear
f. More than 12 times
g. Don't remember
10. Were you aware of a flood problem before moving here? If no, wouldyou have moved here if you had known? If yes, since moving here, have youexperienced?
a. Much more floodingthan expected
b. A little more floodingthan expected
76
o. '..T.T " ".T°' ". " ," " ,, ,T_.' . "" ,T", " '' ,"". "- "-_ " " _'. . . -, , , ,,,, . .@ n, n .- ,
. . i. . a"

c. About as much flooding d. A little less flood-as expected ing than expected
e. A lot less floodingthan expected
f. No flooding was ex-perienced
What are the advantages of this site that offset the risk of loss due to flooding?
11. If you have sustained loss due to flooding, has any damage been causedby impact of debris carried by the floodwaters?
yes -noIf so, approximately what percentage of the total damages was caused by debris?
12. While at this location:
a. What was the deepest flooding experienced?
(1) Less than 2 inches (1) Basement inches
(2) 2 - 6 inches OR (2) First floor inches
(3) 7 - 12 inches (3) Ground flood inches
(4) Over 12 inches (4) Second floor inches
(5) Other
b. Date of flooding
c. Location wherc depth was measured
OR
a. 0-1 foot e. 7-8 feet
b. 1-2 feet f. 9-10 feet
c. 3-4 feet
d. 5-6 feet
13. On approximately what date did you experience the worst flooding duringthe last C ) years?
MonthYear
14. What is your estimate of the market value of this (type of facility)?of Its cdntents ? of the land on which it stands?
77
S > . .... .. .. . .. ... ., . . . .i . . .. " . . . .- - - . . . . .•.. .

- - . .. . . . . . . . . . . . . . .... ~ .
Would your land be damaged by flooding? If so, to what extent at variousdepths?
The following format is suggested:
MARKET VALUE ASSESSED VALUE (if aDnlicable)
Structure
*i Land
Contents
Other
15. Would the value of this property increase if recurrent flooding wereeliminated? If yes, by how much?
16. Are the insurance rates you pay higher than rates for structures outsidethe flood problem area? Do you have flood insurance? If yes, whatis the insured value minus deductable?
17. What is the distance from the ground level to the first flood level?From the ground level down to the basement floor level? At what leveldoes damage begin?
18. Under what conditions did (or does) floodIng occur? (Check all that apply).If you know, please include season of the year, time of day, etc.
a. During any type of rainfall
b. During (or after) extremely heavy rainfall
c. During spring thaws
d. During dry weather
e. Other (please specify)
f. During higher than average tides
g. During extremely high tides only
h. Include dates of flooding, when possible
19. How did the water enter?(Check each that applies)
a. Through windows or doors from street, river, creek or streamoverflow
b. Sewer backup due to clogged sewer line between building andstreet
78
.................................. .... .......... .......-... .- ... .-..... . -. - - ..- .-. .-..-..... ,-..-. ". -... -. ... - . . . .- . -. .

* ~ ~ ~ 7 F~-. - -. ? 7 . T. V ..- -. - ..-
c. Sewer backup -- no obstruction in sewer line between buildingand street
d. Seepage through cracks in walls or floors
e. Don't know
f. Other (Please specify)
20. Was flooding due to electrical failure and inability of sump pump toremove ground water?
21. How long was water present?
less than 1 hour 4-24 hours
1-2 hours more than 24 hour
2-4 hours 2 days
3 days 4 days (or more)
22. How long does it take for flood waters to recede from.... ?
23. Was there significant erosion to your property due to either high velocityof flood water or high elevation?If so, how much land was lost and to what depth?
24. What type of flooding was it --- backwater or headwater?OR (Was the flooding problem caused by water backing up from downstream?)
25. What was the source of flooding? (Name of river, creek, etc.)
26. Cause of flooding? (Rainfall-related or obstructions such as ice jam)
27. Before you moved to this location what, if anything, had been done toreduce flood damage?
28. While at this present location, what, if anything, have you or othersdone to flood proof it? (List approximate costs)
Describe each flood proofing measure including how effective and limitsof effectiveness (water height, duration of flooding, etc.).
a. Measures
b. Effectiveness
c. Water heigh_
d. Duration
29. While at this present location, what has been the impact of the thingseone to reduce flood damages?
79
S"
I- I * .' ** * . ,
P'' ">'" ."*'. " '
.-'
: .- " '"' - " . " ". , - . " . . ' " " " . . . , '' " '. -

(Check one)
a. No impact --- condition remains unchanged
b. Minor lessening of flood damages
c. Moderate lessening of flood damages
d. Major lessening of flood damages
e. Flood damage eliminated
f. Flood damage has worsened
30. Describe time, cost and activities that result from preparing for flooding.How often do you do these activities? What percentage of the time are theyunnecessary because the flood does not reach expected height?
31. Do you take any measure to minimize your flood damages once flood stageor flooding conditions appear imminent?
" If so, do you: (please identify major items)
a. Move items from basement to first floor;
b. Move items from basement to second floor or higher;
c. Move items from first floor to second floor or higher;
d. Evacuate items from the building;
e. Other (please identify)Can you always count on labor being available for your flood fight activities?
32. If you do take measures to minimize your flood damages, please estimatea dollar amount or a percentage by which you decrease your potential flooddamages.
33. How many hours of warning would you need to take practical emergency
measures to protect your family and minimize physical losses?
34. In hours, how much warning did you have before the flood occurred?
35. Flood Warning
Is your area protected by some type of:
a. flood warning system YES NO
b. temporary evacuation plan YES NO
c. other type of flood preparedness plan YES NO
If so, please describe:
* Please evaluate the effectiveness of this (system) (plan).
80
.
• 'l-" -:'-",~~~~~~~~~~~~. .. .. . . . . . . . . . . . . . . . . . . ." '"' "" ' " '' """" "" """" " "' "" "" "" " " "" .. " '" "" "

36. How much advance warning time do you generally have before a flood_ _
37. Do you feel that the above described flood warning/preparedness plan hasreduced your past flood losses?
a. YES HOW
b. NOTf so, by how much have your flood losses been reduced for specific floods?
Flood Date Reduction in losses0% 5-10% 10-25% 25-50% 50% or
greater
38. For the flood, how much time did you spend in flood prevention (i.e.shields, relocating contents, sand bagging, etc.)?
39. Do you know if any measures were taken by public agencies to reduce damagesto your area? If so, what were they? Have theybeen effective?
40. Has your facility been flooded in the past? If so, please describeyour damages by type and amount, as the water level increases from where damagebegins.
Month/Year Depth of water above Damagefirst floor (ft) sustained (S)
41. Based on past experience, or your best estimate, please furnish damageestimates for the following depths of flooding above your first flood -- (with)(without) flood warning.
Depth of flooding(below) Damage to Damage to Other 1/ Damage to(above) first floor (ft) structure($) contents(S) damae vehicles(S)
Total Damage($)
1/ Break out shutdown time, business cost, and emergency costs.
42. Have you noticed a more rapid deterioration of sidewalks, walks, drive-way, etc. which are flooded than those areas which have not?How often is major maintenance or replacement required on those floodednot flooded ?
43. Were the various repair costs at the time of the flood higher than normalfor such repair?
44. Did you incur any emergency expense associated with preparing for theflood? (Sandbagging, truck rental, storage, etc)Specify amounts
81

L.-
45. What emergency measures did you take to prevent damage?How much did these measures cost? Row much damage was prevented? (S)
46. Did you take any of the following emergency measures?
a. Raise damageable items above floor level
b. Sandbag around your property_
c. Place plastic or other sealer around openings to keep water out
d. Evacuate damageable property
e. Did you allow the basement to flood in order to preventwalls from collapsing? yes, no.
47. For the (last)(most serious flood event) or (flood of...) please estimatethe number of person-days spend away from the job because of flooding problems.
a. number of days lost from work
b. estimate the effect of flooding on employees income due to missingdays of work
c. estimated increase in transportation costs due to flooding
d. to what extend will the lost income reflected in b. above be madeup in this facility or elsewhere
48. Can you estimate the loss in profit for your establishment during period-. of flooding (most recent floods)?
- 49. Has there been any loss of production for your establishment during periodsof flooding (most recent floods)? If so, how much loss and the dollar amount?Has the loss of production been made up by other firms or offices?
50, For the (last) (most serious flood event) or (flood of...) estimate thenumber of person-days spent cleaning up Cost?
51. Did the flood cause damage to your water supply?If so, what were your losses due to this damage?
. 52. What are the present uses of basement areas (or areas below ground elevation)
in your building? (Check all that apply)
a. Parking garage -
b. Heating equipment
c. Hot water heater
d. Garden apartment(s)
e. Storage for residents
82
%. " ' "..".... ...... "."..."'"'".'".."".. .

f. Other storage
g. Laundry equipment
h. Workshop
i. Air conditioner
j. Common use area (social, party, recreation room(s)
k. Other
53. During periods of shutdown resulting from flooding, what is the valueof your fixed overhead that continues even though you are not operational?
54. What are your annual average sales? $
55. What is your average annual operating costs (sales less net income)?
56. What amount of your lost business would be recovered following continuationof normal operations after flooding?_percent
57. What is the relationship of sales to inventories in your operation, i.e.,what percent of inventories do you keep on hand?
58. Do your inventories increase in a direct proportion to increased sales?yes no Please explain
59. Do you know other businesses which would be adversely affected if yourbusiness were to close down during flooding? This could be businesses thatsupply inputs to you or business to which you supply products. If your busi-ness was closed down due to flooding, would they have alternatives whichwill allow them to continue production at their current levels?
60. If your equipment were damaged during flooding, could you estimate therepair costs and salvage value of the equipment (at stages of flooding)?
61. What type of water supply system do you have?
(a) public(b) private(c) do not know
62. How often do you have flood-related repairs?
63. Does preparing for the flood emergency cause you to reduce businessoperations?
64. Will you use your employees to help clean up and repair damages due toflooding? If not, which service will you use?
83

' .' . '. -. ',. . - ,. j .. I - .- - r -- w . 7:'_ ,. - . .'
- - " • " . -
65. Identify and estimate the value of each major item and describe it
including its position relative to the main floor.
a. Items
b. Values
66. a. How are major items damaged?b. What are the repair costs?
(1) Under 1 foot
(2) 1 to 2 feet
(3) 3 to 4 feet
(4) 5 to 6 feet
(5) other_
67. Please indicate and describe any critical point where damages dramaticallyincrease
68. Has there been settling of your first floor? If yes:
a. To what extent (in feet)b. Do you anticipate any problems as a result?c. Do you anticipate further settling?
Do you or this business own, have a mortgage on. or rent this structure.
69. "During the past floods, have you experienced a disruption of utilities(water, gas, electricity, etc.)?"
70. "As a result of past flooding, have you considered selling and/or movingto a flood-free area?"71. "Have any of your vehicles, including cars, trucks, campers, trailers,
* etc., been damaged by flooding at this address?"
72. What is the average daily sales volume?
73. What is average daily employment?
74. What is the average hourly or daily wage, including fringe benefits?
75. If your company is involved in manufacturing, what is average daily
production (units of output)?
76. How many days of production or sales were lost due to flooding?
Specify"- number of days flooded- number of days required for cleanup.- number of days lost for other reasons (indicate the reasons--e.g.,
84
.- . . . . . . . . . . . . . . . . . ......--'- - -'- .' . ' ."- -'-: "" .. . . . . . . ..... " " "" " .. - . . . '' ' '

transport problems, start-up time, employees absent due to cleanup of resi-dential properties).
77. If applicable, how much lost production can be made up by:
- overtime (specify increased production cost for overtime afterthe flood event)?
- transfer of production to other plants within the company(specify the increased cost)?
- deferred production to times or seasons in which excess capacitytypically occurs (explain)?
78. If applicable, how much lost sales can be made up by:
- transfers of sales to other stores/outlets within the company atother locations.
- increased sales at the same store/outlet after the flood event*. " (deferred purchase)?
- transfer of sales to other stores outside the company?
79. Aside from actual losses due to flood events, does the threat offlooding affect productivity or sales volume? (If so, explain.)
80. Has the threat of flooding influenced decisions regarding:
- purchases of new production equipment?
- construction of new buildings?
- expansion of production or sales capacity?
(If yes, explain each.)
* 81. Do you have any plans to build new facilities at different locationsin the subject area? (Explain.)
82. If the flood threat were eliminated by structural measures,
- would decisions to purchase new equipment, build new buildings". or expand capacity be different?
- would you still make the same plans regarding new locations?
(Explain each response.)
83. If a diaster or emergency was declared in your area, did you receiveassistance or loan from any of the following?
a. Small Business Administration: Loan $ Interestpercent Number of years
b. Other Federal, State or local agency (specify)
85

84. In case of diaster or emergency in the area, were you an owner-occupant within a multi-family structure Yes No If yes, didyou receive assistance or loans from any of the following:
a. Small Business Administration: Loan$ Interestpercent Number of years
b. Temporary Housing from to
c. Limited Home Repair$
d. Individual-Family Grant Program $
e. Red Cross $
f. Other $
86
* . . . . . . . . . . . . %o.

8.If a disaster or emergency was declared in your area and you wereowner of a single family unit, owner of a unit within a multi-familystructure, or tenant, did you receive assistance from any source orincur disaster related expenses?
Yes NO If yes, answer questions applicable to youfrom the following:
a. FDAA Individual Family Grant Program (IFGP). Grant $_____
b. FDAA Temporary Housing or nonassisted living away from damaged home.
* Period from _______to ______.Number of occupants of
temporary housing unit ___
* Difference in daily driving mileage and time due to location of
temporary housing. Mileage ____and time ______ hourly
P wage $ .Other expenses incurred due to living away from the
damaged residence. Daily average $ .Evacuation and relocation
expenses $ .Continuing fixed costs on the damaged residence of
one percent (or as applicable) of pre-f load value of damaged residence
for monthly investment cost $_____ and .2 percent (or as applicable)
for monthly cost of utilities $______
* c.FDAA Limited Home Repair Assistance. Amount $_ ___ Expenses of
- leaving and returning to the damaged home $ .Square footage
* of unusable living space within damaged home. Feet ___.Fair
market rent of unusable living space at 25c per square foot (or as
* ~applicable) per month $______ and cost of utilities consumed in
- unused part of the residence $ .Cost of unusable garage
based on five percent of the fair market rent per square foot per
month $_____
87
142.
S,... - . .. . . . . . .~ *.* **.'.*-.** **1*'**.~.~* -~* **** **. *** **-

Cost of unusable furnished basement based on 20 percent of the fair
market rent per square foot per month $ . Cost of unusable
unfurnished basement based on 10 percent of the fair market rent per
square foot per month $ . Period of permanent repair from
_ _ _ to . Other expenses incurred during the
permanent repair period $
d. Subsidized SBA or FmHA home repair loan. Loan $
From . Interest percent. Number of years
Cost and expenses of obtaining the loan.
e. Nonsubsidized loan. Loan $ . From .
Interest percent. Number of years . Cost and expenses of
obtaining the loan $
f. Assistance from ASCS $_.
g. Assistance from other Federal, State, or local agency (specify)
h. Food stamp assistance $_.
j . Disaster unemployment assistance $_...._ .
Assista ic'. from Red Cross $ . Mennonite Disaster Service
$ . Salvation Army $ . Other $_.
k. Expenses incurred in flood fighting _
1. Did you assist other fiod victims? If so, amount $
m. HUD housing rehabilitation assistance (Section 407, Housing and Community
Development Act). Amount $ . If all or part of this
assistance was earmarked for flood proofing such as raising structure,
indicate $
88

86. If a disaster or emergency was declared in your area and your businessproperty or activity was affected by the disaster and your businessproperty or activity was within the disaster site or the impact areaadjacent thereto, did you receive assistance from any source or incurdisaster related expenses?
Yes No . If yes, answer questions applicable to you fromthe following:
a. Subsidized SBA business repair loan. Loan $ . Interest
percent. Number of years . Cost and expenses of obtaining the
loan $
b. Nonsubsidized loan. Loan $ . From .
Interest percent. Number of years . Cost and expenses
of obtaining the loan $
c. Assistance or loan from any other source (specify) .
d. Did you receive assistance from RUD Urban Development Action Grant
(UDAG) program? If so, specify_
e. Was your business closed temporarily as a result of the disaster? If so,
give estimates of costs incurred:
Salary paid to employees who did not work $_.
Employee income losses $
Fixed costs of closure $_.
Overhead $
Loss of profits from lost sales $_.
Expenses related to reopening other than repair cost $
.5 89

f. Upon re-opening, was there a part of the business still closed for
repair? If so, give estimates of costs incurred.
Salary paid to employees who did not work $
Employee income losses $
Fair market rent of unusable business space at $ per square
foot, per year during the repair period from to .
Cost of utilities consumed in unused business space $
Overhead $_.
Loss of profits from lost sales $
Other expenses related to restoration of unused space other than repair
cost $
g. Was your business closed permanently as a result of the disaster? If so,
give estimates of costs incurred.
Liquidation of lease, if applicable $_.
If owner of closed business buildings, estimate fixed costs based on
the fair market rent for affected buildings $
Liquidation of business inventory $
Other expenses related to going out of business $
h. If your business was located in the impact area and did not experience
,closure but your sales and work force were affected, estimate the following:
Salaries paid to employees who did not work $
Employee income losses $
Loss of profit resulting from reduced sales S
i. Did you incur expenses in flood fignting? $
90
.. - -.o.,-... --. ..-.-..-.. % :-.............-.. .... . ... . -" . -. .. " . . N .b . * m-. ' . -.-

-,~~-V -.-- -.--
j.Would you be willing to estimate the losses of your out-of-town
distributor? Estimate $ .If this is not possible. olease
give the name and address of your distributor.
Name _____________________
Address_____________________
Telephone Number ______________
k. If this facility is a trucking or transportation company, please
estimate your loss as-a result of cancelled trips $_______
and associated cost $_______
1. If this facility is a utility company, please estimate the cost of
restoration, replacement and repair of your facility including adminis-
trative cost $_______ and associated costs $_______
m. If this is a non-profit organization (church, civic club, charitable
organization, youth organization, etc.), please estimate your
assistance effort (specify) $_______
91

.ECORD OF rOOD DAMACF tNTERVTEW AND FIELD SUIVEY s APPROVAL mo. 0702-0016-t "7 .ARflENT, C ft&L & INDUSTRIAL GOVERNMM, TRANSPORTATION, AND UTILITIES DAM2AGE
RIVER SUURACII NO. FLOOD
ADDRESS TYPE OF IUSINESS
I2TERVIEW DATE __________
WILDINC TTPE 51=0______11103 SIZE ___FT BY ___FT; ________SQ FT
BUILDING !LOORS _________GARDEN LEME _________
(ZASM0T, lar.'8 3rdi- (LsoI/dI3rd/_)
STREET E.VA-:7_______ 19 19 19 19(MEAN SEA .ZW. ACE~~l ACTUAL WUT~DVND LVA~JMvALUE WEItOO M ISOOD 1I. PLS
f~1. 0ON I FIGHT Mo -IN .FTET
ELVAT10NT Z R!, (!t St0) FT FT FT FT
HATXR SURFACE r.ZPA7:3 FT 7 FT PT FT
DEM OF F3aODWAE VEU ETMY)(lst FLOOR) FT Fr FT FT
Z.IAGE TO TRANSPORTATo,:1. Roads. Bridges. Streets, Walks, ParkingS S S S2. Rail Beds and Tracks______3. Rerouting Trains, Trucks, Cars & Busses.____4. Docks 4 Loading Facilities _____ ___
WA'GE TO BUILDINGS (Material & Labor Cost)5. Foundation and supports6. floors (Steal)(Cancrete)(Wood)______7. Floor Covering C~eam
(Ceramic) (Linoleum) (Carper) ______
S. Exterior Wlls (Block/Brick)(Metal) (Hood) and Insulation _________ ______
9. Windows ____ ___________
.1* 10. Interior 'Jells and Coilings ____
11. Doors and MIoldings
DAMAGE TO 3UILDING UTILTES (Type andLocation) B - Basemnt; G - Ground Floor;R - Roof12. Sewer Systems (Storm)(tndust)(Sanitary ____ _____
L3. Water Supply Systems (Treatment)(Pipes;____ ___________
14. Water Systems (Hot Jeter)(Softening) ____ ___
15. Cosunication Systems (Bell)(Other) ____ ____ ___ ___ _____
16. Electric Power Transformers(On Pole/Ground) __________ __________
17. Else. Service Entrance and Meters __________ ___ __________
16. Engines/Generators/Alternators __________
19. Other Elac. Control Panels and-Cir. Breakers _____
20. 4iring. Switches, Sutlecs, Lighiting ____ ____
21. Fuel Supply (Oil %.nks)Gax ?ipasifMtoers)_____ ____
22. Heating (Oil)(Cas)(Elec.)(Air)(Water) (8/(/ R)___________
23. Air Cond. (Cas)(Eloc.)(Cooi)(Clean)(Dehueidify)(U/C/R)
24. (Conv.-yors)(Cl..v.itors)(Ecailncors)(Aisto. D.ors) _____ __________________
25. Foundry Furnncel end Weolding Equipent _______________ ____ ____
26. Sieht,~e Tools amd Paterns _____ _____________
27. Other Motors tmd Fagtiics _____ ______ _______
283. Cn,.mr.-ors ___________
2*j. Ro,.ft cr~iton t'nits I
__L1/ May'e difference in water level due to flood fiqht.
9 2
.2. .

Y~~ ~ ~ if -NW'
XP.ACtNENT ACTiIAI. -_T1 -
VAIIIi: Ti ii ('oon .S Ftoon PLUS'lK-Sl .0)0) FP "I:T _ FIT
30. Hand and Paint Tools $ S $ S
3t. Other Equiement32. Display Cases, Counters, and Bls33. Appliances (Ovenltanga/llood P Fan)
(R0frig.) ( )34. Furniture (Off ice)(Furnlehed Apartmcnt3S. Apartment Tenant
Property
rMNAGZ TO36. Parts/lta Material37. Pertly Assealed/Processead Product36. Merchandise
G&A.InA~ry or grain in storage
40 1100d Fight41. Zvcuatiou (Order)(Teaunt)42. Loss of Vegs4. Removal of Debris & Damaged ItemsiA. Disi fecting. Other Cleaning/
lhabizit oationi4. A eplacment of Records
46. Loss of (Sales)(Rtot) Due to anter-, rupti of Buiness $ /it) (W,47. Los of Gross Income due to Incer-
rupti n of Business S /vk) mo4B.Lose of Net Incone Dim to Inter-
ruptim of Business49.Alternative Operating Costs5O.odbet of Employees
S & SKZT1ZrS:
APARTH t UIS O (T(T: A LM/ t/2d/3rdLJCt (BASE, /l I2d/3rdI.2
NO or N0COT.LTJ
=rOIG~~f E IENCY I BRt 2 BR /1 BATH -2 BR/2_BATHS 3 BR 4- 3R GARAGES 41 '
PI;z
6-Plex
2-Pler
24-Plex
2 or CL
lat. 2d. 3rd I
AV. Sqt/Apt._
Av. Sq 1t Hallvays (Tile)(Carpet) on (Concrtee)(ood)
*V. Sq Ft Utility Room (Tile)(Carpet) on (Concrete)( ;ood)
no. of Employees - Apc/Public/Buslness_ Average age/.1ath, Including Benefits
M_ an (day) (wdek) (mostch) en Od r'oight._An (day) -'.'eak (;.onch) on Layoff
UMan (day) (week) (munth) en Cloanup/RemovalMan (day) (week) (month) on DisinfectHMan (day) (week) (enth) on Other Cleanup and Rchabilitation
Man (day) (week) (month) to Restore Records
nUtLUtNG
v 93
UU)+i ____________________________________________
;q ,-. i ....... o.. .i.-? L'. Ti.,.-... ____.... __., ._._ ._ .._ ..__ -_ . .._____..__.__.. ..._-_.....-..._...... ..._..___--_--.-_-_.._._-___._-._-_. ..

0MB APPROVAL No. 0702-0016
88.FLOOD0 DAM4AGE SURVEYCOMMERCIAL DAMAGES OR INDUSTRIAL DAMAGESC
LOCATION ODA?t Of INTRgVIEW
NAME of SUSINECSS FIRI
ADDRESS
COMs TI~Y 00 lNKEgf.ATE AEA DO*004 No0.
TYPE OF SUSINSS OR_ INDUJSTRY '40. orDESCRI PT ION a-POTIIS
MAIN ULOIJEG CONSTRUCIONc SmtOIS GROUNDS __L_4CE____E
4 ~ ,VALUE OF STRUCTURES I
FLOOR A 9lALJ AWL.__ __
FLOOD0 OF FLOOD0 OF FLOOD air FLOO0 Of310010o RECORD RECORD RECORD
OATt OF 111.400, LESS FEET III*) PLUS FEET LESS FCE
916dI~.44ie
DZITIN Of FLOOD AftYK;
street L#.01
Bassoons Floor_______ ______
First Floor________
S. dFor 1STOIRI CAL DATA // A.- .i 4 7-SAS USINESS on PRODU~CTIOmNiNPt ojhin OWIN FL 'X
Mtff SA1.0,115 LAID 0FF
Averag
PRIM1AZY DAMAGES /~>44 /,.'~~v
100111AL DAMAGES / 2 ~ ~ ~
Damaes te merchandise
Oceegee to Fioiohed Product ______ ____________
Damages t Ic oeed$_0 *nd ce
TOTAL 10111ALM. *fIS
£8102? LOM DANAGES/
Feendetlec, Failure '
Unuscual Ireesiree _______
Cart. Truelts. eto
Ses"ebs e e
Fleefigstaq.Became faets and Similar Leasee
Z 0 t Is% rneuisuti" P udaese
ITOTAL. PNINAR? DAmAGE
S706 ocnaes ee ecm M0. is Ise 6I1. e em O 07S :o..I- se&t 08seClT9
94

-F -
APPENDIX C
BUILDING COLLAPSE CURVES
95

Appendix C
The charts in this section illustrate the combination of depth-damage and
velocity that are likely to cause buildings of various construction material
* and structure type to collapse. These functions were developed by the
Portland District Corps of Engineers for the Wilamette River System. The
functions were developed for the following classes of buildings:
o Class A - Structural steel columns and beams with nonbearing walls.
0 o Class B - Reinforced concrete columns and beams with nonbearing
walls.
o Class C - Masonry or concrete load bearing walls.
o Class D - Wood or steel studs in bearing walls with wood or steel
frame.
97...--OUS
97 .is. .

30 __ _ _ _ _ _ __ _ _ _ _ _
COLLAPSE
20 3-STORY___I- KEY
wU-
z
Lu
8
0 2 4 6 81OVERBANK VELOCITY IN FEET PER SECOND
BUILDING COLLAPSE CURVE FIGURE
____ CLASS D WOOD BUILDING jC-iDEPART4ENT OF THE ARMY PORTLAND DISTRICT CORPS OF GNERS
98

30 __ _ _ _ _ _ _ _ _
200
U. 0
~15 p
00
0
COLLAPSE
5 _ _ _ _ _ _ _ _ _ _ _ _
NO
COLLAPSE
KEY
0 o_ __ _ _ _ __ _ _ _
0 2 4 6 8 10OVERBANK VELOCITY IN FEET PER SECOND
FCrH MBUILDING COLLAPSE CURVE FIGURE
DREPARTMENT OF THE ARMY PORTLAND DISTRICT CORPS OF ENGINEERS
99
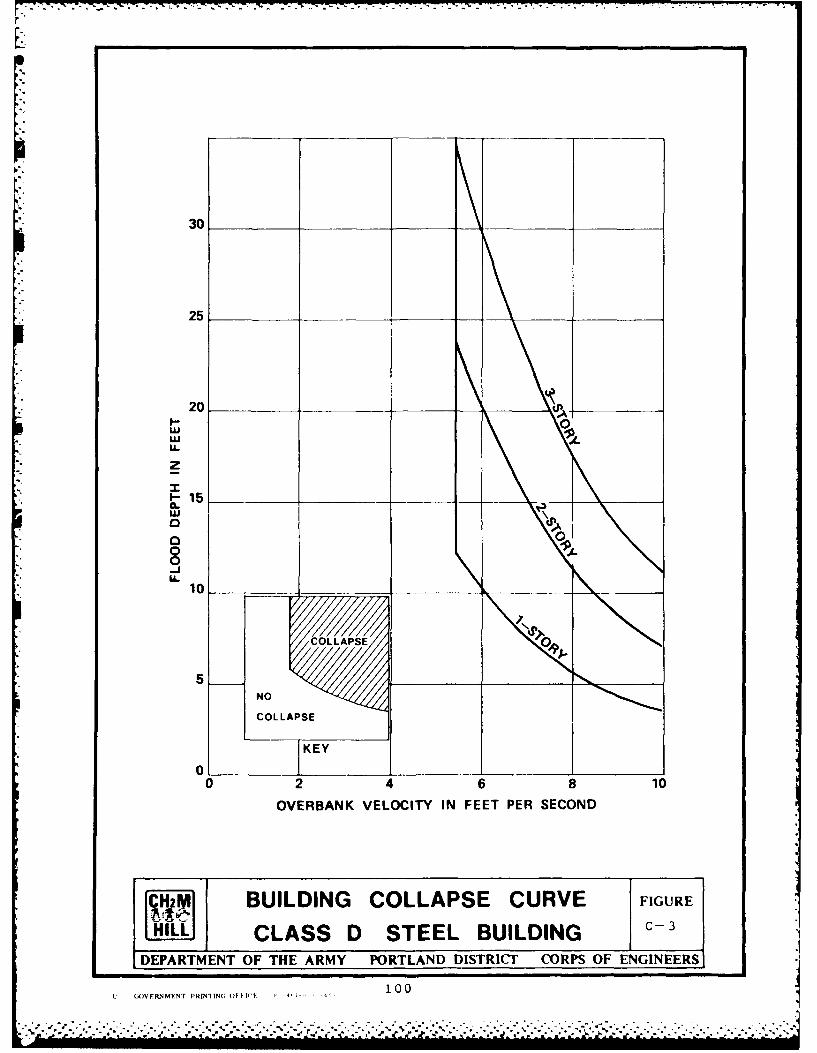
30
25___________
20-9 0
IL
z
~15
o 0
I-
NON
COLLAPSE
KEY
0l I__ _ _ _ _ __ _ _ _ _ _ I__ __ _ _ I__ _ _ _ _ _ _ _ _
0 2 4 6 8 10
OVERBANK VELOCITY IN FEET PER SECOND
WCH2MI BUILDING COLLAPSE CURVE FGR
HILL CLASS D STEEL BUILDINGC-3D!EPARTMENT OF THE ARMY PORTLAND DISTRICT CORPS OF ENGINEERS]
U A) ,FRNMENT 'RINTN(IfN W 1 10