analysis of 100-lb (445-n) lo -lch reaction f 2 4 … · control engine impulse bit performance ......
TRANSCRIPT
William M. Marshall and Julie E. KleinhenzGlenn Research Center, Cleveland, Ohio
Analysis of 100-lbf (445-N) LO2-LCH4 Reaction Control Engine Impulse Bit Performance
NASA/TM—2012-217613
June 2012
https://ntrs.nasa.gov/search.jsp?R=20120012961 2018-08-30T02:04:01+00:00Z

NASA STI Program . . . in Prof le
Since its founding, NASA has been dedicated to the advancement of aeronautics and space science. The NASA Scientif c and Technical Information (STI) program plays a key part in helping NASA maintain this important role.
The NASA STI Program operates under the auspices of the Agency Chief Information Off cer. It collects, organizes, provides for archiving, and disseminates NASA’s STI. The NASA STI program provides access to the NASA Aeronautics and Space Database and its public interface, the NASA Technical Reports Server, thus providing one of the largest collections of aeronautical and space science STI in the world. Results are published in both non-NASA channels and by NASA in the NASA STI Report Series, which includes the following report types: • TECHNICAL PUBLICATION. Reports of
completed research or a major signif cant phase of research that present the results of NASA programs and include extensive data or theoretical analysis. Includes compilations of signif cant scientif c and technical data and information deemed to be of continuing reference value. NASA counterpart of peer-reviewed formal professional papers but has less stringent limitations on manuscript length and extent of graphic presentations.
• TECHNICAL MEMORANDUM. Scientif c
and technical f ndings that are preliminary or of specialized interest, e.g., quick release reports, working papers, and bibliographies that contain minimal annotation. Does not contain extensive analysis.
• CONTRACTOR REPORT. Scientif c and
technical f ndings by NASA-sponsored contractors and grantees.
• CONFERENCE PUBLICATION. Collected papers from scientif c and technical conferences, symposia, seminars, or other meetings sponsored or cosponsored by NASA.
• SPECIAL PUBLICATION. Scientif c,
technical, or historical information from NASA programs, projects, and missions, often concerned with subjects having substantial public interest.
• TECHNICAL TRANSLATION. English-
language translations of foreign scientif c and technical material pertinent to NASA’s mission.
Specialized services also include creating custom thesauri, building customized databases, organizing and publishing research results.
For more information about the NASA STI program, see the following:
• Access the NASA STI program home page at http://www.sti.nasa.gov
• E-mail your question to [email protected] • Fax your question to the NASA STI
Information Desk at 443–757–5803 • Phone the NASA STI Information Desk at 443–757–5802 • Write to:
STI Information Desk NASA Center for AeroSpace Information 7115 Standard Drive Hanover, MD 21076–1320
William M. Marshall and Julie E. KleinhenzGlenn Research Center, Cleveland, Ohio
Analysis of 100-lbf (445-N) LO2-LCH4 Reaction Control Engine Impulse Bit Performance
NASA/TM—2012-217613
June 2012
National Aeronautics andSpace Administration
Glenn Research CenterCleveland, Ohio 44135
Acknowledgments
The authors greatly acknowledge the entire facilities team which operated the Altitude Combustion Stand (ACS) facility and made testing possible. Additionally, the support received by the NASA Glenn Materials Branch is also appreciated,
as well as discussion and insight provided by the engine manufacturer, Aerojet. This work was supported by the Propulsion and Cryogenic Advanced Development (PCAD) project, which was part of the
NASA Exploration and Technology Development Program (ETDP).
Available from
NASA Center for Aerospace Information7115 Standard DriveHanover, MD 21076–1320
National Technical Information Service5301 Shawnee Road
Alexandria, VA 22312
Available electronically at http://www.sti.nasa.gov
Level of Review: This material has been technically reviewed by technical management.

NASA/TM—2012-217613 iii
Contents 1.0 Introduction ............................................................................................................................................ 1 2.0 NASA Glenn Altitude Combustion Stand Facility ................................................................................. 2 3.0 Propellant Conditioning Feed System (PCFS) ....................................................................................... 3 4.0 Hardware Description ............................................................................................................................. 3
4.1 Exciter Sources ............................................................................................................................. 4 4.2 Injector .......................................................................................................................................... 5 4.3 Columbium Chamber ................................................................................................................... 5 4.4 Instrumentation ............................................................................................................................. 5
4.4.1 Mass Flow Rates ............................................................................................................... 6 4.4.2 Thrust Measurement ......................................................................................................... 7
4.5 Timing and Permissives ................................................................................................................ 8 4.6 Test Matrix ................................................................................................................................... 9 4.7 Hardware Issues During the Test Series ....................................................................................... 9
4.7.1 Restricted Abort Windows and Ignition Delay ............................................................... 10 4.7.2 Inoperative Methane Recirculation Pump ....................................................................... 10
5.0 Methodology ........................................................................................................................................ 11 5.1 Definition and Calculation of Impulse Bit (I-bit) ....................................................................... 11 5.2 Objectives of Pulse Testing ........................................................................................................ 12
6.0 Results .................................................................................................................................................. 12 6.1 Uncertainty Analysis of I-bit ...................................................................................................... 13 6.2 Impulse Bit Testing Results ........................................................................................................ 15 6.3 Compact Unison Exciter ............................................................................................................. 20 6.4 Anomalies Observed During Test Series .................................................................................... 20
6.4.1 Thrust Stand Ringing ...................................................................................................... 20 6.4.2 Thrust Stand Zero Drift ................................................................................................... 21 6.4.3 Double Pulse Phenomenon ............................................................................................. 22 6.4.4 Temperature Rise in Feed System ................................................................................... 26 6.4.5 Columbium Coating Damage .......................................................................................... 27
7.0 Summary and Conclusions ................................................................................................................... 30 8.0 Related Work ........................................................................................................................................ 30 References ................................................................................................................................................... 31 Appendix A.—Acronyms and Symbols ...................................................................................................... 33 Appendix B.—X ray and Scanning Electron Microscope Results.............................................................. 35
B.1 X ray Diffraction: Undamaged (Baseline) .................................................................................. 35 B.2 X ray Diffraction: Damaged ....................................................................................................... 36 B.3 Scanning Electron Microscope Undamaged ............................................................................... 37 B.4 Scanning Electron Microscope Damaged ................................................................................... 39
Appendix C.—Test Data Log ..................................................................................................................... 41


NASA/TM—2012-217613 1
Analysis of 100-lbf (445-N) LO2-LCH4 Reaction Control Engine Impulse Bit Performance
William M. Marshall and Julie E. Kleinhenz National Aeronautics and Space Administration
Glenn Research Center Cleveland, Ohio 44135
Summary
Recently, liquid oxygen-liquid methane (LO2-LCH4) has been considered as a potential “green” propellant alternative for future exploration missions. The Propulsion and Cryogenic Advanced Development (PCAD) project was tasked by NASA to develop this propulsion combination to enable safe and cost-effective exploration missions. To date, limited experience with such combinations exist, and as a result a comprehensive test program is critical to demonstrating with the viability of implementing such a system. The NASA Glenn Research Center conducted a test program of a 100-lbf (445-N) reaction control engine (RCE) at the Center’s Altitude Combustion Stand (ACS), focusing on altitude testing over a wide variety of operational conditions. The ACS facility includes unique propellant conditioning feed systems (PCFS), which allow precise control of propellant inlet conditions to the engine. Engine performance as a result of these inlet conditions was examined extensively during the test program. This paper is a companion to the previous specific impulse testing paper, and discusses the pulsed-mode operation portion of testing, with a focus on minimum impulse bit (MIB) and repeatable pulse performance. The engine successfully demonstrated target MIB performance at all conditions, as well as successful demonstration of repeatable pulse widths. Some anomalous conditions experienced during testing are also discussed, including a double pulse phenomenon, which was not noted in previous test programs for this engine.
1.0 0B0BIntroduction
To enable future exploration of the Moon, Mars, and beyond, next-generation propellant systems are being developed. With an emphasis on nontoxic, “green” propellants, liquid oxygen-liquid methane (LO2-LCH4) has risen to the forefront. LCH4 is an attractive propellant because it does not require the strict thermal storage requirements of hydrogen (due to its larger density and higher boiling point), nor does it require the rigorous handling protocols of toxic hypergolic propellants. It also has the potential, when paired with LO2, to produce higher specific impulse than either the existing hypergolic or LO2-kerosene systems. This higher specific impulse and improved storage capability could reduce vehicle mass when compared with hydrogen-based systems, since smaller propellant storage and management would be required. Not only is there a potential for decreased vehicle mass, these propellants can also be produced on Mars using local resources. Prior work with this propellant combination is limited, so a goal of the NASA Propulsion and Cryogenic Advanced Development (PCAD) project was to examine the feasibility and performance characteristics of these systems (Refs. 1 to 3). In particular, there is interest in demonstrating repeatable and reliable ignition of an engine over a wide range of valve inlet temperatures (from liquid-liquid operation to gas-gas operation), especially at vacuum conditions (Refs. 3 and 4). To facilitate this, a 100-lbf (445-N) LO2-LCH4 Reaction Control Engine (RCE) was developed by Aerojet Corporation (Ref. 5). In late 2009 and 2010, this engine underwent a series of tests in the Altitude Combustion Stand (ACS) at the NASA Glenn Research Center (Refs. 6 and 7). Two specially designed Propellant Conditioning Feed Systems (PCFS) were developed to enable precise propellant temperature control. The first test series (Refs. 6 and 7) at ACS examined specific impulse performance with burn durations up to 7 s. The engine met the Isp,vac goal, achieving an overall average Isp,vac of 305 s, ±4 percent.
NASA/TM
Performanbelieved t
Sinceon impulstarget conLO2), (2) which is twith a targconditions
2.0 1B1BN
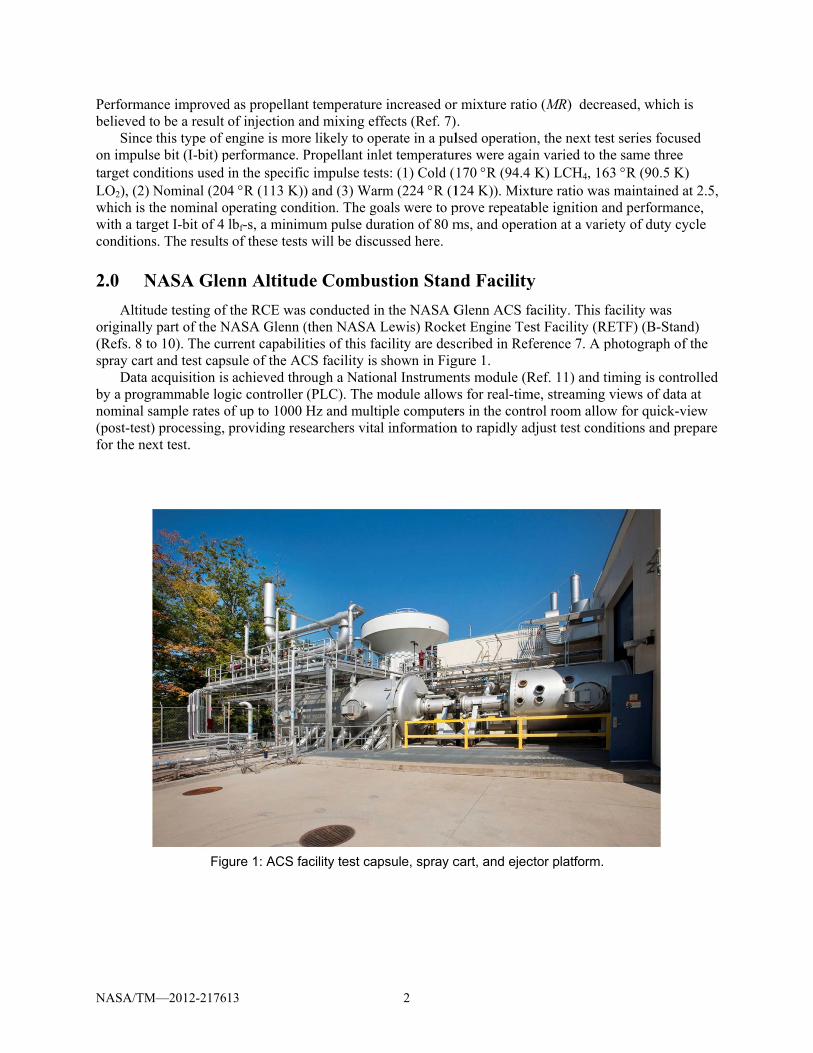
Altituoriginally(Refs. 8 tospray cart
Data aby a progrnominal s(post-test)for the ne
M—2012-21761
nce improvedto be a result this type of e
se bit (I-bit) pnditions used Nominal (204
the nominal oget I-bit of 4 s. The results
NASA Glen
ude testing of y part of the No 10). The curt and test capsacquisition isrammable log
sample rates o) processing, xt test.
Fig
13
d as propellanof injection aengine is morperformance. Pin the specific4 R (113 K))
operating condlbf-s, a minim of these tests
nn Altitud
the RCE wasNASA Glenn (
rrent capabilisule of the AC achieved thr
gic controller of up to 1000 providing res
ure 1: ACS fa
nt temperatureand mixing effre likely to opPropellant inlc impulse test) and (3) Wardition. The go
mum pulse dus will be discu
de Combu
s conducted in(then NASA Lities of this faCS facility is ough a Nation(PLC). The mHz and multi
searchers vita
acility test cap
2
e increased orffects (Ref. 7)perate in a pullet temperaturts: (1) Cold (rm (224 R (1oals were to pration of 80 mussed here.
stion Stan
n the NASA GLewis) Rocke
acility are descshown in Fignal Instrumenmodule allowiple computerl information
psule, spray c
r mixture ratio. lsed operationres were again170 R (94.4 124 K)). Mixtprove repeatabms, and opera
nd Facility
Glenn ACS faet Engine Tescribed in Ref
gure 1. nts module (R
ws for real-timrs in the contr
n to rapidly ad
cart, and ejec
o (MR) decre
n, the next tesn varied to thK) LCH4, 16
ture ratio wasble ignition anation at a vari
y
acility. This fst Facility (REference 7. A p
Ref. 11) and time, streaming
rol room allowdjust test cond
ctor platform.
eased, which i
st series focushe same three 63 R (90.5 Ks maintained and performanety of duty cy
facility was ETF) (B-Stanphotograph of
iming is contrviews of dataw for quick-vditions and pr
is
sed
K) at 2.5, nce, ycle
nd) f the
rolled a at view repare

NASA/TM
Figure 2Glenn
3.0 2B2BP
For thoperation conditioniOne systeconditionidesigned tsystems lo
4.0 3B3BH
The teand 14). Tand a nomexciter soengine wifacility is
M—2012-21761
2: Propellant Cn. (A) Liquid ox
Propellant
he current invat various pr
ing feed systeem was dedicaing. Both havto condition eocated outside
Hardware
est article for This engine isminal MR of 2urce and the oith the altitudeshown in Fig
13
Conditioning Fexygen, LO2. (B)
Condition
vestigation, peopellant inletems (PCFS) wated to methave been descrieach of the pre of ACS are
Descriptio
this test series designed to o2.5. Details ofoperating proe nozzle is shgure 4.
ed System (PC) Liquid methan
ning Feed
erformance ant temperatureswere incorporane conditioniibed in detail ropellants to ±shown in Fig
on
es was the Aeoperate at a sf the engine hocedures werehown in Figur
3
CFS) outside ofne, LCH4.
System (P
nd characterizs was the primrated into the ing, while thepreviously (R
±5 °R (±2.8 Kgure 2.
erojet-designeteady-state m
have been desce changed for re 3. A photog
f Altitude Comb
PCFS)
zation of the Rmary interest.facility for co
e other was deRefs. 6, 7, 12,K). Photograp
ed 100-lbf (44mean chamber
cribed previothese pulse t
graph of the e
bustion Stand
RCE under pu To accompliontrol of propedicated to ox, and 13). The
phs of the LO2
45-N) RCE thr pressure of 1ously (Refs. 6 ests. A photo
engine operati
(ACS) at NASA
ulsed-mode ish this, propepellant conditxygen e systems wer2 and LCH4
hruster (Refs.175 psia (1.2and 7). Only
ograph of the ing in the AC
A
ellant ions.
re
5 to 7 MPa)
y the
CS
NASA/TM
4.1 9B9BE
The ig(Champiothe previoseries andspark exciexciter waoutput iondesign, w
M—2012-21761
F
FiguC
Exciter Sour
gnition sourceon Aerospace,ous Isp,vac test pd previous testiter developedas a single chnization voltaith a 23- to 36
13
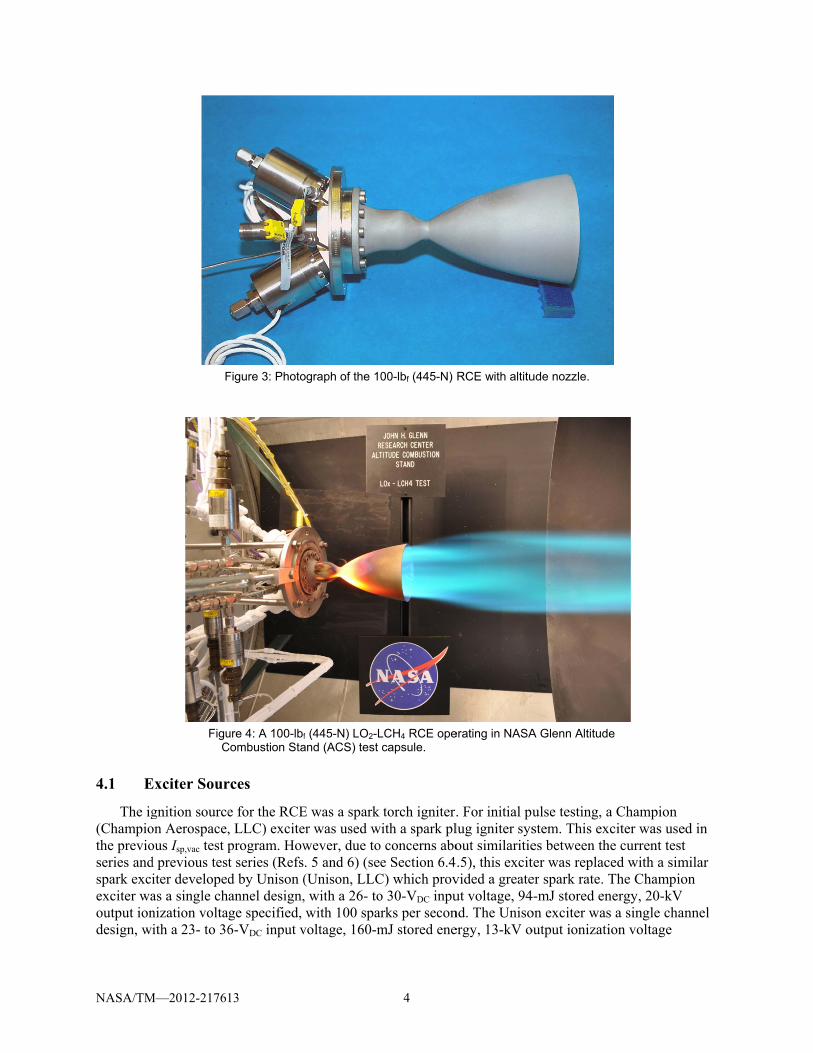
Figure 3: Photo
ure 4: A 100-lbf
Combustion Sta
rces
e for the RCE, LLC) exciteprogram. Howt series (Refsd by Unison (annel design,ge specified, 6-VDC input v
ograph of the 1
f (445-N) LO2-Land (ACS) test
E was a spark er was used wwever, due to. 5 and 6) (se(Unison, LLC, with a 26- towith 100 spa
voltage, 160-m
4
00-lbf (445-N)
LCH4 RCE opecapsule.
torch igniter.with a spark plo concerns aboe Section 6.4
C) which provo 30-VDC inpuarks per seconmJ stored ene
RCE with altitu
erating in NASA
. For initial pulug igniter sysout similaritie.5), this excit
vided a greateut voltage, 94nd. The Unisoergy, 13-kV o
ude nozzle.
A Glenn Altitud
ulse testing, astem. This exes between thter was replacer spark rate. T4-mJ stored enon exciter wasoutput ionizati
e
a Champion xciter was usehe current testced with a simThe Championergy, 20-kV s a single chanion voltage
ed in t
milar on
nnel

NASA/TM
specified,was also bthe need osingle chaionizationcompact e
4.2 10B10BIn
The inigniter. Apoperate atpressure, P
4.3 11B11BC
The cdesign, m(Hitemco)contractiodesigned tnozzle and
4.4 12B12BIn
Figurlocations.of 0 to 50made by Ctemperatusampled aPc,ign port the injectowould indtemperatuprobable n
M—2012-21761
Figure
with 200 spabriefly tested.of an electricaannel design wn voltage specexciter is show
njector
njector of thepproximatelyt an overall MPcav, is measu
Columbium
combustion chmade from colu
). For all testson ratio, 45:1 to be bolted td chamber ar
nstrumenta
e 6 shows a s Unless other0 psi (0 to 3.4Class-A resisture measuremat 1000 Hz. In(hereafter ref
or, observed idicate warmerure rise or a tenon-ignition e
13
5: A 100-lbf (4
arks per secon. The compacal lead betweewith a 23- to 3cified, with 20wn in Figure
RCE engine y 15 percent o
MR of 2.48. Suured within on
Chamber
hamber and numbium (niobs described heexit ratio (80
to the injectore used interch
ation
chematic of trwise noted, a44 MPa). Temtance tempera
ments were man addition to tferred to as Tin the prior ter gases were iemperature deevent.
445-N) RCE op
nd. At the endct exciter was en the exciter36-VDC input 00 sparks per 5.
was an impinof the fuel flowurrounding thne of these ca
ozzle used fobium) materiaere, the nozzl percent bell)
r assembly. Sihangeably thr
the propellantall pressure tramperature meature detectorade by either Kthe instrumen
TCign) to help dest series (Refin the igniter ecrease was o
5
perating with Un
d of the test sesimilar electr
r unit and the voltage, 55-msecond. A ph
nging style wiw is used for e injector is a
avities.
or altitude testal and coated e throat was 0), and 2.50 in.ince the chamroughout this
t feed system ansducers weasurements drs (RTDs), to K-type or T-t
ntation showndiagnose ignitf. 7). A tempecavity and he
observed in th
nison compact
eries, a comparically to the spark plug. TmJ stored enehotograph of t
ith fuel film cthe FFC. The
a series of aco
ting was a sinwith an R512
0.615 in. (15.. (63.5 mm) L
mber and nozzpaper.
for the RCE ere diaphragmdeemed critica
improve prectype thermocon, a K-type thetion phenome
erature rise mence a probabhis thermocou
exciter (circled
act exciter deUnison excite
This compact ergy, and 20-kthe engine op
cooling (FFCe injector wasoustical caviti
ngle piece, rad2E oxidation .6-mm) in diaL′. The chambzles are a sing
engine with am-type transdual to flow meacision, and allouples. All inermocouple wenon in the ig
measured by thble ignition. Luple data, it w
d).
esigned by Uner, but eliminexciter was akV output perating with
) and an integs designed to ies. Chamber
diatively coolresistant coat
ameter with a ber (nozzle) wgle piece, the
associated senucers with a rasurement wel other
nstrumentationwas added intgniter portion his thermocouLikewise, if nowould indicate
nison nated a
the
grated
led ting 6:1
was terms
nsor range ere
n was o the of
uple o e a
NASA/TM
Figu
4.4.1 22B22BM
Flow instrumendensities wprogram (and a 0.080.68-MPathe venturthe 0.100-the ventursub-sonic
where A icoefficien
Pairs shown in upstream used to ca
where Q i
M—2012-21761
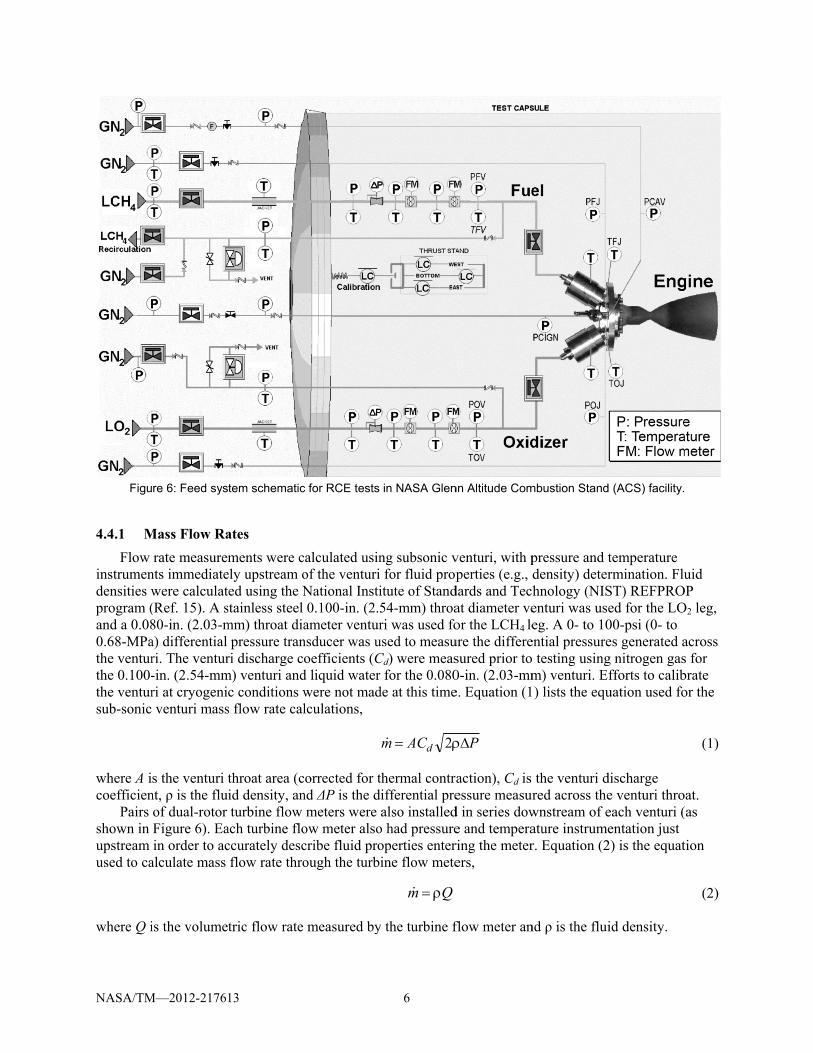
re 6: Feed sys
Mass Flow Ra
rate measuremnts immediatewere calculat(Ref. 15). A s80-in. (2.03-ma) differential ri. The ventur-in. (2.54-mmri at cryogeniventuri mass
s the venturi tnt, ρ is the fluof dual-rotor Figure 6). Eain order to ac
alculate mass
is the volume
13
tem schematic
ates
ments were cely upstream oed using the N
stainless steel mm) throat dia
pressure tranri discharge co
m) venturi andc conditions w
s flow rate cal
throat area (cid density, anturbine flow
ach turbine floccurately descflow rate thro
tric flow rate
c for RCE tests
alculated usinof the venturiNational Insti0.100-in. (2.5
ameter venturnsducer was uoefficients (C
d liquid waterwere not madlculations,
corrected for tnd ΔP is the dmeters were
ow meter alsocribe fluid proough the turb
measured by
6
in NASA Glen
ng subsonic v for fluid propitute of Stand54-mm) throari was used fo
used to measuCd) were measr for the 0.080de at this time
ACm d 2
thermal contradifferential pre
also installedo had pressureoperties enterine flow mete
Qm
y the turbine f
nn Altitude Com
venturi, with pperties (e.g.,
dards and Techat diameter veor the LCH4 leure the differesured prior to0-in. (2.03-mme. Equation (1
P
action), Cd is essure measur
d in series dowe and temperaring the meterers,
flow meter an
mbustion Stand
pressure and tdensity) deterhnology (NISenturi was useeg. A 0- to 10
ential pressure testing usingm) venturi. E) lists the equ
the venturi dred across the
wnstream of eature instrumer. Equation (2
nd ρ is the flui
d (ACS) facility.
temperature rmination. FluST) REFPROed for the LO00-psi (0- to es generated ag nitrogen gasfforts to calibuation used fo
discharge e venturi throeach venturi (entation just
2) is the equat
id density.
uid OP O2 leg,
across s for brate or the
(1)
oat. (as
tion
(2)
NASA/TM
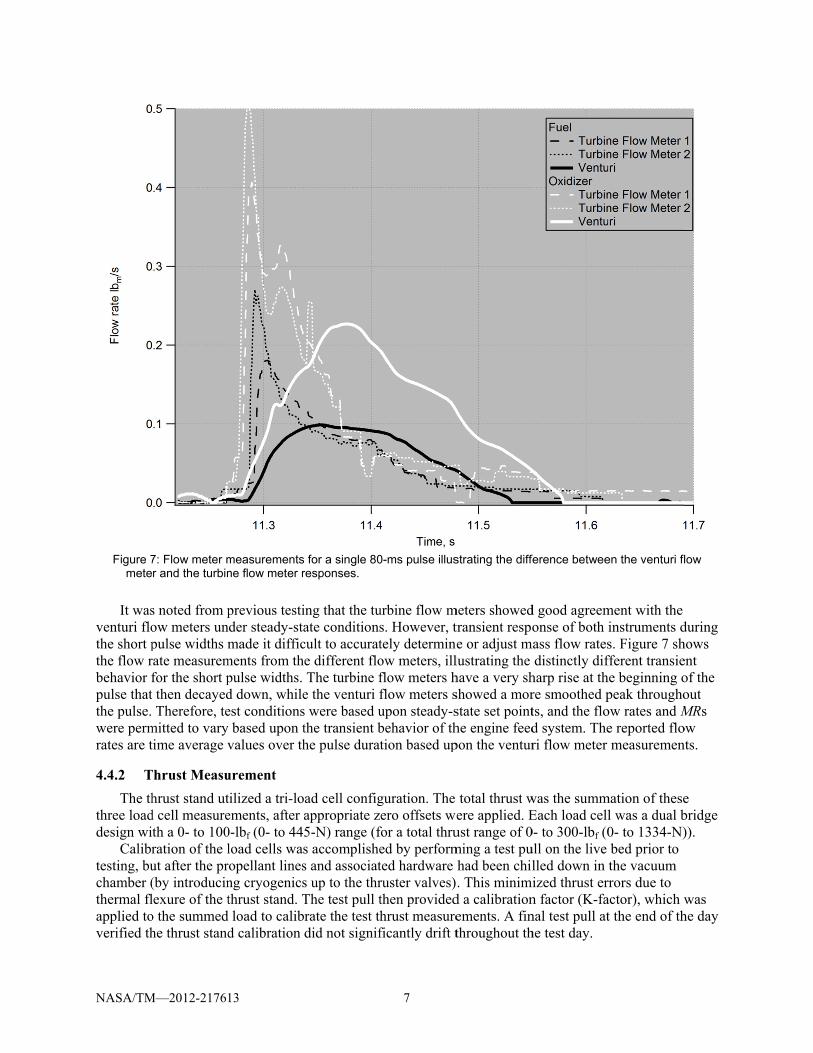
Figure 7mete
It was
venturi flothe short pthe flow rbehavior fpulse thatthe pulse. were permrates are t
4.4.2 23B23BT
The ththree loaddesign wi
Calibrtesting, buchamber (thermal flapplied toverified th
M—2012-21761
7: Flow meter mr and the turbin
s noted from pow meters unpulse widths mrate measuremfor the short pt then decayed
Therefore, temitted to varytime average v
Thrust Measu
hrust stand utd cell measureth a 0- to 100ration of the lut after the pr(by introducinlexure of the to the summedhe thrust stand
13
measurementsne flow meter r
previous testinder steady-stamade it diffic
ments from thpulse widths. d down, whileest conditionsy based upon tvalues over th
urement
tilized a tri-loements, after a0-lbf (0- to 445load cells wasropellant linesng cryogenicsthrust stand. T
d load to calibd calibration
for a single 80responses.
ing that the tuate conditionscult to accurate different floThe turbine f
e the venturi fs were based uthe transient bhe pulse durat
ad cell configappropriate z5-N) range (fs accomplishes and associats up to the thrThe test pull trate the test thdid not signif
7
0-ms pulse illus
urbine flow ms. However, ttely determineow meters, illflow meters hflow meters supon steady-sbehavior of thtion based up
guration. The ero offsets we
for a total thrued by performted hardware ruster valves)then providedhrust measureficantly drift t
strating the diffe
meters showedtransient respoe or adjust mlustrating the have a very shshowed a morstate set pointhe engine feedpon the ventur
total thrust were applied. Eust range of 0ming a test puhad been chil. This minimi
d a calibrationements. A finthroughout th
ference betwee
d good agreemonse of both i
mass flow ratesdistinctly dif
harp rise at thre smoothed pts, and the flod system. Theri flow meter
was the summEach load cell0- to 300-lbf (0ull on the live lled down in ized thrust ern factor (K-fanal test pull athe test day.
en the venturi fl
ment with the instruments ds. Figure 7 shfferent transiehe beginning opeak throughoow rates and Me reported flomeasuremen
mation of thesel was a dual b0- to 1334-N)bed prior to the vacuum
rrors due to actor), which wt the end of th
low
during hows ent of the out MRs ow nts.
e bridge )).
was he day
NASA/TM—2012-217613 8
4.5 13B13BTiming and Permissives
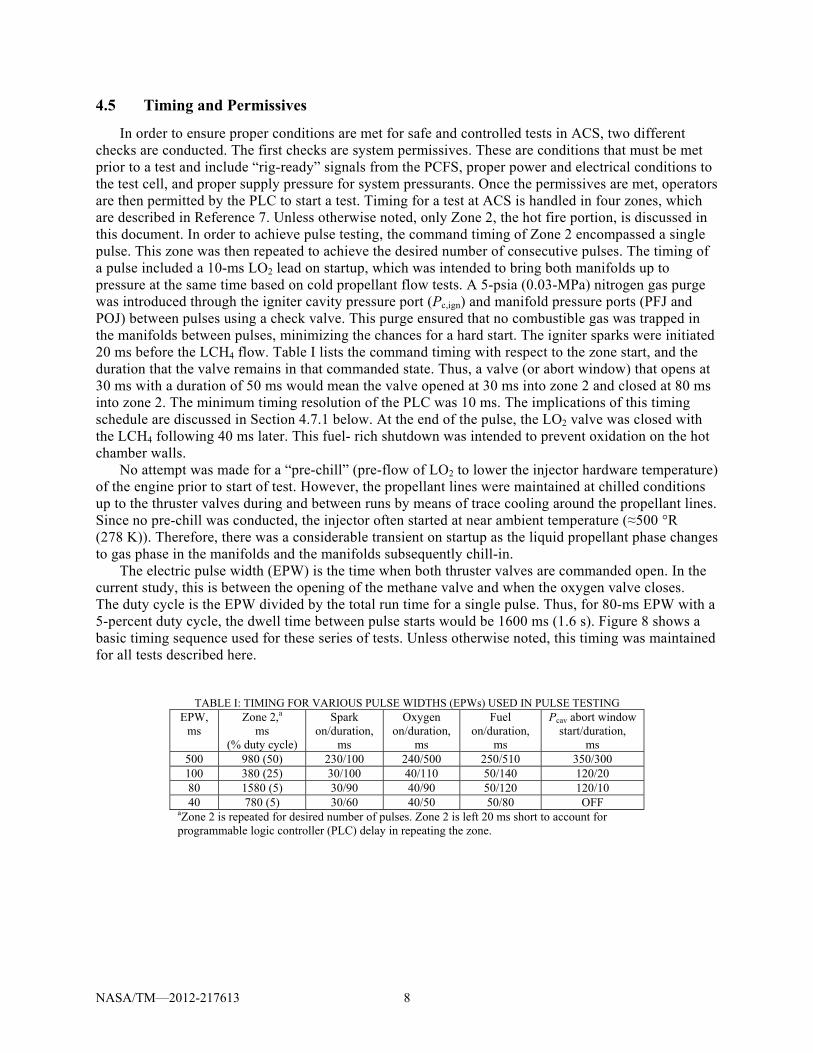
In order to ensure proper conditions are met for safe and controlled tests in ACS, two different checks are conducted. The first checks are system permissives. These are conditions that must be met prior to a test and include “rig-ready” signals from the PCFS, proper power and electrical conditions to the test cell, and proper supply pressure for system pressurants. Once the permissives are met, operators are then permitted by the PLC to start a test. Timing for a test at ACS is handled in four zones, which are described in Reference 7. Unless otherwise noted, only Zone 2, the hot fire portion, is discussed in this document. In order to achieve pulse testing, the command timing of Zone 2 encompassed a single pulse. This zone was then repeated to achieve the desired number of consecutive pulses. The timing of a pulse included a 10-ms LO2 lead on startup, which was intended to bring both manifolds up to pressure at the same time based on cold propellant flow tests. A 5-psia (0.03-MPa) nitrogen gas purge was introduced through the igniter cavity pressure port (Pc,ign) and manifold pressure ports (PFJ and POJ) between pulses using a check valve. This purge ensured that no combustible gas was trapped in the manifolds between pulses, minimizing the chances for a hard start. The igniter sparks were initiated 20 ms before the LCH4 flow. Table I lists the command timing with respect to the zone start, and the duration that the valve remains in that commanded state. Thus, a valve (or abort window) that opens at 30 ms with a duration of 50 ms would mean the valve opened at 30 ms into zone 2 and closed at 80 ms into zone 2. The minimum timing resolution of the PLC was 10 ms. The implications of this timing schedule are discussed in Section 4.7.1 below. At the end of the pulse, the LO2 valve was closed with the LCH4 following 40 ms later. This fuel- rich shutdown was intended to prevent oxidation on the hot chamber walls.
No attempt was made for a “pre-chill” (pre-flow of LO2 to lower the injector hardware temperature) of the engine prior to start of test. However, the propellant lines were maintained at chilled conditions up to the thruster valves during and between runs by means of trace cooling around the propellant lines. Since no pre-chill was conducted, the injector often started at near ambient temperature (≈500 °R (278 K)). Therefore, there was a considerable transient on startup as the liquid propellant phase changes to gas phase in the manifolds and the manifolds subsequently chill-in.
The electric pulse width (EPW) is the time when both thruster valves are commanded open. In the current study, this is between the opening of the methane valve and when the oxygen valve closes. The duty cycle is the EPW divided by the total run time for a single pulse. Thus, for 80-ms EPW with a 5-percent duty cycle, the dwell time between pulse starts would be 1600 ms (1.6 s). Figure 8 shows a basic timing sequence used for these series of tests. Unless otherwise noted, this timing was maintained for all tests described here.
TABLE I: TIMING FOR VARIOUS PULSE WIDTHS (EPWs) USED IN PULSE TESTING EPW,
ms Zone 2,a
ms (% duty cycle)
Spark on/duration,
ms
Oxygen on/duration,
ms
Fuel on/duration,
ms
Pcav abort window start/duration,
ms 500 980 (50) 230/100 240/500 250/510 350/300 100 380 (25) 30/100 40/110 50/140 120/20 80 1580 (5) 30/90 40/90 50/120 120/10 40 780 (5) 30/60 40/50 50/80 OFF
aZone 2 is repeated for desired number of pulses. Zone 2 is left 20 ms short to account for programmable logic controller (PLC) delay in repeating the zone.

NASA/TM
Figw
4.6 14B14BT
For thconditionsshows thesmall shaddiscussed
4.7 15B15BH
Durin(RCE) buincluded dLCH4.
M—2012-21761
gure 8: Basic timwidth. A pulse t
Test Matrix
he pulse test ss explored in
e planned targded boxes arein Reference
Hardware Is
ng the test seriut which contrdifficulty in r
13
ming sequencetrain is accomp
CNW
series, the intethe prior dura
get temperature the target coe 7.
ssues During
ies, some issuributed to the esolving very
e for individual plished by repe
TABLE II: PLAINLET TEM
Condition
Cold Nominal Warm
erest was testiation testing. re ranges (boxonditions, the
g the Test S
ues were idenquality of dat
y short EPW a
9
pulses for pulseating the abov
ANNED TEST MAMPERATURES,
PropellaLCH4
170 (94) 204 (113) 224 (124)
ing the engineTable II lists xes) with the larger open b
Series
ntified that weta collected aand the inabil
se tests. EPW rve sequence fo
ATRIX OF °R (K) ant
LO2 163 (90)
204 (113) 224 (124)
e over the sam the propellanactual condit
boxes are the
ere not directland ability to mlity to reach th
refers to electroor the given num
me matrix of nt target temptions shown. Imodified targ
ly related to thmeet test objehe target cold
onic pulse mber of pulses
temperature peratures. FigIn Figure 9, thget conditions
he test engineectives. Thesed temperature
.
ure 9 he s as
e e
es for

NASA/TM
4.7.1 24B24BR
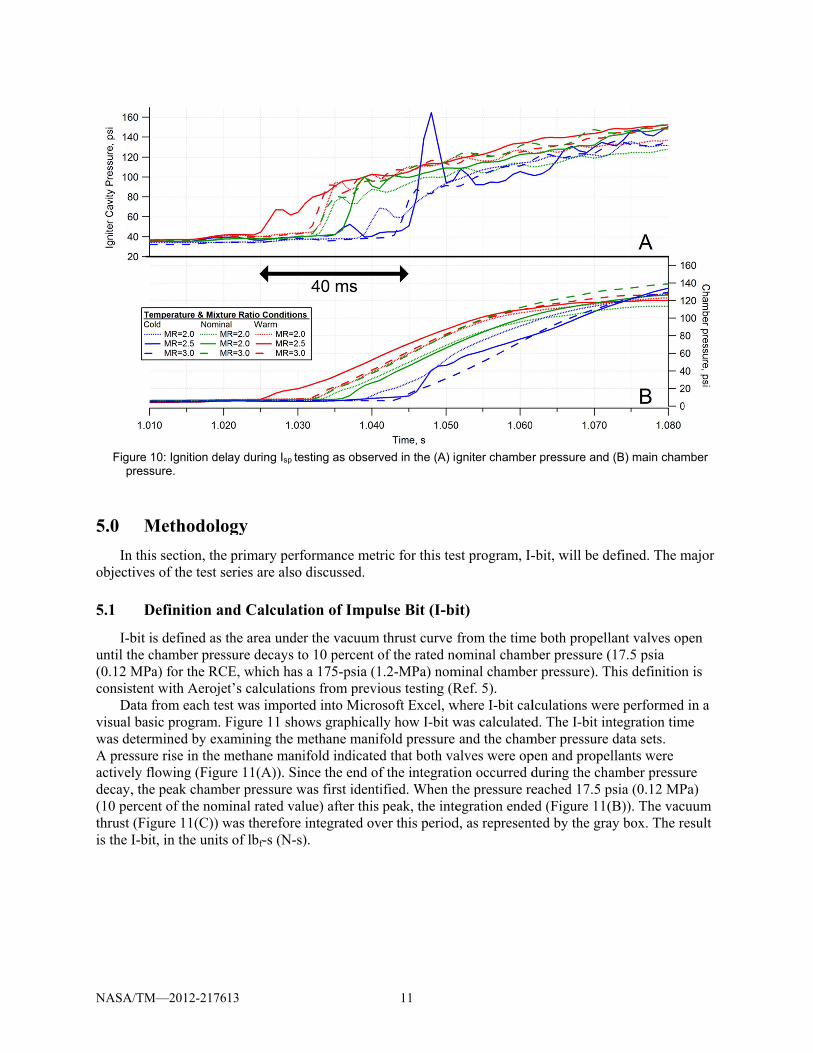
The timonitorinof the winabove colprevious toccur, esptesting (Rrandom puchamber pabort laterrestricted series. Thignition, b
4.7.2 25B25BIn
Durinthe methafurther temThis partiincreasingnumber oprogram. conditions
M—2012-21761
Figure 9: Pcondition
Restricted Ab
iming resolutng. The PLC cndow. For 80-d flow pressutesting (Ref. 7pecially at col
Ref. 7) illustraulse in a planpressure fromr would causeabort window
hese aborts webut rather wer
noperative M
ng the later poane PCFS becmperature refcularly impac
g trace coolinf tests to be cNote that dues were actuall
13
Propellant tempns based upon
bort Window
ion of the ACchecks to mak-ms EPW testures was relat7), and confirlder propellanting observed
nned pulse traim rising abovee the abort to ws and the poere not ignitiore a conseque
Methane Reci
ortion (Run 22ame inoperat
finement was cted testing atg bleeds, etc.onducted. Fige to loss of thly closer to no
peratures at the the planned te
ws and Ignitio
CS facility PLke sure that prts and shorterively short, o
rmed during thnt temperatured ignition delain. A delayed
e the abort limbe tripped on
ossibility of igon failures, asence of the ab
irculation Pu
24 to end of stive. As a resulost, and onlyt cold-cold co, were emplogure 9 shows e methane recominal condit
10
e thruster valveest matrix.
on Delay
LC was limitedressure is abor, the period on the order ofhe present seres. Figure 10ay. During pud ignition, duemits prior to thn the shutdowgnition delay, s the evidenceove considera
ump
series) of the tult, the capabiy a single pasonditions. Effyed to the extthe plot of va
circulation putions.
e for all tests. T
d to 10 ms, inove a specifieof time that thf 10 to 40 msries, that ignishows a plot
ulse testing, the to the short he window en
wn for non-delseveral pulse
e from the datations.
testing, the mility to recircuss for temperaforts to furthetent feasible walve temperatump, methane
The boxes show
ncluding abored value throuhe chamber ws. However, itition delays oftaken during
hese delays coabort window
nd. Subsequenlayed ignitione trains aborteta does indica
methane recirculate the methature conditior condition thwhile trying ttures for the pe temperature
w target
rt window ughout the dur
was sufficientlyt was noted duf 10 to 40 ms
g specific impould occur onw, would prevntly, shifting ns. As a resulted during the ate a successfu
culation pumphane propella
oning was poshe propellantsto maximize tpulse testing es for cold
ration y uring could ulse
n a vent the t of the test
ful
p on ant for ssible. s by the
NASA/TM
Figure 1press
5.0 4B4BM
In thisobjectives
5.1 16B16BD
I-bit iuntil the c(0.12 MPaconsistent
Data fvisual baswas determA pressuractively fldecay, the(10 percenthrust (Figis the I-bi
M—2012-21761
10: Ignition delasure.
Methodolo
s section, the s of the test se
Definition an
is defined as tchamber pressa) for the RCEt with Aerojetfrom each tessic program. Fmined by exa
re rise in the mflowing (Figure peak chambnt of the nomgure 11(C)) wt, in the units
13
ay during Isp te
ogy
primary perferies are also
nd Calculati
the area undersure decays toE, which has t’s calculationst was importeFigure 11 shoamining the mmethane manire 11(A)). Sin
ber pressure wminal rated valwas therefore of lbf-s (N-s)
sting as observ
formance metrdiscussed.
ion of Impu
r the vacuum o 10 percent oa 175-psia (1
ns from previed into Micro
ows graphicallmethane manififold indicatednce the end of
was first identilue) after this integrated ov).
11
ved in the (A) ig
ric for this tes
ulse Bit (I-bi
thrust curve of the rated no1.2-MPa) nomious testing (Rosoft Excel, wly how I-bit wfold pressure d that both vaf the integratiified. When thpeak, the inte
ver this period
gniter chambe
st program, I-
it)
from the timeominal chamb
minal chambeRef. 5).
where I-bit calwas calculatedand the cham
alves were opion occurred dhe pressure reegration ended, as represent
r pressure and
-bit, will be d
e both propellber pressure (r pressure). T
lculations werd. The I-bit in
mber pressurepen and propeduring the cheached 17.5 ped (Figure 11(ted by the gra
d (B) main cham
defined. The m
lant valves op(17.5 psia
This definition
re performed ntegration tim data sets.
ellants were amber pressupsia (0.12 MP(B)). The vacay box. The re
mber
major
pen
n is
in a me
ure Pa) cuum esult

NASA/TM
5.2 17B17BO
The opulsed-mopropellant(Ref. 5).
(1) A(2) A(3) A(4) O
6.0 5B5BR
Presenexplanatiowith a dis
M—2012-21761
Objectives of
objective of puode operationt temperature
Achieve a minAchieve a minAchieve a MIBOperate over a
Results
ntation of theon of the expescussion of an
13
Figure
f Pulse Test
ulse testing atn and to quants. The follow
nimum impulsnimum EPW oB repeatabilitya 0- to 100-pe
e results beginected uncertai
nomalies obse
e 11: Calculatio
ting
t NASA Glentify the I-bit p
wing technical
se bit (MIB) oof 80 ms or ley of ±5 perce
ercent duty cy
ns with a discuinties. A thor
erved during t
12
on regime for d
nn was to veriperformance al challenges h
of 4 lbf-s (17.8ess nt after achie
ycle
ussion of the rough discussithe test campa
determining I-bi
ify the operatiat altitude con
had to be addr
8 N-s)
eving stable te
uncertainty aion of results aign.
it.
ion of the engnditions for vressed by the
emperature
analysis utiliz is then provi
gine under a varying input
delivered eng
zed with an ided, conclud
gine
ing
NASA/TM—2012-217613 13
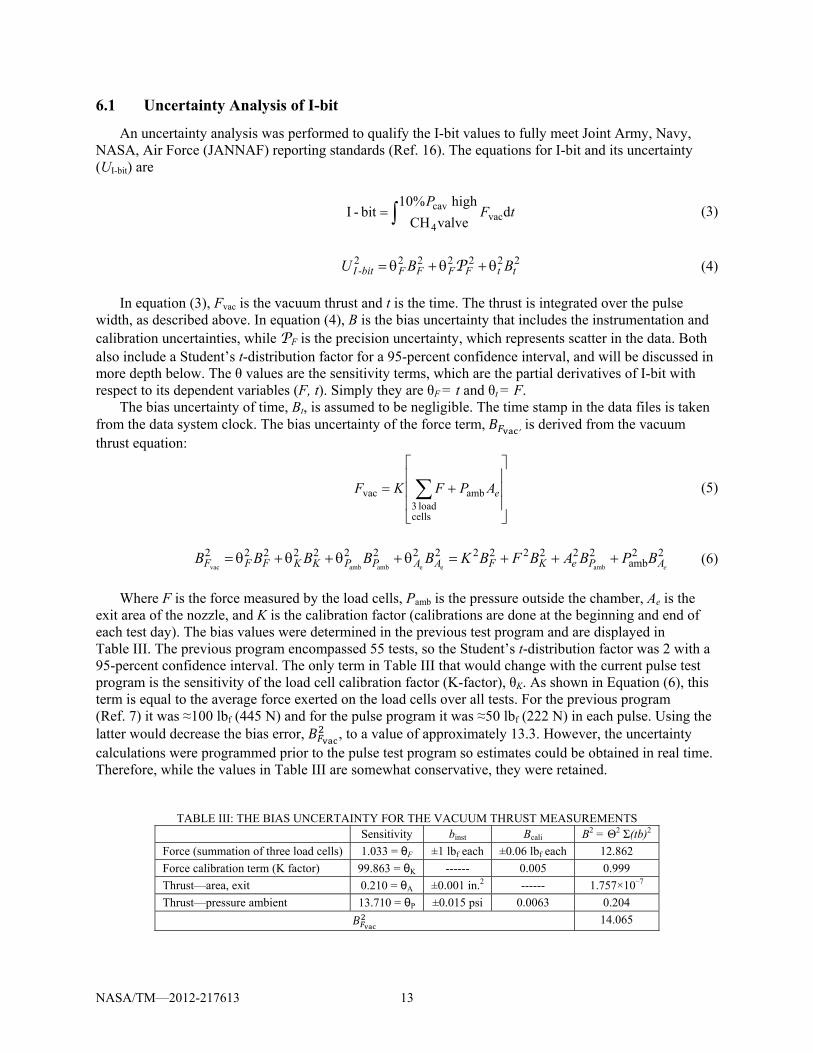
6.1 18B18BUncertainty Analysis of I-bit
An uncertainty analysis was performed to qualify the I-bit values to fully meet Joint Army, Navy, NASA, Air Force (JANNAF) reporting standards (Ref. 16). The equations for I-bit and its uncertainty (UI-bit) are
tF
Pd
valveCH
high %10bit-I vac
4
cav (3)
2222222- ttFFFFbitI BBU P (4)
In equation (3), Fvac is the vacuum thrust and t is the time. The thrust is integrated over the pulse
width, as described above. In equation (4), B is the bias uncertainty that includes the instrumentation and calibration uncertainties, while PF is the precision uncertainty, which represents scatter in the data. Both also include a Student’s t-distribution factor for a 95-percent confidence interval, and will be discussed in more depth below. The θ values are the sensitivity terms, which are the partial derivatives of I-bit with respect to its dependent variables (F, t). Simply they are θF = t and θt = F.
The bias uncertainty of time, Bt, is assumed to be negligible. The time stamp in the data files is taken from the data system clock. The bias uncertainty of the force term, , is derived from the vacuum thrust equation:
cells
load 3ambvac eAPFKF (5)
22amb
222222222222222ambeeambambvac eAPeKFAAPPKKFFF BPBABFBKBBBBB (6)
Where F is the force measured by the load cells, Pamb is the pressure outside the chamber, Ae is the
exit area of the nozzle, and K is the calibration factor (calibrations are done at the beginning and end of each test day). The bias values were determined in the previous test program and are displayed in Table III. The previous program encompassed 55 tests, so the Student’s t-distribution factor was 2 with a 95-percent confidence interval. The only term in Table III that would change with the current pulse test program is the sensitivity of the load cell calibration factor (K-factor), θK. As shown in Equation (6), this term is equal to the average force exerted on the load cells over all tests. For the previous program (Ref. 7) it was ≈100 lbf (445 N) and for the pulse program it was ≈50 lbf (222 N) in each pulse. Using the latter would decrease the bias error, , to a value of approximately 13.3. However, the uncertainty calculations were programmed prior to the pulse test program so estimates could be obtained in real time. Therefore, while the values in Table III are somewhat conservative, they were retained.
TABLE III: THE BIAS UNCERTAINTY FOR THE VACUUM THRUST MEASUREMENTS Sensitivity binst Bcali B2 = Θ2 Σ(tb)2
Force (summation of three load cells) 1.033 = θF ±1 lbf each ±0.06 lbf each 12.862
Force calibration term (K factor) 99.863 = θK ------ 0.005 0.999
Thrust—area, exit 0.210 = θA ±0.001 in.2 ------ 1.757×10⁻⁷
Thrust—pressure ambient 13.710 = θP ±0.015 psi 0.0063 0.204
14.065
NASA/TM
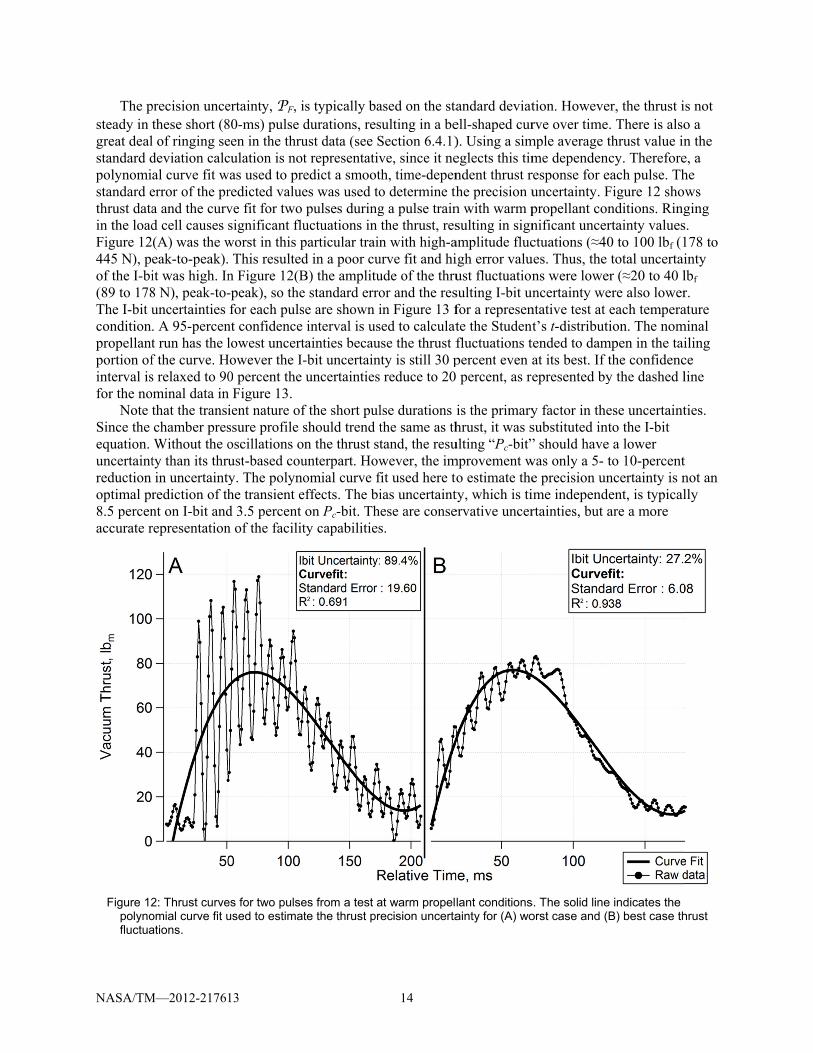
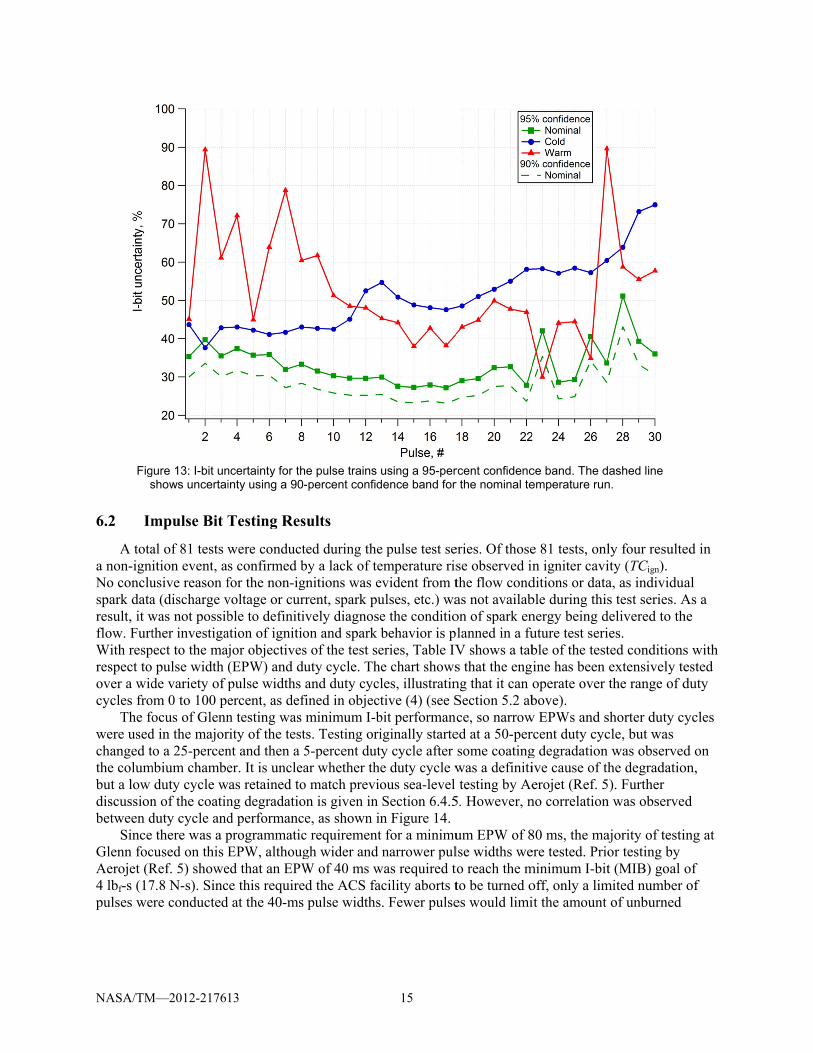
The psteady in great dealstandard dpolynomistandard ethrust datain the loadFigure 12445 N), pof the I-bi(89 to 178The I-bit uconditionpropellantportion ofinterval isfor the no
Note tSince the equation. uncertaintreduction optimal pr8.5 percenaccurate r
Figure 12polynofluctua
M—2012-21761
precision uncethese short (8l of ringing sedeviation calcal curve fit werror of the pra and the curvd cell causes (A) was the weak-to-peak).it was high. In8 N), peak-to-uncertainties . A 95-percent run has the lf the curve. Hs relaxed to 90ominal data inthat the transichamber presWithout the oty than its thruin uncertaintrediction of thnt on I-bit andrepresentation
2: Thrust curveomial curve fit uations.
13
ertainty, PF, i80-ms) pulse deen in the thruculation is not
was used to preredicted valueve fit for two significant fluworst in this p This resultedn Figure 12(B-peak), so thefor each puls
nt confidence lowest uncert
However the I-0 percent the
n Figure 13. ient nature ofssure profile soscillations oust-based couy. The polynohe transient ed 3.5 percent n of the facilit
es for two pulseused to estimat
s typically badurations, resust data (see St representativedict a smootes was used topulses during
uctuations in particular traind in a poor cuB) the amplitue standard erroe are shown iinterval is us
tainties becau-bit uncertainuncertainties
f the short pulshould trend tn the thrust st
unterpart. Howomial curve f
effects. The bion Pc-bit. Thty capabilities
es from a test ate the thrust pr
14
ased on the stasulting in a beSection 6.4.1)ve, since it neth, time-depeno determine thg a pulse trainthe thrust, resn with high-a
urve fit and hiude of the thruor and the resin Figure 13 fsed to calculatuse the thrust fnty is still 30 p
reduce to 20
lse durations ithe same as thtand, the resuwever, the imfit used here toias uncertaintese are conses.
at warm propellrecision uncerta
andard deviatell-shaped cur). Using a simeglects this timndent thrust rhe precision un with warm psulting in signamplitude flucigh error valuust fluctuationsulting I-bit unfor a represente the Studentfluctuations tpercent even a percent, as re
is the primaryhrust, it was sulting “Pc-bit”mprovement w
o estimate thety, which is tiervative uncer
lant conditionsainty for (A) wo
tion. Howeverve over time
mple average tme dependenresponse for euncertainty. Fpropellant connificant uncerctuations (≈40
ues. Thus, the ns were lowencertainty we
ntative test at t’s t-distribut
tended to damat its best. If tepresented by
y factor in thesubstituted int” should havewas only a 5- te precision unime independrtainties, but a
s. The solid lineorst case and (
er, the thrust i. There is alsothrust value incy. Therefore
each pulse. ThFigure 12 shonditions. Ringrtainty values0 to 100 lbf (1total uncertai
er (≈20 to 40 lere also lowereach temperaion. The nom
mpen in the taithe confidency the dashed l
ese uncertaintto the I-bit
e a lower to 10-percentncertainty is nent, is typicalare a more
e indicates the B) best case th
s not o a n the e, a he ws ging s. 178 to inty lbf r. ature
minal iling ce line
ties.
t not an lly
hrust
NASA/TM
Figs
6.2 19B19BIm
A totaa non-igniNo concluspark dataresult, it wflow. FurtWith resprespect toover a widcycles fro
The fowere usedchanged tthe columbut a low discussionbetween d
SinceGlenn focAerojet (R4 lbf-s (17pulses we
M—2012-21761
gure 13: I-bit unshows uncertai
mpulse Bit T
al of 81 tests wition event, asusive reason fa (discharge vwas not possibther investiga
pect to the maj pulse width (de variety of p
om 0 to 100 pefocus of Glennd in the majorto a 25-percen
mbium chambeduty cycle w
n of the coatinduty cycle and there was a p
cused on this ERef. 5) showe7.8 N-s). Sincere conducted
13
ncertainty for thinty using a 90-
Testing Res
were conducts confirmed bfor the non-igvoltage or curble to definitiation of ignitiojor objectives(EPW) and dupulse widths ercent, as defn testing was rity of the testnt and then a 5er. It is unclea
was retained tong degradatiod performancprogrammaticEPW, althoug
ed that an EPWce this require at the 40-ms
he pulse trains -percent confid
sults
ted during theby a lack of tegnitions was errent, spark puively diagnoseon and spark s of the test seuty cycle. Thand duty cycl
fined in objectminimum I-b
ts. Testing ori5-percent dutar whether th
o match previoon is given in e, as shown in
c requirementgh wider and W of 40 ms wed the ACS fa
pulse widths
15
using a 95-perdence band for
e pulse test seemperature risevident from tulses, etc.) wae the conditiobehavior is peries, Table IVe chart showsles, illustratintive (4) (see S
bit performanciginally startety cycle after e duty cycle wous sea-level Section 6.4.5n Figure 14.t for a minimunarrower pul
was required tacility aborts ts. Fewer pulse
rcent confidencr the nominal te
eries. Of thosese observed inthe flow condas not availabon of spark enlanned in a fuV shows a tabs that the engng that it can oSection 5.2 abce, so narrow
ed at a 50-persome coatingwas a definititesting by Ae
5. However, n
um EPW of 8lse widths weto reach the mto be turned oes would limi
ce band. The demperature run
e 81 tests, onln igniter cavi
ditions or datable during thisnergy being duture test serible of the testine has been operate over bove).
w EPWs and srcent duty cycg degradation ive cause of therojet (Ref. 5
no correlation
80 ms, the maere tested. Priominimum I-bitoff, only a limit the amount
ashed line n.
ly four resulteity (TCign). a, as individuas test series. A
delivered to thes. ted conditionsextensively tethe range of d
shorter duty cycle, but was was observed
he degradatio). Further
n was observe
ajority of testior testing by t (MIB) goal o
mited number of unburned
ed in
al As a he
s with ested duty
ycles
d on on,
d
ing at
of of

NASA/TM
methane tvacuum I-temperatutemperatutests that cI-bit. Thisto increas
M—2012-21761
that could bui-bit versus pu
ure at the LO2
ure, with coldconsisted of 3s is opposite oes in specific
13
TABLE IV:
(AEROJET EPW,
ms 5
40
50
60 X
80
100 X
120 X
160 X
320 X
500
960
1000
F
ild up in the teulse number fo2 (A) and LCHer propellants30 pulses. Theof the trends o impulse and
EXAMINED EAND DUTY C[SEA-LEVEL] =
5 10 15 X
X
X X X X
X X
X
X X X
X X
Figure 14: Plot
est capsule infor 80-ms EPWH4 (B) valve is having highe trend showsobserved in spefficiency (R
16
ELECTRONIC PYCLE COMBIN= X; NASA GLE
Duty cycle, per
5 25 50
X X
X X
X X
X
X O O
X X
X X
O
X X
X O
of I-bit versus
n the event of W tests. The sinlets. There i
her I-bits. Figus that increasipecific impul
Refs. 6 and 7)
PULSE WIDTH NATIONS ENN = O; BOTrcent
0 60 75
X
O
O
X X
O
duty cycle.
f a non-ignitiosymbols are cis a dependenure 16 also deing propellanse testing, wh.
(EPW)
TH = )
90
X
on. Figure 15 color-coded bncy of I-bit onemonstrates th
nt inlet temperhere increasin
shows a plot based on propen valve inlet his observatiorature decreasng temperatur
of ellant
on for ses re led

NASA/TM
Figure 180-m
M—2012-21761
15: I-bit for eacms EPW runs w
Figure 16:
13
ch pulse with prith first pulse te
I-bit as a funct
ropellant inlet teemperatures w
ion of (A) LO2 a
17
emperature at with ±10 R of th
and (B) LCH4 i
the (A) LO2 anhe target are sh
nlet temperatu
nd (B) LCH4 thrhown.
ure for 30 pulse
ruster valves. O
e tests.
Only

NASA/TM
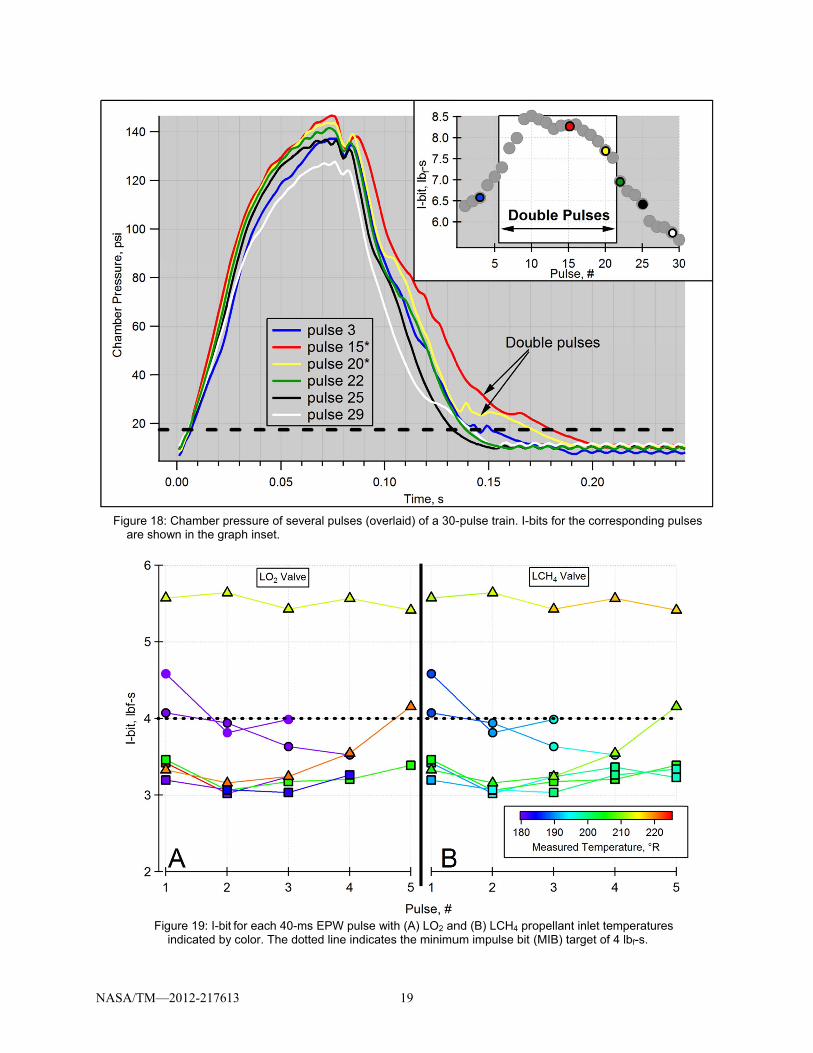
Two fthrust, bot(a) and pepropellanttrapped lipressure t“double pFigure 17values weexists, it s67-N) ban445 N), pthe cause average, ntesting (R
With consistentwith the dEPW testsdata run sconditionsAll of the prior Aero
M—2012-21761
factors, howeth of which meak thrust (b) ts, resulting inquid in the mtakes longer topulse” phenom(B), has a sim
ere based uponshould be notend, while oscieak-to-peak. of the I-bit tr
nominal tempRef. 5), sugges
an EPW of 4tly, for a variedata points cos, warm tests shows such a s. This set of other 40-ms
ojet testing (R
Figure 17:
13
ever, play a romay be influen
versus the LOn a higher I-b
manifold, whico decay, whic
mena in some milar trend as n the curve fied that the maillations obserThus, it is dif
rend can be prperature I-bit vsting I-bit calc0 ms, the engety of propelllor mapped togenerally havsignificantly data clearly dEPW runs de
Ref. 5).
The effect of L
ole in determinnced by propeO2 valve inletbit. The corresch would contch can be seentests, which wintegration ti
it profile descajority of the rved in the thfficult to claimrimarily attribvalues were cculation meth
gine could achlant inlet tempo propellant inve lower I-bitlarger I-bit (≈
defies trends oemonstrate a M
LO2 inlet tempe
18
ning I-bit: (1)ellant temperat temperature.sponding coldtinue to vaporn in Figure 18will be discusime. Due to thcribed in Sectipeak thrust d
hrust stand wem a significanbuted to integconsistent withhods are consihieve the MIBperatures. Fignlet temperatt than cold tes≈40 percent) tobserved, andMIB of 4 lbf-s
erature on (A) in
) integration tature. Figure . Integration tder hardware rize after valv8. This effect ssed in Sectiohe thrust standion 6.1 (see F
data falls withere as great asnt contributiongration time. Ith values previstent.
B requirementgure 19 showstures. From thsts. Thus, it isthan colder ted is consideres (17.8 N-s) o
ntegration time
time and (2) i17 is a plot otime is highestemperatures
ve closure. This also believ
on 6.4.3. Thrud ringing, the
Figure 12). Whin a ±10- to 1s ±40 to 100 ln to I-bit baseIt should also viously report
t of 4 lbf-s (17s a plot of 40-he previously s not clear whests at otherwed here as a stor less, which
e and (B) peak
integration ofof integration st with colders may lead to hus, chamber ved to cause aust, shown in ese peak thrus
While a trend 15-lbf (±45- tolbf (±178 to ed upon thrusbe noted that
ted in Aerojet
7.8 N-s) -ms EPW testobserved 80-
hy a single waise similar tatistical outlih is consistent
thrust.
f time
r
a
st
o
st, and t t
ts -ms arm
ier. t with
NASA/TM
Figure 1are s
M—2012-21761
18: Chamber pshown in the gr
Figure 19: I-biindicated by
13
pressure of sevaph inset.
t for each 40-my color. The do
veral pulses (ov
ms EPW pulse wtted line indica
19
verlaid) of a 30-
with (A) LO2 anates the minimu
-pulse train. I-b
nd (B) LCH4 proum impulse bit
bits for the corr
ropellant inlet te(MIB) target of
responding puls
emperatures f 4 lbf-s.
ses
NASA/TM
6.3 20B20BC
DurinUnison. T40-ms EPto other igdistinguisexciter (8040-ms EPis possibleoperated o
6.4 21B21BA
Throuor which wstand ringnozzle col
6.4.1 26B26BT
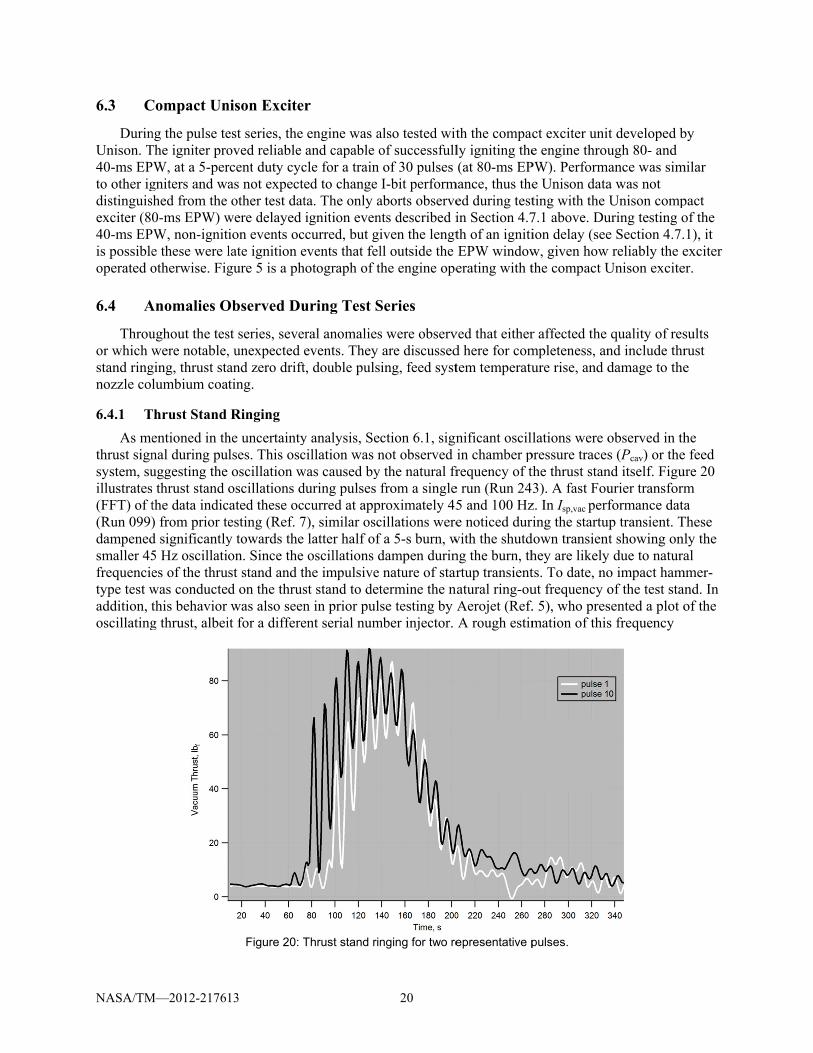
As methrust signsystem, suillustrates(FFT) of t(Run 099)dampenedsmaller 45frequencietype test waddition, toscillating
M—2012-21761
Compact Un
ng the pulse teThe igniter proPW, at a 5-pergniters and washed from the 0-ms EPW) w
PW, non-ignite these were lotherwise. Fig
Anomalies O
ughout the teswere notable,
ging, thrust stalumbium coa
Thrust Stand
entioned in thnal during puuggesting the thrust stand the data indic) from prior ted significantly5 Hz oscillaties of the thruwas conductethis behavior g thrust, albei
13
nison Excite
est series, the oved reliable rcent duty cycas not expecteother test dat
were delayed ion events oclate ignition egure 5 is a ph
Observed Du
st series, seve, unexpected eand zero driftting.
Ringing
he uncertaintylses. This oscoscillation w
oscillations dcated these ocesting (Ref. 7y towards the on. Since the st stand and td on the thruswas also seen
it for a differe
Figure 20: T
r
engine was aand capable o
cle for a train ed to change ta. The only aignition even
ccurred, but gievents that felhotograph of t
uring Test S
ral anomaliesevents. They t, double puls
y analysis, Secillation was n
was caused byduring pulses curred at app
7), similar osclatter half of oscillations d
the impulsive st stand to detn in prior pulent serial num
Thrust stand rin
20
also tested witof successfullof 30 pulses I-bit perform
aborts observents described iiven the lengtll outside the the engine ope
Series
s were observare discusseding, feed syst
ction 6.1, signnot observed the natural frfrom a singleroximately 45
cillations weref a 5-s burn, wdampen durinnature of star
termine the nse testing by
mber injector.
nging for two re
th the compacly igniting the(at 80-ms EP
mance, thus theed during testin Section 4.7th of an ignitiEPW windowerating with t
ved that eitherd here for comtem temperatu
nificant oscillin chamber p
frequency of te run (Run 245 and 100 Hze noticed dur
with the shutdng the burn, thrtup transient
natural ring-ouAerojet (Ref.A rough estim
epresentative p
ct exciter unite engine throu
PW). Performe Unison datating with the 7.1 above. Duion delay (seew, given howthe compact U
r affected the mpleteness, anure rise, and d
lations were opressure tracesthe thrust stan3). A fast Fou
z. In Isp,vac perfing the startu
down transienthey are likelyts. To date, nout frequency o. 5), who presmation of this
pulses.
t developed bugh 80- and ance was sima was not Unison comp
uring testing oe Section 4.7.
w reliably the eUnison excite
quality of resnd include thrdamage to the
observed in ths (Pcav) or thend itself. Figuurier transformformance data
up transient. Tt showing onl
y due to naturao impact hamof the test stansented a plot os frequency
by
milar
pact of the 1), it exciter er.
sults rust e
he e feed ure 20 m a
These ly the al
mmer- nd. In of the
NASA/TM
suggests ainjector sepulse run to filter pucompariso
6.4.2 27B27BT
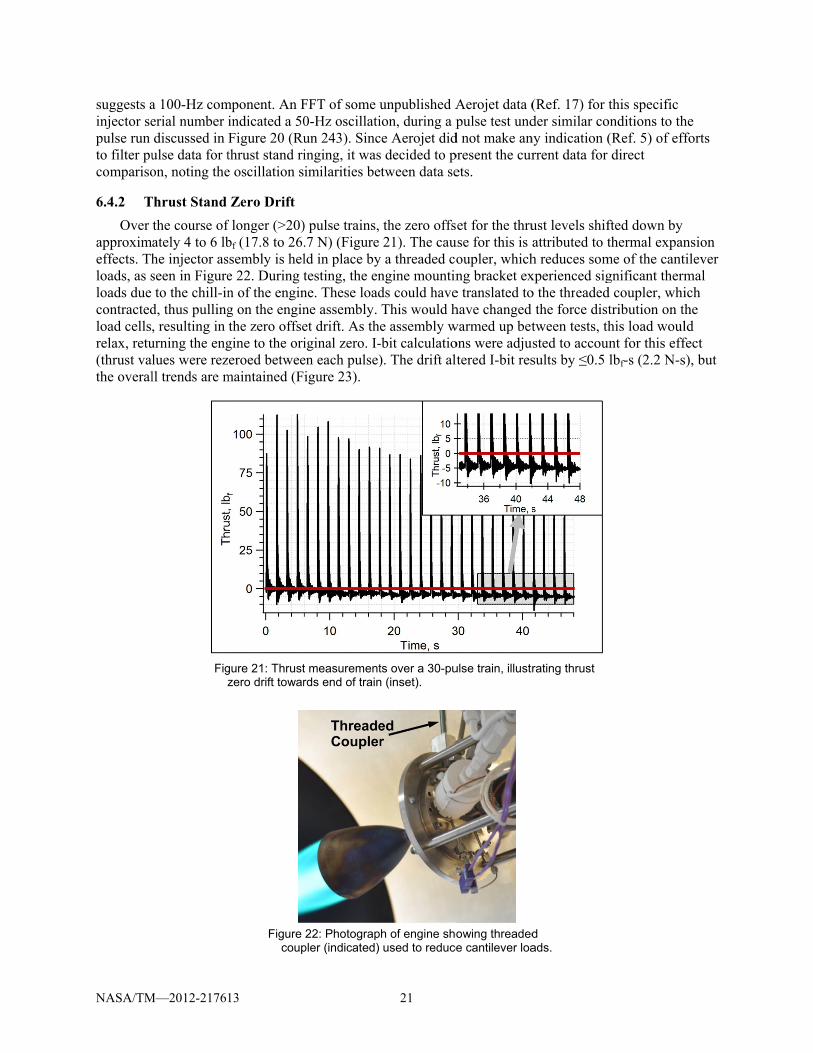
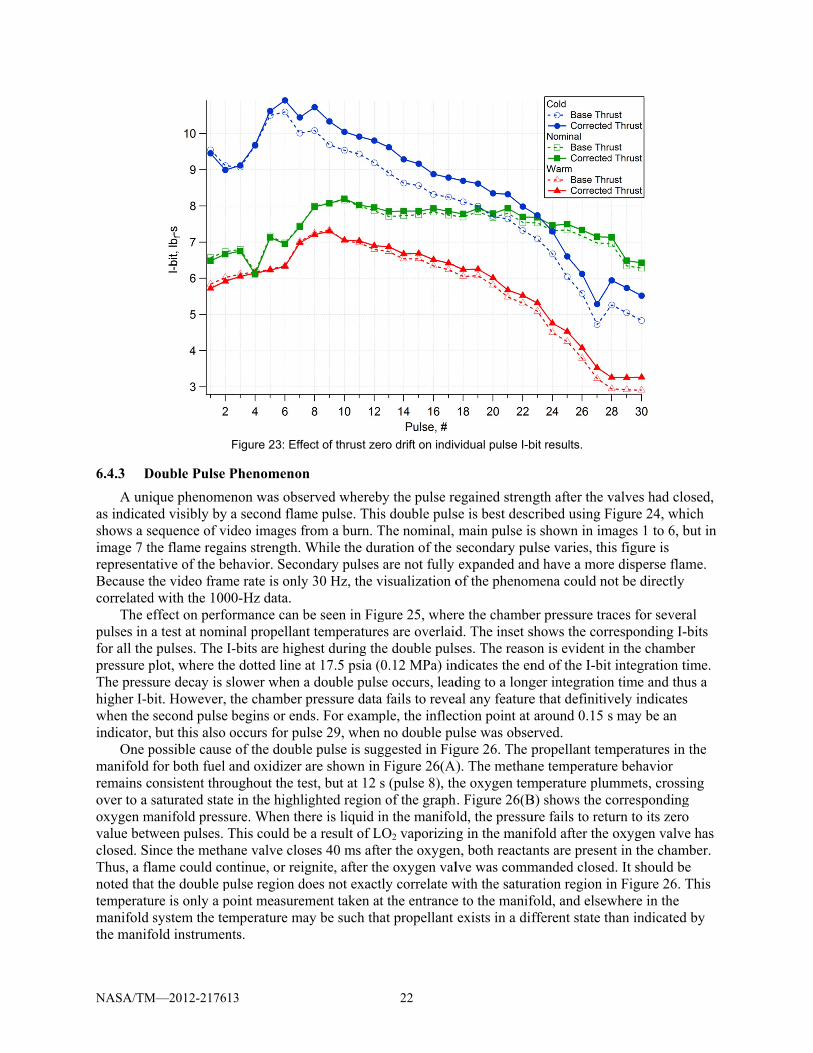
Over approximeffects. Thloads, as sloads due contractedload cellsrelax, retu(thrust valthe overal
M—2012-21761
a 100-Hz comerial number discussed in ulse data for ton, noting the
Thrust Stand
the course ofately 4 to 6 lbhe injector asseen in Figureto the chill-in
d, thus pulling, resulting in
urning the englues were rezll trends are m
Figz
13
mponent. An Findicated a 50Figure 20 (Ruthrust stand rie oscillation s
Zero Drift
f longer (>20)bf (17.8 to 26.ssembly is hele 22. During tn of the enging on the enginthe zero offse
gine to the orizeroed betweemaintained (F
gure 21: Thrustzero drift towar
Figure coup
FFT of some u0-Hz oscillatiun 243). Sincinging, it wasimilarities be
) pulse trains, .7 N) (Figure ld in place bytesting, the enne. These loadne assembly. et drift. As theiginal zero. I-en each pulse)igure 23).
t measurementrds end of train
22: Photograppler (indicated)
21
unpublished Aion, during a pce Aerojet dids decided to ptween data se
the zero offs21). The cau
y a threaded congine mountinds could haveThis would he assembly w-bit calculatio). The drift alt
ts over a 30-pun (inset).
h of engine shoused to reduce
Aerojet data (pulse test und
d not make anpresent the curets.
et for the thruuse for this is aoupler, whichng bracket exe translated tohave changed warmed up betons were adjultered I-bit res
ulse train, illustr
owing threadede cantilever loa
(Ref. 17) for der similar cony indication (rrent data for
ust levels shifattributed to th reduces somxperienced sigo the threaded
the force disttween tests, thsted to accousults by ≤0.5
rating thrust
d ads.
this specific onditions to th(Ref. 5) of effdirect
fted down by thermal expan
me of the cantgnificant thermd coupler, whitribution on thhis load woul
unt for this efflbf-s (2.2 N-s
he fforts
nsion tilever mal ich he ld fect s), but
NASA/TM
6.4.3 28B28BD
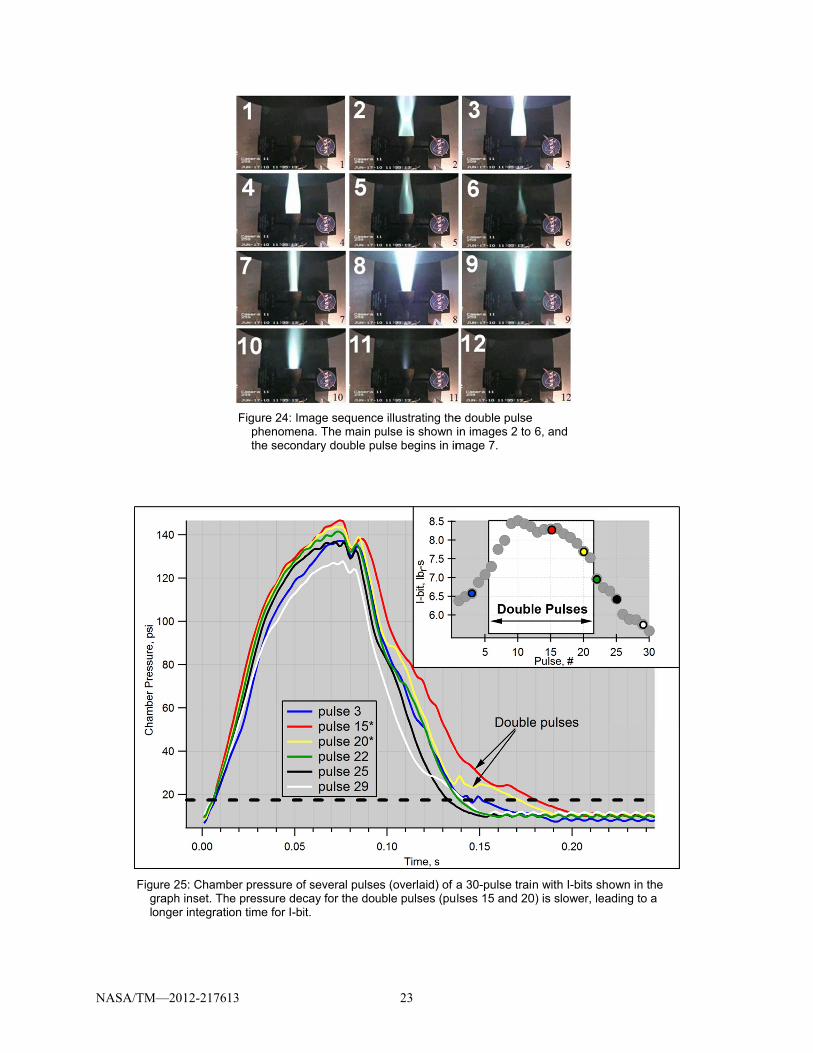
A unias indicateshows a simage 7 threpresentaBecause tcorrelated
The epulses in afor all thepressure pThe presshigher I-bwhen the indicator,
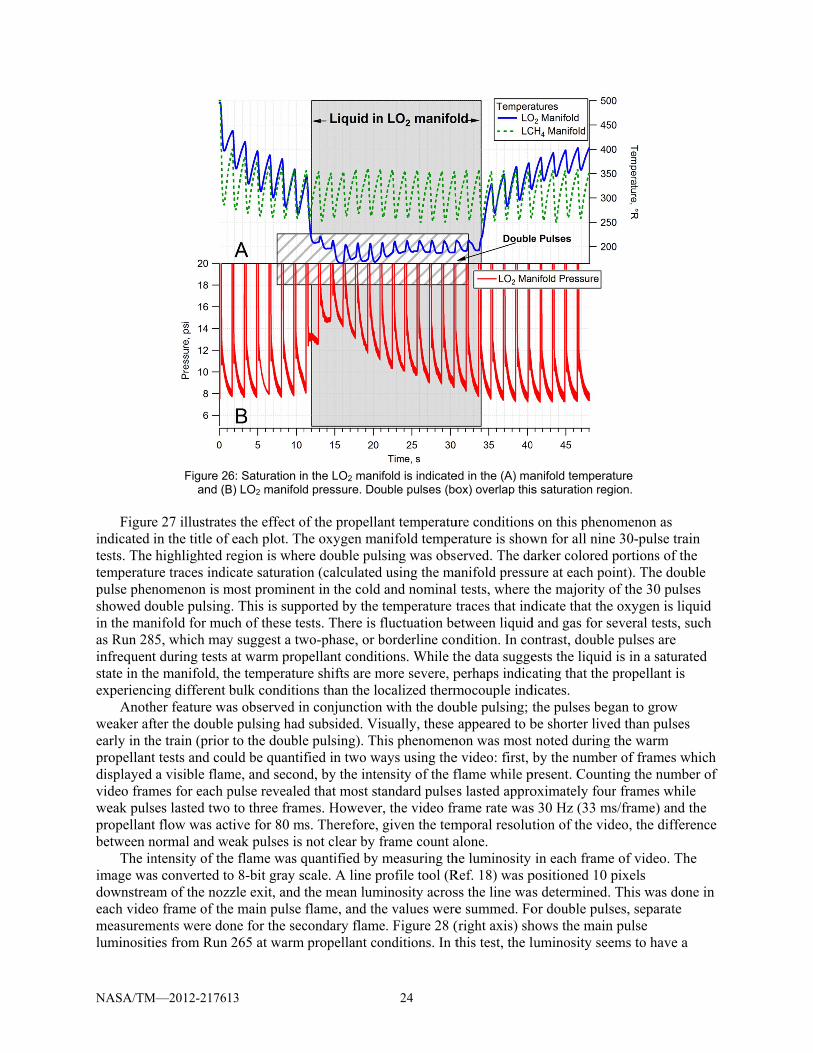
One pmanifold remains cover to a soxygen mvalue betwclosed. SiThus, a flnoted thattemperatumanifold the manifo
M—2012-21761
Double Pulse
ique phenomeed visibly by equence of vihe flame regaative of the bethe video framd with the 100effect on perfoa test at nomi
e pulses. The Iplot, where thure decay is s
bit. However, second pulse but this also
possible causefor both fuel onsistent throsaturated state
manifold pressween pulses. Tince the methaame could cot the double pure is only a psystem the te
fold instrumen
13
Figure 23: Effe
Phenomenon
enon was obsea second flam
ideo images fains strength. ehavior. Seco
me rate is only00-Hz data. ormance can binal propellanI-bits are high
he dotted line slower when athe chamber begins or endoccurs for pu
e of the doubland oxidizer
oughout the tee in the highl
sure. When thThis could beane valve clo
ontinue, or reipulse region dpoint measuremperature ma
nts.
ect of thrust ze
n
erved wherebme pulse. Thifrom a burn. TWhile the du
ondary pulses y 30 Hz, the v
be seen in Fignt temperaturehest during that 17.5 psia (a double pulspressure datads. For examp
ulse 29, when le pulse is sugare shown in
est, but at 12 ighted region
here is liquid ie a result of Lses 40 ms aftgnite, after th
does not exactement taken atay be such tha
22
ero drift on indiv
by the pulse res double puls
The nominal, uration of the s
are not fully visualization o
gure 25, wheres are overlaidhe double puls0.12 MPa) in
se occurs, leada fails to reveaple, the inflecno double pu
ggested in FigFigure 26(A)
s (pulse 8), thn of the graphin the manifol
LO2 vaporizinger the oxygen
he oxygen valtly correlate wt the entranceat propellant
vidual pulse I-b
egained strense is best descmain pulse issecondary puexpanded anof the phenom
re the chambed. The inset sses. The reaso
ndicates the ending to a longal any featurection point at ulse was obsegure 26. The p). The methanhe oxygen tem. Figure 26(Bld, the pressug in the manin, both reactanlve was commwith the saturae to the manifexists in a dif
bit results.
ngth after the vcribed using Fs shown in im
ulse varies, thid have a mor
mena could no
er pressure trashows the coron is evident nd of the I-bitger integratione that definitivaround 0.15 s
erved. propellant temne temperaturmperature pluB) shows the cure fails to retuifold after theants are presenmanded closedation region ifold, and elsewfferent state th
valves had cloFigure 24, whmages 1 to 6, bis figure is e disperse flaot be directly
aces for severrresponding I-in the chambet integration tn time and thuvely indicatess may be an
mperatures inre behavior
ummets, crosscorrespondingurn to its zero oxygen valvnt in the chamd. It should bin Figure 26. where in the han indicated
osed, hich but in
ame.
ral -bits er time. us a s
n the
sing g o e has
mber. e This
d by
NASA/TM
Figgl
M—2012-21761
gure 25: Chambgraph inset. Thonger integrati
13
Figure 24: Imphenomenthe second
ber pressure ofhe pressure decon time for I-bi
mage sequencena. The main pdary double pu
f several pulsescay for the douit.
23
e illustrating thepulse is shown ulse begins in im
s (overlaid) of auble pulses (pu
e double pulsein images 2 to mage 7.
a 30-pulse trailses 15 and 20
6, and
n with I-bits sh0) is slower, lea
own in the ading to a
NASA/TM
Figur
indicated tests. The temperatupulse phenshowed din the manas Run 28infrequenstate in thexperienc
Anothweaker afearly in thpropellantdisplayed video framweak pulspropellantbetween n
The inimage wadownstreaeach videomeasuremluminositi
M—2012-21761
Figure 2and (B
e 27 illustratein the title ofhighlighted r
ure traces indinomenon is mouble pulsingnifold for mu85, which mayt during tests
he manifold, thcing different her feature wafter the doublehe train (priort tests and coua visible flam
mes for each pses lasted twot flow was acnormal and wntensity of the
as converted toam of the nozo frame of the
ments were doies from Run
13
6: Saturation inB) LO2 manifold
es the effect of each plot. Thregion is wheicate saturatiomost promineng. This is suppch of these tey suggest a twat warm prop
he temperaturbulk conditioas observed ine pulsing hadr to the doubleuld be quantifme, and seconpulse revealed
o to three framtive for 80 m
weak pulses is e flame was qo 8-bit gray s
zzle exit, and e main pulse
one for the sec265 at warm
n the LO2 manid pressure. Do
of the propellahe oxygen mare double pul
on (calculatednt in the coldported by the ests. There is fwo-phase, or bpellant conditre shifts are mons than the lon conjunction
d subsided. Vie pulsing). Thfied in two w
nd, by the inted that most st
mes. Howeverms. Therefore,
not clear by fquantified by cale. A line pthe mean lumflame, and thcondary flamepropellant co
24
ifold is indicateuble pulses (bo
ant temperatuanifold tempelsing was obsd using the mad and nominal
temperature tfluctuation beborderline contions. While tmore severe, pocalized thermn with the douisually, thesehis phenomen
ways using theensity of the ftandard pulser, the video frgiven the temframe count ameasuring th
profile tool (Rminosity acroshe values weree. Figure 28 (onditions. In t
ed in the (A) maox) overlap this
ure conditionserature is showerved. The daanifold pressul tests, where traces that indetween liquidndition. In cothe data suggeperhaps indicmocouple induble pulsing; tappeared to b
non was most e video: first, bflame while ps lasted approrame rate wasmporal resolutalone. he luminosity Ref. 18) was pss the line wae summed. Fo(right axis) shthis test, the l
anifold temperas saturation reg
s on this phenwn for all ninarker colored ure at each pothe majority dicate that the
d and gas for sontrast, doubleests the liquidating that the
dicates. the pulses begbe shorter livenoted duringby the numbe
present. Countoximately fous 30 Hz (33 mtion of the vid
in each frampositioned 10 s determined.or double pulhows the mainluminosity see
ature gion.
nomenon as ne 30-pulse tra
portions of thoint). The douof the 30 pulse oxygen is liseveral tests, e pulses are d is in a satura propellant is
gan to grow ed than pulse
g the warm er of frames wting the numb
ur frames whims/frame) and
deo, the diffe
e of video. Thpixels . This was dolses, separate n pulse ems to have a
ain he uble ses iquid such
ated s
s
which ber of ile d the erence
he
one in
a

NASA/TM
Figure 27highlig
Figure 2presssatur
M—2012-21761
7: LO2 manifoldghted areas, an
28: The summesure traces indration.)
13
d temperaturesnd the darker c
ed luminosity fricate gas in the
s are plotted forolor of the trac
rom each pulsee manifold at p
25
r each 30-pulsee indicates the
e video frame iulse 27. (Note
e train run. Doue temperature is
ndicates the wthat a measure
uble pulses wes below the sa
weak pulse pheed luminosity o
ere observed inturation condit
nomena. The of 100 is white
n the ion.
NASA/TM
cyclic feamanifold represent measured valve presweak puls
6.4.4 29B29BT
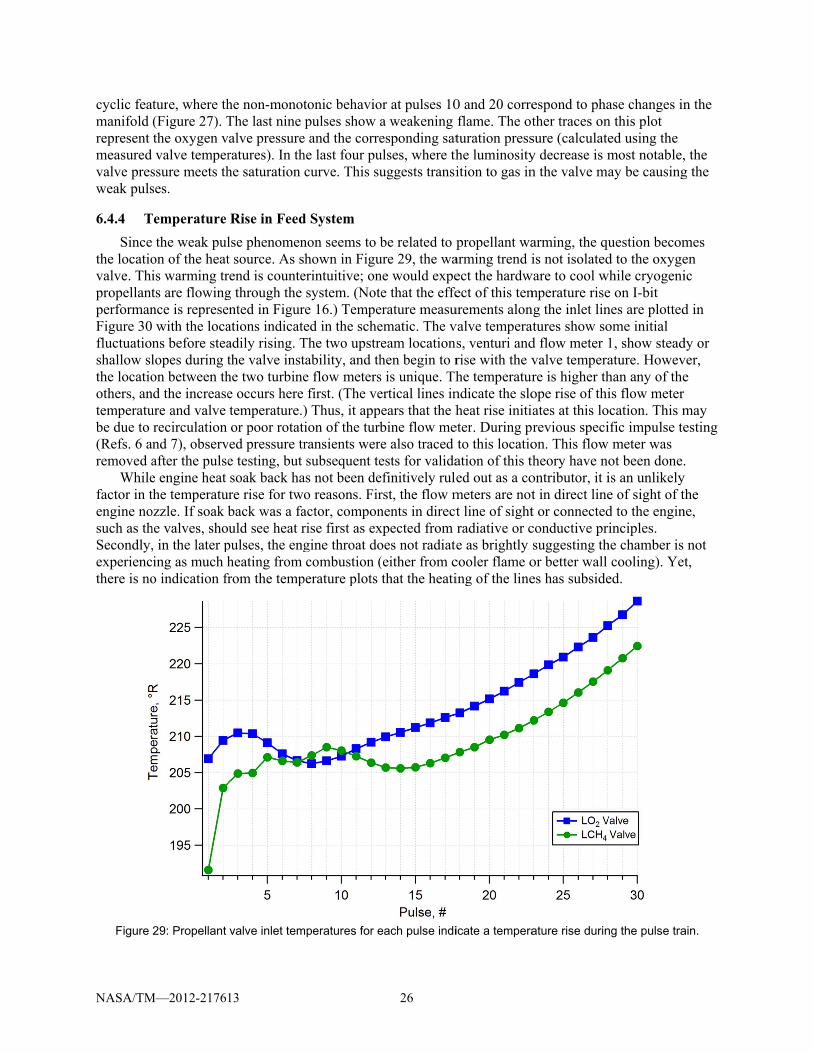
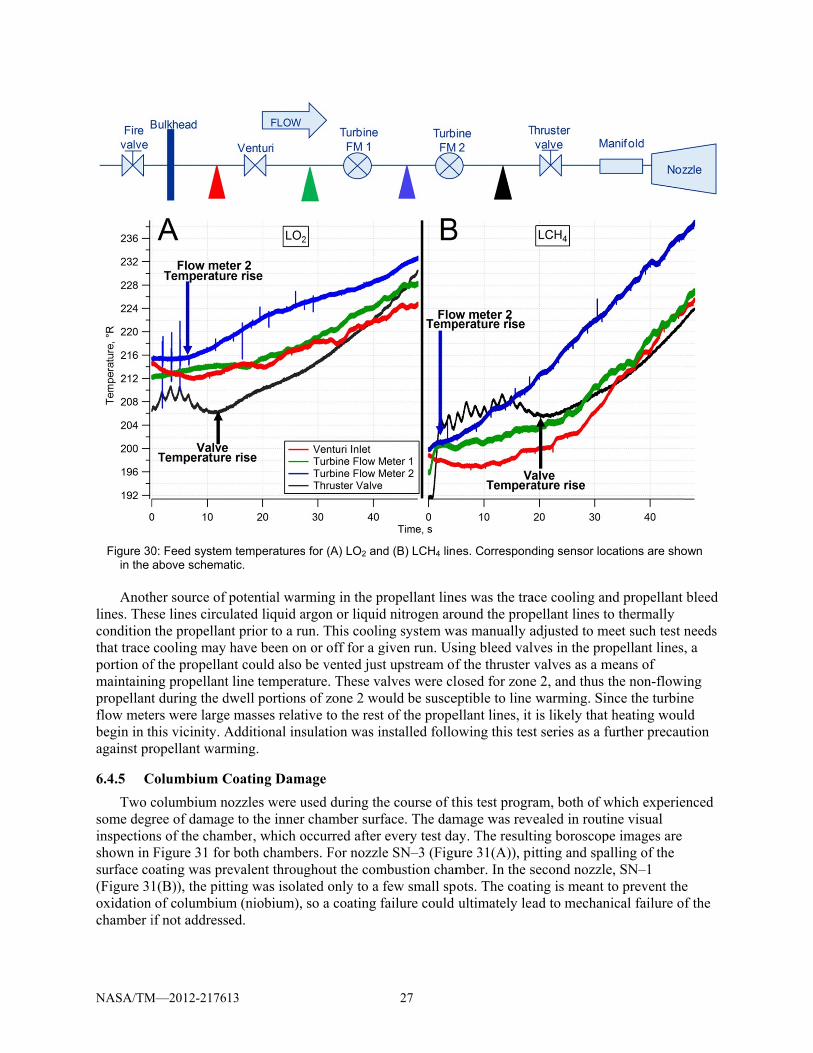
Sincethe locatiovalve. ThipropellantperformanFigure 30fluctuatioshallow slthe locatioothers, antemperatube due to (Refs. 6 aremoved a
Whilefactor in tengine nosuch as thSecondly,experiencthere is no
Figure
M—2012-21761
ature, where th(Figure 27). Tthe oxygen vvalve temper
ssure meets thses.
Temperature
the weak pulon of the heatis warming trts are flowingnce is represe with the locans before stealopes during ton between th
nd the increaseure and valve recirculation
and 7), observafter the pulsee engine heat the temperatuozzle. If soak bhe valves, sho, in the later p
cing as much ho indication fr
29: Propellant
13
he non-monotThe last nine
valve pressureratures). In thhe saturation
Rise in Feed
lse phenoment source. As srend is counteg through the ented in Figurations indicateadily rising. Tthe valve insthe two turbinee occurs here temperature.)or poor rotati
ved pressure tre testing, but soak back ha
ure rise for twoback was a fauld see heat r
pulses, the engheating from
from the temp
valve inlet tem
tonic behaviopulses show a
e and the correhe last four pucurve. This su
d System
non seems to bhown in Figu
erintuitive; onsystem. (Not
re 16.) Tempeed in the sche
The two upstrtability, and the flow metersfirst. (The ve
) Thus, it appion of the turbransients wersubsequent te
as not been deo reasons. Firactor, componrise first as exgine throat docombustion (
perature plots
mperatures for e
26
or at pulses 10a weakening esponding sat
ulses, where thuggests transi
be related to pure 29, the wane would expete that the effeerature measuematic. The vream locationshen begin to rs is unique. Thertical lines inears that the hbine flow mee also traced ests for validaefinitively rulerst, the flow mnents in directxpected from oes not radiate(either from cthat the heati
each pulse indi
0 and 20 correflame. The otturation presshe luminosityition to gas in
propellant waarming trend iect the hardwect of this tem
urements alonvalve temperats, venturi andrise with the vhe temperaturndicate the sloheat rise initi
eter. During pto this locatioation of this thed out as a cometers are nott line of sightradiative or ce as brightly
cooler flame oing of the line
icate a tempera
espond to phather traces onsure (calculatey decrease is mn the valve ma
arming, the quis not isolated
ware to cool wmperature riseng the inlet linatures show sod flow meter 1valve temperare is higher thope rise of thiates at this lorevious specion. This flowheory have no
ontributor, it it in direct linet or connectedconductive prsuggesting thor better wall es has subside
ature rise durin
ase changes inn this plot ed using the most notable,ay be causing
uestion becomd to the oxyge
while cryogenie on I-bit nes are plottedome initial 1, show steadature. Howevhan any of theis flow meter
ocation. This mific impulse te
w meter was ot been done.is an unlikelye of sight of td to the engininciples.
he chamber is cooling). Yet
ed.
ng the pulse tra
n the
, the g the
mes en ic
d in
dy or ver, e
may esting
. y the ne,
not t,
ain.
NASA/TM
Figure 30in the Anoth
lines. Thecondition that trace portion ofmaintaininpropellantflow metebegin in thagainst pr
6.4.5 30B30BC
Two csome degrinspectionshown in surface co(Figure 31oxidation chamber i
M—2012-21761
0: Feed systemabove schema
her source of ese lines circu
the propellancooling may
f the propellanng propellantt during the ders were largehis vicinity. Aropellant warm
Columbium C
columbium nree of damagns of the chamFigure 31 for
oating was pre1(B)), the pittof columbium
if not address
13
m temperaturesatic.
potential warulated liquid ant prior to a ruhave been onnt could also t line temperadwell portionse masses relatAdditional insming.
Coating Dam
ozzles were ue to the inner
mber, which or both chambeevalent througting was isolam (niobium), ed.
s for (A) LO2 an
rming in the pargon or liquidun. This coolin or off for a gbe vented jus
ature. These vs of zone 2 wotive to the restsulation was i
mage
used during thr chamber suroccurred afterers. For nozzlghout the com
ated only to a so a coating
27
nd (B) LCH4 line
propellant lined nitrogen aroing system wagiven run. Usst upstream ofvalves were clould be suscet of the propeinstalled follo
he course of thface. The dam
r every test dale SN–3 (Figumbustion chamfew small spfailure could
es. Correspond
es was the traound the propas manually asing bleed valf the thruster losed for zoneeptible to line ellant lines, it owing this tes
his test progrmage was revay. The resulture 31(A)), pimber. In the sots. The coatiultimately lea
ding sensor loc
ace cooling anpellant lines toadjusted to mlves in the provalves as a m
e 2, and thus twarming. Sinis likely that
st series as a f
ram, both of wvealed in routiting boroscopitting and spasecond nozzleing is meant tad to mechan
cations are sho
nd propellant o thermally
meet such test nopellant lines
means of the non-flowince the turbinheating woul
further precau
which experieine visual
pe images are alling of the e, SN–1 to prevent the
nical failure o
own
bleed
needs , a
ing ne ld
ution
enced
e f the
NASA/TM
Figure 3dama
The fi
temperatuburn timechamber ithe damag(Figure 32
The dbenign testhan seventemperatuthree propindication
Even Table V s(Aerojet) the contradamage, s
The mbreakdowheat and o
M—2012-21761
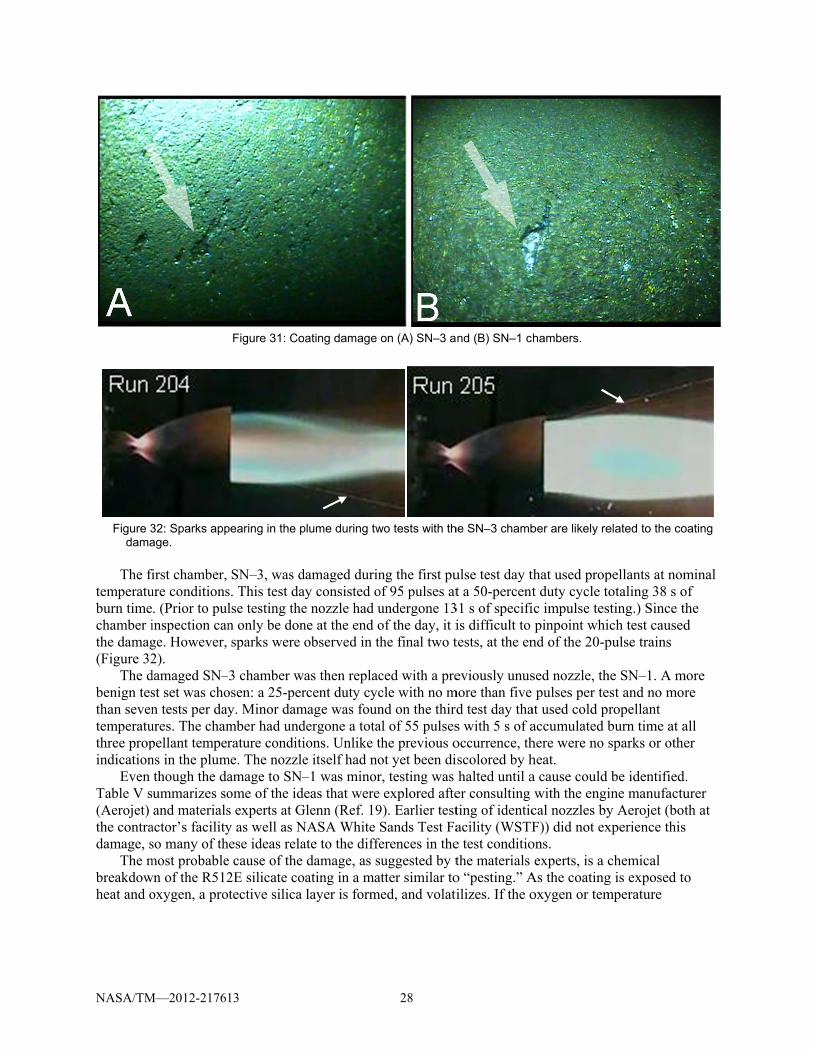
32: Sparks appage.
first chamber, ure conditions. (Prior to pulinspection cange. However, 2).
damaged SN–st set was chon tests per day
ures. The champellant temperns in the plumthough the daummarizes soand materials
actor’s facilityso many of thmost probablewn of the R512oxygen, a pro
13
Figure 31: Co
pearing in the p
SN–3, was ds. This test dalse testing then only be donsparks were
–3 chamber wosen: a 25-pery. Minor dammber had undrature conditi
me. The nozzleamage to SN–ome of the ids experts at Gy as well as Nhese ideas relae cause of the 2E silicate cotective silica
ating damage
plume during tw
damaged durinay consisted oe nozzle had une at the end oobserved in th
as then replacrcent duty cyc
mage was foundergone a totaions. Unlike te itself had no–1 was minoreas that were
Glenn (Ref. 19NASA White Sate to the diffedamage, as sating in a malayer is form
28
on (A) SN–3 a
wo tests with th
ng the first puof 95 pulses atundergone 13of the day, it ihe final two t
ced with a precle with no mnd on the thirdal of 55 pulsesthe previous oot yet been dir, testing was explored afte
9). Earlier testSands Test Faerences in theuggested by t
atter similar toed, and volati
nd (B) SN–1 c
he SN–3 chamb
ulse test day tt a 50-percent
31 s of specifiis difficult to tests, at the en
eviously unusmore than five
d test day thas with 5 s of aoccurrence, thiscolored by hhalted until a
er consulting ting of identicacility (WSTFe test conditiothe materials o “pesting.” Ailizes. If the o
hambers.
ber are likely re
that used propt duty cycle toic impulse tespinpoint whi
nd of the 20-p
sed nozzle, thpulses per te
at used cold praccumulated bhere were no sheat. a cause could with the engi
cal nozzles byF)) did not ex
ons. experts, is a c
As the coatingoxygen or tem
elated to the co
pellants at nomotaling 38 s o
sting.) Since tich test causedpulse trains
he SN–1. A mest and no morropellant burn time at asparks or othe
be identifiedine manufactuy Aerojet (botxperience this
chemical g is exposed tomperature
oating
minal of the d
more re
all er
d. urer th at
s
o

NASA/TM—2012-217613 29
TABLE V: POTENTIAL CAUSES OF DAMAGE TO COLUMBIUM CHAMBER Potential cause Proof Result
Nozzles used here were newer than ones used in previous testing. The coating batch on the new nozzles could have been flawed.
Test the old nozzle in the current facility in an attempt to cause the same damage.
Nozzle had been damaged by other means in previous testing and could not be reused.
Operating temperature exceeds the rated coating temperature.
No direct chamber temperature diagnostics are available; however, the color of the nozzle during burn is an indicator.
Nozzles discolor after heat exposure, but SN–1 had not yet been discolored. Yet the damage still occurred. Also, during duration testing, much higher temperatures were reached with no damage.
Molten material from a degrading of the spark plug damaged the nozzle.
Spark plug was removed and investigated.
No damage to the spark plug was found. No damage was observed in the igniter cavity nor at the converging section of the nozzle.
High local mixture ratios (MRs) near the wall were creating hot spots.
Igniter pins inspected for alignment. Rough calculations were done to determine local MR at the injector.
Pins are inspected as standard leak check procedures and were never found out of alignment. Calculations indicated a lower MR at the injector.
Propellant flow timing could be causing hard starts or oxidation on the walls (if directly exposed to LO2).
Timing was reviewed. The oxygen valve was shut first so that the hot walls would not be exposed directly to oxygen.
Aerojet testing used a variety of timing conditions including oxygen flow on shutdown.
environment is insufficient, the rate of volatilization will exceed the formation, and the protective layer will fail. The oxygen may then leach into the coating and cause internal damage (scale formation). Small samples of the damaged coating were scraped off the chamber and chemically analyzed (x ray and scanning electron microscope (SEM)). The results (see Appendix B) indicated the presence of niobium oxide indicating oxidation of the substrate, but lacked the silica that would be indicative of the protective coating. The timing of the propellants had been oriented to avoid concern over too much oxygen near the hot walls, but this may have caused oxygen starvation of the coating. This, combined with the transient thermal conditions of a high duty cycle, could have led to break down of the coating. However, destructive testing and a more detailed materials study would be required to confirm this theory.
Various solutions were discussed including preconditioning of the nozzles in an oxide atmosphere or application of a barrier coating. However, the path forward involved a simple change in test conditions in an attempt to avoid or reduce the occurrence of the pesting phenomenon. After weighing the risks, testing was resumed with the SN–1 chamber (since damage was minimal) with the following changes:
(1) The duty cycle was decreased to 5 percent. The majority of the previous Aerojet testing had been done at this condition. This would also help mitigate the transients in the chamber, allowing more time between pulses for gas dispersion.
(2) The lower duty cycle also allows more time for the coating and substrate to reach thermal equilibrium between pulses. A thermal mismatch between the coating and substrate may also have contributed to the damage.
(3) The existing damage to the nozzle was well documented. When it was reinstalled, the nozzle was rotated 90 to see if the damage was related to the injector pattern (i.e., flow irregularities).
Following the above changes, chamber SN–1 was tested for over 700 pulses with videoscope
inspections performed at the end of each test day. No further degradation of the coating was observed beyond expected normal wear. Since the nature of anomaly is beyond the scope of the testing program, and since no further damage was observed, it was concluded not to pursue a more definitive explanation of cause at this time.

NASA/TM—2012-217613 30
7.0 6B6BSummary and Conclusions
The 100-lbf liquid oxygen-liquid methane (LO2-LCH4) reaction control engine (RCE) developed by Aerojet was tested to determine impulse bit (I-bit) performance. All experiments took place in a reduced pressure environment using the Altitude Combustion Stand at the NASA Glenn Research Center. Propellant temperature was varied between three set point conditions to simulate operation limits of an in-space system. Pulse train length (number of consecutive pulses), pulse duration (electronic pulse width (EPW)), and duty cycle were all adjusted to meet test needs.
The performance fully met three of the four objectives set forth: It was operated at, and below, the required minimum pulse duration of 80 ms; it achieved a minimum impulse bit (MIB) of less than 4 lbf-s (at 40-ms pulse duration); and it was operated at a range of duty cycle conditions. The fourth requirement stated that the MIB repeatability should be within ±5 percent after achieving stable temperature. However, stable temperatures were not achieved due to warming in the lines, believed to be associated with one of the turbine flow meters, though this has yet to be confirmed. This was a facility issue and not related to the performance of the engine. As a result, propellant temperatures increased gradually over the pulse train, which involved as many as 30 consecutive pulses. The I-bit values were shown to be strongly dependent on propellant inlet temperature with warmer propellants showing shorter I-bits. Thus the I-bit values dropped off toward the end of longer pulse trains. The number of consecutive pulses demonstrates reliable and repeatable ignition and pulse performance, bolstering the feasibility of this propellant combination for future exploration endeavors.
Several issues with this particular engine system did occur. A unique phenomenon was observed whereby the engine reignited immediately after the valves were closed, resulting in a “double pulse.” Manifold temperature and pressure conditions indicate that this may have been due to a two-phase flow condition. Vaporization of liquid in the oxygen manifold could have reacted with the lagging methane flow to cause a short re-ignition. This double pulse phenomenon also led to higher I-bits (due to longer integration times). Another issue was damage to the chamber surface coating that occurred early in the pulse test program. Since the coating prevents oxidation of the columbium substrate, this posed a concern to the safety of the engine. Chemical analysis of some damaged coating material indicates this may have been caused by a phenomena likened to pesting. Insufficient oxygen at these temperature conditions prevented the formation of silicon oxide on the coating surface. The lack this protective layer caused internal damage to the coating (scaling). The thermal cycling of a high duty cycle could have contributed to this issue. Testing was resumed at lower duty cycle conditions (5 percent) with no further damage.
8.0 7B7BRelated Work
Testing with this engine continued with a focus on ignition phenomena. Since one of the perceived drawbacks of this propellant combination is high ignition energy, this program sought to determine energy limits. A well instrumented exciter unit was used to obtain high-fidelity voltage information of the spark discharge. By coupling this to the existing pressure instruments, it was possible to determine the energy of the ignition spark. A variable energy exciter unit was developed to explore these limits.

NASA/TM—2012-217613 31
8B8BReferences
1. Melcher, J.C. and Allred, J.K., "Liquid Oxygen/Liquid Methane Testing of the RS-18 at NASA
White Sands Test Facility", AIAA 2008-4843, 44th AIAA/ASME/SAE/ASEE Joint Propulsion Conference and Exhibit, Hartford, CT, July 21–23, 2008.
2. Melcher, J.C. and Allred, J.K., "Liquid Oxygen/Liquid Methane Test Results of the RS-18 Lunar Ascent Engine at Simulated Altitude Conditions at NASA White Sands Test Facility," AIAA 2009–4949, 45th AIAA/ASME/SAE/ASEE Joint Propulsion Conference and Exhibit, Denver, CO, Aug. 2–5, 2009.
3. Over, A.P., Klem, M.K., and Motil, S.M., "A Successful Infusion Process for Enabling Lunar Exploration Technologies," AIAA 2007–6196, AIAA Space 2007 Conference and Exposition, Long Beach, CA, Sept. 18–20, 2007.
4. Stone, R., Tiliakos, N., Balepin, V., Tsai, C.-Y., and Engers, R., "Altitude Testing of LOX-Methane Rocket Engines at ATK GASL," AIAA 2008–3701, 26th AIAA Aerodynamics Measurement Technology and Ground Testing Conference, Seattle, WA, June 23–26, 2008.
5. Robinson, P.J., Veith, E.M., Hurlbert, E.A., Jimenez, R., and Smith, T.D., "100-lbf LO2/LCH4 - Reaction Control Engine Technology Development for Future Space Vehicles", 59th International Astronautical Federation, Glasgow, Scotland, United Kingdom, September 29–October 3, 2008.
6. Marshall, W.M. and Kleinhenz, J.E., "Hot-Fire Testing of 100 lbf LOX/LCH4 Reaction Control Engine at Altitude Conditions", JANNAF 57th JPM/7th MSS/5th LPS/4th SPS Joint Subcommittee Meeting, Colorado Springs, CO, May 3–7, 2010.
7. Marshall, W.M. and Kleinhenz, J.E., Performance Analysis of Specific Impulse Tests of a 100-lbf (445-N) LO2/LCH4 Reaction Control Engine at Altitude Conditions, NASA/TM—2011-217131, National Aeronautics and Space Administration, Cleveland, OH, 2011.
8. The Historic Rocket Engine Test Facility, Produced by: NASA GRC, Available from: http://retf.grc.nasa.gov/, Last Accessed 2011.
9. Smith, T.A., Pavli, A.J., and Kacynski, K.J., "Comparison of Theoretical and Experimental Thrust Performance of a 1030:1 Area Ratio Rocket Nozzle at a Chamber Pressure of 2413 kN/m2 (350 psia)," AIAA–87–2069, AIAA/SAE/ASME/ASEE 23rd Joint Propulsion Conference, San Diego, CA, June 29– July 2, 1987.
10. Pavli, A.J., Kacynski, K.J., and Smith, T.A., Experimental Thrust Performance of a High-Area-Ratio Rocket Nozzle, NASA TP–2720, National Aeronautics and Space Administration, Cleveland, OH, 1987.
11. DIAdem: Getting Started with DIAdem, National Instruments, Austin, TX, 2009. 12. Grasl, S.J., Skaff, A.F., Nguyen, C., Schubert, J., and Arrington, L., "Liquid Methane/Liquid
Oxygen Propellant Conditioning and Feed System (PCFS) Test Rigs—Preliminary Test Results," JANNAF 57th JPM/7th MSS/5th LPS/4th SPS Joint Subcommittee Meeting, Colorado Springs, CO, May 3-7, 2010.
13. Skaff, A., Grasl, S., Nguyen, C., Hockenberry, S., Schubert, J., Arrington, L., and Vasek, T., "Liquid Methane/Liquid Oxygen Propellant Conditioning Feed System (PCFS) Test Rigs," JANNAF 3rd Spacecraft Propulsion System Joint Subcommittee Meeting, Orlando, FL, December 8-12, 2008.
14. Stiegemeier, B.R. and Marshall, W.M., "Sea-Level Testing of a 100 lbf LOX/Methane Reaction Control Engine", JANNAF 57th JPM/7th MSS/5th LPS/4th SPS Joint Subcommittee Meeting, Colorado Springs, CO, May 3–7, 2010.
15. Lemmon, E.W., Huber, M.L., and Mclinden, M.O., NIST Standard Reference Database 23: Reference Fluid Thermodynamic and Transport Properties-REFPROP, Version 8.0, National Institute of Standards and Technology, Standard Reference Data Program, Gaithersburg, MD, 2007.
NASA/TM—2012-217613 32
16. JANNAF Rocket Engine Performance Test Data Aquisition and Interpretation Manual, CPIA Publication 245, Chemical Propulsion Information Agency, Silver Spring, MD, 1975.
17. Aerojet, Telecon, January 20, 2010. 18. Klimek, R.B. and Wright, T.W., Spotlight-16 Image Analysis Software, Software Manual Version
2004.4.27, 2004. 19. Aerojet, Telecon, April 28, 2010.
NASA/TM—2012-217613 33
Appendix A31B31B.—Acronyms and Symbols
The acronyms and symbols found in this report are presented here. Acronyms ACS Altitude Combustion Stand EPW electronic pulse width ETDP Exploration and Technology Development Program FFC fuel film cooling FFT fast Fourier transform JANNAF Joint Army, Navy, NASA, Air Force MIB minimum impulse bit (lbf-s (N-s)) MR mixture ratio NASA National Aeronautics and Space Administration NIST National Institute of Standards and Technology PCAD Propulsion and Cryogenic Advanced Development (project) PCFS propellant conditioning feed system PLC programmable logic controller RCE reaction control engine RETF Rocket Engine Test Facility RTD resistance temperature detector SEM scanning electron microscope SN serial number TFV Fuel temperature measured just upstream of thruster valves, °R (K) TOV Oxidizer temperature measured just upstream of thruster valves, °R (K) WSTF White Sands Test Facility Symbols A area, in.2 (mm2) B bias error b uncertainty value Cd discharge coefficient c* characteristic exhaust velocity, ft/s (m/s) F thrust force, lbf (N) I-bit impulse bit (lbf-s (N-s)) Isp specific impulse, s L′ characteristic chamber length, in. (mm) m mass flow rate, lbm/s (kg/s) MR mixture ratio, oxidizer/fuel (O/F), lbm/s oxidizer / lbm/s fuel (kg/s oxidizer / kg/s fuel) P pressure, psia (MPa)
precision uncertainty T time, s Q volumetric flow rate, gal/min (L/min) t factor from Student’s t-distribution

NASA/TM—2012-217613 34
Δ differential fluid density, lbm/ft3 (kg/m3) Subscripts amb ambient c chamber calc calculated uncertainty cali calibration uncertainty cav chamber acoustic cavity e nozzle exit F thrust force f fuel ign igniter inst instrument uncertainty meas measurement uncertainty o oxidizer therm thermal expansion effects throat throat total total vac vacuum condition

NASA/TM—2012-217613 35
Appendix B 32B32B.—X ray and Scanning Electron Microscope Results
Small samples of the coating from one of the damaged nozzles, serial number (SN)–3, were provided to the NASA Glenn materials group for analysis. The nozzle was scraped in both damaged and undamaged areas for comparison. Kapton® tape (DuPont) was used to collect and contain the sample. The following information is the raw data that led to the conclusions provided by Dongming Zhu of the NASA Glenn materials group, who performed this analysis.
X ray diffraction data was gathered using a D8 Advance Diffractometer using Cu K radiation. Data was also gathered on the D8 Discover Diffractometer (area detector) to check for grain size effects. Full even-intensity Debye rings were observed indicating good sampling statistics. Samples of light and dark Kapton tape were also run to determine the contribution of the tape to the background. The scan of the light tape corresponded well with both datasets.
B.1 34B34BX ray Diffraction: Undamaged (Baseline)
Position [°2Theta] (Copper (Cu))
10 20 30 40 50 60 70 80 90 100
Counts
0
10000
40000
90000
Peak List
Nb Si2; Hexagonal; 04-003-6241
Fe0.998 O; Cubic; 04-002-3667
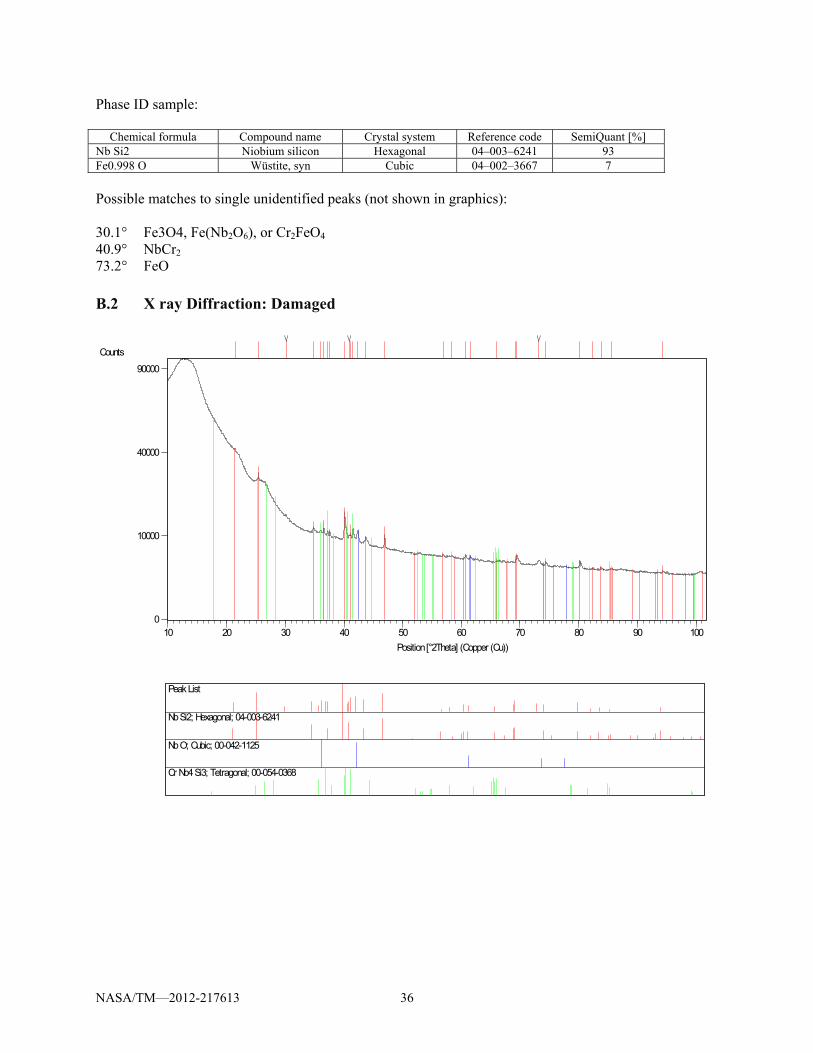
NASA/TM—2012-217613 36
Phase ID sample:
Chemical formula Compound name Crystal system Reference code SemiQuant [%] Nb Si2 Niobium silicon Hexagonal 04–003–6241 93 Fe0.998 O Wüstite, syn Cubic 04–002–3667 7
Possible matches to single unidentified peaks (not shown in graphics): 30.1° Fe3O4, Fe(Nb2O6), or Cr2FeO4 40.9° NbCr2 73.2° FeO
B.2 35B35BX ray Diffraction: Damaged
Position [°2Theta] (Copper (Cu))
10 20 30 40 50 60 70 80 90 100
Counts
0
10000
40000
90000
Peak List
Nb Si2; Hexagonal; 04-003-6241
Nb O; Cubic; 00-042-1125
Cr Nb4 Si3; Tetragonal; 00-054-0368
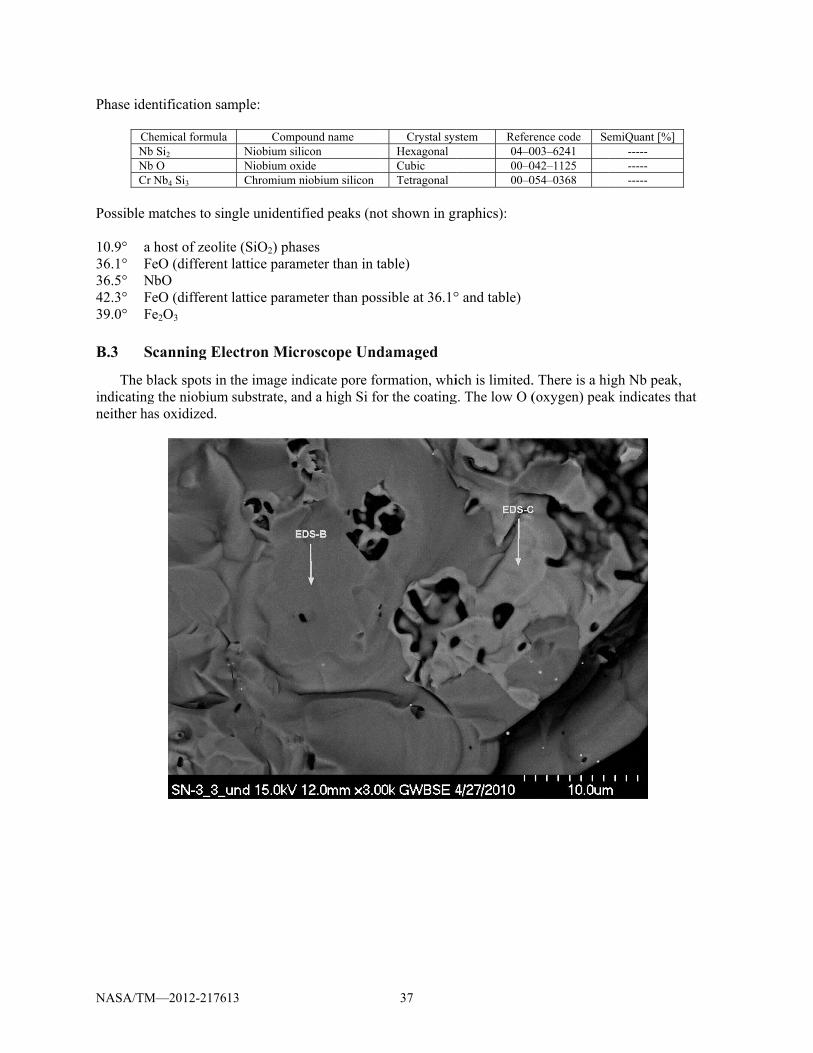
NASA/TM
Phase iden
ChNbNbCr
Possible m 10.9° a 36.1° F36.5° N42.3° F39.0° F
B.3 36B36BS
The bindicatingneither ha
M—2012-21761
ntification sam
hemical formula b Si2 b O
Nb4 Si3
matches to sin
host of zeoliteO (different
NbO eO (different e2O3
canning Ele
black spots in g the niobium as oxidized.
13
mple:
CompoNiobium siliNiobium oxiChromium n
ngle unidentif
te (SiO2) phaslattice param
lattice param
ectron Micr
the image indsubstrate, an
ound name con ide niobium silicon
fied peaks (no
ses meter than in t
meter than pos
roscope Und
dicate pore fond a high Si fo
37
Crystal sysHexagonal Cubic Tetragonal
ot shown in gr
table)
ssible at 36.1°
damaged
ormation, whior the coating
stem Refer04–000–000–0
raphics):
° and table)
ich is limited.g. The low O (
rence code Se003–6241 042–1125 054–0368
. There is a hi(oxygen) peak
emiQuant [%] ----- ----- -----
igh Nb peak, k indicates th
hat
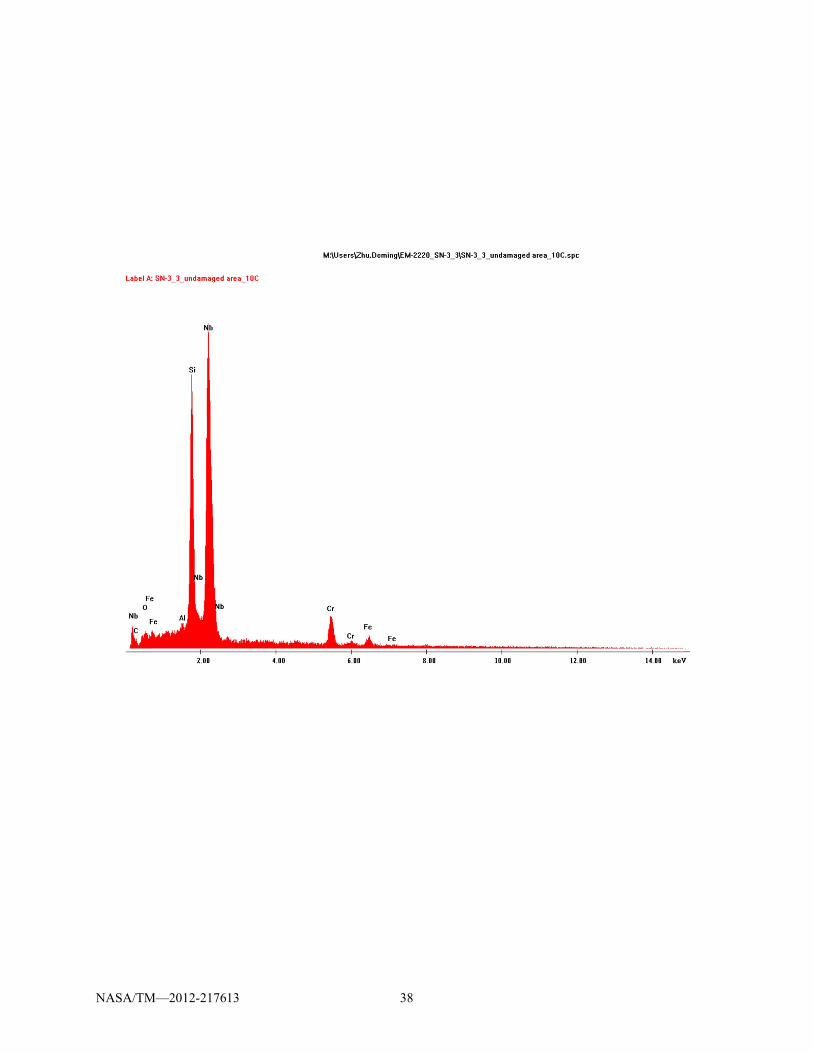
NASA/TM
M—2012-2176113
38
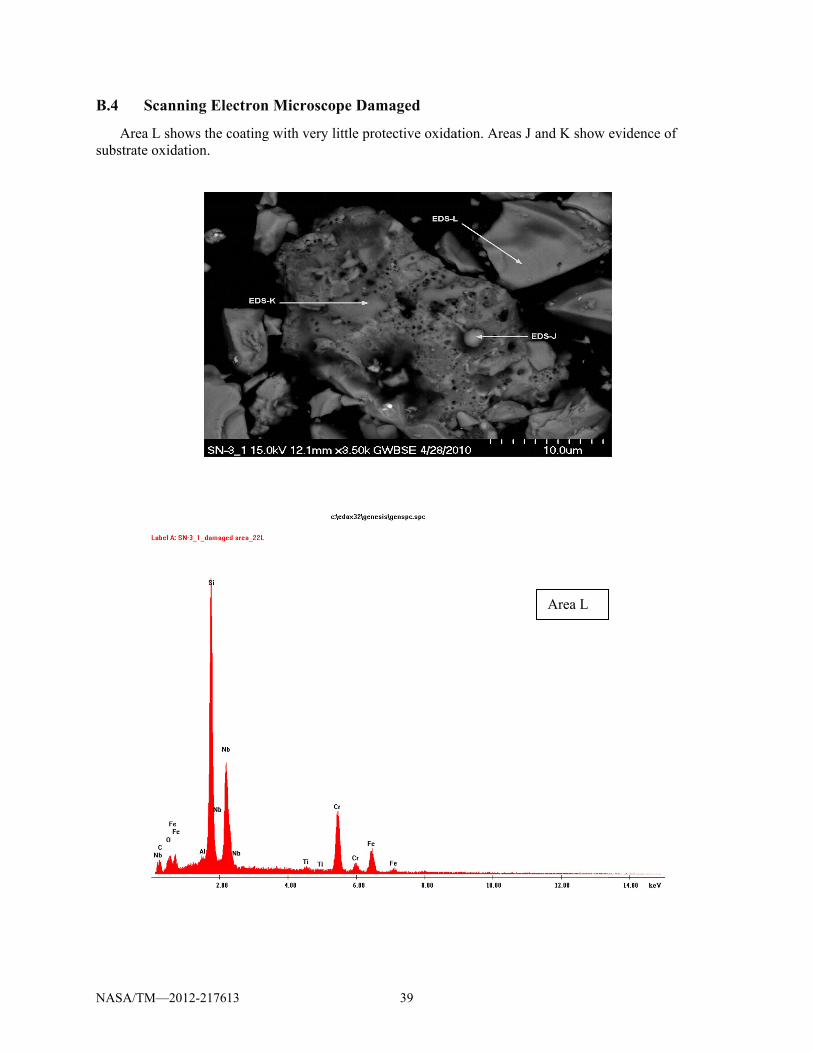
NASA/TM
B.4 37B37BS
Area substrate o
M—2012-21761
canning Ele
L shows the coxidation.
13
ectron Micr
coating with v
roscope Dam
very little pro
39
maged
otective oxida
ation. Areas J and K show
Area L
evidence of

NASA/TMM—2012-2176113 40
Area K
Area J
NASA/TM—2012-217613 41
Appendix C33B33B.—Test Data Log
The following tables list all tests that were performed as part of this study. The measurements are averages taken over the I-bit integration time. (Note that for high duty cycle (e.g., 50 percent) the chamber pressure never decays to 17.5 psi, which is the end point of the I-bit integration defined in Section 5.1. Therefore, the integration time ends when the next pulse begins). The information is abbreviated with respect to JANNAF standards to facilitate easier viewing of the parameters referenced in this document. The full table is available upon request.
Column descriptions: (1) Run #: The number of the test run as referenced to the first facility tests in the 100-lbf RCE test
program. (2) Test Description: The target conditions and/or purpose for the run is given. (3) All successful hot fire tests are indicated by their target propellant temperature (nominal, warm,
or cold). (4) With the exception of a few tests, the flow rates were set to achieve a mixture ratio (MR) of 2.5
based on the previous specific impulse test series. There are a few conditions designated “MR Low” which used the set point for an MR=2.0.
(5) “Thrust Cal” indicates a calibration of the thrust load cell. All calibrations were performed at altitude conditions. These calibrations were performed at the beginning and end of each day
(6) “Late ignition” indicates that for one of the pulses in a given spark train, ignition occurred late. This triggered an abort, as described in section 4.7.1, which caused an incomplete (aborted) pulse train.
(7) “No-ignition” indicates that a given pulse in the train failed to ignite, resulting in an incomplete pulse train.
(8) “Abort” indicates a facility abort. This could be triggered by a sensor reading out of limit. In some cases, this was due to an overly conservative limit set in the PLC (e.g. for the manifold pressures POJ and/or PFJ).
(9) Pulse Duration: The time between ignition and the closing of the propellant valves for each pulse. This is also known as the electronic pulse width (EPW).
(10) Number of Pulses achieved/planned: The first number specifies the number of successful pulses achieved, while the second number indicates the number of pulses intended for the pulse train.
(11) Duty Cycle: This indicates the frequency of pulsing. It is the ratio of the pulse duration to the total between pulses (pulse start to pulse start). For example, a test with a 5-percent duty cycle and 80-ms pulse durations would mean there is 1600 ms between pulses (80 ms of hot fire and 1520 ms of down time).
(12) Run Tank Pressures: The pressure in the propellant holding tanks. This is a pressure-driven flow system, so these pressures govern the mass flow rate of the propellants, and thus the MR.
(13) Run Tank Temperature: The temperature of the propellant in the holding tanks. The desired conditions (cold, nominal, and warm) were judged based on the temperature at the thruster valves. Thus the run tank temperatures were chosen to account for line losses. Note the temperatures are given in Fahrenheit, since this was the convention of the propellant conditioning systems (PFCS).
(14) Thrust parameters: The thrust measurements from the load cell. The first column (Thrust, lbf) is a summation of the three loads, corrected using the calibration coefficient or “K factor”. The “vacuum thrust” is corrected to vacuum relative conditions.
(15) Mass Flow: The mass flow rates and corresponding mixture ratio, or MR, of the propellants calculated at the venturi. During these short pulse times, these measurements are highly transient (Section 4.4.1) and these numbers are rough averages.
(16) Chamber pressure: The pressure inside the combustion chamber, “Pcav” averaged.

NASA/TM—2012-217613 42
(17) Valve temperature: The temperature at the propellant thruster valve. TOV is the oxidizer side, TFV is fuel.
(18) Test capsule pressure: The pressure in test cell. Therefore, the ‘ambient’ pressure of the engine. (19) Average I-bit: The I-bits for each individual pulse are averaged to obtain this number. (20) Note: Test specific notes.

RCE ACS Test summary: Pulse testing
Chamber pressure
Run # Test descriptionPulse Duration,
s
Number of pulses
achieved / planned
Duty Cycle LOX CH4 LOX CH4Thrust
(lbf)Vac Thrust
(lbf)K Factor
LOX Venturi (lbm/s)
CH4
Venturi (lbm/s)
MR venturi
Pcav (5607) TOV (5511) TFV (5011)Test Capsule
pressure, psiaAverage Ibit, lbf-s
NOTES
Columbium Nozzle SN#3, Injector 6, Champion Exciter (contunation from steady state tests)Interim activity: Prepare for pulse testing, software modified.
3/5/2010 Day Plan: Begin pulse test program at nominal conditions. Start with 1s duration and low number of pulses, gradually decrease duration and incorperate more pulses. Target is to get 80ms duration. End of Day: Very sucessful day.PCIGN broke at test 193. Took time to work out facility timing setting & did not have enough propellant to try for the 80ms case. Orange color in flame during 20s pulse... boroscope next day revealed more chamber spalling! These are not severe conditions, so don't know why it occurred.
190 Thrust cal191 Nominal 1 5/5 50% 325 265 43.93 47.11 1.028 0.121 0.054 2.24 96.87 200.95 202.91 0.232 86.096192 Nominal 1 5/5 50% 325 265 44.75 47.91 1.028 0.118 0.055 2.15 95.94 203.09 201.79 0.230 88.107
193 Nominal 1 5/5 50% 325 265 44.01 47.33 1.028 0.112 0.056 1.99 93.70 207.79 202.84 0.242 86.564PCIGN was lost during a pressure spike. Reading shift low, but can still continue testing
194 No ignition-Nominal 1 0/10 50% 325 265 -262 -265 1.028195 Nominal 1 10/10 50% 325 265 -262 -266 44.04 46.96 1.028 0.111 0.057 1.97 95.39 214.83 202.69 0.213 88.715196 Nominal 0.5 5/5 50% 325 265 -262 -264 45.62 49.55 1.028 0.120 0.058 2.06 97.36 206.96 203.55 0.286 43.798197 Nominal 0.5 5/5 50% 325 265 -262 -265 46.51 50.02 1.028 0.120 0.057 2.10 96.91 205.84 204.22 0.255 44.630198 Nominal 0.5 5/5 50% 325 265 -262 -262 46.06 49.21 1.028 0.117 0.058 2.01 94.73 207.42 204.56 0.230 43.533199 Facility abort- Nominal 0.1 0/5 50% 325 265 -261 -263 1.028200 Nominal 0.1 5/5 50% 325 265 52.29 56.07 1.028 0.142 0.074 1.93 101.94 205.21 203.77 0.276 9.931201 Facility abort- Nominal 0.1 0/10 50% 325 265 -262 -261 1.028202 Nominal 0.1 10/10 50% 325 265 -260 -262 55.32 59.02 1.028 0.142 0.076 1.87 108.13 205.09 202.31 0.270 10.808203 Facility abort- Nominal 0.1 0/20 50% 325 265 -260 -260 1.028
204 Nominal 0.1 20/20 50% 325 265 55.77 58.32 1.028 0.144 0.078 1.85 113.39 205.90 202.29 0.186 10.839 Some orange color and sparking observed in plume
205 Nominal 0.1 20/20 50% 325 265 54.55 57.59 1.028 0.139 0.076 1.83 110.05 208.86 207.56 0.221 10.667 Some orange color and sparking observed in plume206 Thrust cal
NEW Columbium Nozzle SN#1Interim Activity: The SN#3 nozzle was removed, inspection confirmed spalling seen with boroscope. Virgin spare Nozzle SN1 was put on the stand. Pcign transducer was replaced with the more rugged Tabor sensors.
3/12/2010 Day Plan: Run at very benign conditions since we don't know what caused damage. No more than 10pulses. Goal is to get some tests at 80msEnd of Day: Lost Pcign on 1st test. Late ignitions triggering aborts… cannot set abort limits any shorter. Methane lag diminishing as train proceeds… could this be a cause of spalling?
207 Thrust Cal208 Late ignition - Nominal 0.1 4/5 25% 325 265 -263 -257 35.33 39.59 1.028 0.119 0.065 1.82 68.75 225.70 204.39 0.311 5.969 Late ignition on last pulse209 Nominal 0.08 1/1 25% 325 265 -264 -258 38.12 42.25 1.028 0.166 0.086 1.94 69.63 200.02 203.64 0.300 0.000 One pulse to check facility timing210 Late ignition - Nominal 0.08 2/5 25% 325 265 -264 -257 38.17 41.86 1.028 0.151 0.071 2.13 71.57 205.22 206.65 0.269 6.781 Late ignition211 Nominal 0.08 5/5 25% 325 265 -256 -264 37.87 41.80 1.028 0.139 0.067 2.07 71.43 206.29 212.16 0.286 7.423 We are loosing methane lag by the 3rd pulse. 212 Nominal 0.1 5/5 25% 325 265 42.50 46.58 1.028 0.128 0.071 1.81 80.57 207.83 211.96 0.293 9.069 Repeat earlier test to check methane lag.213 Thrust cal
Interim Activity: Looked at data, still loosing methane lag. Don't know what is causing. Replace tabor pressure transducer and add higher range transducer to try to catch the problem3/18/2010 Day Plan: Move to warm conditions, operate in 'safe' mode since we still don't know cause. Goal is to get SOME test for milestone progression and see effect of temp on lag
End of Day: There was difficultly with the Pcav abort, the window is so small at these durations that a late ignition (at the tail end of window) may mean Pcav has not met the abort condition. Easiest solution is to shift the abort window 10ms later even though this may overlap the LOX valve closing214 Thrust cal215 Late ignition - Warm 0.1 0/1 25% 370 265 -238 -237 Ignition occurred after abort (in Zone 4)216 Late ignition - Warm 0.1 4/5 25% 370 265 -238 -236 40.49 44.48 1.029 0.131 0.065 2.00 75.55 218.38 217.71 0.291 8.128 Late ignition
217 Warm 0.08 5/5 25% 370 265 -238 -235 38.48 42.65 1.029 0.136 0.064 2.11 71.09 222.59 221.96 0.304 6.944Move to 80ms to mimic 3/12/2010 test in terms of hardware temps
218 Late ignition - Warm 0.08 2/5 25% 370 265 -238 -235 38.73 42.52 1.029 0.146 0.067 2.17 70.88 224.09 219.76 0.277 6.294 Late ignition219 Late ignition - Warm 0.08 1/5 25% 370 265 -238 -235 30.91 33.77 1.029 0.159 0.076 2.10 53.22 224.36 222.08 0.208 0.000 Repeat of last test. Late ignition220 Late ignition - Warm 0.08 3/5 25% 370 265 -238 -236 41.74 44.70 1.029 0.135 0.068 2.00 75.90 224.47 220.08 0.216 6.899 Late ignition
221 Warm 0.1 5/5 25% 370 265 -238 -236 40.86 44.38 1.029 0.125 0.066 1.91 76.56 224.04 221.09 0.254 8.172Return to 100ms to look at hardware temp effects (compare with test 216)
222 Late ignition - Warm 0.1 4/5 25% 370 265 -238 -235 43.52 46.80 1.029 0.130 0.066 1.97 81.05 224.30 221.92 0.243 8.284 Late ignition223 Thrust cal
3/23/2010 Day Plan: Move to Cold conditions, still use relatively benign settings to avoid spalling. The methane recirculation pump broke prior to testing. Decided to proceed with test day even though methane will not meet cold condition. End of Day: Light spalling was found on post-test inspection. Stopped testing to explore potential causes more thoroughly
224 Thrust cal
225 Late ignition - Cold 0.1 1/5 25% 325 285 -303 -280 27.45 30.80 1.032 0.118 0.064 1.84 36.73 171.47 190.38 0.245Aborted on the manifold pressures (both)... looks like late ignition
226 Abort -Cold 0.1 1/5 25% 325 285 -305 -280 39.24 42.27 1.032 0.123 0.066 1.87 57.29 175.72 190.37 0.221 2.495
Abort on PFJ ( effect sees in previous cold tests)…ignitions also are later in the cold cases. Will lower PFJ abort to 75 and POJ to 140. Also shift Pcav abort to the right
227 Late ignition - Cold 0.1 2/5 25% 325 285 -305 -280 41.46 45.08 1.032 0.169 0.109 1.55 76.12 175.02 189.09 0.259 9.597Llate ignition, shift Pcav abort. Pressure transient in Methane on 1st pulse, the drop out causes LOX lag.
228 Abort -Cold 0.1 4/5 25% 325 285 -305 -280 43.97 47.46 1.032 0.165 0.089 1.86 82.43 176.12 189.81 0.244 10.433
Abort POJ: Pressure transient in 1st pulse, methane decay is very slow and influction point is more severe (going positive).
Run Tank Pressure, psig
Run Tank Temperature, Deg F
Thrust paramaters Average Venturi Mass flowValve Temps (R)
NASA/TM—2012-217613 43

Chamber pressure
Test # Test descriptionPulse Duration,
s
Number of pulses
achieved / planned
Duty Cycle LOX CH4 LOX CH4Thrust
(lbf)Vac Thrust
(lbf)K Factor
LOX Venturi (lbm/s)
CH4
Venturi (lbm/s)
MR venturi
Pcav (5607) TOV (5511) TFV (5011)Test Capsule
pressure, psia
Average train Ibit,
lbf-sNOTES
229 Late ignition - Cold 0.08 0/5 25% 325 285 -305 -279 0.329 Late ignition… looks like it ignited on LAST spark or after
230 Late ignition - Cold 0.08 2/5 25% 325 285 -305 -280 38.96 42.83 1.032 0.200 0.137 1.46 72.27 171.63 188.10 0.281 8.742Abort POJ - late ignition AND preignition on last (3rd pulse)
231 No ignition -Cold 0.08 0/5 25% 325 285 -305 -281 166.74 188.57 0.307No ignition… the bleeds had been increased on this run, so they are going to back off to previous sets
232 Abort - Cold 0.08 4/5 25% 325 285 -305 -278 41.57 45.64 1.032 0.146 0.087 1.68 80.50 172.36 188.01 0.278 9.112 Abort POJ233 Thrust cal
Installed Unison ExciterInterim activity: Anaysis of previous test data shows we need longer pulse trains to resolve pulse behavior. No definitive answer on the coating damage. Materials group analysis shows possible Pesting issue. Previously observed methane lag issues do not appear to be a problem.
6/3/2010 Day Plan: Run at nominal conditions. Chamber has been clocked to monitor damage locations. Reduce Duty cycle to 5%, run longer pulse trains (10pulses).End of Day: After facility abort resulting in a long duration (10s) test, we ended testing to check for damage. Good data from 1st two tests. Double pulse phenomena in run 235
234 Thrust cal235 Nominal 0.08 10/10 5% 325 285 33.94 38.89 1.019 0.161 0.086 1.88 68.66 219.55 214.62 0.361 5.557236 Nominal 0.08 10/10 5% 325 285 36.58 41.71 1.019 0.184 0.086 2.14 71.38 197.41 211.30 0.374 7.607
237 Faciity abort - Nominal 0.08 0/10 5% 325 285
Engine aborted on pulse 2, but missed a facility abort and the valves did not closed. Had to use E-stop
Interim activity: Checked facility and engine. Facility had some heat damage from e-stop blow back. Engine had some discoloration on the bell… some blue that we haven't seen before. Boroscope does not indicate any spalling or other damage internal chamber. 6/10/2010 Day Plan: Run Warm/Warm, 3 tests at 10pulse train.
End of Day: Got 3 good tests (good temp, no abort) at condition, and one more at higher temp. Did a timing test to see what would take to get a 40ms pulse duration. 238 Thrust Cal
239 Warm 0.08 10/10 5% 370 265 -239 -236 36.33 40.88 1.026 0.149 0.067 2.24 69.94 231.30 243.79 0.332 5.298
POJ had gain error, readings are off. Fixed before next test. Did not hit temp targets, line traces will be adjusted
240 Warm 0.08 10/10 5% 370 265 -238 -238 37.59 42.62 1.026 0.149 0.076 1.96 73.71 224.41 223.44 0.366 6.371241 Late ignition - Warm 0.08 6/10 5% 370 265 -238 -238 37.11 42.14 1.026 0.160 0.078 2.06 72.41 222.42 226.75 0.367 6.385 Late ignition242 Warm 0.08 10/10 5% 370 265 -238 -236 39.04 43.75 1.026 0.146 0.077 1.90 74.61 222.94 227.15 0.343 6.742243 Warm 0.08 10/10 5% 370 265 -238 -237 37.91 42.77 1.026 0.147 0.078 1.90 74.12 223.06 224.99 0.354 6.646244 Cold flow to test 40ms timing 0.04 10/10 5% 370 265 40ms timing sucessful, no aborts245 Thrust cal
Interim activity: Checked data and looked at double pulse phenomena. May be liquid collecting in manifold, then off gasing and reacting (autoignite) in the methane lag period6/15/2010 Day Plan: Cold/Cold with 3 good tests of 10 pulse trains. Methane reciculation pump sill non-operational, so temperatures will likely not reach target
End of Day: First test was warm. Increased bleeds to get colder. Several aborts on POJ, reduced abort limit to 100psi to correct, then 2 good tests. Last test we reduced methane lag to see if effects double pulse.246 Thrust Cal247 Cold 0.08 10/10 5% 325 285 -302 -280 41.39 46.52 1.027 0.171 0.083 2.07 81.75 179.18 208.01 0.374 8.857248 Cold 0.08 10/10 5% 325 285 -301 -280 42.48 48.04 1.027 0.160 0.083 1.92 83.87 177.80 203.27 0.405 9.632 Increased bleed to lower temp249 Abort - Cold 0.08 7/10 5% 325 285 -301 -279 43.02 48.39 1.027 0.165 0.086 1.92 84.13 170.42 197.65 0.391 10.002 Abort POJ -Increased bleed to lower temp250 Abort - Cold 0.08 6/10 5% 325 285 -300 -278 43.46 48.64 1.027 0.169 0.088 1.93 83.65 171.23 195.67 0.377 9.947 Abort POJ 251 Cold 0.08 10/10 5% 325 285 -301 -278 42.27 47.51 1.027 0.162 0.083 1.95 83.05 174.29 198.75 0.382 9.850
252 Cold 0.08 5/5 5% 325 285 38.61 43.93 1.027 0.183 0.088 2.09 75.56 179.68 198.93 0.388 8.391
Changed methane lag to see if can eliminate the double pulse. Double pulse still occurred, severity will be examined
253 Thrust CalInterim activity:
6/17/2010 Day Plan: Longer pulse trains and possibly 40ms pulse durationEnd of Day: Successful day
254 Thrust Cal255 Late ignition - Nominal 0.08 12/15 5% 325 265 -262 -268 36.81 41.85 1.030 0.146 0.083 1.74 71.18 207.81 207.51 0.368 6.836 Late ignition256 Nominal 0.08 15/15 5% 325 265 -261 -265 37.40 42.92 1.030 0.137 0.080 1.70 73.67 208.42 209.57 0.402 7.394 257 Nominal 0.08 20/20 5% 325 265 -260 -268 38.62 44.03 1.030 0.132 0.077 1.72 75.35 208.13 208.30 0.395 7.967258 Nominal 0.08 20/20 5% 325 265 -261 -269 38.92 44.22 1.030 0.132 0.078 1.70 76.49 209.43 207.81 0.386 7.699
259 Nominal 0.08 30/30 5% 325 265 -260 -270 38.97 44.46 1.030 0.132 0.077 1.72 77.31 213.23 208.79 0.400 7.29620 pulses look consistant and safe, will tried a 30 to match aerojet testing
260 Nominal 0.04 5/5 5% 325 265 -260 -268 25.22 31.15 1.030 0.151 0.081 1.87 50.16 207.29 196.53 0.433 3.265261 Nominal 0.04 5/5 5% 325 265 -260 -271 24.81 30.44 1.030 0.155 0.083 1.88 50.43 206.49 195.77 0.410 3.269262 Thrust cal
Compact Exciter InstalledInterim activity: Installed the compact exciter, Data system recalibrated, new data channels for compact exiciter data signals
7/7/2010 Day Plan: Warm/Warm with the compact exciter. Up to 30 pulse cycles. Nominal mixture ratio. 1 test at low MR at conclusion of day. 40 ms pulse train at endEnd of Day: Exciter performed well, there were no dropouts or ignition failures. No issues encountered.
263 Thrust cal264 Warm 0.08 10/10 5% 370 265 -242 -239 32.44 38.04 1.038 0.145 0.071 2.03 66.15 228.93 237.69 0.408 4.849265 Warm 0.08 30/30 5% 370 265 -241 -238 35.63 41.35 1.038 0.132 0.071 1.86 70.59 229.31 233.21 0.417 5.804266 Warm 0.08 30/30 5% 370 265 -240 -238 36.51 42.05 1.038 0.124 0.072 1.73 70.95 232.12 229.18 0.404 6.023267 Warm 0.08 30/30 5% 370 265 -241 -237 36.48 42.17 1.038 0.127 0.072 1.77 70.29 236.11 227.42 0.415 5.672
Run Tank Pressure, psig
Run Tank Temperature, Deg F
Thrust paramaters Average Venturi Mass flowValve Temps (R)
NASA/TM—2012-217613 44

Chamber pressure
Test # Test descriptionPulse Duration,
s
Number of pulses
achieved / planned
Duty Cycle LOX CH4 LOX CH4Thrust
(lbf)Vac Thrust
(lbf)K Factor
LOX Venturi (lbm/s)
CH4
Venturi (lbm/s)
MR venturi
Pcav (5607) TOV (5511) TFV (5011)Test Capsule
pressure, psia
Average train Ibit,
lbf-sNOTES
268 Warm - Low MR 0.08 10/10 5% 330 265 -241 -247 35.24 41.30 1.038 0.136 0.082 1.66 68.42 229.01 218.89 0.441 5.646 Lower O/F to push ignition limits269 Warm - Low MR 0.08 10/10 5% 330 265 -240 -240 35.40 41.62 1.038 0.148 0.082 1.81 70.66 224.41 220.06 0.453 6.076 Lower O/F repeat270 Warm 0.04 5/5 5% 370 265 -240 -240 27.40 33.83 1.038 0.157 0.076 2.07 54.67 220.45 208.57 0.468 3.498 40ms pulse duration- Aborts off271 Warm 0.04 5/5 5% 370 265 -240 -240 29.45 36.04 1.038 0.146 0.076 1.92 58.82 213.18 215.68 0.480 5.536 40ms pulse duration- Aborts off272 Thrust cal
Interim activity:7/9/2010 Day Plan: Cold/Cold with the compact exciter. Up to 30 pulse cycles. Nominal mixture ratio. 1 test at low MR at conclusion of day. 40 ms pulse train at end
End of Day: Temperature conditions were too warm, but continued testing to prove out exciter. Test 279 almost out of Nitrogen, so we went to 40ms tests instead of repeating low MR. Double pulse observed in almost all 30pulses.273 Thrust Cal274 Late ignition - Cold 0.08 6/10 5% 325 285 -302 -277 35.96 42.11 1.031 0.199 0.089 2.24 70.80 182.45 204.53 0.449 7.714 Late ignition275 Cold 0.08 10/10 5% 325 285 -302 -278 37.31 43.83 1.031 0.153 0.080 1.90 75.99 180.72 203.75 0.475 8.705276 Cold 0.08 30/30 5% 325 285 -303 -278 37.51 43.55 1.031 0.147 0.073 2.03 77.49 185.91 215.37 0.441 8.114
277 Cold 0.08 10/10 5% 325 285 -302 -277 40.12 46.38 1.031 0.162 0.086 1.89 79.24 174.35 203.26 0.456 9.189Try to force the CH4 traces on during test to better regulate temp
278 Cold 0.08 30/30 5% 325 285 -302 -278 40.07 46.25 1.031 0.149 0.075 1.98 81.12 182.90 210.80 0.450 8.630Try to force the CH4 traces on during test to better regulate temp
279 Late ignition - Cold - Low MR 0.08 3/10 5% 290 285 -302 -277 34.44 40.76 1.031 0.195 0.115 1.70 67.87 175.42 196.45 0.460 7.826Late ignition Try to force the CH4 traces on during test to better regulate temp.
280 No ignition -Cold 0.04 4/5 5% 325 285 -302 -275 23.71 30.12 1.031 0.173 0.097 1.79 44.74 170.22 192.77 0.467 3.810 Non-ignition281 No ignition -Cold 0.04 3/5 5% 325 285 25.24 31.51 1.031 0.179 0.100 1.80 49.08 169.11 191.70 0.457 4.138 Non-ignition282 Thrust cal
Interim activity:7/13/2010 Day Plan: Nominal with the compact exciter. Up to 30 pulse cycles. Nominal mixture ratio. 1 test at low MR and a few 40 ms pulse trains
End of Day: Traces left on during all tests to try to maintain temperature better (reduce line heating issues)283 Thrust Cal284 Nominal 0.08 10/10 5% 325 265 -269 -265 34.70 37.99 1.025 0.177 0.077 2.30 69.01 189.04 211.39 0.240 6.853 Traces on during pulses285 Nominal 0.08 30/30 5% 325 265 -266 -266 38.38 41.95 1.025 0.142 0.067 2.11 78.04 186.62 214.43 0.260 7.706 Traces on during pulses286 Nominal 0.08 30/30 5% 325 265 -266 -265 40.56 43.95 1.025 0.142 0.069 2.06 80.32 186.30 208.51 0.247 8.088 Traces on during pulses
287 Late ignition -Nominal 0.08 20/30 5% 325 265 -265 -263 36.63 40.36 1.025 0.139 0.079 1.75 71.99 207.68 204.96 0.272 6.063Late ignition. Traces on during pulses, Adjust Lox trace to get warmer
288 Nominal 0.08 30/30 5% 325 265 -265 -265 38.23 41.94 1.025 0.135 0.073 1.84 75.95 201.92 206.30 0.270 7.382Traces on during pulses, Repeat…last abort was anomoly- caught PFJ late
289 Nominal 0.04 5/5 5% 325 265 -265 -264 25.56 29.75 1.025 0.149 0.080 1.88 51.92 203.15 196.87 0.305 3.189 Traces on during pulses290 Late ignition -Nominal - Low MR 0.08 3/30 5% 275 265 -265 -264 32.12 36.36 1.025 0.155 0.099 1.57 65.22 204.27 199.76 0.308 5.465 Late ignition. Traces on during pulses291 Nominal - Low MR 0.08 30 5% 275 265 -265 -264 30.95 34.71 1.025 0.117 0.077 1.52 62.51 224.61 205.39 0.275 4.341 Traces on during pulses, Warm on LOX292 Thrust cal
Run Tank Pressure, psig
Run Tank Temperature, Deg F
Thrust paramaters Average Venturi Mass flowValve Temps (R)
NASA/TM—2012-217613 45
REPORT DOCUMENTATION PAGE Form Approved
OMB No. 0704-0188 The public reporting burden for this collection of information is estimated to average 1 hour per response, including the time for reviewing instructions, searching existing data sources, gathering and maintaining the data needed, and completing and reviewing the collection of information. Send comments regarding this burden estimate or any other aspect of this collection of information, including suggestions for reducing this burden, to Department of Defense, Washington Headquarters Services, Directorate for Information Operations and Reports (0704-0188), 1215 Jefferson Davis Highway, Suite 1204, Arlington, VA 22202-4302. Respondents should be aware that notwithstanding any other provision of law, no person shall be subject to any penalty for failing to comply with a collection of information if it does not display a currently valid OMB control number. PLEASE DO NOT RETURN YOUR FORM TO THE ABOVE ADDRESS.
1. REPORT DATE (DD-MM-YYYY) 01-06-2012
2. REPORT TYPE Technical Memorandum
3. DATES COVERED (From - To)
4. TITLE AND SUBTITLE Analysis of 100-lbf (445-N) LO2-LCH4 Reaction Control Engine Impulse Bit Performance
5a. CONTRACT NUMBER
5b. GRANT NUMBER
5c. PROGRAM ELEMENT NUMBER
6. AUTHOR(S) Marshall, William, M.; Kleinhenz, Julie, E.
5d. PROJECT NUMBER
5e. TASK NUMBER
5f. WORK UNIT NUMBER WBS 253225.04.02.01.06.01
7. PERFORMING ORGANIZATION NAME(S) AND ADDRESS(ES) National Aeronautics and Space Administration John H. Glenn Research Center at Lewis Field Cleveland, Ohio 44135-3191
8. PERFORMING ORGANIZATION REPORT NUMBER E-18198
9. SPONSORING/MONITORING AGENCY NAME(S) AND ADDRESS(ES) National Aeronautics and Space Administration Washington, DC 20546-0001
10. SPONSORING/MONITOR'S ACRONYM(S) NASA
11. SPONSORING/MONITORING REPORT NUMBER NASA/TM-2012-217613
12. DISTRIBUTION/AVAILABILITY STATEMENT Unclassified-Unlimited Subject Categories: 12, 20, and 28 Available electronically at http://www.sti.nasa.gov This publication is available from the NASA Center for AeroSpace Information, 443-757-5802
13. SUPPLEMENTARY NOTES
14. ABSTRACT Recently, liquid oxygen-liquid methane (LO2-LCH4) has been considered as a potential “green” propellant alternative for future exploration
missions. The Propulsion and Cryogenic Advanced Development (PCAD) project was tasked by NASA to develop this propulsion combination to enable safe and cost-effective exploration missions. To date, limited experience with such combinations exist, and as a result a comprehensive test program is critical to demonstrating with the viability of implementing such a system. The NASA Glenn Research Center conducted a test program of a 100-lbf (445-N) reaction control engine (RCE) at the Center’s Altitude Combustion Stand (ACS), focusing on altitude testing over a wide variety of operational conditions. The ACS facility includes unique propellant conditioning feed systems (PCFS), which allow precise control of propellant inlet conditions to the engine. Engine performance as a result of these inlet conditions was examined extensively during the test program. This paper is a companion to the previous specific impulse testing paper, and discusses the pulsed-mode operation portion of testing, with a focus on minimum impulse bit (MIB) and repeatable pulse performance. The engine successfully demonstrated target MIB performance at all conditions, as well as successful demonstration of repeatable pulse widths. Some anomalous conditions experienced during testing are also discussed, including a double pulse phenomenon, which was not noted in previous test programs for this engine. 15. SUBJECT TERMS Methane; Liquid oxygen; Propellants; Vacuum; Specific impulse
16. SECURITY CLASSIFICATION OF: 17. LIMITATION OF ABSTRACT UU
18. NUMBER OF PAGES
52
19a. NAME OF RESPONSIBLE PERSON STI Help Desk (email:[email protected])
a. REPORT U
b. ABSTRACT U
c. THIS PAGE U
19b. TELEPHONE NUMBER (include area code) 443-757-5802
Standard Form 298 (Rev. 8-98)Prescribed by ANSI Std. Z39-18