analysis of architectural space …okazaki/ok/ml/mlpdf1/aid220.pdf · analysis of architectural...
TRANSCRIPT
ANALYSIS OF ARCHITECTURAL SPACE COMPOSITION USING
INDUCTIVE LOGIC PROGRAMMING
NORITOSHI SUGIURA, SHIGEYUKI OKAZAKI
Department of Architecture and Environmental Design,
Kyoto University, Japan
Abstract. In this paper, we summarized an application of the ILP tech-nique to the analysis of the human design process in architectural de-sign. We focused particularly on discovering the patterns in the spatialcomposition process in the framework of design analysis called Archi-tectural Space Montage Technique. Spatial composition data used in thispaper are complexly structured data, which are collections of architec-tural objects with geometric relationships. The objects and relationshipsare constrained within a given set of attributes (such as object type, ob-ject angle, time stamp, relation type) together with background knowl-edge on the class hierarchies of object types and relation types. We mod-eled these spatial composition process data in first-order logic and ap-plied the ILP system Progol to discover design patterns that character-
ized the given data.
1. Introduction
In this study, the process of architectural design was analyzed by Inductive
Logic Programming (ILP) (Muggleton, 1994; Lavrac and Dzeroski et al., 1999).
ILP is a machine learning technique based on first-order logic that executes
Inductive Reasoning, which is the generalizing of results from examples to
generate new concepts.
In various contexts, it has been reported in the domain of phenomenology
or developmental psychology that humans have unconscious spatial schemata
that enables them to recognize space (Merleau-Ponty, 1945; Piaget, 1963). In
support of this theory, it has been proposed that the human design process is
affected by the schemata, and these appear as compositional patterns of such
architectural elements as walls, furniture, buildings and so on (Schulz, 1973;
Bollnow, 1963). In order to create an architectural space suitable for human
recognition, it is important to find the latent patterns of spatial composition
affected by the spatial schemata from a psychological point of view. This is
currently a key issue in the architectural field.

From the above, this study investigates the patterns in the initial process of
architectural design, which is the process of visualizing one’s own mental im-
ages. We focused particularly on discovering patterns that indicate the differ-
ences between groups of architecturally trained and untrained individuals.
Several studies on architectural design patterns have been done. For example,
the Shape-Grammar for F. L. Wright, who was a famous architect, was defined.
It was a set of production rules, which could generate floor plans in Wright’s
architectural style (Koning et al., 1981). The Shape-Grammar, however, does
not reflect the actual design process. In this paper, actual design processes using
Architectural Space Montage Technique (ASMT) were analyzed.
The ASMT was developed by one of the authors to elucidate the fundamen-
tal patterns of spatial composition that exist in human beings. In an experiment
using ASMT, a subject composes architectural space by placing various minia-
tures such as walls, furniture, and so on, at a scale of 1:50 on a white board.
Figure 1 illustrates two examples of architectural models developed using this
method. In this study, we regard a spatial composition process using this method
as an architectural design process.
In single ASMT experiment, it is possible to have dozens to hundreds of
miniatures placed. Moreover, a miniature newly placed has plural relation-
ships to the previously placed miniatures. It is difficult to discover patterns by
only relying on human inspection in complexly structured data such as those in
the spatial composition process. Therefore, in this study, we applied Progol,
one of the ILP systems, to find latent patterns of the spatial composition pro-
cess in ASMT.
Recently, machine learning systems (see C4.5 (Quinlan, 1993)) that gener-
ate decision trees based on propositional logic have been used as data mining
engines in practical domains such as the medical field (Tsumoto and Tanaka,
1997) and the distribution industry (Numao and Shimizu, 1997). However, in
order to learn the chain of relationships between miniatures, ILP, based onexpressive first-order logic, is more appropriate for ASMT than systems oflearning based on propositional logic.
Figure 1. Examples of models constructed using ASMT by an undergraduate student (left) and
a kindergarten child (right)

We modeled the spatial composition process with the Entity-Relationship
(ER) model and designed a module to convert the spatial composition process
data recreated with a CAD system to Prolog clauses, which constitute input
data to Progol. The integration of the CAD system with Progol is applied to
discover patterns of the spatial composition process.
Brief overviews of ASMT and Progol are given in Sections 2 and 3, respec-
tively. In Section 4, the spatial composition process is modeled in first-order
logic. We show the procedure for analysis in Section 5. In Section 6, we show
an example of discovering characteristic patterns of architecturally trained sub-
jects and untrained subjects from their spatial composition process data. The
results of ASMT experiments and pattern discovery are shown. Our conclu-
sions and future work are stated in Section 7.
2. ASMT
ASMT was originally developed in the context of psychotherapy. Clinical psy-
chological analysis has been undertaken on the characteristic patterns of the spa-
tial compositions formed by schizophrenic patients, school children, mentally
handicapped children, and kindergarten children (Okazaki et al., 1992a, 1992b,
1997, 1999, respectively). In ASMT, architectural space is composed by simply
placing three-dimensional miniatures. Therefore, the subject is not limited by his
or her drawing ability. Various subjects can readily express a 3-D architectural
space. Moreover, we can observe the steps in the design process clearly.
The types of miniatures used in ASMT differ slightly depending on the
experimental groups. In this study, we prepared the following 44 kinds of min-
iatures: six kinds of walls made of styrene board of different lengths (1800
mm, 2700 mm, 3600 mm, and 5400 mm) and in various colors (blue, red,
yellow, green, white, gray, pink, ivory, cream, mint, and grain) with various
openings, mirror walls and glass walls in lengths of 3600 mm and 5400 mm
with the glass walls in various colors (blue, orange, and clear), columns, twelve
kinds of furniture (e.g. table, sofa, carpet, shelf), six different sanitary fixtures
(e.g. sink, toilet, bathtub), four different figures (i.e. man, woman, boy and
girl), two types of animals (i.e. dog and cat), six types of vegetation (e.g. lawn,
conifer, broadleaf, hedge), and five different architectural elements (e.g. bal-
cony, stairs). Figure 2 shows examples of these miniatures.
The experimental setting and procedure are stated as follows. A white board
(60 cm by 90 cm) was placed horizontally on a desk in the experimental room.
Two smaller white boards (45 cm by 30 cm) were placed on both sides of the
larger board, with miniature walls arranged on top of the boards. The other

miniatures were displayed on a shelf.
Each subject constructed the model of his ideal house on the large white
board. The experiment ends whenever the subject tells the experimenter that
he is finished with the model. The state of the model in the experiment was
constantly recorded by a video camera.
3. Progol
Progol is one of ILP systems by Mugletton (1995). Progol combines Inverse
Entailment with general-to-specific search through a refinement graph. It al-
lows arbitrary Prolog programs as the background knowledge and arbitrary
definite clauses as examples. Input data to Progol consist of a set of positive
example E+, a set of negative example E-, a set of background knowledge BK,
and mode declarations used by Progol to guide the process of constructing a
generalization from its example. From these data, a hypotheses in the form of
a Horn clause are constructed.
Hypothesis H is complete if ∀ e ∈ E+ : BK ∪ H e, where “ ” means logical
entailment. Hypothesis H is consistent if ∀ e ∈ E- : BK ∪ H e.
In this paper, one of the versions of Progol, P-Progol 2.7.5, was used. P-
Progol was implemented by Srinivasan and Rui in Prolog based on the Progol
algorithm (1999).
4. Modeling of the Spatial Composition Process
In order to describe the design process logically, we defined a unit of the spa-
tial composition process as a miniature placement with relations to the minia-
tures previously placed. The spatial composition process is a set of miniature
placements.
4.1. DATA MODEL
In this study, we modeled the spatial composition process with the ER model,
which is a well-known semantic data model. An ER model is built with three
elements: entity, relationship, and attribute. Shimazu and Hurukawa expressed
relational data of plane figures with the RER (Refined Entity-Relationship)
Figure 2. Miniatures used in ASMT experiment (From left: walls, furniture, sanitary fixtures,
figures, vegetations, and architectural elements)

model, which has two types of attributes called “primitive” and “derived” (2000).
On the other hand, we refined the ER model in order to express not only a
static relational data of figure elements but also the process of generating a
figure (See Figure 3). In our data model, the relationship has a direction. A
placed miniature corresponds to an entity. After this, we universally called the
miniature the “object.” A geometric relationship occurs between newly placed
objects and the existing objects. Each object has attributes such as an object
type and an ordinal number of placement occurrence. Each relationship has
attributes such as a relation type. In addition, IS-A hierarchies of the attributes
based on the inclusion relation among concepts are known in advance. Details
of attributes are described in the following section.
4.2. FIRST-ORDER REPRESENTATION
In this subsection, we show how to describe the above ER model in the form of
clauses on first-order logic. The first-order description of a spatial composi-
tion process has a finite domain D = (O ∪ R), where O is a set of all objects
placed and R is a set of all relationships occurred between objects.
4.2.1. Description of the object
Each object o has three attributes: ID number ObjID, type ObjType, and abso-
lute angle ObjAngle, where o ∈ O. The ID number is in four digits, with the
first digit representing the experimental case, and the remaining three repre-
senting the ordinal number of placement occurrence attached to the object. For
example, ObjID attached to the object placed in the third placement of experi-
mental case 1 is 1003. Two predicates, type/2 and angle/2, were defined for
each object o, and these represent the type of the object and the absolute angle
of the object, respectively. The number described after “ / ” means arity.
The type of object is represented as follows:
type(ObjID, ObjType),
where ObjType ∈ OT. OT is a set of 44 vocabularies that represent the minia-
1st2nd
3rd O R O
ORR
3rd
wall
2nd wall
1st
wall
bending
etc.
etc.
etc.etc.
bendingetc.
parallel etc.
O
R
relationship
object
attribute
Figure 3. Example of representation of spatial composition process using ER data model
wallfurnituresanitarymatpersonanimal
separationout_door
vegetation
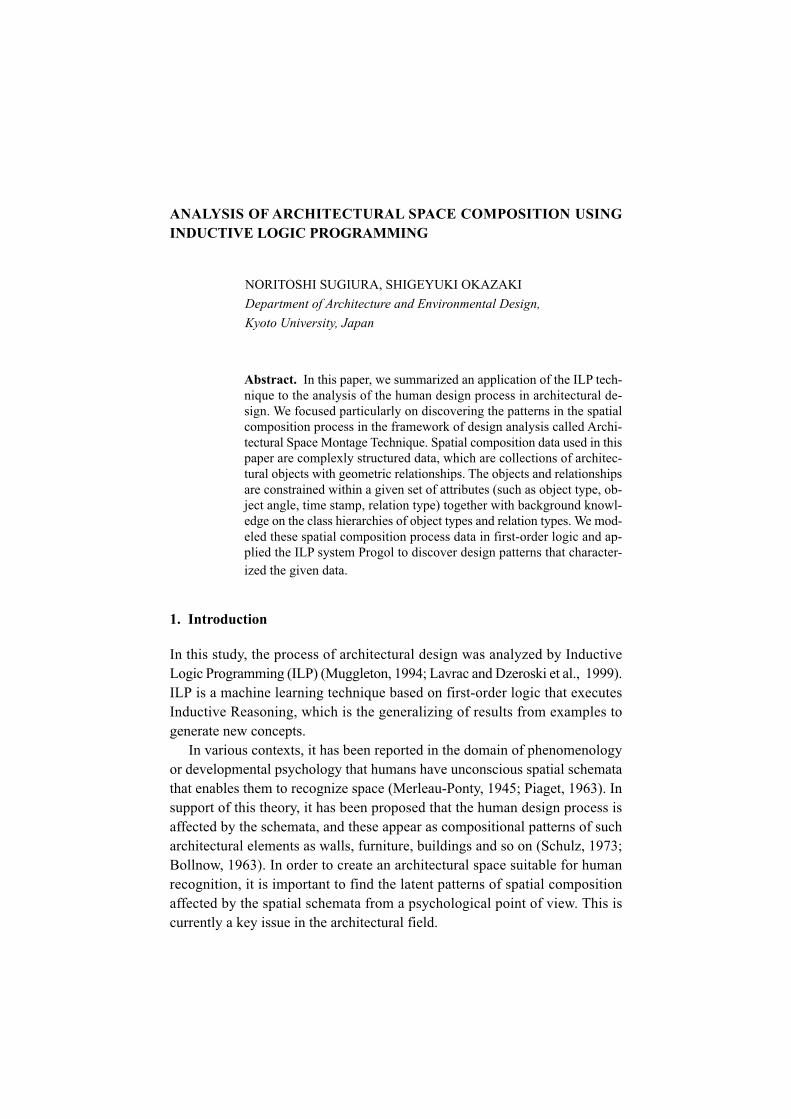
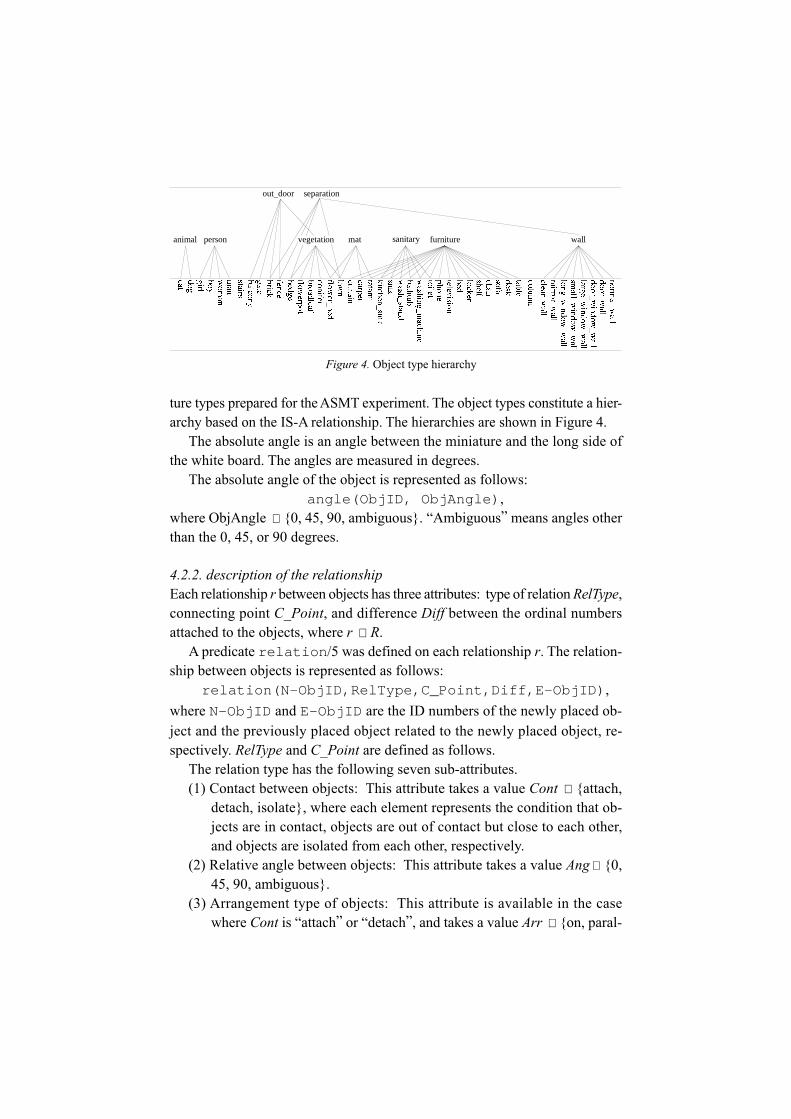
ture types prepared for the ASMT experiment. The object types constitute a hier-
archy based on the IS-A relationship. The hierarchies are shown in Figure 4.
The absolute angle is an angle between the miniature and the long side of
the white board. The angles are measured in degrees.
The absolute angle of the object is represented as follows:
angle(ObjID, ObjAngle),
where ObjAngle ∈ {0, 45, 90, ambiguous}. “Ambiguous” means angles other
than the 0, 45, or 90 degrees.
4.2.2. description of the relationship
Each relationship r between objects has three attributes: type of relation RelType,
connecting point C_Point, and difference Diff between the ordinal numbers
attached to the objects, where r ∈ R.
A predicate relation/5 was defined on each relationship r. The relation-
ship between objects is represented as follows:
relation(N-ObjID,RelType,C_Point,Diff,E-ObjID),
where N-ObjID and E-ObjID are the ID numbers of the newly placed ob-
ject and the previously placed object related to the newly placed object, re-
spectively. RelType and C_Point are defined as follows.
The relation type has the following seven sub-attributes.
(1) Contact between objects: This attribute takes a value Cont ∈ {attach,
detach, isolate}, where each element represents the condition that ob-
jects are in contact, objects are out of contact but close to each other,
and objects are isolated from each other, respectively.
(2) Relative angle between objects: This attribute takes a value Ang ∈ {0,
45, 90, ambiguous}.
(3) Arrangement type of objects: This attribute is available in the case
where Cont is “attach” or “detach”, and takes a value Arr ∈ {on, paral-
Figure 4. Object type hierarchy

lel, T_type, bending, I_type, close}, where “close” represents arrange-
ments other than the formers.
(4) Alignment of the edges of objects: This attribute is available where Arr
is “parallel”, and takes a value Align ∈ {reg, semi_reg, irreg}, where
each element represents the edges of both sides of the objects in align-
ment, the edges of one side of the objects in alignment, and the edges of
both sides of the objects out of alignment, respectively.
(5) Distance between objects: This attribute is available where Arr is “par-
allel”, and takes a value Dist ∈ {attach, near, right, far}, where “right”
means the distance between the objects and the length of the newly
placed object are the same.
(6) Direction of bending: This attribute is available where Arr is “bend-
ing”, and takes a value Direc ∈ {-r,-l}, where “-r” and “-l” represent
right-handed and left-handed, respectively.
(7) Combination of object shapes: The shapes of the objects are classified
into three classes: line, point, and mat. The relationship depends on a
combination of the classes. Table 1 shows the object types that corre-
spond to these classes. The combination is represented in a row of two
letters. Each letter corresponds to the first letter of the object shape. For
example, the combination of line and point is described as “lp.” This
attribute takes a value Comb ∈ {ll, lp, lm, pp, pm, mm}.
Theoretically, RelType ⊆ (Dcont ×Dang ×Darr ×Dalign ×Ddist ×Ddirec ×Dcomb),
where “D~” means the domain of the sub-attribute of RelType given above. In
this paper, 65 combinations of the sub-attributes that occurred frequently in
the ASMT experiment were selected. Each combination was assigned a vo-
cabulary which represent the relation type. The relation types constitute a IS-A
hierarchy based on the inclusion relation. The hierarchy is shown in Figure 5.
The attribute of connecting point indicates where the newly placed object is
connected to the previously existing object. This attribute takes a value C_Point
∈ {(bottom, top, left, right) ∪ (center, corner, edge, ambiguous)}, where “bot-
tom” and “top” denote the left and right ends of the previously placed object,
TABLE 1. Shape classification of object types
epahsfossalC epahsfossalcotgnidnopserroctcejbofoepyT
eniL
llaw_lamron llaw_wodniw_gnol ksed noisivelet dnats_hsaw kcirbllaw_rood llaw_rorrim afos enohp knis etag
llaw_wodniw_rood llaw_raelc kcar teliot knis_nehctik ynoclabllaw_wodniw_egral enihcam_gnihsaw rekcol niatruc egdeh sriatsllaw_wodniw_llams elbat deb buthtab ecnef
tnioP riahc,tac,god,lrig,yob,namow,nam,toprewolf,faeldaorb,refinoc,nmuloctam deb_rewolf,nwal,teprac,imatat

Figure 5. Hierarchy of relation types
i_detach
li_detach-r
reg
i_attach_ll
semi_attach
semi_right
semi_near
irreg_attach
irreg_right
irreg_near
reg_attach
reg_far
reg_right
reg_near
bend_attach-r
bend_detach-r
l_type-r
bending
i_type
t_type
tv_type
parallel
close
i_attach_lp
i_detach_lp
li_detach_lp-r
l_attach_ll-r
i_detach_ll
li_detach_ll-r
v_attach_ll-r
vi_detach_ll-r
t_attach_ll
v_detach-r
l_detach-r
ll_detach-r
irreg_far
semi_far
isolation
on
bending-r
bending-l
i_attach
v_type-r
semi_reg
irreg
line
mat
point
any form :
:
:
:
Following is same as t-type
Following is same as bending-r
Following is same as li_detach-r
Objects are isolated from each other
Objects are close to each other
vv_detach_ll-r
t_detach_ll
respectively. “Left” and “right” mean left and right side of the existing object,
viewing from bottom to top, respectively (see Figure 6(a)). The former four
elements are available where Arr, which is an attribute value of the arrange-
ment type, is “parallel,” ”T_type,” “bending,” or “I_type.” The latter four ele-
ments are available where Arr is “on” (see Figure 6(b)).

5. Procedure of Analysis
The analysis procedure consists of the following three steps (Figure 7).
• Step 1: The ASMT experiments are conducted.
• Step 2: The actual model is recreated with a CAD system where the order
of placements is consciously taken into consideration.
• Step 3: The CAD data are converted automatically into Prolog clauses
readable by Progol. These data constitute the input data to Progol.
Steps 2 and 3 are repeated in every experimental case.
• Step 4: The descriptions of the positive examples, the negative examples,
and the IS-A relationships of the object type and the relation type are added to
descriptions generated in step 3. Every placement is set as the example. These
data are inputted to Progol.
• Step 5: Progol acquires rules from the input data.
• Step 6: The rules found are interpreted by a person.
Steps 2, 3, and 4 are detailed in the following subsections.
5.1. RECREATION OF THE MODEL
Figure 7. Analysis procedure of the spatial composition process
Videofootage
SubjectRelationshiprecognizingmodule
CAD system
Progol Rules PersonInformation
aboutplacedobjects
Input file
Step 1[ ASMT experiment ]
Step 2[ Recreation with CAD]
Step 5[ Knowledge acquisition ]
Modedeclarations
Discriptionsof
spatialcomposition
process
Step 3[ Conversion]
Step 4[ Making Input file ]
Step 6[ Interpretation ]
•type•angle•position•order of placement•order in removing
Discriptionsof examples
Figure 6. Spheres indicating the connecting points: (a) in the case of “parallel,” “T_type,”
“bending,” “I_type,” and (b) in the case of “on”
whiteboard
previouslyexisting object
(b)
left
right
subject
topBottom
(a)
corner edge ambiguouscenter

First, the following information about the placed object was extracted from the
video footage of the ASMT experiment:
• type of object
• angle between the object and the long side of the white board
• position on the white board
• order of the object placement
• order in removing the object
Next, the actual model was recreated with one of the CAD systems
MiniCAD7 by placing and removing symbol objects according to the above
information. Symbol objects are three-dimensional models of the miniatures
prepared for the ASMT experiment. An example of a model recreated with the
CAD system is shown in Figure 8.
An ordinal number PlaceID indicating the occurrence of the placement is
assigned automatically to the object placed. Moving an object is regarded as
removing it and placing a new one. To remove an object in the CAD system,
the object is simply changed to be invisible by changing its color. An ordinal
number RemoveID is assigned to it, which indicates the occurrence of the re-
moval.
5.2. CONVERSION TO PROLOG CLAUSES
The Relationship-Recognizing (RR) module was designed to recognize the at-
tributes of the objects and relationships among them, such as ObjID, ObjType,
ObjAng, and RelType, and so on from the CAD data. These are automatically
converted by the module to the first-order representation. The RR module was
integrated with the CAD system described in subsection 5.1. The basic infor-
Figure 8. Example of model recreated with CAD system
Names of symbol objects are
indicated in the floating palet.
Actual model was recreated by
placing and removing symbol
objects in this window.
Frame of whiteboard

mation used by the RR module includes (1) vertex coordinates of the objects,
(2) PlaceID, (3) RemoveID, and (4) ID number indicating the object type.
Descriptions of the object types and the relationships in the form of a ground
unit clause are outputted. The object type and the relation type recognized
correspond to the leaves of the tree illustrated in Figures 4 and 5, respectively.
In the case of object disposition shown in Figure 9, the descriptions generated
Figure 9. (a) Disposition in experimental case 1, (b) Disposition in experimental case 2
(Numbers in the figure indicate the object ID numbers ObjID)
1001
1002
1003
10041006
1007
1005
20012002
2003
2004 2006
2007
2005
Figure 10. Examples of input and output data in the case that targets are characteristic patterns
in case 1: (a) Positive examples, (b) Negative examples, (c) First-order representation of each
placement, (d) IS-A relationships of object type and relation type, (e) Mode declarations, (f)
Determinations, (g) Induced rules

by this module are illustrated in Figure 10(c).
5.3. INPUT FILE TO PROGOL
In this study, the input file to Progol was designed as follows:
• Positive and Negative Examples. The target concept in this study is the
spatial composition process by a specific group P. All placements by subjects
belonging to group P were set as positive examples, and all placements by
subjects belonging to another group were set as negative examples.
Examples can be represented as placement(ObjID). Typical descrip-
tions of positive examples and negative examples are shown in Figure 10(a)
and (b), respectively. These descriptions are generated by the RR module to-
gether with the description of the attributes of the objects and the relationships.
• Background Knowledge. The background knowledge BK consists of two
kinds of data. One is the knowledge of attributes of the objects and the rela-
tionships, and the other is knowledge of the IS-A relationships between the
attribute values. The IS-A relationships between the object types (see Figure 4)
and the relation types (see Figure 5) are set as BK. IS-A relationships are rep-
resented in the form of Horn clause. Examples of descriptions of IS-A relation-
ships are shown in Figure 10(d).
• Mode Declarations and Determinations. In P-Progol, the user indicates
the language in which hypotheses are to be constructed by invoking mode
declaration and determination. For example, mode declaration can be repre-
sented as follows:
:- mode(recall,p(+a,-b,#c)). ,
where recall is the number of successful calls to the predicate and “+” indi-
cates that the argument is an input. For all calls to this predicate, the argument
will be bound to a value. The symbol “-” indicates that the argument is an
output. For all calls to this predicate, the argument will output a term. The
symbol “#” indicates that a constant should appear in this argument.
Determination takes the following form:
determination(TargetName/Arity, BackgroundName/Arity ).,
where the first argument is the name and arity of the target predicate, that is, the
predicate will appear in the head of hypothesized clauses. The second argument
is the name and arity of a predicate that appears in the body of such clauses.
Mode declaration and determination in this study are shown in Figure 10(e)
and (f), respectively. According to these instructions, the head of a hypothesis
is the predicate placement, and the body of a hypothesis is a combination of
attributes represented with the predicates type, angle, and relation. In

other words, the body of the hypothesis represents the transitive closure based
on the relationships in the ER model. Examples of rules are shown in Figure
10(g).
6. Analysis
ASMT experiments were conducted, and the experimental cases were ana-
lyzed by a system integrated from the CAD system, the Relationship-Recog-
nizing module, and Progol.
6.1. RESULTS OF ASMT EXPERIMENTS AND LEARNING METHOD
One ASMT trial was conducted on each of the four university students trained in
architectural design and the four untrained university students. Results are shown
in Figure 11. Progol induced rules from the following two kinds of input data.
(1) Input data in which the placements by the trained students were set as
positive and the placements by the untrained students were set as nega-
tive.
(2) Input data in which the placements by the untrained students were set as
positive and the placements by the trained students were set as negative.
Rules induced from input data (1) and (2) indicate the characteristic pat-
terns of the trained students and those of the untrained students, respectively.
6.2. RESULTS OF PROGOL LEARNING
Case 1
Figure 11. Results of ASMT experiments on architecturally trained students (upper) and un-
trained students (lower) (working time T (min.) of the experiment, the number of miniatures on
the white board at the end of the experiment N, the number of placements P)
T: 46, N: 75, P: 92Case 2
T: 28, N: 76, P: 96Case3
T: 30, N: 79, P: 103Case 4
T: 25, N: 75, P: 133
Case 5T: 60, N: 80, P: 149
Case 6T: 29, N: 90, P: 110
Case 7T: 25, N: 52, P: 70
Case 8T: 47, N: 57, P: 71

As a result, 147 and 149 rules were extracted from data (1) and (2), respec-
tively. In this paper, the rules that cover the placements by more than half of
the members of each group were regarded as characteristics common to the
group. The numbers of the common rules were 28 and 32, respectively. Rules
of the trained students and the untrained students are shown in Tables 2 and 3,
respectively. The coverage shown in the tables is defined as the ratio of posi-
tive examples covered by the rules to the total number of positive examples.
The rule with the largest coverage is regarded as most general. The variables
shown in the “diagram” column in these Tables denote the ID numbers of ob-
jects that were generalized. Reverse alphabetical order indicates the order of
placement is reversed, where “A” would represent the last placement.
6.3. DISCUSSION
6.3.1. Validation of rules
We measured predictive accuracy for unseen cases by using four-fold cross-
validations. The eight experimental cases shown in Figure 11 were split into
four folds. Each fold contains two cases by the trained student and the un-
trained student. The examples containing three folds were set as training ex-
amples. Rules were induced from the training examples by progol. The ex-
amples contained in a remaining fold were classified into negative or positive
by using the induced rules. The above procedures were repeated four times
while changing the combination of the folds. Predictive accuracy is calculated
by PA = (P++P–)/E, where P+ and P– are the number of correctly predicted
positive examples and negative examples, respectively, and E is the total num-
ber of the training examples. In the case where the placements by the trained
students were set as positive examples, the average of PA was 0.511. In the case
where the placements by the untrained students were set as positive examples,
the average of PA was 0.572.
6.3.2. Interpretation
• Patterns found for the architecturally trained students. Rules of the
trained students were interpreted as follows.
(1) Rules T1, T2, T3, T4, T9, T10, T11, T16, T17, T18, T20, T23, T27, and T28
refer to only relationships, indicating that the objects are separated from
each other, e.g. “irreg,” “close,” “li_detach-r.” It can be inferred from these
rules that one of the characteristics of the trained students is placement
with each object separated from the others.

(2) Rules T1 and T23 state that three objects were frequently placed with
“semi_irreg” or “irreg” relationships, which indicate that objects are paral-
lel to each other. It can be inferred from these rules that the trained students
constructed stratiform compositions.
(3) Rules T2, T3, T5, T6, T14, T18, T24, T25, T26, and T27 refer to an object
angle of “90.” It can be inferred from these rules that the trained students
placed objects in the vertical direction.
(4) Rules T9, T13, T16, T18, and T20 state that objects with the “i_detach”
relationship were frequently placed. It can be inferred from these rules that
one of the characteristics of the trained students is the placement in a straight
line with the object’s ends detached.
(5) Rules T6, T7, T13, T14, T15, and T25 state that objects were frequently
placed in “isolation.” It can be inferred from these rules that trained stu-
dents constructed elements in isolation, and integrated them at the end.
• Patterns found for the untrained students. Rules of the untrained stu-
dents were interpreted as follows.
(1) Rules U2, U3, U4, U6, U8, U13, U16, U19, U22, U23, U24, U26, U27,
U28, U29, U31, and U32 only refer to relationships indicating that the
objects are in contact with the others at their ends, e.g. “bend_attach-l,”
and “i_attach.” It can be inferred from these rules that one of the charac-
teristics of the untrained students is placement with each object in contact
with the others.
TABLE 2-1. Rules found for trained students (ID of rule RID, Coverage of rule Cov(%), Number of
members whose placements are covered by the rule CM, Description of rule, and Diagram of rule)
G
EC
A
A90
C
C90separation
A=C+2
90
AC
E 0
wall
Aperson90
A
90separation
isolation
Amat
DIR voC )%( MC elurnommocfonoitpircseD margaiD
1T 87.3 3,)C,B,thgir,gerri,A(noitaler-:)A(tnemecalp
.)G,F,pot,hcatta_i,E(noitaler,)E,D,thgir,ger_imes,C(noitaler
2T 45.3 4.)C,B,enon,esolc,A(noitaler,)09,A(elgna-:)A(tnemecalp
3T 21.2 4,)C,B,tfel,gerri,A(noitaler,)09,A(elgna-:)A(tnemecalp
.)noitarapes,C(epyt,)C,2,tfel,gerri,A(noitaler,)09,C(elgna
4T 98.1 3,)C,B,mottob,r-hcated_il,A(noitaler-:)A(tnemecalp
.)0,E(elgna,)E,D,tfel,gerri,C(noitaler,)llaw,C(epyt
5T 98.1 4.)09,A(elgna,)nosrep,A(epyt-:)A(tnemecalp
6T 24.1 4,)09,A(elgna,)noitarapes,A(epyt-:)A(tnemecalp
.)C,B,enon,noitalosi,A(noitaler
7T 81.1 3.)C,B,enon,noitalosi,A(noitaler,)tam,A(epyt-:)A(tnemecalp

8T 81.1 3,)C,B,mottob,hcatta_i,A(noitaler-:)A(tnemecalp.)llaw,D(epyt,)D,1,pot,r-hcatta_dneb,C(noitaler
T9 81.1 4,)C,B,mottob,hcated_i,A(noitaler-:)A(tnemecalp
.)E,D,pot,r-hcated_il,C(noitaler
T10 81.1 3,)yzzuf,A(elgna-:)A(tnemecalp
.)noitarapes,C(epyt,)C,B,mottob,r-hcated_il,A(noitaler
T11 81.1 3.)B,7,tfel,gerri,A(noitaler,)0,A(elgna-:)A(tnemecalp
T12 81.1 4.)C,B,retnec,no,A(noitaler-:)A(tnemecalp
T13 49.0 3,)C,B,pot,hcated_i,A(noitaler-:)A(tnemecalp
.)E,D,enon,noitalosi,C(noitaler
T14 49.0 3,)09,A(elgna,)llaw,A(epyt-:)A(tnemecalp
.)C,B,enon,noitalosi,A(noitaler
T15 49.0 3.)C,B,enon,noitalosi,A(noitaler,)nosrep,A(epyt-:)A(tnemecalp
T 61 49.0 3.)B,8,pot,hcated_i,A(noitaler-:)A(tnemecalp
T 71 49.0 3.)B,21,tfel,ger,A(noitaler-:)A(tnemecalp
T 81 49.0 3,)09,A(elgna,)erutinruf,A(epyt-:)A(tnemecalp
.)C,B,mottob,hcated_i,A(noitaler
T 91 49.0 3.)B,4,thgir,hcatta_t,A(noitaler-:)A(tnemecalp
T 02 49.0 3,)nosrep,A(epyt-:)A(tnemecalp
.)C,B,mottob,hcated_i,A(noitaler
T 12 49.0 3,)C,B,pot,l-hcated_il,A(noitaler-:)A(tnemecalp
.)E,D,tfel,hcatta_t,C(noitaler
T 22 49.0 3,)C,B,pot,hcatta_i,A(noitaler,)llaw,A(epyt-:)A(tnemecalp
.)D,7,tfel,gerri,C(noitaler
T 32 49.0 3,)C,7,thgir,gerri,A(noitaler-:)A(tnemecalp
.)E,D,tfel,gerri,C(noitaler
T 42 49.0 3,)C,B,pot,hcatta_t,A(noitaler,)09,A(elgna-:)A(tnemecalp
.)llaw,C(epyt
T 52 17.0 3,)C,B,mottob,hcatta_i,A(noitaler,)09,A(elgna-:)A(tnemecalp
.)E,D,enon,noitalosi,C(noitaler
T 62 17.0 3,)C,B,pot,hcatta_i,A(noitaler,)0,A(elgna-:)A(tnemecalp
.)09,D(elgna,)D,B,pot,r-hcatta_dneb,C(noitaler,)0,C(elgna
T 72 17.0 3,)09,A(elgna,)erutinruf,A(epyt-:)A(tnemecalp
.)erutinruf,C(epyt,)C,B,mottob,l-hcated_il,A(noitaler
T 82 17.0 3,)C,B,enon,esolc,A(noitaler,)nosrep,A(epyt-:)A(tnemecalp
.)E,D,mottob,r-hcated_il,C(noitaler
TABLE 2-2. Rules found for trained students (continuation of Table 2-1)
E C
A
AC
separationambiguous
B
A=B+70
C
A
AC
isolation
Awall90isolation
Apersonisolation
A=B+8B
B
A=B+12
C
A90furniture
B
A=B+4
A C
person
A
CE
AC=D+7
Dwall
A=C+7
C
E
CA
wall90
C
A
isolation
90
AC
D90
0 0
90
C
A furniture
Aperson
EC
DC=D+1
A
wall

(2) Rules U2, U3, U13, and U27 state that objects with the “i_attach” relation-
ship were placed first, and another object with a relationship such as
“bend_attach-l” or “bend_attach-r” was placed after that with its end in
contact at the joint of the former objects. It can be inferred from these rules
that compositions by the untrained students are more spread out in branches.
(3) Rules U8, U12, U17, U29, and U31 state that three objects with “bending”
relationships in the same direction were placed. It can be inferred from
these rules that the untrained students constructed U-shaped enclosures.
(4) Rule U1 states that object C is related to object E ,of an angle “0,” with the
“i_attach” relationship, and object A is related to object C with the “irreg”
relationship. This condition means that all of the objects have “0” angle. It
can be inferred from these rules that the untrained students constructed in a
TABLE 3-1. Rules found for untrained students (ID of rule RID, Coverage of rule Cov(%), Number
of members whose placements are covered by the rule CM, Description of rule, and Diagram of rule)
G A
A
CE
0wall
EC
A
EC
AC
A
C E
wall
EC
A
EC
A
furniture
mat
DB
A=B+1
G
E
C
A
wall
G
E
C Aseparation
A
balcony
EC
E C
A
wall
wall
separation
DIR voC )%( MC elurnommocfonoitpircseD margaiD
1U 27.3 3,)C,B,tfel,gerri,A(noitaler-:)A(tnemecalp
.)0,E(elgna,)llaw,E(epyt,)E,1,pot,hcatta_i,C(noitaler
2U 89.2 3,)C,B,pot,l-hcatta_dneb,A(noitaler-:)A(tnemecalp
.)E,D,mottob,hcatta_i,C(noitaler
3U 89.2 4,r-hcatta_dneb,A(noitaler,)llaw,A(epyt-:)A(tnemecalp.)E,D,pot,hcatta_i,C(noitaler,)llaw,C(epyt,)C,B,mottob
4U 37.2 3,)llaw,C(epyt,)C,B,pot,hcatta_i,A(noitaler-:)A(tnemecalp
.)llaw,E(epyt,)E,D,mottob,hcatta_i,C(noitaler
5U 37.2 4,)C,B,pot,hcatta_i,A(noitaler-:)A(tnemecalp
.)llaw,E(epyt,)E,D,mottob,r-hcated_il,C(noitaler
6U 37.2 3,)C,B,mottob,hcatta_i,A(noitaler-:)A(tnemecalp
.)E,D,mottob,l-hcatta_dneb,C(noitaler
7U 84.2 3,)tam,C(epyt,)C,B,enon,esolc,A(noitaler-:)A(tnemecalp
.)erutinruf,E(epyt,)E,D,enon,esolc,C(noitaler
8U 32.2 4,)B,1,mottob,l-hcatta_dneb,A(noitaler-:)A(tnemecalp
.)D,C,mottob,l-hcatta_dneb,B(noitaler
9U 32.2 3
,)C,B,mottob,l-hcatta_dneb,A(noitaler-:)A(tnemecalp,)llaw,E(epyt,)E,D,tfel,gerri,C(noitaler.)G,F,mottob,r-hcatta_dneb,E(noitaler
01U 99.1 3
,hcatta_i,A(noitaler,)noitarapes,A(epyt-:)A(tnemecalp,)E,D,tfel,gerri,C(noitaler,)noitarapes,C(epyt,)C,B,pot
.)G,F,mottob,r-hcatta_dneb,E(noitaler
11U 47.1 3.)ynoclab,A(epyt-:)A(tnemecalp
21U 47.1 3,C(noitaler,)C,B,thgir,gerri,A(noitaler-:)A(tnemecalp
.)G,F,mottob,r-hcatta_dneb,E(noitaler,)E,D,mottob,r-hcated_il

31U 47.1 3,)C,B,mottob,l-hcatta_dneb,A(noitaler-:)A(tnemecalp.)E,D,pot,hcatta_i,C(noitaler,)0,C(elgna,)llaw,C(epyt
41U 47.1 3
,l-hcatta_dneb,A(noitaler,)noitarapes,A(epyt-:)A(tnemecalp,)E,D,tfel,gerri,C(noitaler,)C,B,mottob
.)G,F,pot,l-hcatta_dneb,E(noitaler
51U 47.1 4,)C,B,mottob,l-hcated_il,A(noitaler-:)A(tnemecalp
.)E,D,mottob,r-hcatta_dneb,C(noitaler
61U 47.1 4
,)C,B,pot,r-hcatta_dneb,A(noitaler-:)A(tnemecalp,)E,D,mottob,l-hcatta_dneb,C(noitaler,)llaw,C(epyt
.)G,F,mottob,hcatta_i,E(noitaler
71U 94.1 3,r-hcated_il,A(noitaler,)erutinruf,A(epyt-:)A(tnemecalp
.)E,D,mottob,r-hcatta_dneb,C(noitaler,)C,B,pot
81U 94.1 4,)erutinruf,A(epyt-:)A(tnemecalp
.)E,D,pot,hcatta_i,C(noitaler,)C,B,pot,r-hcated_il,A(noitaler
91U 42.1 4.)B,4,mottob,r-hcatta_dneb,A(noitaler-:)A(tnemecalp
02U 42.1 3,)C,B,mottob,r-hcatta_dneb,A(noitaler-:)A(tnemecalp
.)E,D,pot,l-hcated_il,C(noitaler
12U 42.1 3,mottob,hcatta_i,A(noitaler,)noitarapes,A(epyt-:)A(tnemecalp
.)E,D,thgir,raluger_imes,C(noitaler,)rood_tuo,C(epyt,)C,B
22U 42.1 3,B(epyt,)B,1,mottob,r-hcatta_dneb,A(noitaler-:)A(tnemecalp
.)rood_tuo,D(epyt,)D,C,mottob,hcatta_i,B(noitaler,)noitarapes
32U 42.1 4,B(noitaler,)B,1,pot,hcatta_i,A(noitaler-:)A(tnemecalp
.)F,E,pot,l-hcatta_dneb,D(noitaler,)D,C,pot,hcatta_i
42U 42.1 3,)C,B,mottob,l-hcatta_dneb,A(noitaler-:)A(tnemecalp
.)E,D,mottob,r-hcatta_dneb,C(noitaler,)0,C(elgna
52U 42.1 3,)C,B,enon,esolc,A(noitaler,)erutinruf,A(epyt-:)A(tnemecalp
.)E,D,enon,noitalosi,C(noitaler,)C,1,enon,esolc,A(noitaler
62U 99.0 3,)C,B,mottob,hcatta_i,A(noitaler-:)A(tnemecalp
.)D,2,pot,l-hcatta_dneb,C(noitaler
72U 99.0 3,)C,B,mottob,r-hcatta_dneb,A(noitaler-:)A(tnemecalp
.)D,1,pot,hcatta_i,C(noitaler
82U 99.0 3.)C,B,pot,hcatta_i,A(noitaler,)yratinas,A(epyt-:)A(tnemecalp
92U 99.0 3,)C,B,mottob,r-hcatta_dneb,A(noitaler-:)A(tnemecalp
.)E,D,pot,r-hcatta_dneb,C(noitaler,)09,C(elgna,)llaw,C(epyt
03U 99.0 3
,)C,B,mottob,l-hcated_il,A(noitaler-:)A(tnemecalp,)E,D,pot,r-hcatta_dneb,C(noitaler,)llaw,C(epyt
.)G,F,mottob,l-hcatta_dneb,E(noitaler
13U 47.0 3,)C,B,pot,r-hcatta_dneb,A(noitaler-:)A(tnemecalp
.)D,4,mottob,r-hcatta_dneb,C(noitaler
23U 47.0 3,mottob,hcatta_i,A(noitaler-:)A(tnemecalp 3,B (epyt,) B .)llaw,
TABLE 3-2. Rules found for untrained students (continuation of Table 3-1)
GE
CC
Awall
E
C
A
furniture
E C
A
furniture
A=B+4
B
E
CA
A C
Eseparation out_door
B Dseparation out_door
A=B+1
F
D B
A=B+1
EC
A 0
A=C+1
Cfurniture
isolation
A
C=D+2
D
A
C=D+1D
C A
sanitary
AC
E
wall90
G
E
ECA
wall
DC=D+4
A
BA=B+3
E C
A
wall0
G
E
C
Aseparation
E
CA

7. Conclusions
ILP was applied to the analysis of spatial composition processes using ASMT.
Complexly structured data of spatial composition processes that consist of many
objects, relationships between them, and their attributes were modeled in first-
order logic. A RR (Relationship-Recognizing) module was designed to con-
vert the spatial composition process into first-order representations automati-
cally, after the actual model was recreated using a CAD system.
One ASMT experiment was conducted on each of the four architecturally
trained students and on the four untrained students. These experimental cases
were analyzed by a system integrated from Progol, which is one of the ILP sys-
tems, and the RR module. As a result, 28 rules for the trained students and 32
rules for the untrained students were found. These rules stated characteristic
patterns of miniature arrangement of trained students (i.e. (1) placing objects
with each object separated from the others, (2) stratiform composition, (3) plac-
ing objects in the vertical direction, (4) placing objects in a straight line with their
ends detached, and (5) constructing elements in isolation) as well as the charac-
teristic patterns of miniature arrangement of untrained students (i.e. (1) placing
each object in contact with the others, (2) spread out elements in branches, (3) U-
shaped enclosure, and (4) parallel composition in the horizontal direction).
In the future, we will need to analyze a greater number of experimental cases
in order to find more universal patterns. We also need to refine the RR module in
order to recognize more geometric relationships among objects.
References
horizontally parallel manner.
6.3.3. Comparison between the two groups
By comparing the rules of the trained and the untrained students, the contrasts
between the two groups shown in Table 4 were surmised.
TABLE 4. Contrasts between architecturally trained individuals and untrained individuals

Bollnow, O. F.: 1963, MENSCH UND RAUM, W, Kohlnammer GmbH, stuttgart.
Merleau-Ponty, M.: 1945, Phénoménologie de la Perception, Gallimard.
Koning H., and Eizenberg J.: 1981, The Language of the Prairie: Frank Lloyd Wright’s Prairie
Houses, Environment and Planning B 8, pp. 295-323
Muggleton, S. and De Raedt, L.: 1994, Inductive logic programming: Theory and methods,
Journal of Logic Programming, 19-20, pp. 629-678.
Muggleton, S.: 1995, Inverse Entailment and PROGOL, New Generation Computing, 13, pp.
245-286.
Lavrac, N., Dzeroski, S., and Numao, M.: 1999, Inductive Logic Programming for Relational
Knowledge Discovery, New Generation Computing, 17, pp. 2-23.
Numao, M., and Shimizu, S.: 1997, Data Mining for Distribution Industry, Journal of Japanese
Society for Artificial Intelligence, Vol.12, No.4, pp.528-535 (In Japanese).
Okazaki, S., and Ito, T.: 1992a, Architectural Space Montage Technique and Schizophrenic Pa-
tient, Journal of Archit. Plann. Environ. Engng. AIJ, No.436, pp. 127-137 (In Japanese).
Okazaki, S.: 1992b, Architectural Space Montage Technique and School Children, Journal of
Archit. Plann. Environ. Engng. AIJ, No.438, pp. 109-118 (In Japanese).
Okazaki, S., Ooi, F., et al.: 1997, Architectural Space Montage Technique and Mentally handicapped
children, Journal of Archit. Plann. Environ. Engng. AIJ, No.496, pp. 237-245 (In Japanese).
Okazaki, S., Yanagisawa, K., et al.: 1999, Architectural Space Montage Technique and kindergarten
children, Journal of Archit. Plann. Environ. Engng. AIJ, No.518, pp. 313-320 (In Japanese).
Quinlan, J. R.: 1993, C4.5: Programs for Machine Learning, Morgan Kaufmann, San Mateo, CA.
Piaget, J.,and Inhelder,B.: 1963, Image. Fraisse, P., and Piaget, J. (Eds.) Traité de psychologie
expérimentale: 7 L’intelligence. Paris: Presses Universitaires de France.
Schulz, C. N.: 1971, EXISTENCE, SPACE AND ARCHITECTURE, Studio Vista Limired, Great
Britain.
Shimazu, K., and Hurukawa K.: 2000, KDD System, DB-Amp -Design, Implementation and Its
Application to an Expert System-, Journal of Japanese Society for Artificial Intelligence,
Vol.15, No.4, pp. 629-637 (In Japanese).
Srinivasan, A., and Camacho, R.: 1999, P-Progol User Manual http://oldwww.comlab.ox.ac.uk/
oucl/groups/machlearn/PProgol/ppman.html. Hosted at the Oxford University, Machine
Learning at the Computing Laboratory.
Sugiura, N., and Okazaki, S.: 2001, Analysis of Spatial Composition process by Inductive Logic
Programming - Extracting Peculiar Rules in Process of Spatial Composition on Space Montage
Technique -, Journal of Archit. Plann. Environ. Engng. AIJ, No.546, pp. 141-148 (In Japanese).
Tsumoto, S., and Hiroshi T.: 1997, Medical Application of Data Mining, Journal of Japanese
Society for Artificial Intelligence, Vol.12, No.4, pp.536-543 (In Japanese).