analysis of cyanide in mining waters
TRANSCRIPT

LAPPEENRANTA UNIVERSITY OF TECHNOLOGY
School of Engineering Science
Degree Program of Chemical Engineering
Asra Mousavi
ANALYSIS OF CYANIDE IN MINING WATERS
Examiners: Professor Antti Häkkinen
Doctoral student Paula Vehmaanperä
ACKNOWLEDGEMENTS
This thesis was carried out at the Lappeenranta University of Technology in the Laboratory
of Separation Technology as a part of EWT CYNCOR-project. The work started in the
autumn 2017 and completed in autumn 2018.
First, I would like to thank Professor Antti Häkkinen for his kind support and valuable advice
through this research project. Also, I like to thank the Department of Separation and
Purification Technology for supporting me throughout my study.
I would also like to express my sincere gratitude to Paula Vehmaanperä for her
encouragement and guide to carry out this research project. Her valuable comments and
guidance were a huge source of help through this work of science.
I am grateful to my mother who paved the path for me and supported me during this journey
at the Lappeenranta University of Technology. I would also like to extend my gratitude to
my dear friends Saeid Heshmatisafa and Masoume Amini Tehrani for their support during
this thesis.
Lappeenranta, 14 December 2018
Asra Mousavi
This thesis has been supported by EIT Raw Materials
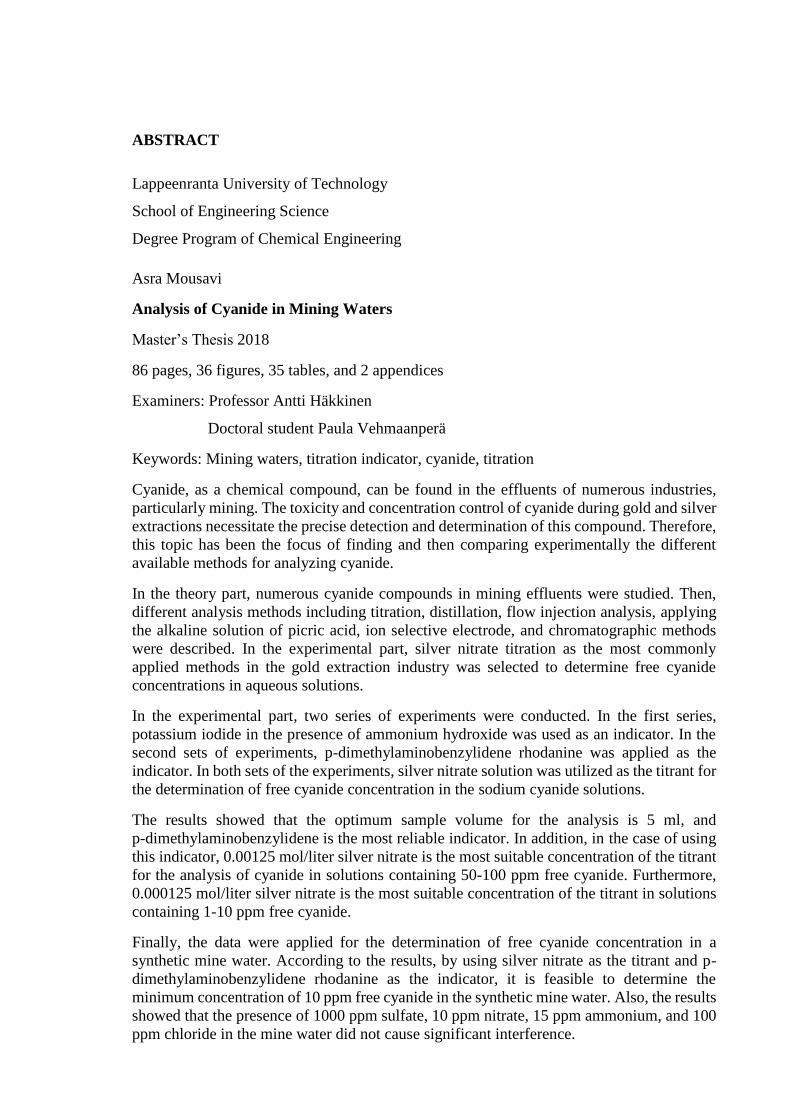
ABSTRACT
Lappeenranta University of Technology
School of Engineering Science
Degree Program of Chemical Engineering
Asra Mousavi
Analysis of Cyanide in Mining Waters
Master’s Thesis 2018
86 pages, 36 figures, 35 tables, and 2 appendices
Examiners: Professor Antti Häkkinen
Doctoral student Paula Vehmaanperä
Keywords: Mining waters, titration indicator, cyanide, titration
Cyanide, as a chemical compound, can be found in the effluents of numerous industries,
particularly mining. The toxicity and concentration control of cyanide during gold and silver
extractions necessitate the precise detection and determination of this compound. Therefore,
this topic has been the focus of finding and then comparing experimentally the different
available methods for analyzing cyanide.
In the theory part, numerous cyanide compounds in mining effluents were studied. Then,
different analysis methods including titration, distillation, flow injection analysis, applying
the alkaline solution of picric acid, ion selective electrode, and chromatographic methods
were described. In the experimental part, silver nitrate titration as the most commonly
applied methods in the gold extraction industry was selected to determine free cyanide
concentrations in aqueous solutions.
In the experimental part, two series of experiments were conducted. In the first series,
potassium iodide in the presence of ammonium hydroxide was used as an indicator. In the
second sets of experiments, p-dimethylaminobenzylidene rhodanine was applied as the
indicator. In both sets of the experiments, silver nitrate solution was utilized as the titrant for
the determination of free cyanide concentration in the sodium cyanide solutions.
The results showed that the optimum sample volume for the analysis is 5 ml, and
p-dimethylaminobenzylidene is the most reliable indicator. In addition, in the case of using
this indicator, 0.00125 mol/liter silver nitrate is the most suitable concentration of the titrant
for the analysis of cyanide in solutions containing 50-100 ppm free cyanide. Furthermore,
0.000125 mol/liter silver nitrate is the most suitable concentration of the titrant in solutions
containing 1-10 ppm free cyanide.
Finally, the data were applied for the determination of free cyanide concentration in a
synthetic mine water. According to the results, by using silver nitrate as the titrant and p-
dimethylaminobenzylidene rhodanine as the indicator, it is feasible to determine the
minimum concentration of 10 ppm free cyanide in the synthetic mine water. Also, the results
showed that the presence of 1000 ppm sulfate, 10 ppm nitrate, 15 ppm ammonium, and 100
ppm chloride in the mine water did not cause significant interference.

LIST OF ABBREVIATIONS
[Ag (CN) 2]- Argentocyanide ion
[Ag (NH3)2] + Diamminesilver (I) ions
Ag [Ag (CN) 2] Silver argentocyanide
Ag+ Silver ion
Ag2S Silver sulfide
AgCN Silver cyanide
AgI Silver iodide
AgNO3 Silver nitrate
ATP Adenosine triphosphate
Au Gold
C12H12N2OS2 P-dimethylaminobenzylidene rhodanine
C2N2 Cyanogen
C5FeN6Na2O Sodium nitroprusside
C6FeK3N6 Potassium ferricyanide
Ca (CN) 2 Calcium cyanide
Cd (CN) 2 Cadmium cyanide
CH3COCH3 Acetone
Cl- Chloride
Cl2 Chlorine
CN- Cyanide ion
CNCl Cyanogen chloride
CNO- Cyanate
CO3-2 Carbonate
Cu (CN)2- Dicyanide
Cu (CN)3-2 Tricyanide
Cu (CN)4-3 Tetracyanide
Cu2S Chalcocite
CuCN Copper (I) cyanide
CuFeS2 Chalcopyrite
DC Direct current
DTPA Diethylenetriamine penta-acetic acid

EC Electrocoagulation
EDTA Ethylenediaminetetraacetic acid
FeS Pyrrhotite
FIA Flow injection analysis
GC Gas chromatography
H2O2 Hydrogen peroxide
H2SO4 Sulfuric acid
H3PO4 Phosphoric acid
HCl Hydrochloric acid
HCN Hydrogen cyanide
Hg (CN)2 Mercury (II) cyanide
HPLC High-Performance Liquid Chromatography
HSO3- Bisulfite
I- Iodide
IC Ion chromatography
ISE Ion selective electrode
KCN Potassium cyanide
KI Potassium iodide
MgCl2 Magnesium chloride
MP-P Monopolar electrodes in parallel connection
MP-S
BP-S
Monopolar electrodes in series connection
Bipolar electrodes in parallel connection
Na2SO4 Sodium sulfate
Na4Fe (CN)6.10 Sodium ferrocyanide
NaAu (CN)2 Sodium gold cyanide
NaCl Sodium chloride
NaCN Sodium cyanide
NaNO3 Sodium nitrate
NaOH Sodium hydroxide
NH2Cl Chloramine
NH3 Ammonia
NH4+ Ammonium
NH4Cl Ammonium chloride

NH4OH Ammonium hydroxide
Ni (CN)2 Nickel (II) cyanide
NO2- Nitrite
NO3- Nitrate
OH- Hydroxide
PbCO3 Lead carbonate
PbS Lead (II) sulfide
S-2 Sulfide
S2O3-2 Thiosulfate
SAD Strong acid dissociable
SCN- Thiocyanate
SO3-2 Sulfite
TDS Total dissolved solids
WAD Weak acid dissociable
Zn (CN)2 Zinc cyanide

LIST OF SYMBOLS
I electric current , A
M molarity , 𝑚𝑜𝑙
𝑙𝑖𝑡𝑒𝑟
M mass , kg
p pressure , Pa
t time , s
T temperature , k
V electric potential , V
V volume , 𝑚3

TABLE OF CONTENTS
1 INTRODUCTION ......................................................................................................... 3
1.1 Objectives, research problems, and research questions ......................................... 4
1.2 Framework ............................................................................................................. 5
LITERATURE REVIEW ...................................................................................................... 6
2 CYANIDE ..................................................................................................................... 6
2.1 The occurrences of cyanide ................................................................................... 8
2.2 Applications of cyanide ....................................................................................... 10
2.3 The chemistry of cyanide solutions ..................................................................... 13
2.3.1 Free cyanide ..................................................................................................... 14
2.3.2 Simple cyanide compounds ............................................................................. 15
2.3.3 Metal-cyanide complexes ................................................................................ 16
2.3.4 Cyanide related compounds ............................................................................. 16
2.4 Toxicity of cyanide .............................................................................................. 18
3 THE CYANIDE ANALYSIS METHODS .................................................................. 21
3.1 Titration ............................................................................................................... 21
3.1.1 Titration method including visual end-point determination ............................ 22
3.1.2 Titration method including instrumental end-point determination .................. 24
3.2 Distillation ........................................................................................................... 26
3.3 Flow Injection Analysis (FIA) ............................................................................. 28
3.4 Applying the alkaline solution of picric acid ....................................................... 31
3.5 Ion selective electrode (ISE) ................................................................................ 32
3.6 Amperometric method ......................................................................................... 33
3.7 Chromatographic methods ................................................................................... 34
4 REMOVAL OF CYANIDE FROM WATER AND WASTEWATER ...................... 35
4.1 Natural degradation .............................................................................................. 35
4.2 Chemical oxidation methods ............................................................................... 36

4.3 Electrocoagulation (EC) Method ......................................................................... 37
EXPERIMENTAL PART .................................................................................................... 44
5 THE OBJECTIVE ....................................................................................................... 44
6 MATERIALS AND METHODS ................................................................................. 45
6.1 Chemicals ............................................................................................................. 45
6.2 Equipment ............................................................................................................ 46
6.3 Preparation of the samples ................................................................................... 46
6.4 First series of the experiments ............................................................................. 46
6.4.1 Preparation of the titrant .................................................................................. 46
6.4.2 Preparation of the indicators ............................................................................ 47
6.4.3 The procedure of the experiment ..................................................................... 47
6.4.4 Formulas .......................................................................................................... 48
6.5 Second series of the experiments ......................................................................... 50
6.5.1 Preparation of the titrant .................................................................................. 50
6.5.2 Preparation of the indicator .............................................................................. 50
6.5.3 The procedure of the experiment ..................................................................... 50
6.5.4 Formulas .......................................................................................................... 51
6.6 Third series of the experiments ............................................................................ 52
7 RESULTS AND DISCUSSIONS ................................................................................ 52
7.1 Results and discussion of the first series of experiments ..................................... 54
7.1.1 The optimum concentrations of titrant ............................................................. 60
7.1.2 The reliability of the indicator ......................................................................... 62
7.2 Results and discussion of the second series of experiments ................................ 62
7.2.1 The optimum concentrations of titrant ............................................................. 69
7.2.2 The reliability of the indicator ......................................................................... 69
7.3 Results and discussion of the third series of experiments ................................... 70
8 CONCLUSIONS ......................................................................................................... 76

APPENDICES ..................................................................................................................... 77
REFERENCES .................................................................................................................... 78

3
1 INTRODUCTION
Cyanide is a carbon/nitrogen compound that is present in different forms, such as free
cyanide, simple cyanide compounds, metal-cyanide complexes, and cyanide-related
compounds (Sentruk, 2013). This compound exists in gas, solid, and liquid form from
numerous natural and anthropogenic sources; the natural source of cyanides is more than
2000 plant species (comprise cyanogenic glycoside), fungi, and microorganism such as
bacteria (Simeonova & Fishbein, 2004.) Cyanide can be found in various effluents from
several industries including coal coking, mining, ore leaching, metal electroplating,
photography, and steel tempering (Moussavi, Majidi & Farzadkia, 2011).
Cyanide is widely used in various industry sectors including jewelry making, synthetic
nylon, and rubber production, electroplating, agriculture, and mining (e.g. gold and silver
extraction) (Kuyucak & Akcil, 2013). In the mining industry, gold and silver extractions are
carried out via the cyanidation process. In this process, the high tendency of cyanide to
complex with gold and silver results in the dissolution and removal of these precious metals
from ore bodies; however, the affinity of cyanide to react with other metals in the ore results
in its consumption (Norman & Raforth, 1994).
The released wastewater from the mining industry may contain metal-cyanide complexes.
The change of pH or exposure to sunlight results in the ionization of these complexes and
the release of free cyanide (Pohlandt, Jones & Lee, 1983). Free cyanide, as the sum up of
molecular cyanide (HCN) and ionic cyanide (CN-), is the primary toxic agent. According to
the conducted research (EPA 2010a), 0.54 mg CN-/kg weigh body is the oral lethal dose to
humans.
To sum up, the toxicity of cyanide and the efficiency of the cyanidation process necessitate
its rapid and precise determination. For this purpose, various techniques with their own
advantages and disadvantages have been developed. These methods include titration,
distillation, flow injection analysis, applying the alkaline solution of picric acid, ion selective
electrodes, amperometric, and chromatographic methods. (Young et al, 2008, pp.731-735)

4
1.1 Objectives, research problems, and research questions
The main objective of this research was to compare different methods according to their
accuracies, limitations, parameters, detection limits and define the best method for reliable
analysis procedure. This study aims to answer four main question:
• Which indicator shows lower error in the determination of CN- concentration via
silver nitrate titration method?
• What is the optimum titrant concentration for the determination of specific CN-
concentration?
• Whether the presence of main interferences which may be found in mining water
(sulfate, ammonium, chloride, and nitrate) affect the determination of CN-
concentration?
• What is the most suitable volume of the sample for the analysis of cyanide solutions?
5
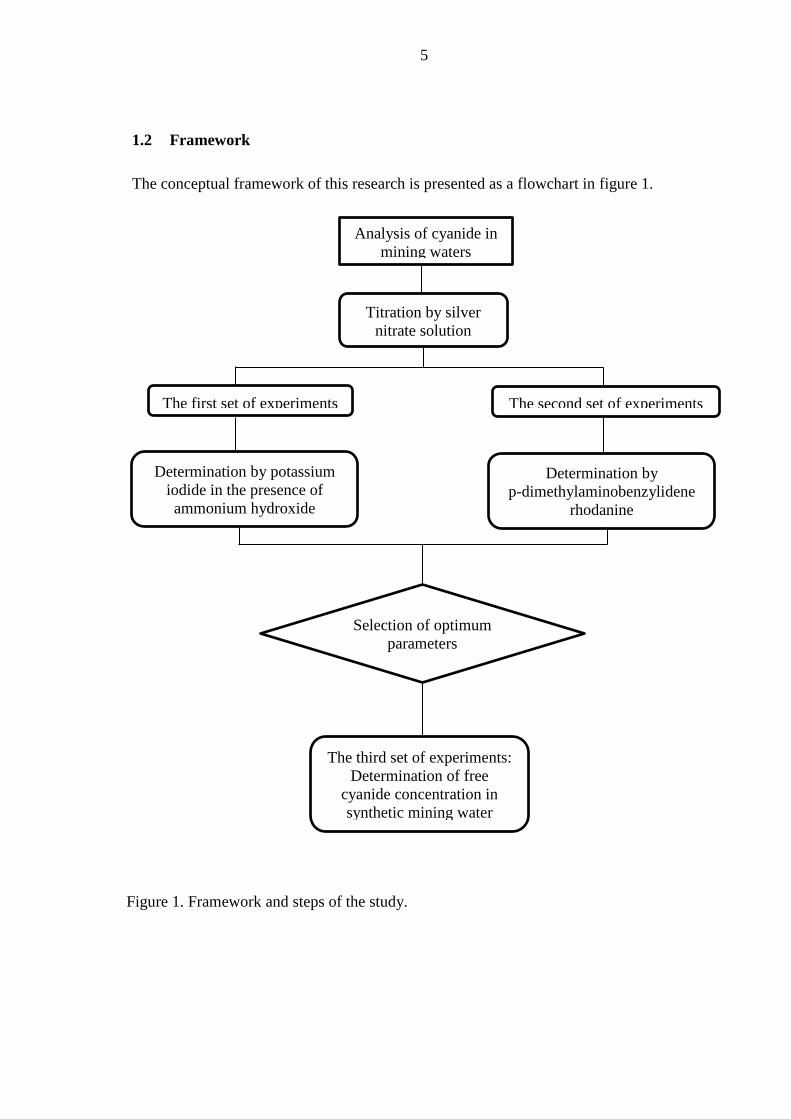
1.2 Framework
The conceptual framework of this research is presented as a flowchart in figure 1.
Analysis of cyanide in
mining waters
The first set of experiments The second set of experiments
Titration by silver
nitrate solution
Determination by potassium
iodide in the presence of
ammonium hydroxide
Determination by
p-dimethylaminobenzylidene
rhodanine
Selection of optimum
parameters
The third set of experiments:
Determination of free
cyanide concentration in
synthetic mining water
Figure 1. Framework and steps of the study.

6
LITERATURE REVIEW
Cyanide can be found in various environmental elements from a wide range of natural or
anthropogenic sources. The toxicity and concentration control of cyanide in the mining
industry (gold and silver extraction) make its precise detection necessary. Therefore, several
methods have been developed to determine various types of cyanide. Different types of
cyanide, its sources of occurrence, and the level of its toxicity to the environment, humans,
and other living creatures are described in the following sections.
Cyanide complexes are classified into free cyanide, weak acid dissociable (WAD) cyanide,
and total cyanide. The term free cyanide refers to either molecular hydrogen cyanide (HCN)
or ionic cyanide (CN-). The weak acid dissociable cyanide are cyanide species which
dissociate in acidic condition (pH 4.5-6) and release free cyanide. Total cyanide or strong
acid dissociable (SAD) cyanide refer to the all inorganic chemical forms of cyanide which
release free cyanide in strongly acidic conditions.
Several methods including titration, distillation, flow injection analysis, applying the
alkaline solution of picric acid, ion selective electrodes, amperometric, and chromatographic
methods have been developed to determine different cyanide species. These methods, their
drawbacks, advantages, procedure, and detection limit are also discussed in the next sections.
Additionally, the removal of cyanide with natural degradation, chemical oxidation, and
electrocoagulation are introduced at the end of this chapter.
2 CYANIDE
The term “cyanide” refers to the wide variety of chemical compounds, all of which contain
CN moiety in their structure (Kuyucak & Akcil, 2013). Among all these chemical forms,
free cyanide (sum of HCN and CN-) is the primary toxic agent, regardless of its source
(Simeonova & Fishbein, 2004). The chemical structure of CN- in which one atom of carbon
is bonded to one atom of nitrogen through a triple bond is shown in figure 2 (Birmingham
City University, 2011).

7
Figure 2. The chemical structure of cyanide ion (Birmingham City University, 2011).
The CN- structure shows that nitrogen has three bonds and one unshared pair of the electron.
Although, carbon has the same structure, its tendency to form four bonds makes CN- unstable
and highly reactive (Gary et al, 2014, p.169). The Lewis structure of CN- in figure 3
represents one sigma (σ) bond, two pi (π), and two empty bonding orbitals. The s and p
orbitals of this ion are filled with electrons and this makes cyanide behave similarly to a
halogen (Pseudo-halogen behavior). The empty anti-bonding orbitals in this ion can form
the bond with the d orbital of the transient metals which results in the formation of metal-
cyanide compounds (Mudder, Botz & Smith, 2001, p.7).

8
Figure 3. The Lewis structure of cyanide ion (Gary et al, 2014, p.169).
2.1 The occurrences of cyanide
Cyanide can be found naturally in the seeds/kernels, in the leaves, as well as in the roots of
several plants. There are 2,650 plant species (that contain cyanogenic glycoside) in which
the amount of cyanide in them can reach to more than 100 ppm. The cyanide concentrations
in some plant species are summarized in table 1. (Lottermoser, 2010, pp.243-244)

9
Table 1. The cyanide concentrations in some plant species (Jaszczak et al, 2017; Logsdon,
Hagestein& Mudder, 1999).
Plant species Plant component(s)/types Concentration
Bamboo
Tip
Leaf
Stem
Max 8000 mg/kg
1010 ppm
Max 3000 mg/kg
Cassava (sweet varieties)
Leaves
Roots
Dried roots
Mash
377-500 mg/kg
138 mg/kg
46-˂100 mg/kg
81 mg/kg
Cassava (bitter varieties)
Leaves
Roots
Dried roots
Mash
347-1000 mg/kg
327-550 mg/kg
95-2450 mg/kg
162 mg/kg
Almond
Bitter
Sweet
Spicy
280-2500 mg/kg
22-54 mg/kg
86-98 mg/kg
Sorghum Leaf
Whole young plant
750 ppm
Max 2500 mg/kg
Apple Seed 108 mg/100 gr
Plum Seed 696 ppm
Manioc Root 27 ppm
Spinach Leaf 2.51±0.6 μg/g
Nectarine Seed 196 ppm
Apart from natural occurrences of cyanide, there are anthropogenic sources which can
introduce various forms of this compound to different environmental elements. Cyanide
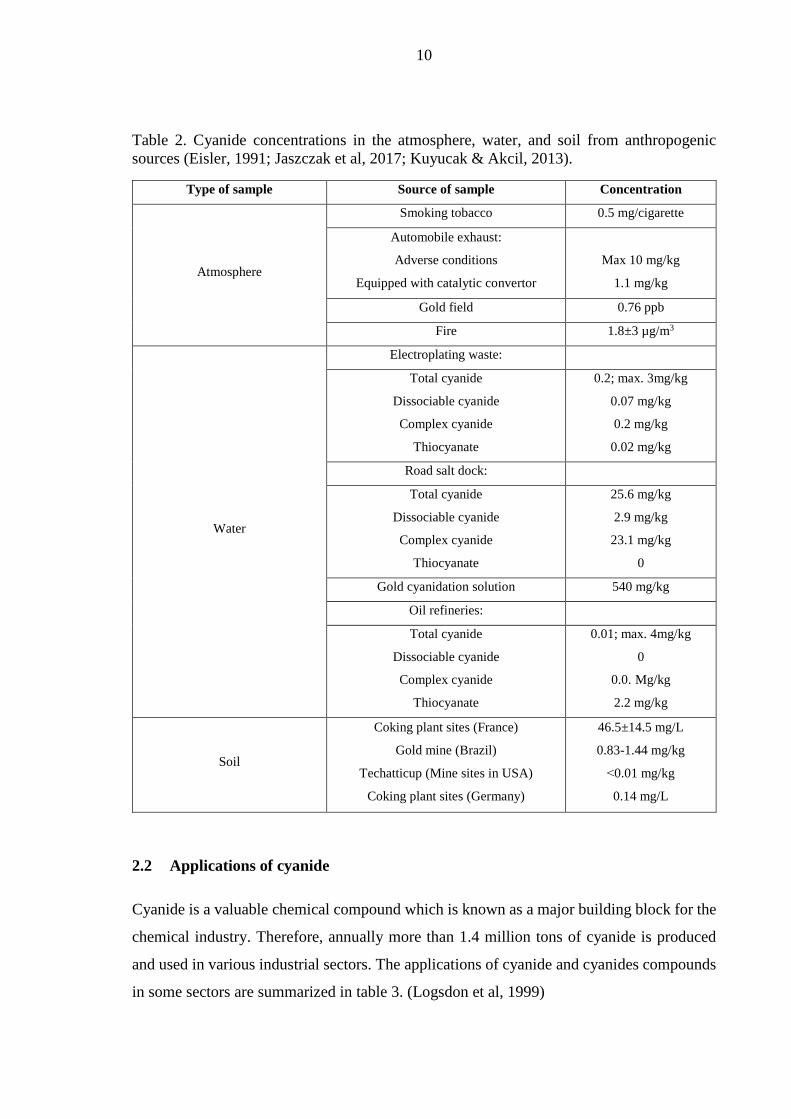
concentrations in the atmosphere, water, and soil from these sources are presented in table
2. (Simeonova & Fishbein, 2004)
10
Table 2. Cyanide concentrations in the atmosphere, water, and soil from anthropogenic
sources (Eisler, 1991; Jaszczak et al, 2017; Kuyucak & Akcil, 2013).
Type of sample Source of sample Concentration
Atmosphere
Smoking tobacco 0.5 mg/cigarette
Automobile exhaust:
Adverse conditions
Equipped with catalytic convertor
Max 10 mg/kg
1.1 mg/kg
Gold field 0.76 ppb
Fire 1.8±3 µg/m3
Water
Electroplating waste:
Total cyanide
Dissociable cyanide
Complex cyanide
Thiocyanate
0.2; max. 3mg/kg
0.07 mg/kg
0.2 mg/kg
0.02 mg/kg
Road salt dock:
Total cyanide
Dissociable cyanide
Complex cyanide
Thiocyanate
25.6 mg/kg
2.9 mg/kg
23.1 mg/kg
0
Gold cyanidation solution 540 mg/kg
Oil refineries:
Total cyanide
Dissociable cyanide
Complex cyanide
Thiocyanate
0.01; max. 4mg/kg
0
0.0. Mg/kg
2.2 mg/kg
Soil
Coking plant sites (France)
Gold mine (Brazil)
Techatticup (Mine sites in USA)
Coking plant sites (Germany)
46.5±14.5 mg/L
0.83-1.44 mg/kg
˂0.01 mg/kg
0.14 mg/L
2.2 Applications of cyanide
Cyanide is a valuable chemical compound which is known as a major building block for the
chemical industry. Therefore, annually more than 1.4 million tons of cyanide is produced
and used in various industrial sectors. The applications of cyanide and cyanides compounds
in some sectors are summarized in table 3. (Logsdon et al, 1999)

11
Table 3. The applications of cyanide and cyanide compounds in various sectors (Simeonova
& Fishbein, 2004; Taylor, 2006).
Cyanide species Chemical formula Sector Application
Calcium cyanide Ca (CN)2 As fumigant
As stabilizer for cement
Cyanogen C2N2
Fumigant
Fuel gas for welding and cutting
heat-resistant metals
Sodium nitroprusside
Laetrile
C5FeN6 Na2O
Pharmaceutic
pharmaceutic
As anti-hypertensive agent
Anticancer activity in animals
Sodium Ferrocyanide Na4Fe (CN)6.10H2O photography Bleaching
Potassium ferricyanide C6FeK3N6 Electroplating
Calico printing
Sodium cyanide NaCN
Mining
Electroplating
Transport
Extraction gold and silver
Fumigation of ships
The mining industry utilizes 13% of world cyanide production, mostly for gold extraction
(Kuyucak & Akcil, 2013). The dissolution and removal of this precious metal can be carried
out via several techniques; however, the cyanidation process is the most commonly applied
method since 1898 (Mudder et al, 2001, p.1). The dissolution of gold is a two-step process
in which hydrogen peroxide (H2O2) is produced as an intermediate (see reactions 1-3)
(Norman & Raforth, 1994).
2𝐴𝑢 + 4𝑁𝑎𝐶𝑁 + 2𝐻2𝑂 + 𝑂2 → 2𝑁𝑎𝐴𝑢(𝐶𝑁)2 + 2𝑁𝑎𝑂𝐻 + 𝐻2𝑂2 (1)
2𝐴𝑢 + 4𝑁𝑎𝐶𝑁 + 𝐻2𝑂2 → 2𝑁𝑎𝐴𝑢(𝐶𝑁)2 + 2𝑁𝑎𝑂𝐻 (2)
And the overall reaction is that is known as Elsner′s reaction is:
4𝐴𝑢 + 8𝑁𝑎𝐶𝑁 + 𝑂2 + 2𝐻2𝑂 → 4𝑁𝑎𝐴𝑢(𝐶𝑁)2 + 4𝑁𝑎𝑂𝐻 (3)

12
The overall steps of gold processing are shown in figure 4. According to this figure, the gold
ore is crushed to fine powder through the first step. After flotation, as the second step, if the
gold ore is refractory (the microscopic particles of gold are mixed with silver, zinc, and
copper) some pretreatment procedures such as roasting or oxidation should be applied prior
to the leaching. This step is followed by cyanide leaching that can be either heap leaching
(for low-grade ore) or agitate leaching (for high-grade ore). After that, the main objective is
extracting the solubilized gold from the solution. The processing steps are described in more
details in figure 5. (BarbenAnalytical, 2015; OCEANAGOLD, 2015)
Figure 4. The block diagram of gold processing (BarbenAnalytical, 2015).
According to figure 4 to figure 5, the extracted pulp from the leaching step is cascaded over
4-6 tanks via gravity flow. Next, the added activated carbon at the contrary end is pumped
upstream through the tanks. The final loaded carbon is separated and transferred to the
carbon stripping step. In this stage, the movement of the loaded carbon through the stripping
vessel (at high pH and temperature around 95◦C) results in the gold desorption from the
carbon. The resultant solution which contains the gold is known as the pregnant leach
solution. (BarbenAnalytical, 2015; OCEANAGOLD, 2015)

13
The pregnant solution is transferred to the electrowinning cell through the next stage. At the
same time, the regenerated carbon is also carried away to the carbon adsorption cell. The
applied current into the solution in the electrowinning cell breaks the bond between cyanide
and gold. At the end of the process, the accumulated gold on the electrowinning cathodes is
melted in the smelting stage for further processing and the barren cyanide solution is
conveyed to the leaching circuit. (BarbenAnalytical, 2015; OCEANAGOLD, 2015)
Figure 5. The details of gold processing steps from figure 4 (BarbenAnalytical, 2015).
2.3 The chemistry of cyanide solutions
The cyanide compounds present in gold mine, cyanidation solutions, or discharged effluents
include free cyanide, simple cyanide compounds, metal-cyanide complexes, and cyanide-
related compounds. The classification of these compounds is presented in table 4 and the
grouping of each one is described in the following subsections. (Mudder et al, 2001, p.6)

14
Table 4. Classification of cyanide and cyanide compounds in cyanidation solutions (Mudder
et al, 2001, p.9).
Classification Examples of cyanide compounds
Free cyanide HCN, CN-
Simple cyanide compounds Soluble: NaCN, KCN, Ca (CN)2, Hg (CN)2
Insoluble: Zn (CN)2, Cd (CN)2, CuCN, Ni (CN)2, AgCN
Metal-cyanide complexes
Weak complexes: Zn (CN)4-2, Cd (CN)3
-2, Cd (CN)4-2
Moderately strong complexes: Cu (CN)2-, Cu (CN)3
-2, Ni (CN)2-2, Ag (CN)2
-
Strong complexes: Fe (CN)6-4, Co (CN)6
-4, Fe (CN)6-3, Au (CN)2
-
Cyanide-related compounds SCN-, CNO-, NO3-, NH3, CNCl, NH2Cl
2.3.1 Free cyanide
The term free cyanide refers to the sum of CN- and HCN. The dissolution of NaCN in the
cyanidation process results in the formation of Na+ and CN-. Cyanide anions undergo
hydrolysis and combine with hydrogen according to reaction 4. (Lottermoser, 2010, p.246)
𝐶𝑁− (𝑎𝑞) + 𝐻2𝑂(𝑙) ↔ 𝐻𝐶𝑁(𝑎𝑞) + 𝑂𝐻−(𝑎𝑞) (4)
Parameters such as pH, the salinity of solution, and the content of heavy metals which tend
to react with cyanide determine the concentration of free cyanide in the solution (Pohlandt,
Jones & Lee, 1983). The presence of CN- and HCN as the function of pH is presented in
figure 6. According to this figure, under alkaline conditions (pH>10.5), the dominant species
are CN-. At the lower pH values (around 9.3), there is the equivalent concentration of CN-
and HCN (Lottermoser, 2010, p.246). In addition, free cyanide is present as HCN from the
neutral to acidic conditions (7.0 < pH < 8.3).

15
Figure 6. The presence of free cyanide species as the function of pH at 25 C (Lottermoser,
2010, p.246).
Hydrogen cyanide is a weak acid with bitter almond-like odor, low boiling point (25.70 C)
and high vapor pressure (35.2 kPa at 0 C, 107.2 kPa at 27.2 C), which readily is converted
to gas and dispersed into the air (Mudder et al, 2001, p.7; Simeonova & Fishbein, 2004).
The formation of HCN is the minor factor in reducing the cyanide concentration in mineral
processing solutions; however, the main reason for the cyanide consumption at mining sites
can be because of its high tendency to complex with other metals in ore bodies (Moran,
1999).
2.3.2 Simple cyanide compounds
The simple cyanide compounds are divided into readily soluble neutral and insoluble salts.
The soluble simple cyanide compounds are alkali and alkali earth metal cyanides such as
calcium, potassium, and sodium. These compounds are dissolved readily in aqueous solution
and produce CN- and metal cations according to reactions 5-7. This is followed by reaction
of CN- with water and the formation of HCN as it is shown in reaction 4. (Barnes et al, 2000;
Mudder et al, 2001, p.8)
𝐶𝑎(𝐶𝑁)2 → 𝐶𝑎+2 + 2𝐶𝑁− (5)
𝐾𝐶𝑁 → 𝐾+ + 𝐶𝑁− (6)

16
𝑁𝑎𝐶𝑁 → 𝑁𝑎+ + 𝐶𝑁− (7)
2.3.3 Metal-cyanide complexes
The metal-cyanide complexes are divided into weak, moderately strong, and strong
complexes. The tendency of cyanide to complex with metals such as copper, nickel, zinc,
silver, and cadmium results in the formation of weak and moderately strong complexes.
These complexes are formed in a step-wise way in which the cyanide content is increased as
the cyanide concentration in the solution gets higher. For example, the formation of copper-
cyanide complex takes place according to reaction 8-10. (Mudder et al, 2001, pp.12-13)
𝐶𝑢𝐶𝑁 + 𝐶𝑁− → 𝐶𝑢(𝐶𝑁)2− (8)
𝐶𝑢(𝐶𝑁)2− + 𝐶𝑁− → 𝐶𝑢(𝐶𝑁)3
−2 (9)
𝐶𝑢(𝐶𝑁)3−2 + 𝐶𝑁− → 𝐶𝑢(𝐶𝑁)4
−3 (10)
The ability of cyanide to complex with copper, iron, and gold results in the formation of
strong metal-cyanide complexes. These compounds are stable in acidic solutions at room
temperature, however, they decompose to some extent at elevated temperature (Barnes et al,
2000). The dissociation of these compounds due to the exposure to UV radiation or highly
strong acid can release considerable amounts of CN-. The iron-cyanide complexes are known
for releasing HCN through exposure to intense UV radiation (Mudder et al, 2001, p.13). The
dissociation rate of metal-cyanide complexes is affected by several parameters such as the
water temperature, pH, total dissolved solids, complex concentration, and light intensity
(Moran, 1999).
2.3.4 Cyanide related compounds
The cyanide-related compounds include thiocyanate, cyanate, cyanogen chloride,
chloramine, ammonia, and nitrate which are formed in the solution as the result of
cyanidation, water treatment processes, or natural attenuation (Mudder et al, 2001, p.22).
Thiocyanate (SCN-) is generated in the reaction between CN- and sulphur species during the

17
leaching or pre-aeration processes. The potential sources of sulphur include free sulphur, all
the sulphide minerals such as pyrrhotite (FeS) chalcocite (Cu2S) and chalcopyrite (CuFeS2)
and the oxidation products of them, such as polysulfide and thiosulfate (S2O3-2) (Kuyucak &
Akcil, 2013). Some of the reactions which result in the formation of thiocyanate are
presented in table 5.
Table 5. Chemical reactions which result in thiocyanate generation (Jenny et al, 2001).
Reaction agent Reaction
Elemental sulfur 𝑆0 + 𝐶𝑁− → 𝑆𝐶𝑁−
Sulfide 𝑆−2 + 𝐶𝑁− + 𝐻2𝑂 + 1/2𝑂2 → 𝑆𝐶𝑁− + 2𝑂𝐻−
Thiosulfate 𝑆2𝑂3−2 + 𝐶𝑁− → 𝑆𝑂3
−2 + 𝑆𝐶𝑁−
Thiocyanate is seven times less toxic than cyanide and has inferior tendency to form soluble
metal complexes. However, its biological and chemical degradation may produce ammonia,
cyanate, and nitrate. (Kuyucak & Akcil, 2013; Mudder et al, 2001, p.22)
Cyanate (CNO-) is another cyanide-related compound which can be generated via the
oxidation of cyanide with the aid of oxidizing agents such as hydrogen peroxide, ozone,
gaseous oxygen or hypochlorite. The hydrolysis of this compound to ammonia and carbonate
(CO3-2) inhibits its accumulation in the solution. Some of the reactions which result in the
cyanate formation are listed in table 6. (Kuyucak & Akcil, 2013; Simovic, 1984)
Table 6. Chemical reactions that result in cyanate generation.
Reaction agent Reaction Reference
Hydrogen peroxide 𝐶𝑁− +𝐻2𝑂2 → 𝐶𝑁𝑂− + 𝐻2𝑂 (Kitis et al, 2005)
Ozone 𝐶𝑁− + 𝑂3 → 𝐶𝑁𝑂− + 𝑂2 (Parga et al, 2003)
Hypochlorite 𝐶𝑁− + 𝐶𝑙𝑂− → 𝐶𝑁𝑂− + 𝐶𝑙− (Lister, 1955)
The other compound belonging to this group is cyanogen chloride (CNCl) which is produced
due to the destruction of cyanide by ClO- in alkaline chlorination process. This toxic
compound is not stable and is converted to CNO- in few minutes at pH values from 10 to 11.
There is indeterminacy about the behavior of CNCl at lower pH levels. (Eden, Hampson &
Wheatland, 1950)

18
Two other cyanide-related compounds are Chloramine (NH2Cl) and ammonia (NH3).
Chloramine is chlorinated ammonia compound that can be generated during alkaline
chlorination process. This compound is less toxic than CN-; however, it may persist in the
environment for a substantial period (Moran, 1999). The presence of ammonia in mining
sites can be from remaining blasting agents, hydrolysis of cyanate, or the oxidation of hot
cyanide solution during stripping of loaded carbon. Free ammonia tends to form soluble
amine complexes with heavy metals such as zinc, silver, copper, and nickel. Hence, the
presence of ammonia in the solutions with the pH values above 9 prevent the precipitation
of these metals (Mudder et al, 2001, p.23).
Finally, Nitrate (NO3-) and Cyanogen (C2N2) can also be considered as cyanide-related
compounds. The oxidation of ammonia through the biological nitrification results in the
formation of nitrite and then nitrate, which is a relatively stable compound. High
concentrations of nitrate (more than 45 mg/liter) can be detrimental to humans, especially
infants. Moreover, this biological nutrient can accelerate the growth of algae in the water.
The consumption of dissolved oxygen by these species can endanger the life of aquatic
organisms, particularly fish (Botz, Mudder & Akcil, 2005, pp.693-697). The free cyanide
can also form C2N2 under acidic conditions and in the presence of oxidants such as oxidized
copper minerals. Cyanogen exists in a gaseous form at ambient temperature, however, the
stability of this compound at moderately alkaline or neutral pH waters is unclear (Moran,
1999).
2.4 Toxicity of cyanide
Cyanide is a fast-acting poison, which can enter the body as hydrogen cyanide via the lungs,
skin absorption, and from the mucous membrane. This compound can also be absorbed as
an ion through ingestion. (Egekeze & Oehme, 2011) The combination of cyanide as HCN
with Fe+3 of the cytochrome oxidase results in cellular hypoxia and shifting from aerobic to
anaerobic cellular respiration (Surleva, Gradinaru & Drochioiu, 2012). This alteration leads
to cellular ATP reduction, tissue death, and an increase in the synthesis of lactic acid, as
shown in figure 7.
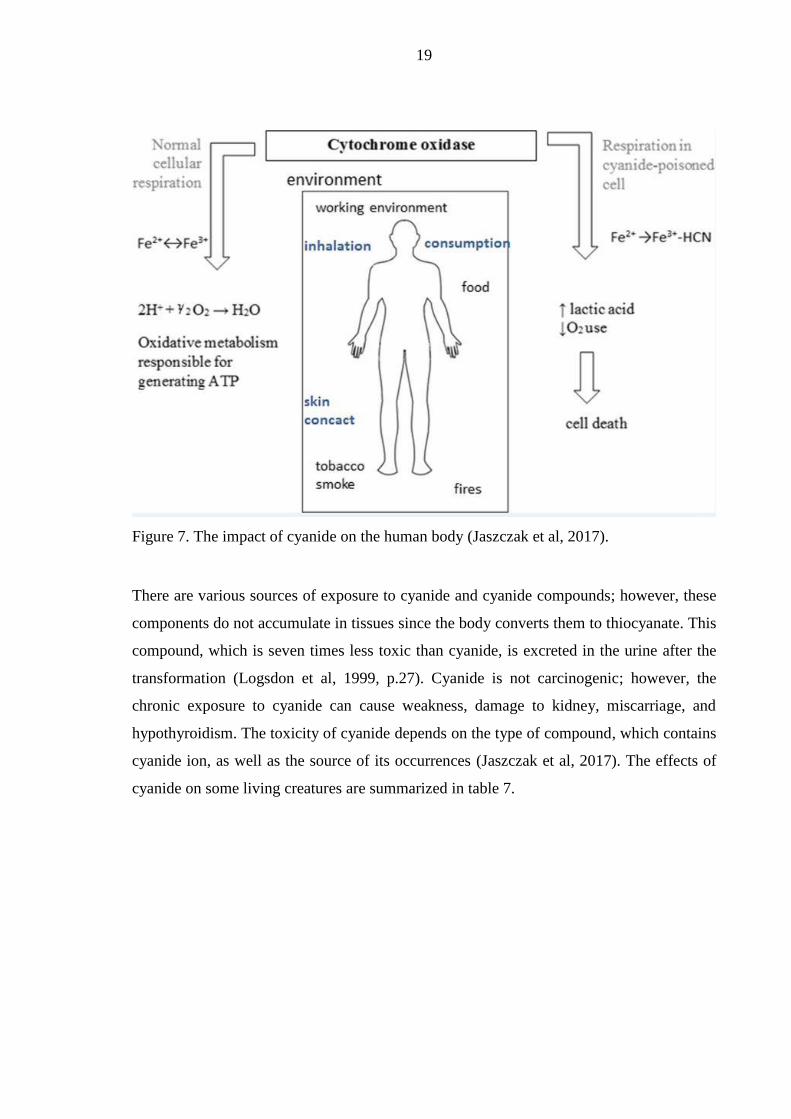
19
Figure 7. The impact of cyanide on the human body (Jaszczak et al, 2017).
There are various sources of exposure to cyanide and cyanide compounds; however, these
components do not accumulate in tissues since the body converts them to thiocyanate. This
compound, which is seven times less toxic than cyanide, is excreted in the urine after the
transformation (Logsdon et al, 1999, p.27). Cyanide is not carcinogenic; however, the
chronic exposure to cyanide can cause weakness, damage to kidney, miscarriage, and
hypothyroidism. The toxicity of cyanide depends on the type of compound, which contains
cyanide ion, as well as the source of its occurrences (Jaszczak et al, 2017). The effects of
cyanide on some living creatures are summarized in table 7.

20
Table 7. The effect of cyanide on some living creatures (Donato et al, 2007; Jaszczak et al,
2017; Mudder et al, 2001, p.147; Singh & Wasi, 1986).
Species Dose Comment
Rat 5.1-5.7 mg NaCN/kg BW *LD50 lethal single dose
Dog 24 mg NaCN/kg BW Lethal single dose
Domestic chicken 11.1 mg CN/kg BW Acute oral LD50
Gold fish 104 mg nickel cyanide
compound/liter No effect in 24 hr
Rainbow Trout 0.028 mg HCN/liter **LC50-96 hr
Rainbow Trout 0.01 mg KCN/liter (T=2-4◦C) LC50-96hr
Adult human
0.57 mg HCN/kg BW
1.5mg CN-/kg BW
200-300 mg cyanide in food
Death
Lethal dose
Lethal dose
Guinea pig 1.098 mg/kg ammonia,
thiosulphate LD50
Rabbit 2.680 mg/kg sodium nitrate LD50
*LD50 is a lethal dose, usually given in mg/kg-body weight. The dose means the organism ingests the
toxic substance.
**LC50 is a lethal concentration to which and organism is exposed. For example, fish or daphnia are
placed in water with a concentration of the toxic substance.
21
3 THE CYANIDE ANALYSIS METHODS
The precise determination of cyanide is difficult for several reasons. As an example, the
presence of cyanide in the ionic or molecular form is highly dependent on the pH of the
solution. Furthermore, the high tendency of cyanide to complex with different metals results
in the formation of metal-cyanide complexes. Additionally, the ionization of these
complexes through exposure to sunlight or change of pH releases substantial concentrations
of HCN. (Barnes et al, 2000)
The chemical solution which contains HCN and the precipitate of cyanide complexes is not
stable, and its analysis is difficult. Accordingly, various methods with their own advantages
and disadvantages have been developed for the determination of cyanide. The most
frequently used methods in laboratories for cyanide analysis are discussed in the following
chapters. (Pohlandt et al, 1983)
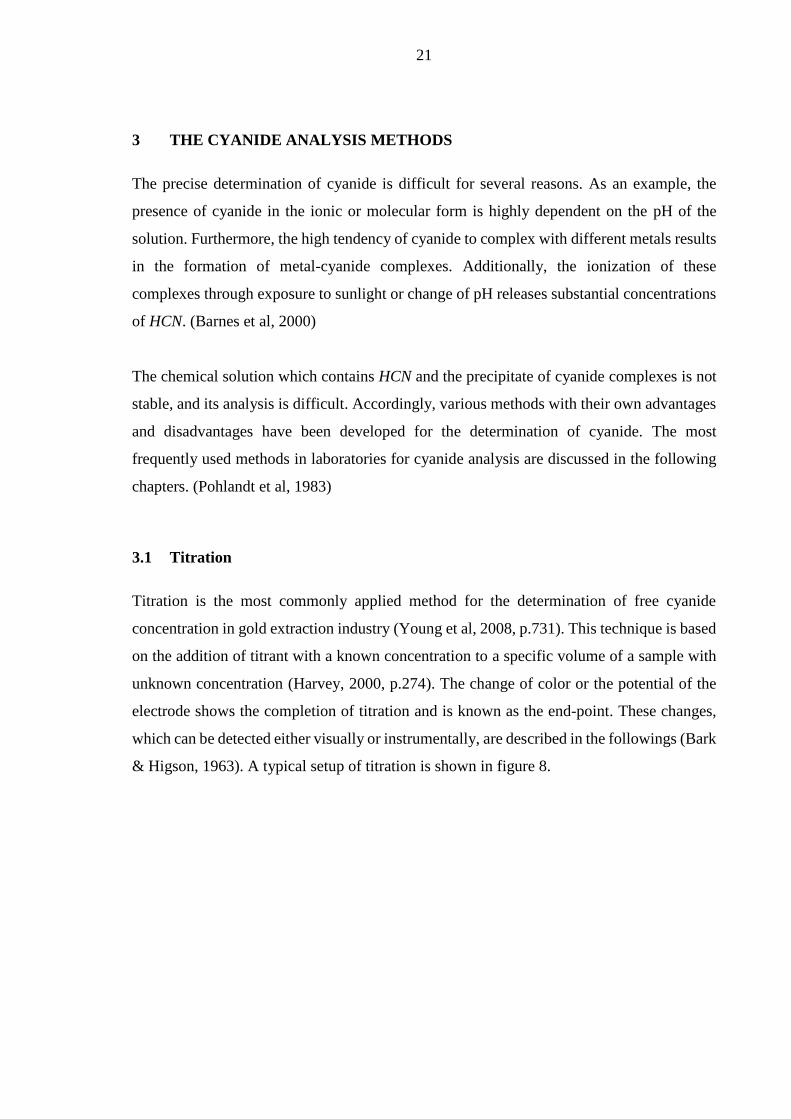
3.1 Titration
Titration is the most commonly applied method for the determination of free cyanide
concentration in gold extraction industry (Young et al, 2008, p.731). This technique is based
on the addition of titrant with a known concentration to a specific volume of a sample with
unknown concentration (Harvey, 2000, p.274). The change of color or the potential of the
electrode shows the completion of titration and is known as the end-point. These changes,
which can be detected either visually or instrumentally, are described in the followings (Bark
& Higson, 1963). A typical setup of titration is shown in figure 8.

22
Figure 8. A titration setup for typical laboratory applications (Chemistry102, 2013).
3.1.1 Titration method including visual end-point determination
The first visual determination method of cyanide was reported by Liebig in 1851. In this
method, the sample containing cyanide is titrated with silver nitrate solution, AgNO3. The
reaction between silver ions and CN- according to reaction 11 results in the formation of
argentocyanide ion, [Ag (CN) 2]-. When the reaction is completed, further addition of titrant
yields the insoluble silver argentocyanide (Ag [Ag (CN) 2]) as it is shown in reaction 12.
Finally, the endpoint is detected by the formation of perpetual turbidity or the precipitate.
(Singh & Wasi, 1986)
𝐴𝑔+ + 2𝐶𝑁− ↔ [𝐴𝑔(𝐶𝑁)2]− (11)
[𝐴𝑔(𝐶𝑁)2]− + 𝐴𝑔+ → 𝐴𝑔[𝐴𝑔(𝐶𝑁)2] (12)
The Liebig´s argentometric method is subjected to the error in ammoniacal and alkaline
solutions (Bark & Higson, 1963). In 1895, Denigés modified this method by adding
potassium iodide (KI) as the indicator in the presence of ammonium hydroxide (NH4OH)
prior to the titration (Singh & Wasi, 1986). In the modified method, the formation of silver
iodide (AgI) which appears as an insoluble yellowish solid, shows the completion of the
titration (Milosavljevic, 2013).

23
In the Denigés method, the added silver ions to the solution are converted to diamminesilver
(I) ions, [Ag (NH3)2] +. This is followed by the reaction of these ions with two CN- and the
formation of [Ag (CN) 2] - according to reaction 13. (Burgot, 2012, pp.700-701)
[𝐴𝑔(𝑁𝐻3)2]+ + 2𝐶𝑁− → [𝐴𝑔(𝐶𝑁)2]
− + 2𝑁𝐻3 (13)
The excess amount of silver ion as [Ag (NH3)2] + will react with [Ag (CN) 2]
- according to
the following reaction (Burgot, 2012, pp.700-701).
[𝐴𝑔(𝑁𝐻3 )2]+ + [𝐴𝑔(𝐶𝑁)2]
− ↔ 𝐴𝑔[𝐴𝑔(𝐶𝑁)2] ↓ +2𝑁𝐻3 (14)
Finally, the added iodide (I-) in the form of KI causes the precipitation of silver iodide as it
is shown in reaction 15 (Burgot, 2012, pp.700-701).
[𝐴𝑔(𝑁𝐻3 )2]+ + 𝐼− ↔ 𝐴𝑔𝐼 ↓ +2𝑁𝐻3 (15)
In 1944, Ryan and Culshaw modified the Liebig`s method by using
p-dimethylaminobenzylidene rhodanine (C12H12N2OS2) indicator. In this method, once all
CN- reacted with Ag+ according to reaction 11, the excess amount of silver ions reacts with
the rhodanine accordingly, and the color change from yellow to pale pink occurs (see
reaction 16). In other words, the end-point of the process is reached when the pale pink color
appears. (Breuer, Sutcliffe & Meakin, 2011) This method can be successfully used for the
determination of cyanide concentration in samples with 1 ppm and higher free cyanide (Bark
& Higson, 1963).
𝑅ℎ(𝑦𝑒𝑙𝑙𝑜𝑤) + 𝐴𝑔+ → 𝑅ℎ − 𝐴𝑔(𝑝𝑖𝑛𝑘) (16)
Other applied indicators in the determination of cyanide with AgNO3 includes dithizone and
diphenylcarbazide. In the case of using dithizone, the end-point is detected by the change of
color from orange-yellow to deep red-purple. Regarding diphenylcarbazide, the addition of
titrant is stopped when the color changes from pink to pale violet. (Archer, 1958; Mendham
2006, p.358)

24
Sarwar et al. (1973) studied the feasibility of using other solutions than AgNO3 for the
determination of cyanide concentration. They reported that N-bromo-succinimide as titrant
and bodeaux red as an indicator can be applied for the detection of 1-6 mg/ml of cyanide
with the standard deviation of 0.66%. In their experiment, the change of color from rose-red
to yellow showed the end of the titration. However, the presence of iodide, thiocyanate,
bisulfite (HSO3-), thiosulfate, sulfite (SO3
-2) and sulfide (S-2) interfered with the precise
determination of cyanide. (Sarwar, Rashid & Fatima, 1973)
3.1.2 Titration method including instrumental end-point determination
The first instrumental determination method of cyanide using AgNO3 with potentiometric
electrode was introduced in 1922 (Bark & Higson, 1963). In this method, the potential
change of the electrode (mostly silver) is measured against the reference electrode during
the addition of titrant (Jimenez-Velasco et al, 2014). In the potential curve, which is obtained
by plotting the electrode potential changes versus the added volume of titrant, the sharp peak
shows the end-point and can be related to the concentration of free cyanide, as it is shown in
figure 9.
Figure 9. The potential change curve in the presence of various anions (Breuer et al, 2011).
Breuer et al. (2011) compared the determination of cyanide using silver nitrate titration with
rhodanine and silver nitrate titration using the potentiometric end-point method. They
reported that in the presence of copper and/or thiosulfate, the first method presents
overestimated concentration for free cyanide. However, in the potentiometric end-point, if
the pH is above 12 (to eliminate the interference of zinc), this method has no interference.
Although the analysis using rhodanine could not be compared directly in contrast to the

25
potentiometric end-point, the potentiometric method was selected as a preferable technique
(Breuer et al, 2011). Jimenez-Velasco et al. (2014) studied the analysis of cyanide in copper-
bearing solution with different endpoint detection methods. The rhodanine, KI indicator, and
potentiometric method were applied for the determination of free cyanide concentration. The
above-mentioned methods showed the overestimation of about 25.2%, 4.5%, and 0.3% in
samples with low copper content (molar ratio CN/Cu≈8). This overestimation in samples
with high copper content (molar ration CN/Cu≈4) was 121%, 56%, and 8%, respectively
(Jimenez-Velasco et al, 2014). The other interference that can be found in the cyanide
solution is S-2. In the titration procedure, the added silver ions react with sulfide and form
the black solid of silver sulfide (Ag2S) which hamper the visual detection of end-point.
Alonso-González et al. (2017) studied the determination of free cyanide in the presence of
sulfide ion with potentiometric end-point detection method. They reported that this method
can be successfully applied for the measurement of free cyanide and sulfide ion
concentrations separately (Alonso-González et al, 2017).
According to the literature, silver nitrate titration is a reliable method for the determination
of free cyanide concentration. In addition, this technique can determine the concentration of
WAD or total cyanides after distillation procedure which is described in the following
section. In order to avoid the volatilization of hydrogen cyanide, the pH of the solution is
maintained at 12 by addition of sodium hydroxide (NaOH) before the commencement of
titration. The titration of the cyanide solution containing complexing metals quantify all free
cyanides, cyanides associated with zinc, and the portion of those associated with copper. In
this case, the obtained results are titrable cyanide rather than free cyanide. However, this
method does not act precisely when the concentration of copper is high (CN/Cu≈4). In this
case not only the obtained data for the free cyanide is not precise enough, but also all the
associated cyanides with the copper are not quantified. (Milosavljevic, 2013; Young et al,
2008, p.732)
In conclusion, the titration method is prone to error in the cyanide solution containing
copper, thiosulfate, and sulfide. In the presence of two latter interferences, by applying the
potentiometric end-point detection method, the concentration of cyanide and thiosulfate
(Young et al, 2008, p.732), cyanide and sulfide (Alonso-González et al, 2017) can be
measured individually. However, in the presence of copper, due to the emerging of several

26
end-points, the determination is problematic. Breuer and Rumball in 2006 determined free
cyanide and tetracyanide (Cu (CN)4-3) concentration via modifying the determination of end-
point. However, it is worth to mention that this study was performed on the synthetic water
and in the analysis of process solution, the small peaks on the curve may be masked via other
titrable species of AgNO3 (Young et al, 2008, p.732).
3.2 Distillation
Distillation can be applied as a pretreatment method for the determination of WAD and total
cyanide (Nollet & De Gelder 2007, p.367). In this technique, the sample is acidified and
boiled until the cyanide is liberated from various cyanide compounds in the solution. The
released cyanides as HCN gas are trapped in the absorption solution. Finally, the cyanide
concentration is determined via an appropriate procedure (Young et al, 2008, p.732).
The determination of WAD cyanide by distillation procedure can be found in test method C
from ASTM D2036-06 and standard methods 4500-CN- I from APHA, 4500-NO3. For the
analysis, the sample is placed in the distilling flask and buffered at pH 4.5-6 by adding zinc
acetate and acetate buffer; After that, 2 to 3 drops of methyl red indicator are added to the
sample (the obtained solution should be pink). This procedure is followed by heating the
sample until its boiling point followed by one hour of reflux distillation. The final product
of the procedure is a liberated cyanide. (APHA 4500-NO3; ASTM D2036-06)
The liberated HCN is trapped in the absorption solution (NaOH). After this, the
concentration of cyanide in this solution is determined with titrimetric, colorimetric, or ion
selective electrodes (ASTM D2036-06; APHA 4500-NO3). By means of this method, all the
free cyanide and the cyanide ions associated with cadmium, copper, zinc, and nickel are
recovered and quantified (Mudder et al, 2001, p.40). The cyanide distillation apparatus is
shown in figure 10.

27
Figure 10. Cyanide distillation apparatus (ASTM D2036-06).
In addition to the measurement of WAD cyanide, this procedure can be also used for the
total cyanide determination. In this method, magnesium chloride (MgCl2) is added as a
catalyst into the sample through the air inlet tube. To adjust the pH of the sample to values
less than 2, sulfuric acid (H2SO4) is introduced through the same tube. This pH facilitates
the dissociation of iron-cyanide complexes at high temperature. After boiling and one hour
of reflux distillation, the concentration of cyanide in the absorption solution is determined
by colorimetric, titrimetric, ion selective electrode, or flow injection ligand exchange with
amperometric detection methods. (APHA 4500-NO3; ASTM D2036-06)
To sum up, distillation can be used as the pretreatment method for the determination of WAD
and total cyanide concentrations. However, the required amount of sample for each test is
around 500 ml and the analysis time is long (1-2 hours). Moreover, the presence of nitrate,
nitrite, thiocyanate, and sulfide can interfere with the precise determination; however, the
determination of WAD cyanide is less susceptible to the presence of thiocyanate and sulfide.
The effects of these interferences and the elimination procedure of them are summarized in
table 8. (APHA 4500-NO3; ASTM D2036-06)

28
Table 8. The effects interferences on cyanide distillation method and their elimination
procedures (APHA 4500-NO3; ASTM D2036-06; Barnes et al, 2000; Mudder et al, 2001,
p.34; Young et al, 2008, pp.732-733).
Interferences Effect of interferences Elimination of interferences
Nitrate and
nitrite
Formation of transient compounds which decompose
in test condition and generate CN- (Overestimated
results are obtained).
Addition of sulfamic acid
before the addition of sulfuric
acid.
Sulfide It is distilled over with cyanide and produce hydrogen
sulfide during distillation.
Addition of lead carbonate
(PbCO3) to the solution prior
to distillation.
Thiocyanate In the acidic condition, it reacts with nitrate and
generates free cyanide (overestimated results are
obtained).
In the colorimetric procedure, it reacts with
chloramine-T and both ions are colorized.
Using H3PO4 instead of
H2SO4.
3.3 Flow Injection Analysis (FIA)
Flow Injection Analysis is an automatic or semi-automatic analytical technique that emerged
in 1975 (Ghous, 1999). In this method, a specific volume of the sample is injected into the
carrier stream, which flows continuously. The injected sample constitute a zone, which then
is carried toward a detector that constantly records changes of absorbance by monitoring the
potential of an electrode. In addition to the electrode potential, any other physical parameter
resulting from the passing of the sample through the flow cell can be used for the
determination (Hansen & Wang, 2004). Schematic of the FIA system and its stages are
depicted in figure 11. Finally, it is worth to mention that the FIA method has its own
drawbacks. As an example, the presence of sulfide can interfere with the analysis of cyanide
in this method. However, this interference can be eliminated by adding lead salt before
injecting the sample to the analyzer (Sulistyarti et al, 1999).

29
Figure 11. A) Typical representation of FIA system; B) Stages of FIA (Hansen & Wang,
2004; Siddiqui, Alothman & Rahman, 2017).
Dai (2005) investigated the determination of free cyanide, dicyanide (Cu (CN) 2-), and
tricyanide (Cu (CN) 3-2) in gold leaching solutions via developed FIA method. The system
used in the study employed a flow-through electrochemical cell. This cell comprised of a
platinum electrode, a silver electrode, and a membrane, which provided the flow channel for
the sample over the electrode’s surfaces. They applied the potential of -150 mV and
measured the charge during the silver oxidation. According to their results, the measured
charge was linearly relevant to the free cyanide concentration. The oxidation of silver at 100
mV and reduction of copper at -650 mV were used for the determination of Cu (CN) 2- and
Cu (CN) 3-2 species respectively. (Dai, 2005)
This method can also be applied for the determination of WAD cyanide. In this process,
prior to analysis, the sample is pretreated by means of ligand exchange to release cyanide
from metal-cyanide complexes such as mercury, nickel, silver, and copper. The sample is
then injected into the analyzer and acidified by means of hydrochloric acid (HCl) to convert
cyanide to HCN. This is followed by the gas diffusion through the membrane into the
receiving solution. In this alkaline solution, hydrogen cyanide is converted to cyanide ions.
Finally, the ion concentration is determined amperometrically with the silver/silver
electrode. The diagram of the system is shown in figure 12. (Mudder et al, 2001, pp.44-45)
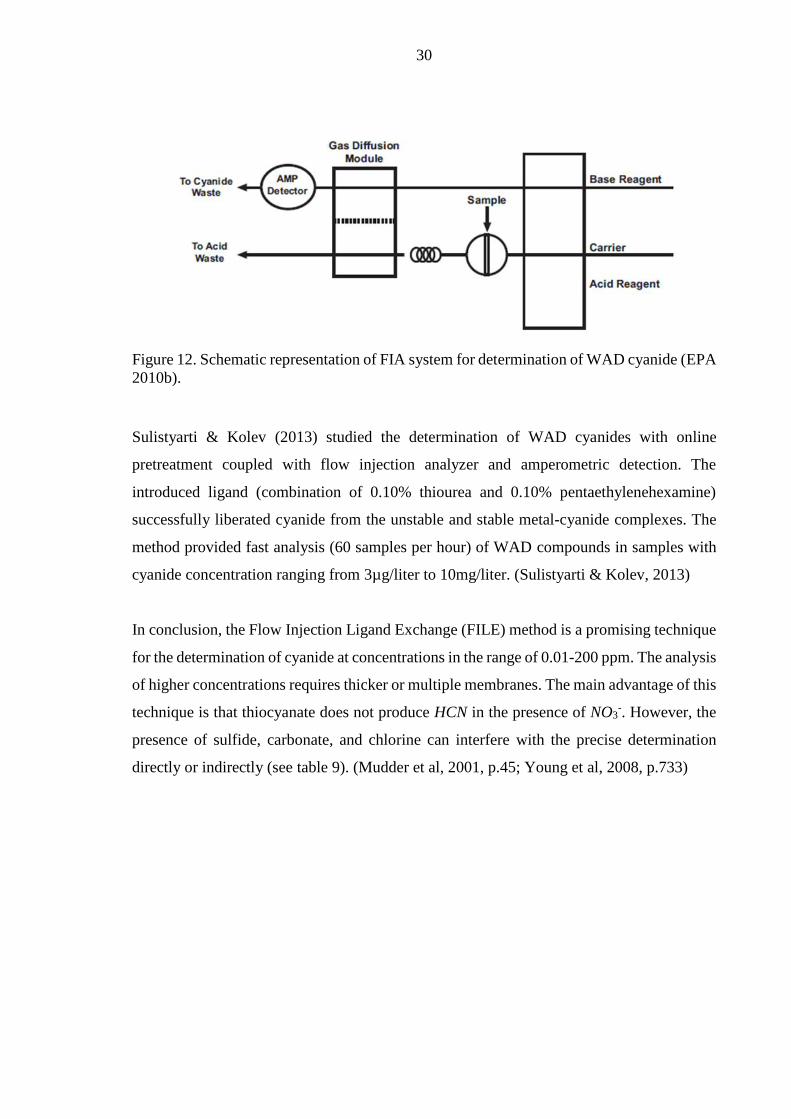
30
Figure 12. Schematic representation of FIA system for determination of WAD cyanide (EPA
2010b).
Sulistyarti & Kolev (2013) studied the determination of WAD cyanides with online
pretreatment coupled with flow injection analyzer and amperometric detection. The
introduced ligand (combination of 0.10% thiourea and 0.10% pentaethylenehexamine)
successfully liberated cyanide from the unstable and stable metal-cyanide complexes. The
method provided fast analysis (60 samples per hour) of WAD compounds in samples with
cyanide concentration ranging from 3µg/liter to 10mg/liter. (Sulistyarti & Kolev, 2013)
In conclusion, the Flow Injection Ligand Exchange (FILE) method is a promising technique
for the determination of cyanide at concentrations in the range of 0.01-200 ppm. The analysis
of higher concentrations requires thicker or multiple membranes. The main advantage of this
technique is that thiocyanate does not produce HCN in the presence of NO3-. However, the
presence of sulfide, carbonate, and chlorine can interfere with the precise determination
directly or indirectly (see table 9). (Mudder et al, 2001, p.45; Young et al, 2008, p.733)

31
Table 9. The effects of interferences on the flow injection ligand exchange method and their
elimination procedures (ASTM D6888-04; EPA 2010b; Young et al, 2008, p.733).
Interferences Effects of interferences Elimination of interferences
Sulfide ions The change of the electrode surface due to the
formation of Ag2S which causes an increase in the
observed current.
The acidified sulfide ions (H2S) diffuse through the
membrane and generate signals on the electrode
surface (positive interference).
Sulfide ions react with cyanide and reduce its
concentration in the solution.
The addition of bismuth nitrate
instead of hydrochloric acid
results in the precipitation and
elimination of sulfide ions.
Carbonate The released carbon dioxide from carbonate diffuses
through the membrane and reduce the pH of the
receiving solution.
Adding hydrated lime to the
sample and allow the
precipitation of
Ca (OH)2/CaCO3.
Chlorine Reacts with the silver electrode and oxidizes the
cyanides.
Adding sodium arsenite or
ascorbic acid to the sample
before analysis.
3.4 Applying the alkaline solution of picric acid
Applying the alkaline solution of picric acid is a colorimetric technique for determining
WAD cyanide concentration. This technique is based on the reaction of the picric acid with
free cyanide from complexes such as nickel, zinc, cadmium, or copper-cyanide. The release
of free cyanide from cyanide compounds can be carried out by means of diethylenetriamine
penta-acetic acid (DTPA) or ethylenediaminetetraacetic acid (EDTA). In this process, the
soluble alkali metal of picrate is transformed by cyanide to the isopurpuric acid (a salt with
bright orange color). The intensity of the generated color is measured by spectrophotometer
at the wavelength of 520 nm and evaluated by using its calibration curve. The intensity is
directly related to WAD cyanide concentration. (Lipták & Venczel, 2016, p.271)
The maximum precision of the picric acid method for determining WAD cyanide is 0.26
mg/liter. The presence of SCN-, CNO-, and S2O3-2, if their concentrations are 1230 mg/liter,

32
340 mg/liter, and 510 mg/liter, does not cause significant interferences. However, in the
presence of sulfide ions, the sample should be treated by the addition of lead salts and
consequent filtering (filtration is for removing the generated precipitates). (Woffenden et al,
2008, pp.88-89) Although this method is simple and relatively precise, it suffers from
various drawbacks. As an instance, picric acid is explosive and requires special handling.
Moreover, its application requires close control of its pH since the color development varies
outside of the pH ranging from 9.0 to 9.5. (Cameron, 2002; Woffenden et al, 2008, p.89;
Young et al, 2008, pp.733-734)
3.5 Ion selective electrode (ISE)
Another technique applied for the determination of free cyanide concentration is the
electrochemical cell. This method consists of an ion selective electrode (ISE) along with a
reference electrode, and a potential measuring device. The schematic diagram of this cell
which analyses the concentration of samples based on the potentiometric measurement is
depicted in figure 13. (Lindler & Pendley, 2013)
Figure 13. Schematic diagram of an electrochemical cell for potentiometric measurement
(Lindler & Pendley, 2013).
ISE is principally a membrane-based device with an inner filling solution. The inner filling
solution contains the ion of interest at the constant activity. When the electrode is immersed
in the sample solution, the transportation of ions starts. The transportation occurs from the
areas with high ion concentrations to the ones with low ion concentrations. The selective
binding of ions with the specific sites of the membrane creates the potential difference which
is directly proportional to the free cyanide concentration. (Wang, 2006, pp.165-166)

33
The ISE with the reference electrode and the potential measuring device is another applicable
method for the analysis of samples with 0.5-10 ppm cyanide. In addition, this method can
be applied after the distillation procedure for the measurement of WAD or total cyanide
concentration. Advantages of ISE include its economic aspects, fast response, wide linear
range, and its immunity to turbidity. The main drawback of this technique is that the
existence of heavy metals, such as lead and mercury, in the solution may shorten the
electrode life. However, the presence of bromide, thiosulfate, and thiocyanate, if their
concentration is less than 10 ppm, does not cause significant interferences. (Young et al,
2008, p.734)
3.6 Amperometric method
Amperometric method is an electrochemical technique applicable for the determination of
free cyanide concentration. An amperometric cell comprises of a working electrode, a
reference electrode (Ag/AgCl electrode), and a counter electrode (steel electrode). The
working electrode can be glassy carbon, gold, or silver. However, the silver one is more
common due to the properties such as its wide linear working range (0.5μg/liter-1gr/liter),
long stability, low cost, and great reproducibility. The schematic representation of the
amperometric cell is shown in figure 14. (Sulistyarti et al, 1999)
Figure 14. The schematic representation of the amperometric cell (Bojorge Ramírez et al,
2009).

34
In the analysis of the solution containing cyanide, the current generated during the reaction
of the silver anode and cyanide anion (anodic polarization) is proportional to the
concentration of cyanide, for clarification see reaction 17. (Barnes et al, 2000)
𝐴𝑔 + 2𝐶𝑁− ↔ [𝐴𝑔(𝐶𝑁)2]− + 𝑒− (17)
The main difficulties associated with the analysis of samples with the amperometric method
is that the surfaces of the electrode expire with time. In addition, the reactions of other
compounds in the solution with the working electrode result in the formation of numerous
products. The adhesion of these products to the electrode surface prevent further reactions.
The outcome of the abovementioned cases is decreasing the generated current and the height
of the recorded peaks. Moreover, the coated or poisoned electrode surface may increase the
noise and drift in the cell. In order to solve these problems, the addition of the appropriate
standard, polishing or replacing the working electrode is suggested. This method is prone to
error in the presence of sulfide, thiosulfate, metal-cyanide compounds, and oxidant. The
effect of these interferences and the elimination procedure of them is described in table 10.
(Robards, Haddad & Jackson 1994, pp.265-266; Young et al. 2008, p.734)
Table 10. The effect of interferences on amperometric method and their elimination
procedure (Young et al, 2008, p.734).
Interferences Effect of interferences Elimination of interferences
Sulfide and thiosulfate Formation of silver sulfide
substrate on the electrode surface
Adding bismuth nitrate
Metals –cyanide compounds Decreasing the diffusion current
Oxidant (ClO-, H2O2) Producing cathodic current Adding arsenite or hydrazine
3.7 Chromatographic methods
The chromatographic methods for the determination of cyanide concentrations are high-
performance liquid chromatography (HPLC), ion chromatography (IC), and gas
chromatography (GC). Among these, IC is the most common method for cyanide
determination. This technique includes size exclusion chromatography, ion-pair
chromatography, and ion-exchange chromatography. (Nollet & De Gelder, 2007, p.730)

35
Giuriati et al. (2004) investigated the determination of CN- and S-2 by ion chromatography.
In this study, a two-potential waveform was adopted in order to eliminate the fouling of the
silver-working electrode. The introduced eluent (0.4 M NaOH and 7.5 mM oxalate solution)
provided good selectivity and column efficiency. The reported detection limit in this study
was 1.0µg/liter and 2.0 μg /liter for sulfide and cyanide ion respectively. (Giuriati et al,
2004.) Destanoğlu and Gümüş Yilmaz (2016) studied the determination of cyanide ion and
hexavalent chromium, Cr (VI) via IC and conductivity detectors. The chloramine-T in
alkaline pH and photo-oxidation followed by the addition of chloramine-T were applied to
convert CN- and metal-cyanide complexes to cyanate. They reported that this method can be
applied for the determination of CN- and Cr (VI) in the linear range of 0.6-961.5 and 0.9-
118.5 μmol/liter. The detection limit for the above-mentioned ions was 0.18 and 0.26
μmol/liter respectively. (Destanoğlu & Gümüş Yilmaz, 2016)
To sum up, ion chromatography is an accurate, reproducible and versatile method. The
detection limit in pure and real mining solutions is 0.001 mg/liter and 0.05-0.5 mg/liter
respectively. This technique can be applied for determining the metal- cyanide complexes
of chromium, iron (II) and (III), gold, copper, cobalt, silver, and nickel. However, the method
cannot determine the concentration of WAD in addition to total cyanide. (Mudder et al, 2001,
p.44; Young et al, 2008, pp.734-735)
4 REMOVAL OF CYANIDE FROM WATER AND WASTEWATER
Free cyanide and its related compounds can be found in various industrial effluents. In order
to make precautionary measures toward the health and environment, these effluents must be
treated before discharge. The most common cyanide treatment methods include natural
cyanide degradation, chemical treatment methods, biological cyanide degradation, and
electrolytic degradation, which are described in the followings. (Kuyucak & Akcil, 2013.)
4.1 Natural degradation
In the natural degradation process, the cyanide solutions are detained in tails for a long period
of time. The combination of natural, physical, biological, and chemical processes such as
volatilization, chemical precipitation, photodecomposition, and microbial oxidation results

36
in the cyanide degradation (see figure 15) (Logsdon et al. 1999, pp. 20). As it is shown in
this figure and according to the literature, parameters such as pH, the cyanide concentration
in the compounds, UV radiation, the presence of bacteria, and the conditions of the pond can
affect the natural degradation. However, the level of the cyanide in the treated water is not
acceptable for discharge to the environment and this method is typically used as an
intermediate step. It is worth to mention that water containing more than 0.01 ppm CN- is
rejected by the World Health Organization for domestic supply (Kuyucak & Akcil 2013,
Logsdon et al, 1999, p.20).
Figure 15. The processing flow of cyanide degradation in nature (Logsdon et al, 1999, p.20).
4.2 Chemical oxidation methods
The chemical oxidation methods include alkaline chlorination, SO2/ air process, iron/copper
precipitation process, the hydrogen peroxide oxidation process, iron sulphide and sulphide
precipitation, acidification process and cyanide recovery, and acidification-volatilization-
regeneration processes. Alkaline chlorination is a well-known process to remove cyanide in

37
gold mining effluents. In this two-step process, the reaction of chlorine with cyanide results
in the formation of CNCl. The hydrolysis of this compound in the next step yield cyanate
(reactions 18 and 19). (Botz, 2001, p.4)
𝐶𝑙2 + 𝐶𝑁− → 𝐶𝑁𝐶𝑙 + 𝐶𝑙− (18)
𝐶𝑁𝐶𝑙 + 𝐻2𝑂 → 𝑂𝐶𝑁− + 𝐶𝑙− + 2𝐻+ (19)
With the excess amount of chlorine, further hydrolysis of cyanate results in the formation of
ammonia, as it is shown in reaction 20 (Botz 2001, p.4).
𝑂𝐶𝑁− + 3𝐻2𝑂𝐶𝑙2𝑐𝑎𝑡𝑎𝑙𝑦𝑠𝑡→ 𝑁𝐻4
+ + 𝐻𝐶𝑂3− + 𝑂𝐻− (20)
The sufficient amount of the excess chlorine leads to the complete oxidation of ammonia
and formation of nitrogen gas according to reaction 21 (Botz, 2001, p.4).
3𝐶𝑙2 + 2𝑁𝐻4+ → 𝑁2 + 6𝐶𝑙
− + 6𝐻+ (21)
In addition to cyanide removal, alkaline chlorination can also oxidize thiocyanate as it is
shown in reaction 22 (Botz, 2001, p.4).
4𝐶𝑙− + 𝑆𝐶𝑁− + 5𝐻2𝑂 → 𝑆𝑂4−2 +𝑂𝐶𝑁− + 8𝐶𝑙− + 10𝐻+ (22)
The main advantage of alkaline chlorination over SO2/air and the H2O2 process is that this
method does not require copper as a catalyst. Moreover, the complexed metals with cyanide
are precipitated as metal-hydroxide compounds at the end of the cyanide oxidation process.
(Botz, 2001, p.5)
4.3 Electrocoagulation (EC) Method
Electrocoagulation method has received significant consideration in recent years due to its
capability of treating different types of waters and wastewaters. In this process, the
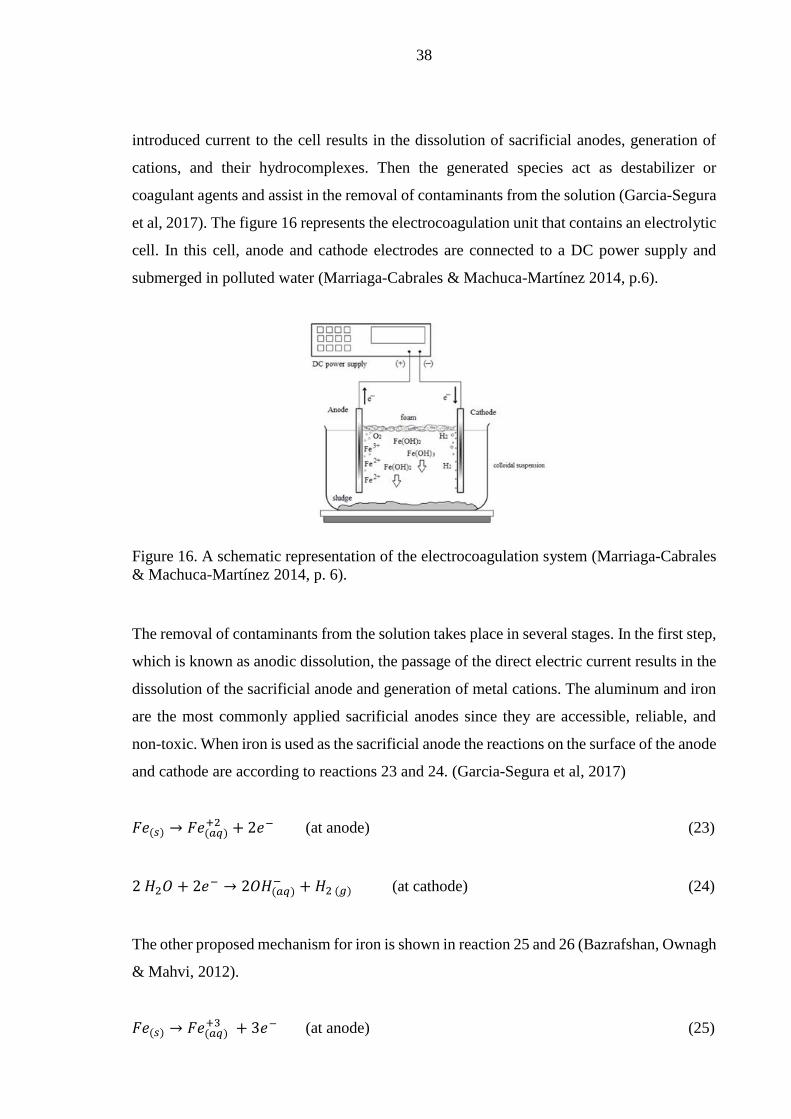
38
introduced current to the cell results in the dissolution of sacrificial anodes, generation of
cations, and their hydrocomplexes. Then the generated species act as destabilizer or
coagulant agents and assist in the removal of contaminants from the solution (Garcia-Segura
et al, 2017). The figure 16 represents the electrocoagulation unit that contains an electrolytic
cell. In this cell, anode and cathode electrodes are connected to a DC power supply and
submerged in polluted water (Marriaga-Cabrales & Machuca-Martínez 2014, p.6).
Figure 16. A schematic representation of the electrocoagulation system (Marriaga-Cabrales
& Machuca-Martínez 2014, p. 6).
The removal of contaminants from the solution takes place in several stages. In the first step,
which is known as anodic dissolution, the passage of the direct electric current results in the
dissolution of the sacrificial anode and generation of metal cations. The aluminum and iron
are the most commonly applied sacrificial anodes since they are accessible, reliable, and
non-toxic. When iron is used as the sacrificial anode the reactions on the surface of the anode
and cathode are according to reactions 23 and 24. (Garcia-Segura et al, 2017)
𝐹𝑒(𝑠) → 𝐹𝑒(𝑎𝑞)+2 + 2𝑒− (at anode) (23)
2 𝐻2𝑂 + 2𝑒− → 2𝑂𝐻(𝑎𝑞)
− + 𝐻2 (𝑔) (at cathode) (24)
The other proposed mechanism for iron is shown in reaction 25 and 26 (Bazrafshan, Ownagh
& Mahvi, 2012).
𝐹𝑒(𝑠) → 𝐹𝑒(𝑎𝑞)+3 + 3𝑒− (at anode) (25)

39
3𝐻2𝑂 + 3 𝑒− → 3 𝑂𝐻(𝑎𝑞)
− +3
2𝐻2 (𝑔) (at cathode) (26)
In case of using aluminum as the sacrificial anode, the following reactions take place
(Bazrafshan et al, 2012).
𝐴𝑙(𝑠) → 𝐴𝑙(𝑎𝑞)+3 + 3𝑒− (at anode) (27)
3𝐻2𝑂 + 3𝑒− → 3 𝑂𝐻(𝑎𝑞)
− +3
2𝐻2 (𝑔) (at cathode) (28)
In the subsequent step, the reaction of metallic cations and hydroxyl ions results in the
generation of coagulants. The formation of these hydroxylated species, which are ion-
complexes, is described in reactions 29 and 30. (Moussa et al, 2017.)
𝐹𝑒(𝑎𝑞)+2 + 2 𝑂𝐻(𝑎𝑞)
− → 𝐹𝑒 (𝑂𝐻)2 (𝑠) (29)
𝐹𝑒(𝑎𝑞)+3 + 2 𝑂𝐻(𝑎𝑞)
− → 𝐹𝑒(𝑂𝐻)3 (𝑠) (30)
And for aluminum, the formation of hydroxylated species takes place according to reaction
31 (Bazrafshan et al, 2012).
𝐴𝑙+3 + 3 𝑂𝐻− → 𝐴𝑙 (𝑂𝐻)3 (31)
The coagulants destabilize the contaminant, particulate suspensions, and break emulsions by
three mechanisms consisting of compression of the electrical double layer, charge
neutralization, and floc formation. In the compression of electrical double layer mechanism,
the oxidation of the sacrificial anode produces the reverse charge ions within the solution.
The counter charge ions penetrate the double layer and increase the ions concentration
around the colloidal particles. This reduces the thickness of the electrical double layer and
its repulsive forces. Hence, the colloidal particles gather around the electrode and form larger
particles. (Comninellis & Chen, 2010, pp.245-246; Marriaga-Cabrales & Machuca-
Martínez, 2014, p.9)

40
The other alternative mechanism is charge neutralization. In this mechanism, the counter
charged ions are adsorbed onto the surface of the colloidal particles, which results in the
neutralization of the surface charge. Later, the colloidal particles agglomerate each other and
coagulate. The last mechanism is the floc formation mechanism in which the coagulation
results in the formation of flocs, and these flocs generate a sludge blanket (Comninellis &
Chen, 2010, pp. 245-246). The leftover particles within the aqueous medium can be captured
or bridged through this sludge blanket (Marriaga-Cabrales & Machuca-Martínez, 2014, p.9).
In the last step of the electrocoagulation process, the cathodic reaction produces hydrogen
and in some cases oxygen bubbles. Next, these bubbles adhere to the coagulated species and
rise the pollutants via natural buoyancy to the surface of the solution.
Numerous parameters affect the efficiency of electrocoagulation and its ability to remove
contaminants from the solution. The most important ones from these parameters are
electrode arrangement, type of power supply, current density, supporting electrolyte, pH,
and electrode material. Regarding the electrode arrangement, the applied electrodes in the
electrocoagulation cell can be either monopolar or bipolar. The configuration of these
electrodes is depicted in figure 17. (Moussa et al, 2017)
Figure 17. Different arrangement of electrode connection (Garcia-Segura et al, 2017).
The configuration of the electrodes is not the only determining factor for the pollutant’s
removal. In other words, parameters such as the nature of pollutants, the matrix of water, the
current density, pH, and the electrode material can affect the elimination efficiency.
However, the monopolar electrodes in a parallel connection (MP-P) are the cost-effective

41
configuration. On the other hand, the bipolar electrodes in a series connection (BP-S) require
low maintenance and in some circumstances eases the pollutant removal. (Garcia-Segura et
al, 2017; Moussa et al, 2017)
DC power supply is the most commonly applied source to provide an electric field in the EC
cell. However, this power supply can lead to the formation of an impermeable oxide
substrate on the surface of the cathode. The passivation of the cathode with this layer declines
the ionic transfer and increases the resistance of the electrolytic cell. Hence, the dissolution
of the sacrificial anode and the formation of hydroxylated species might be hampered
directly or indirectly by the passivation. However, the addition of chloride ions can break
this layer and improve the species formation. On the other hand, the AC power supplies with
periodical energization can also guarantee a suitable electrode life by delaying the
consumption of the electrodes. (Eyvaz, 2016; Moussa et al, 2017)
Another variable in the EC process is the current density that can be controlled directly
through the process. This parameter ascertains several released metal ions during the anodic
dissolution. The implementation of high current density increases the anodic dissolution.
Furthermore, this parameter can also affect the dose of coagulants and the rate of hydrogen
bubble generation on the electrode surface. However, this parameter is not completely
independent, and factors such as pH, temperature, and water flow rate can influence the
choice of the optimum value for the current density. (Moussa et al, 2017)
The presence of supporting electrolyte in the solution can prevent the migration effects and
increase the conductivity of the solution. In addition, it reduces the ohmic drop and energy
consumption. As an example, in the presence of sulfate, when the sacrificial anode is
aluminum, the passivation of anode occurs. This occurrence is due to the high affinity of
sulfide to generate complexes with aluminum. As another example, the presence of nitrate
prevents the anodic dissolution of both iron and aluminum. In these cases, higher potential
for the anodic dissolution should be applied to compensate the negative effects of the
abovementioned problems. (Garcia-Segura et al, 2017)
Finally, pH and electrode material are the last two parameters, which are effective on the
removal efficiency. The pH of the solution affects its conductivity and anodic dissolution.

42
However, as the pH of the solution varies during the process, finding the clear connection
between pH and electrocoagulation efficiency is difficult (Moussa et al, 2017). The electrode
material determines the reactions occurring during the electrocoagulation. Aluminum and
iron are the preferred materials for the sacrificial anode since they are accessible, reliable
and non-toxic. The anodic dissolution of iron can result in the formation of Fe+2 or Fe+3. In
comparison to Fe+3, the lower positive charge of Fe+2 makes this ion a weaker coagulant.
Regarding aluminum, it increases the removal efficiency according to some recent studies.
Considering the characteristics of electrocoagulation, this method presents many advantages
over the conventional treatment methods (Vepsäläinen et al, 2012). The advantages and
disadvantages of this method are listed in table 11.
Table 11. Advantages and disadvantages of electrocoagulation process (Chaturvedi, 2013;
Garcia-Segura et al, 2017; Marriaga-Cabrales & Machuca-Martínez, 2014, pp. 9-10; Moussa
et al, 2017).
Advantages
More effective and faster separation of organic contaminants in comparison to the
traditional coagulation.
Easy to operate and automation.
Insensitivity to pH values (except for extreme values).
Low maintenance.
Less sludge production in comparison to traditional coagulation.
Stability, nontoxicity, and easily dewatering of the sludge.
No secondary pollution.
Ease of the pollutant collection from the surface of the solution.
Easier floc separation (flocs are larger, more stable, acid resistant in comparison to the
traditional method).
The treated water is clear, fragrance-free and colorless with less Total Dissolved Solids
(TDS).
Disadvantages
High rate of sacrificial anode consumption due to oxidation.
High electricity consumption (which makes this process less economical in
comparison to the traditional method).
Requirement of post-treatment due to the presence of Al and Fe.
Anode passivation and deposition of sludge on the electrodes limits the continuous
operation mode.
High levels of conductivity are required for the contaminated water.
Kobya et al. (2010) studied the removal of cyanide from two different electroplating rinse
water via the EC method. The pH, cadmium, and total concentration of cyanide in the
cadmium electroplating rinse water were 8.6, 102 mg/liter, and 120 mg/liter respectively.

43
Regarding the nickel electroplating rinse water, the pH, nickel, and the total concentration
of cyanide were 8, 175 mg/liter, and 261 mg/liter. They reported that EC process with the
current density of about 30 A/m2 and pH values of about 8-10 removed 99.4% and 99.9% of
Cd+2 and CN- in cadmium-cyanide solution. The current density of 60 A/m2 and pH values
of about 8-10 removed 99.1% and 99.8% of Ni+2 and CN- from nickel-cyanide solution.
(Kobya et al, 2010)
Moussavi et al. (2011) investigated the cyanide removal from synthetic cyanide-laden
wastewater with the EC process. Among the four different arrangement, the Fe-Al with the
higher removal efficiency of about 90% was selected for treating the sample with 300
mg/liter cyanide and pH values of about 11.5. They reported that the cyanide removal
increased from 43% to 91.8% after increasing the current density from 2 to 15 mA/cm2. The
cyanide removal at 15 mA/cm2 and after aerating the tank increased from 45% to 98%. They
succeeded to remove 100% cyanide in the continuous operation mode and at the hydraulic
retention time of 140 min. The dominant removal mechanisms in this study were adsorption
and complexation with iron hydroxides. (Moussavi et al, 2011)
Kobya et al. (2017) studied the removal of cyanide from alkaline cyanide solution in the
rinsing water of the electroplating industry. They reported that the pH value of about 9.5, the
current density of 60 A/m2 and operation time of 60 min in the EC cell can eliminate 99.9%
of cyanide and 99.9% of zinc ions in a solution with 7.5-34 gr/liter zinc cyanide. (Kobya et
al, 2017)

44
EXPERIMENTAL PART
Several cyanide analysis methods were described in detail in the literature part. In this
research, titration as a standard method and the most commonly applied technique in gold
extraction industry was selected for the determination of cyanide concentrations. The
objective of this study, the conducted experiments, and their results are discussed in this part.
5 THE OBJECTIVE
The main objective was to find out that what are the most important parameters in the
determination of cyanide using the titration method. Moreover, how these parameters affect
the accuracy of the results in the determination of free cyanide. The focus of the first and
second series of experiments was to find the most reliable indicator for CN- determination
in the sodium cyanide solutions. Next, in the third series of experiments, the CN-
concentration was determined in synthetic mine water samples. The aim of this series was
to propose a suitable analysis procedure for typical mining water samples. In this study, three
series of experiments were conducted and the summary of them is presented in table 12.
Table 12. The summary of the conducted experiments in this study.
Item The first series of
experiments
The second series of the
experiments
The third series of the
experiments
Solution Pure cyanide solution Pure cyanide solution Synthetic mine water
Solution
concentration
(ppm)
1, 5, 10, 50, 75, 100 1, 5, 10, 50, 75, 100 1, 10, 100
Titrant Silver nitrate Silver nitrate Silver nitrate
Titrant
concentrations
(mol/liter)
0.01, 0.002, 0.001 0.00125, 0.000125,
0.0000125 0.00125, 0.000125
Indicator
Potassium iodide in the
presence of ammonium
hydroxide
p-
dimethylaminobenzylidene
rhodanine
p-
dimethylaminobenzylidene
rhodanine
Sample
volumes (ml) 2, 5, 8 2, 5, 8 2, 5, 8
End-point Permanent turbidity Color change from yellow
to pale pink
Color change from yellow
to pale pink

45
6 MATERIALS AND METHODS
The applied chemicals, the required equipment, the preparation of titrant solutions, samples,
indicators, and the formula for calculating cyanide concentration in each series of
experiments are described in the following subsections.
6.1 Chemicals
A list of applied chemicals, their purities and manufacturers are presented in table 13.
Table 13. The chemicals used in this study.
Item
No. Chemical Specification Manufacturer
1 Acetone (CH3COCH3) Molar mass: 58.08gr/mol,
density: 0.79 gr/cm3 (20C) Merck KGaA
2 Ammonium chloride
(NH4Cl)
Molar mass: 53.49 gr/liter, density: 1.53 gr/cm3
(25C), solubility: 372 gr/liter
Mallinckrodt
Baker B.V
3 Ammonium hydroxide
25%(NH4OH) Density: 0.903 gr/cm3(20C) Merck KGaA
4
p-
dimethylaminobenzylidene
rhodanine (C12H12N2OS2)
Molar mass: 264.37 gr/mol, bulk density: 225
kg/m3 Merck KGaA
5 Potassium iodide (KI)
Molar mass:
166.00 gr/mol,
density: 3.23 gr/cm3 (25 C)
Kebo Lab Ab
6 Silver nitrate solution
(AgNO3)
1 ampoule: for 1000 ml, c (AgNO3): 0.1
mol/liter, density: 1.27 gr/cm3 (20C) Merck KGaA
7 Sodium chloride (NaCl) Molar mass: 58.44 gr/liter, density: 2.17 gr/cm3
(20 C), solubility: 358 gr/liter VWR
8 Sodium cyanide (NaCN) Molar mass: 49.01 gr/mol, density: 1.6 gr/cm3
(20C), solubility: 370gr/liter Merck KGaA
9 Sodium hydroxide
(NaOH)
Molar mass: 40.00 gr/mol, density: 2.13 gr/cm3
(20C), solubility: 1090 gr/liter Merck KGaA
10 Sodium nitrate (NaNO3) Molar mass: 84.99 gr/mol, density: 2.26 gr/cm3
(20 C), solubility: 874 gr/liter Merck KGaA
11 Sodium sulfate (Na2SO4) Molar mass: 142.04 gr/mol, density: 2.70 gr/cm3
(20C), solubility: 200 gr/liter Merck KGaA

46
6.2 Equipment
A list of required equipment for the experiments and their specifications is presented in table
14.
Table 14. The required equipment in this study.
Item
No. Equipment Specification
1 Burette Volume= 10 ml Accuracy= ±0.02 ml
2 laboratory Clamp
Stand
3 Erlenmeyer flask Volume= 100 ml
4 Magnetic stirrer Magnetic Stirrer VARIOMAG COMPACT
5 Magnetic stir bar
6 Volumetric flask
Flask No.1: 100 ml Accuracy= ±0.10 ml
Flask No.2: 500 ml Accuracy= ±0.25 ml
Flask No.3: 1000 ml Accuracy= ±0.40 ml
7 Glass funnel
8 Glass rod
6.3 Preparation of the samples
For the first series of experiments, six different samples with the concentrations of 100, 75,
50, 10, 5, and 1 ppm CN- were prepared from 1000 ppm CN- solution. To keep the pH level
of the sample higher than 10.5, 1 ml of 10 M NaOH was added to each sample.
6.4 First series of the experiments
6.4.1 Preparation of the titrant
The stock solution of AgNO3 (0.1 M) was prepared as follow:
1. Filling half of the 1000 ml volumetric flask with deionized water.
2. Dissolving an ampoule of AgNO3 (manufactured by Merck) into the flask and
shaking gently to mix the solution.
3. Filling the volumetric flask to its mark with deionized water.
The storage time for this solution was one month. In other words, the solution was prepared
and used as a fresh one each month. This stock solution was used for the preparation of
titrants with the concentrations of 0.010, 0.002, and 0.001 M AgNO3.

47
6.4.2 Preparation of the indicators
There were two types of indicators in the first series of experiments. The first indicator was
a 10% KI solution which was prepared as follows:
1. Adding of about 75 ml of deionized water into a 250 ml capacity beaker.
2. The gradual adding of 10 gr KI into the beaker through its sidewalls, while mixing it
gently with a glass rod.
3. Transferring the prepared solution into a 100 ml volumetric flask, by using a glass
funnel.
4. Rinsing the beaker and the funnel with a small amount of deionized water.
5. Filling of the volumetric flask to its mark with deionized water, and then shaking it
gently to mix the solution.
6. Storing the prepared solution in a suitable container (the resultant solution is a 10%
w/v solution).
The second indicator was a 10% NH4OH which was prepared as follows:
1- Filling half of a 100 ml volumetric flask with deionized water.
2- Adding of about 40 ml of 25% NH4OH solution to the flask by means of a measuring
cylinder; then, shaking it gently to have a uniform solution.
3- Filling of the volumetric flask to its mark with deionized water.
6.4.3 The procedure of the experiment
The determination of free cyanide with AgNO3 as the titrant and KI, in the presence of
NH4OH, as the indicator was carried out according to the procedure from Kem Kyoto
Electronics. This procedure consists of three steps:
1. Pipetting 2 ml of sample into a 100 ml Erlenmeyer flask.
2. Pipetting 2 ml of 10% KI.
3. Adding 3 ml of 10% NH4OH by means of a measuring cylinder.
After rinsing the flask′s wall with deionized water and filling the burette with AgNO3, the
sample was titrated until its permanent turbidity which was easy to observe. To have a better
observation, the flask was placed on a black sheet during the titration. The analysis of each
sample was repeated five times and the same procedure was also carried out with 5 ml and

48
8 ml samples. The end-point of the procedure is shown in figure 18. (Kem Kyoto Electronics,
2018.)
Figure 18. The end-point of the titration with AgNO3 as titrant and KI in the presence of
NH4OH as the indicator.
6.4.4 Formulas
The free cyanide concentrations were calculated using the following formula from a catalog
known as free cyanide in silver plating solution, precipitation titration by automatic
potentiometric titrator from KEM Kyoto Electronics (KEM Kyoto Electronics, 2018).
𝐶𝑜𝑛𝑐𝑒𝑛𝑡𝑟𝑎𝑡𝑖𝑜𝑛 𝑜𝑓 𝑓𝑟𝑒𝑒 𝑐𝑦𝑎𝑛𝑖𝑑𝑒 (𝑝𝑝𝑚) = (𝐸𝑃1 − 𝐵𝐿1) × 𝑇𝐹 × 𝐶1 × 𝐾1/𝑆𝐼𝑍𝐸 (32)
where EP1 is the titration volume in ml, BL1 is the blank level at 0.0 ml, TF is the
dimensionless coefficient known as the factor of reagent, K1 is the constant conversion
coefficient to convert gr/liter to ppm and is 1000, SIZE is the sample volume in ml; and,
finally, C1 is the concentration conversion coefficient which can be calculated from
equations 33 to 35:
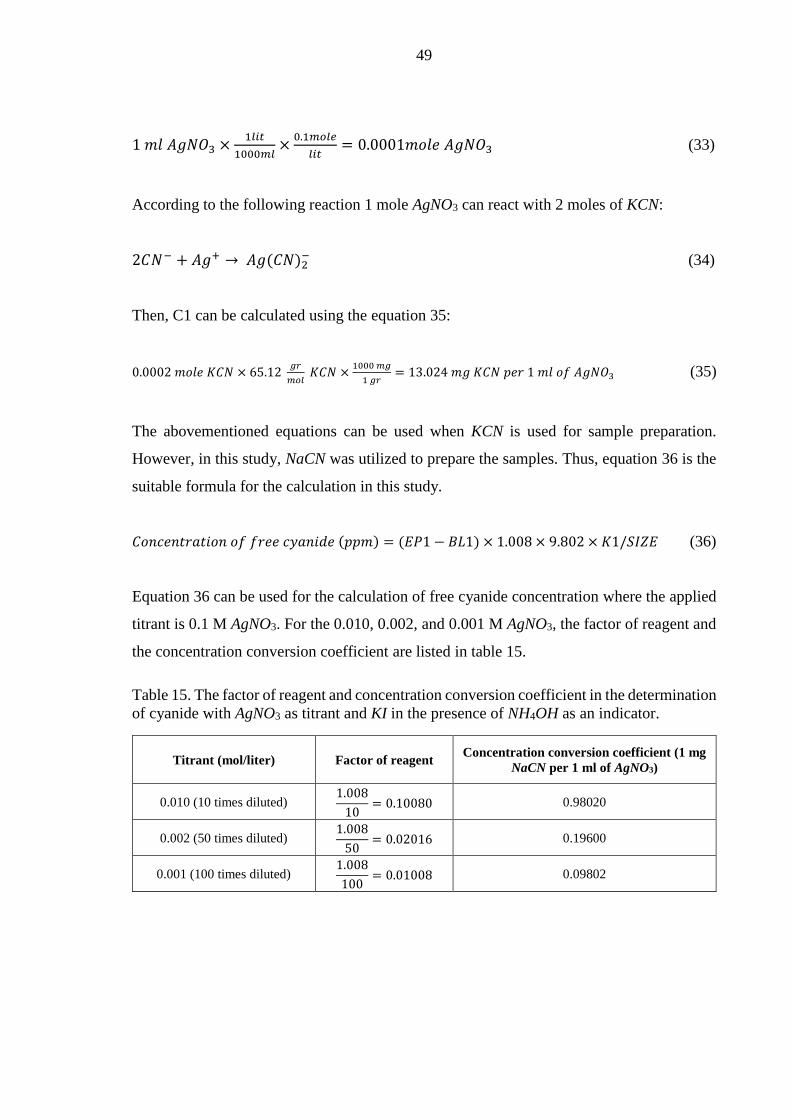
49
1 𝑚𝑙 𝐴𝑔𝑁𝑂3 ×1𝑙𝑖𝑡
1000𝑚𝑙×0.1𝑚𝑜𝑙𝑒
𝑙𝑖𝑡= 0.0001𝑚𝑜𝑙𝑒 𝐴𝑔𝑁𝑂3 (33)
According to the following reaction 1 mole AgNO3 can react with 2 moles of KCN:
2𝐶𝑁− + 𝐴𝑔+ → 𝐴𝑔(𝐶𝑁)2− (34)
Then, C1 can be calculated using the equation 35:
0.0002 𝑚𝑜𝑙𝑒 𝐾𝐶𝑁 × 65.12 𝑔𝑟
𝑚𝑜𝑙 𝐾𝐶𝑁 ×
1000 𝑚𝑔
1 𝑔𝑟= 13.024 𝑚𝑔 𝐾𝐶𝑁 𝑝𝑒𝑟 1 𝑚𝑙 𝑜𝑓 𝐴𝑔𝑁𝑂3 (35)
The abovementioned equations can be used when KCN is used for sample preparation.
However, in this study, NaCN was utilized to prepare the samples. Thus, equation 36 is the
suitable formula for the calculation in this study.
𝐶𝑜𝑛𝑐𝑒𝑛𝑡𝑟𝑎𝑡𝑖𝑜𝑛 𝑜𝑓 𝑓𝑟𝑒𝑒 𝑐𝑦𝑎𝑛𝑖𝑑𝑒 (𝑝𝑝𝑚) = (𝐸𝑃1 − 𝐵𝐿1) × 1.008 × 9.802 × 𝐾1/𝑆𝐼𝑍𝐸 (36)
Equation 36 can be used for the calculation of free cyanide concentration where the applied
titrant is 0.1 M AgNO3. For the 0.010, 0.002, and 0.001 M AgNO3, the factor of reagent and
the concentration conversion coefficient are listed in table 15.
Table 15. The factor of reagent and concentration conversion coefficient in the determination
of cyanide with AgNO3 as titrant and KI in the presence of NH4OH as an indicator.
Titrant (mol/liter) Factor of reagent Concentration conversion coefficient (1 mg
NaCN per 1 ml of AgNO3)
0.010 (10 times diluted) 1.008
10= 0.10080 0.98020
0.002 (50 times diluted) 1.008
50= 0.02016 0.19600
0.001 (100 times diluted) 1.008
100= 0.01008 0.09802

50
6.5 Second series of the experiments
6.5.1 Preparation of the titrant
In the second series of experiments, 0.1 M solution of AgNO3 was prepared in the same
manner as introduced in section 6.4.1. The analysis of the samples in this series was
performed with three different concentrations of the AgNO3, which were 0.0012500,
0.0001250, and 0.0000125 M.
6.5.2 Preparation of the indicator
The applied indicator in this part was p-dimethylaminobenzylidene rhodanine which was
prepared as follows:
1. Adding of about 0.03 gr of the p-dimethylaminobenzylidene rhodanine powder.
2. Dissolving the powder in 100 ml acetone.
3. Storing the solution in a dark bottle.
6.5.3 The procedure of the experiment
The determination of free cyanide with AgNO3 as the titrant and rhodanine as the indicator
was firstly studied by Ryan and Culshaw (1944). Here, the utilized modified method is as
following:
1. Pipetting 2 ml of the sample liquid into a 100 ml Erlenmeyer flask.
2. Adding 4 drops of rhodanine.
After rinsing the flask wall with deionized water and filling the burette with AgNO3, the
sample was titrated until its color changed from yellow to pale pink. The analysis of each
sample was repeated five times and the same process was carried out on the samples with
volumes of 5 ml and 8 ml. The end-point of the titration process is shown in figure 19. These
samples were prepared in the same manner as the procedure introduced in section 6.3.

51
Figure 19. The end-point of the titration with AgNO3 as the titrant and rhodanine as the
indicator.
6.5.4 Formulas
The concentration of free cyanide in the solution was calculated in the second series of
experiments using equations 37 and 38 from Geological Survey of Finland (GTK) (2009,
pp. 1-2).
𝑁𝑎𝐶𝑁 (𝑝𝑝𝑚) =𝑉𝐴𝑔𝑁𝑂3
𝑉𝑠𝑎𝑚𝑝𝑙𝑒× 𝑓𝑎𝑐𝑡𝑜𝑟 𝑜𝑓 𝑟𝑒𝑎𝑔𝑒𝑛𝑡 × 10000 (37)
𝐶𝑁−(𝑝𝑝𝑚) = 𝑁𝑎𝐶𝑁(𝑝𝑝𝑚) ×26.09
𝑔𝑟
𝑚𝑜𝑙𝑁𝑎𝐶𝑁
49.01 𝑔𝑟
𝑚𝑜𝑙𝐶𝑁−
(38)
Where VAgNO3 and Vsample are the volumes of the titrant and the sample in ml. Adding 25 ml
of 0.1 M AgNO3 to 200 ml deionized water gave 0.0125 M AgNO3. For this case, the factor
was 0.12255. Regarding 10, 100, and 1000 times diluter titrant with the concentration of
0.0012500, 0.0001250, and 0.0000125 M AgNO3, the factor of reagent is divided by 10, 100,
and 10000. In this case for the abovementioned AgNO3 solutions, the factor of reagent is
0.01225500, 0.00122550, and 0.00012255 respectively.

52
6.6 Third series of the experiments
The third series of experiments was conducted to determine the free cyanide concentrations
in synthetic mine water. For this purpose, based on the discussion in section 7.1.2 and 7.2.2,
rhodanine as the most reliable indicator was selected. The most suitable titrant
concentrations for the determination of specific cyanide concentrations were selected based
on the second series of experiments that are summarized in table 31. In this series, the titrant
and the indicator were prepared in the same way as explained in sections 6.5.1 and 6.5.2.
After the preparation of the titrant and indicator, the stock solution of synthetic mine water
containing 10000 ppm sulfate (SO4-2), 100 ppm nitrate (NO3
-), 150 ppm ammonium (NH4+),
and 1000 ppm chloride Cl- was prepared as followings:
1. Filling half of the 1 liter volumetric flask with deionized water.
2. Dissolving of about 14.787 gr sodium sulfate (Na2SO4), 0.137 gr sodium nitrate
(NaNO3), 0.445 gr ammonium chloride (NH4Cl) and 1.162 gr sodium chloride
(NaCl).
3. Filling of the volumetric flask to mark with deionized water.
Finally, three samples were prepared as follows:
1. Adding 10 ml of synthetic mine water (stock solution) to the 100 ml volumetric flask.
2. Adding the required volume of 1000 ppm CN- (0.1 ml, 1 ml, and 10 ml to have 1
ppm, 10 ppm, and 100 ppm cyanide solutions).
3. Adding 1 ml of 10 M NaOH to keep the pH to values above 10.5.
4. Filling of the volumetric flask to mark with deionized water.
Three samples with the concentration of 1, 10, 100 ppm free cyanide were prepared. Each
sample included 1000 ppm SO4-2, 10 ppm NO3
-, 15 ppm NH4+, and 100 ppm Cl-.
7 RESULTS AND DISCUSSIONS
In all series of the experiments, the free cyanide concentration was determined in 2 ml, 5 ml,
and 8 ml sample volume; in addition, each sample was titrated 5 times. In order to find the
optimum titrant concentration for the analysis of specific cyanide concentration, some

53
samples were titrated with two or three different concentrations of AgNO3. The results of
each series of the experiments are presented and discussed in the following sections
subsequently.
For each experiment, the calculated concentrations and errors are presented by using a box
plot. A box plot is a graphical method of displaying variation in a set of data. This plot is a
suitable way of visually presenting the data distribution via their quartiles. The lines
extending parallel from the boxes are known as the “whiskers”, which are used to indicate
variability outside the upper and lower quartiles (see figure 20). The main advantage of this
graph is taking up less space, which is convenient for comparing the distributions between
many datasets. The types of explanations from observing a box plot are:
1. What the key values are, such as the average, median 25th percentile etc.
2. If there are any outliers and what their values are.
3. Is the data symmetrical?
4. How tightly is the data grouped?
5. If the data is skewed and if so, in what direction.
Figure 20. The anatomy of a box plot (Ribecca, 2015).

54
7.1 Results and discussion of the first series of experiments
In the first series of experiments, the cyanide concentration was determined in 6 samples
containing 100, 75, 50, 10, 5, 1 ppm free cyanide. The analysis of 100 ppm cyanide solution
was conducted using 0.010 AgNO3. The box plot from the achieved data for this sample is
presented in figure 21. In addition, table 16 is presented to show the average concentrations,
standard deviations, and errors resulting from titration.
Figure 21. Results from the titration of 100 ppm cyanide solution with 0.010 M AgNO3 as
titrant and KI in the presence of NH4OH as the indicator: (A) CN- concentrations, and (B)
errors. Black lines show the maximum and minimum data, blue box shows upper and lower
quartile, and red line the median value.
Table 16. The average concentrations, standard deviations, average errors, and % errors in
the titration of the 100 ppm cyanide solution with 0.010 M AgNO3 as titrant and KI in the
presence of NH4OH as the indicator.
Sample volume
(ml)
Average of the obtained
concentrations
(ppm)
Standard
deviation
(ppm)
Average error
(ppm)
Average error
(%)
2 76.07 14.19 -23.92 -23.92
5 58.25 3.60 -41.74 -41.74
8 40.80 5.59 -59.19 -59.19
As can be seen in figure 21, the standard deviation of the obtained concentrations in the
titration of 5 ml cyanide solution is very low (3.60 ppm). Also, in the analysis of 8 ml
solution the low deviation can be observed (5.59 ppm). However, the average of the obtained
concentrations which were 58.25 ppm and 40.80 ppm was lower than the expected
(A) (B)

55
concentration of 100 ppm. Although in the analysis of 2 ml sample volume, the error was
lower, the average of the obtained concentrations is still lower than 100 ppm. Based on this
it can be clearly seen that KI in the presence of NH4OH as the indicator and 0.010 M AgNO3
cannot determine 100 ppm free cyanide in this sodium cyanide solution.
The analysis of 75 ppm cyanide solution was conducted using the same AgNO3
concentration. The achieved data for this sample is presented in figure 22 and table 17.
Figure 22. Results from the titration of 75 ppm cyanide solution with 0.010 M AgNO3 as
titrant and KI in the presence of NH4OH as the indicator: (A) CN- concentrations, and (B)
errors. Black lines show the maximum and minimum data, blue box shows upper and lower
quartile, and red line the median value.
Table 17. The average concentrations, standard deviations, average errors, and % errors in
the titration of the 75 ppm cyanide solution with 0.010 M AgNO3 as titrant and KI in the
presence of NH4OH as the indicator.
Sample volume
(ml)
Average of the obtained
concentrations
(ppm)
Standard
deviation
(ppm)
Average error
(ppm)
Average error
(%)
2 75.09 16.45 0.09 0.12
5 50.19 4.21 -24.80 -33.07
8 39.81 5.93 -35.18 -46.90
As can be seen in table 17, the standard deviation in the obtained data in the analysis of 5 ml
and 8 ml sample volume was low (4.21 ppm and 5.93 ppm). However, the average of the
obtained concentrations (50.19 ppm and 39.81 ppm) was lower than the expected
(A) (B)

56
concentrations of 75 ppm. But KI in the presence of NH4OH as the indicator, the 0.010 M
AgNO3, and the sample volume of 2 ml could successfully determine 75 ppm free cyanide
in this sample.
The obtained results in the titration of 50 ppm cyanide solution are presented in figure 23
and table 18. The free cyanide concentration in this sample was determined using 0.010 M
AgNO3.
Figure 23. Results from the titration of 50 ppm cyanide solution with 0.010 M AgNO3 as
titrant and KI in the presence of NH4OH as the indicator: (A) CN- concentrations, and (B)
errors. Black lines show the maximum and minimum data, blue box shows upper and lower
quartile, and red line the median value.
Table 18. The average concentrations, standard deviations, average errors, and % errors in
the titration of the 50 ppm cyanide solution with 0.010 M AgNO3 as titrant and KI in the
presence of NH4OH as the indicator.
Sample volume
(ml)
Average of the obtained
concentrations
(ppm)
Standard
deviation
(ppm)
Average error
(ppm)
Average error
(%)
2 61.25 5.41 11.25 -22.51
5 49.24 10.25 -0.75 -1.51
8 41.74 2.61 -8.25 -16.51
As can be seen in table 18, the average of the obtained concentrations in the analysis of 2 ml
sample volume which is 61.25 ppm was higher than the expected concentration. On the other
hand, in the analysis of 8 ml sample volume, the average concentration of about 41.74 ppm
was lower than 50 ppm. Therefore, the applied indicator, the 0.010 M AgNO3, and 5 ml
(A) (B)

57
sample volume with the lowest error of about -0.75 ppm was the best option for the
determination of 50 ppm free cyanide in this solution.
For the sample with 10 ppm cyanide concentration, three different titrants consisting of
0.002, 0.001, and 0.010 M AgNO3 were evaluated to find the best titrant for the analysis.
Based on table 19 and table I-1 in appendix I, 0.002 M AgNO3 with the lowest error which
varies from - 4.90 ppm to -6.49 ppm was the best option regarding this experiment. Thus,
further analyses were carried out using this titrant. The results of 10 ppm CN- sample using
0.002 M solution are shown in figure 24. In addition, table 19 presents average
concentrations, standard deviations, average errors, and % errors from the analysis with
0.002 M AgNO3.The results of the other two applied AgNO3 solution are presented in table
I-1 appendix I.
Figure 24. Results from the titration of 10 ppm cyanide solution with 0.002 M AgNO3 as
titrant and KI in the presence of NH4OH as the indicator: (A) CN- concentrations, and (B)
errors. Black lines show the maximum and minimum data, blue box shows upper and lower
quartile, and red line the median value.
(A) (B)
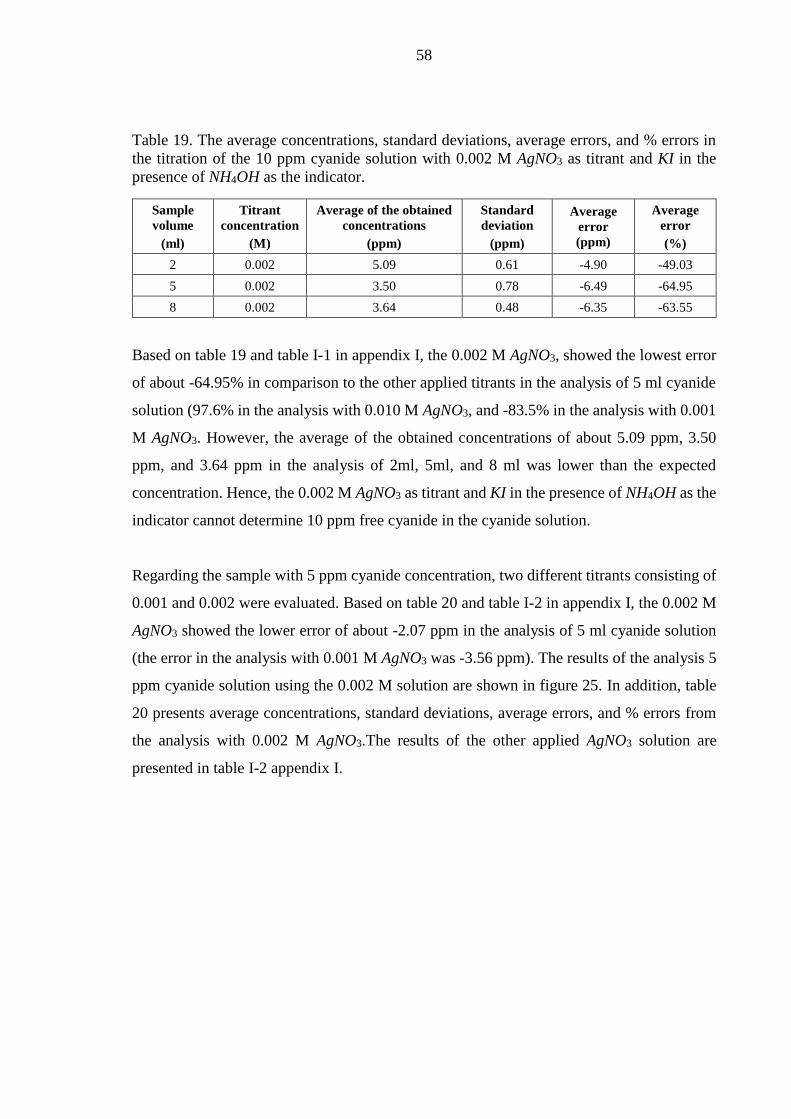
58
Table 19. The average concentrations, standard deviations, average errors, and % errors in
the titration of the 10 ppm cyanide solution with 0.002 M AgNO3 as titrant and KI in the
presence of NH4OH as the indicator.
Sample
volume
(ml)
Titrant
concentration
(M)
Average of the obtained
concentrations
(ppm)
Standard
deviation
(ppm)
Average
error
(ppm)
Average
error
(%)
2 0.002 5.09 0.61 -4.90 -49.03
5 0.002 3.50 0.78 -6.49 -64.95
8 0.002 3.64 0.48 -6.35 -63.55
Based on table 19 and table I-1 in appendix I, the 0.002 M AgNO3, showed the lowest error
of about -64.95% in comparison to the other applied titrants in the analysis of 5 ml cyanide
solution (97.6% in the analysis with 0.010 M AgNO3, and -83.5% in the analysis with 0.001
M AgNO3. However, the average of the obtained concentrations of about 5.09 ppm, 3.50
ppm, and 3.64 ppm in the analysis of 2ml, 5ml, and 8 ml was lower than the expected
concentration. Hence, the 0.002 M AgNO3 as titrant and KI in the presence of NH4OH as the
indicator cannot determine 10 ppm free cyanide in the cyanide solution.
Regarding the sample with 5 ppm cyanide concentration, two different titrants consisting of
0.001 and 0.002 were evaluated. Based on table 20 and table I-2 in appendix I, the 0.002 M
AgNO3 showed the lower error of about -2.07 ppm in the analysis of 5 ml cyanide solution
(the error in the analysis with 0.001 M AgNO3 was -3.56 ppm). The results of the analysis 5
ppm cyanide solution using the 0.002 M solution are shown in figure 25. In addition, table
20 presents average concentrations, standard deviations, average errors, and % errors from
the analysis with 0.002 M AgNO3.The results of the other applied AgNO3 solution are
presented in table I-2 appendix I.
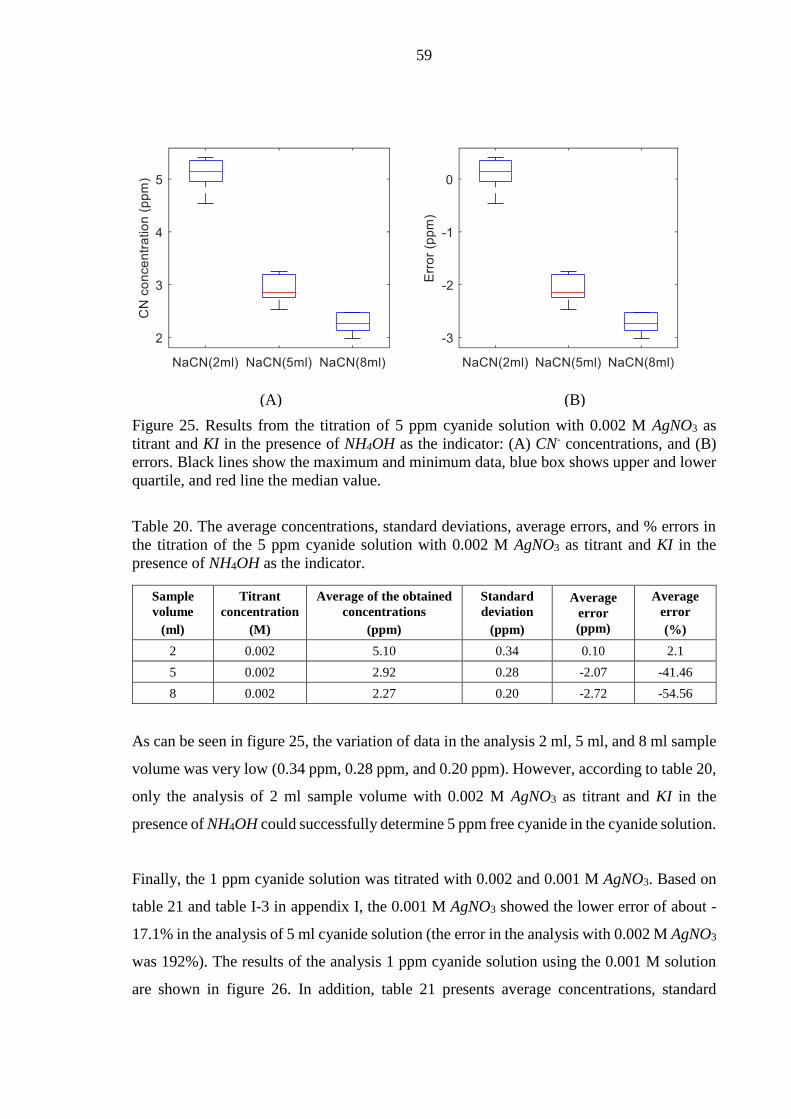
59
Figure 25. Results from the titration of 5 ppm cyanide solution with 0.002 M AgNO3 as
titrant and KI in the presence of NH4OH as the indicator: (A) CN- concentrations, and (B)
errors. Black lines show the maximum and minimum data, blue box shows upper and lower
quartile, and red line the median value.
Table 20. The average concentrations, standard deviations, average errors, and % errors in
the titration of the 5 ppm cyanide solution with 0.002 M AgNO3 as titrant and KI in the
presence of NH4OH as the indicator.
Sample
volume
(ml)
Titrant
concentration
(M)
Average of the obtained
concentrations
(ppm)
Standard
deviation
(ppm)
Average
error
(ppm)
Average
error
(%)
2 0.002 5.10 0.34 0.10 2.1
5 0.002 2.92 0.28 -2.07 -41.46
8 0.002 2.27 0.20 -2.72 -54.56
As can be seen in figure 25, the variation of data in the analysis 2 ml, 5 ml, and 8 ml sample
volume was very low (0.34 ppm, 0.28 ppm, and 0.20 ppm). However, according to table 20,
only the analysis of 2 ml sample volume with 0.002 M AgNO3 as titrant and KI in the
presence of NH4OH could successfully determine 5 ppm free cyanide in the cyanide solution.
Finally, the 1 ppm cyanide solution was titrated with 0.002 and 0.001 M AgNO3. Based on
table 21 and table I-3 in appendix I, the 0.001 M AgNO3 showed the lower error of about -
17.1% in the analysis of 5 ml cyanide solution (the error in the analysis with 0.002 M AgNO3
was 192%). The results of the analysis 1 ppm cyanide solution using the 0.001 M solution
are shown in figure 26. In addition, table 21 presents average concentrations, standard
(A) (B)

60
deviations, average errors, and % errors from the analysis of this sample. The results of the
other applied AgNO3 solution are presented in table I-3 appendix I.
Figure 26. Results from the titration of 1 ppm cyanide solution with 0.001 M AgNO3 as
titrant and KI in the presence of NH4OH as the indicator: (A) CN- concentrations, and (B)
errors. Black lines show the maximum and minimum data, blue box shows upper and lower
quartile, and red line the median value.
Table 21. The average concentrations, standard deviations, average errors, and % errors in
the titration of the 1 ppm cyanide solution with different titrants with 0.001 M AgNO3 as
titrant and KI in the presence of NH4OH as the indicator.
Sample
volume
(ml)
Titrant
concentration
(M)
Average of the obtained
concentrations
(ppm)
Standard
deviation
(ppm)
Average
error
(ppm)
Average
error
(%)
2 0.001 1.18 0.13 0.18 18.5
5 0.001 0.82 0.03 -0.17 -17.1
8 0.001 0.66 0.09 -0.33 -33.6
As can be seen in figure 26, the standard deviation of data in the analysis of 5 ml sample
volume was very low in comparison to the other sample volumes (0.03 ppm). However,
according to table 21, this titrant could determine approximately 1 ppm free cyanide in the
analysis of 2 ml sodium cyanide solution.
7.1.1 The optimum concentrations of titrant
In the analysis of 2 ml sample volume, the magnetic stir bar due to the low sample volume
did not rotate properly. On the other hand, in the analysis of 8 ml sample volume, the visual
(A) (B)
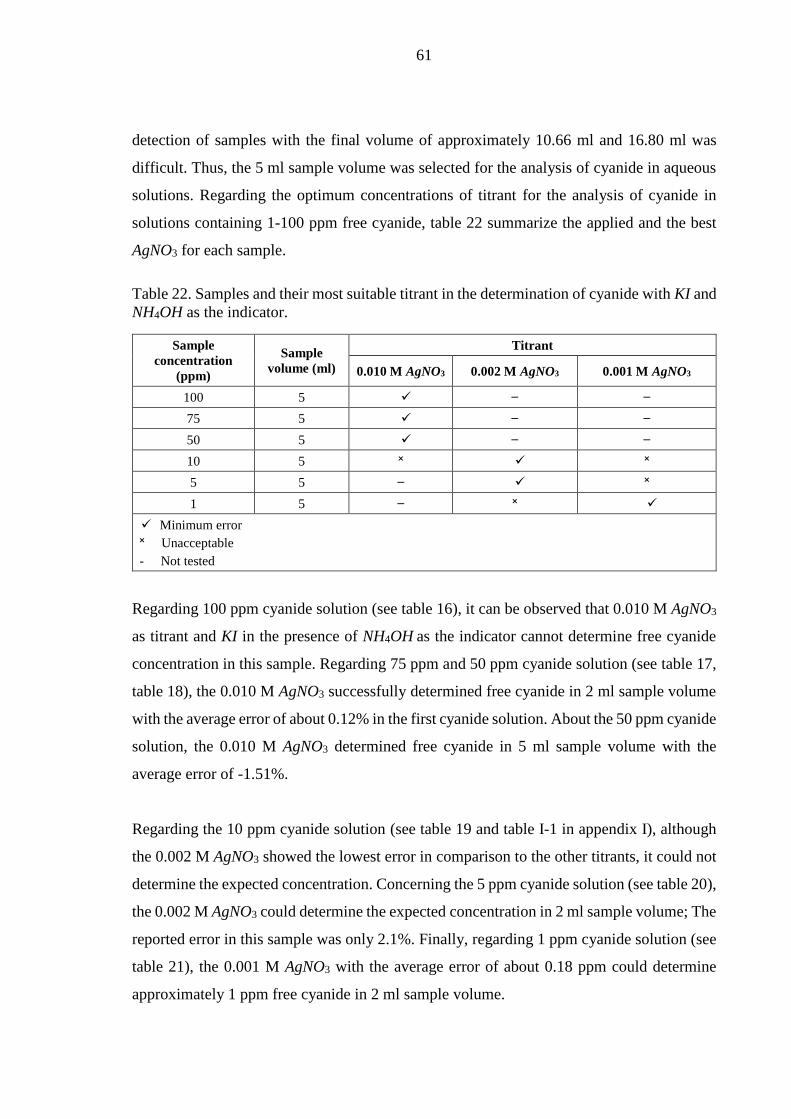
61
detection of samples with the final volume of approximately 10.66 ml and 16.80 ml was
difficult. Thus, the 5 ml sample volume was selected for the analysis of cyanide in aqueous
solutions. Regarding the optimum concentrations of titrant for the analysis of cyanide in
solutions containing 1-100 ppm free cyanide, table 22 summarize the applied and the best
AgNO3 for each sample.
Table 22. Samples and their most suitable titrant in the determination of cyanide with KI and
NH4OH as the indicator.
Sample
concentration
(ppm)
Sample
volume (ml)
Titrant
0.010 M AgNO3 0.002 M AgNO3 0.001 M AgNO3
100 5 ✓
75 5 ✓
50 5 ✓
10 5 ˟ ✓ ˟
5 5 ✓ ˟
1 5 ˟ ✓
✓ Minimum error
˟ Unacceptable
- Not tested
Regarding 100 ppm cyanide solution (see table 16), it can be observed that 0.010 M AgNO3
as titrant and KI in the presence of NH4OH as the indicator cannot determine free cyanide
concentration in this sample. Regarding 75 ppm and 50 ppm cyanide solution (see table 17,
table 18), the 0.010 M AgNO3 successfully determined free cyanide in 2 ml sample volume
with the average error of about 0.12% in the first cyanide solution. About the 50 ppm cyanide
solution, the 0.010 M AgNO3 determined free cyanide in 5 ml sample volume with the
average error of -1.51%.
Regarding the 10 ppm cyanide solution (see table 19 and table I-1 in appendix I), although
the 0.002 M AgNO3 showed the lowest error in comparison to the other titrants, it could not
determine the expected concentration. Concerning the 5 ppm cyanide solution (see table 20),
the 0.002 M AgNO3 could determine the expected concentration in 2 ml sample volume; The
reported error in this sample was only 2.1%. Finally, regarding 1 ppm cyanide solution (see
table 21), the 0.001 M AgNO3 with the average error of about 0.18 ppm could determine
approximately 1 ppm free cyanide in 2 ml sample volume.

62
As can be seen in table 16 to table 21, by increasing the sample volume the standard deviation
decreased. Although in table 18 to table 19, first the standard deviation was increased, in the
analysis 8 ml sample volume, the deviation decreased again. This can be explained in this
way that at higher sample volume the accuracy of the obtained data was better, and this could
be due to the easiness in the detection of turbidity at 8 ml sample volume.
7.1.2 The reliability of the indicator
Considering the best sample size and titrant concentration, results showed that KI in the
presence of NH4OH is not a reliable indicator to determine CN- in the sodium cyanide
solution. Hence, this method can clearly be rejected for the analysis of cyanide in aqueous
solutions. Finally, the applied AgNO3 concentrations, standard deviations, average error, and
the % error in the analyzed samples are presented in table 23.
Table 23. The numerical results achieved from the titration of 5 ml cyanide solutions with
AgNO3 as titrant and KI in the presence of NH4OH as the indicator.
Sample
concentration(ppm)
Titrant
concentration
(mol/liter)
AgNO3
Standard
deviation
(ppm)
Average error
(ppm)
Average error
(%)
100 0.010 3.60 -41.74 -41.74
75 0.010 4.21 -24.80 -33.07
50 0.010 10.25 -0.75 -1.51
10 0.002 0.78 -6.49 -64.95
5 0.002 0.28 -2.07 -41.46
1 0.001 0.03 -0.17 -17.10
7.2 Results and discussion of the second series of experiments
In the second series of experiments, the cyanide concentration was determined in 6 samples
containing 100, 75, 50, 10, 5, 1 ppm free cyanide. The determination of cyanide was
conducted using AgNO3 as titrant and rhodanine as the indicator. The analysis of 100 ppm
cyanide solution was conducted using 0.0012500 M AgNO3. The box plot from the achieved
data for this sample is presented in figure 27. In addition, table 24 is presented to show the
average values, standard deviations, and errors during titration.

63
Figure 27. Results from the titration of 100 ppm cyanide solution with 0.0012500 M AgNO3
and rhodanine as the indicator: (A) CN- concentrations, and (B) errors. Black lines show the
maximum and minimum data, blue box shows upper and lower quartile, and red line the
median value.
Table 24. The average concentrations, standard deviations, average errors, and % errors in
the titration of the 100 ppm cyanide solution with 0.0012500 M AgNO3 as titrant and
rhodanine as the indicator.
Sample volume
(ml)
Average of the obtained
concentrations
(ppm)
Standard
deviation
(ppm)
Average error
(ppm)
Average error
(%)
2 101.75 0.74 1.75 1.75
5 100.09 0.83 0.09 0.09
8 99.22 2.78 -0.77 -0.77
As can be seen in figure 27, the standard deviation in the analysis of 2 ml and 5 ml sample
volume was low (0.74 ppm and 0.83 ppm). Among these two tests, the 0.0012500 M AgNO3
as titrant and rhodanine as the indicator could successfully determine 100 ppm free cyanide
in 5 ml cyanide solution. According to table 24, the error in the analysis was only 0.09 ppm.
The analysis of 75 ppm cyanide solution was conducted using the same AgNO3
concentration. The achieved data for this sample is presented in figure 28 and table 25.
(A) (B)

64
Figure 28. Results from the titration of 75 ppm cyanide solution with 0.0012500 M AgNO3
and rhodanine as the indicator:(A) CN- concentrations, and (B) errors. Black lines show the
maximum and minimum data, blue box shows upper and lower quartile, and red line the
median value.
Table 25. The average concentrations, standard deviations, average errors, and % errors in
the titration of the 75 ppm cyanide solution with 0.0012500 M AgNO3 as titrant and
rhodanine as the indicator.
Sample volume
(ml)
Average of the obtained
concentrations
(ppm)
Standard
deviation
(ppm)
Average error
(ppm)
Average error
(%)
2 74.56 0.74 -0.43 -0.58
5 74.43 1.99 -0.56 -0.75
8 74.69 0.90 -0.30 -0.41
As can be seen in table 25, the analysis of 2 ml, 5 ml, and 8 ml cyanide solution determined
approximately the expected concentration. Hence, the 0.0012500 M AgNO3 as titrant and
rhodanine as the indicator can be applied for the determination of free cyanide in 75 ppm
cyanide solution in all the sample volumes mentioned in the table.
The obtained results in the titration of 50 ppm cyanide solution are presented in figure 29
and the table 26. The free cyanide concentration in this sample was determined using
0.0012500 M AgNO3.
(A) (B)

65
Figure 29. Results from the titration of 50 ppm cyanide solution with 0.0012500 M AgNO3
and rhodanine as the indicator: (A) CN- concentrations, and (B) errors. Black lines show the
maximum and minimum data, blue box shows upper and lower quartile, and red line the
median value.
Table 26. The average concentrations, standard deviations, average errors, and % errors in
the titration of the 50 ppm cyanide solution with 0.0012500 M AgNO3 as titrant and
rhodanine as the indicator.
Sample volume
(ml)
Average of the obtained
concentrations
(ppm)
Standard
deviation
(ppm)
Average error
(ppm)
Average error
(%)
2 51.13 1.26 1.139 2.27
5 49.18 1.42 -0.81 -1.62
8 49.22 0.94 -0.77 -1.56
As can be seen in table 26, the average of the obtained concentrations in the analysis of 2 ml
sample volume which is 51.13 ppm was higher than the expected concentration. On the other
hand, in the analysis of 5 ml sample volume, the average concentration of about 49.18 ppm
was lower than 50 ppm. Therefore, the 0.0012500 M AgNO3 as the titrant, rhodanine as the
indicator, and 8 ml sample volume with the lowest error of about -0.77 ppm were the best
option for the determination of 50 ppm free cyanide in this solution.
Regarding the sample with 10 ppm cyanide concentration, the 0.0012500 M AgNO3 and
0.0001250 M AgNO3 were evaluated. In the analysis with the first option, the required
volume which was about 0.32 ml-1.24 ml showed a very fast change of color. Although the
required volume in this test was low, the obtained concentrations were satisfactory (see table
(A) (B)

66
I-1 in appendix II). However, the analysis of this sample was conducted using 0.0001250 M
AgNO3 which there was not any concern about the fast color change during the titration. The
obtained results from the analysis 10 ppm cyanide solution are presented in figure 30 and
table 27.
Figure 30. Results from the titration of 10 ppm cyanide solution with 0.0001250 M AgNO3:
(A) CN- concentrations, and (B) errors. Black lines show the maximum and minimum data,
blue box shows upper and lower quartile, and red line the median value.
Table 27. The average concentrations, standard deviations, average errors, and % errors in
the titration of the 10 ppm cyanide solution with 0.0001250 M AgNO3 as titrant and
rhodanine as the indicator.
Sample
volume
(ml)
Titrant
concentration
(M)
Average of the obtained
concentrations
(ppm)
Standard
deviation
(ppm)
Average
error
(ppm)
Average
error
(%)
2 0.0001250 10.66 0.17 0.66 6.62
5 0.0001250 10.16 0.16 0.16 1.62
8 0.0001250 9.75 0.28 -0.24 -2.49
According to table 27, the average of the obtained concentrations in the analysis 5 ml sample
volume with this titrant was closer to the expected concentration. Therefore, the 0.0001250
M AgNO3 as the titrant, rhodanine as the indicator, and 5 ml sample volume could
successfully determine approximately 10 ppm free cyanide in this cyanide solution; the error
was about 1.62%.
(A) (B)

67
The analysis of 5 ppm cyanide solution was conducted using 0.0001250 M AgNO3. The
achieved data for this sample is presented in figure 31 and table 28.
Figure 31. Results from the titration of 5 ppm cyanide solution with 0.0001250 M AgNO3:
(A) CN- concentrations, and (B) errors. Black lines show the maximum and minimum data,
blue box shows upper and lower quartile, and red line the median value.
Table 28. The average concentrations, standard deviations, average errors, and % errors in
the titration of the 5 ppm cyanide solution with 0.0001250 M AgNO3 as titrant and rhodanine
as the indicator.
Sample volume
(ml)
Average of the obtained
concentrations
(ppm)
Standard
deviation
(ppm)
Average error
(ppm)
Average error
(%)
2 5.72 0.15 0.72 14.50
5 5.05 0.05 0.05 1.08
8 4.80 0.09 -0.19 -3.84
As can be seen in table 28, the average of the obtained concentrations in the analysis of 2 ml
sample volume which is 5.72 ppm was higher than the expected concentration. On the other
hand, in the analysis of 8 ml sample volume, the average concentration of about 4.80 ppm
was lower than 5 ppm. Therefore, the 0.0001250 M AgNO3 as the titrant, rhodanine as the
indicator, and 5 ml sample volume with the lowest error of about 1.08% were the optimum
options for the determination of 5 ppm free cyanide in this solution.
For the determination of free cyanide concentration in 1 ppm cyanide solution, the
0.0001250 M AgNO3 and 0.0000125 M AgNO3 were evaluated. In case of using the second
(A) (B)

68
titrant for analysis of 5 ml sample, the required volume was too large
(8.6 ml ≤Vtitrant ≤9.28 ml). Hence, this drawback made its application problematic for CN-
identification. Although in the analysis with 0.0001250 M AgNO3 the required volumes were
too small (0.78 ml≤ Vtitrant ≤0.88 ml), this titrant due to the better visual detection was
selected. The results of the analysis 1 ppm cyanide solution with 0.000125 M AgNO3 are
presented in figure 32 and table 29. The results of the analysis 1 ppm cyanide solution with
0.0000125 M AgNO3 are presented in appendix II as table II-2.
Figure 32. Results from the titration of 1 ppm cyanide solution with 0.0001250 M AgNO3:
(A) CN- concentrations, and (B) errors. Black lines show the maximum and minimum data,
blue box shows upper and lower quartile, and red line the median value.
Table 29. The average concentrations, standard deviations, average errors, and % errors in
the titration of the 1 ppm cyanide solution with 0.0001250 M AgNO3 as titrant and rhodanine
as the indicator.
Sample
volume
(ml)
Titrant
concentration
(M)
Average of the obtained
concentrations
(ppm)
Standard
deviation
(ppm)
Average
error
(ppm)
Average
error
(%)
2 0.0001250 1.27 0.16 0.27 27.5
5 0.0001250 1.09 0.05 0.09 9.3
8 0.0001250 1.09 0.01 0.09 9.3
As can be seen in table 29, the average concentrations in the analysis 5 ml and 8 ml sample
volume with this titrant were close to the expected concentration. However, in the analysis
8 ml sample volume, the standard deviation was lower (0.01 ppm). Therefore, the 0.0001250
(A) (B)

69
M AgNO3 as titrant and rhodanine as the indicator can successfully determine free cyanide
concentration in either 5 ml or 8 ml sample volume.
7.2.1 The optimum concentrations of titrant
The optimum concentrations of the titrant for the determination of free cyanide concentration
in 1 to 100 ppm cyanide solution with rhodanine as the indicator are presented in table 30.
Like the first series of experiments, the best sample volume was 5 ml due to the same reasons
discussed in section 7.1.1.
Table 30. Samples and their most suitable titrant in the determination of cyanide with
rhodanine as the indicator.
Concentration of
the sample (ppm)
Samples
volumes (ml)
Titrant
0.0012500 M
AgNO3
0.0001250 M
AgNO3
0.0000125 M
AgNO3
100 5 ✓ - -
75 5 ✓ - -
50 5 ✓ - -
10 5 ˟ ✓ -
5 5 - ✓ -
1 5 - ✓ ˟
✓ Minimum error
˟ Unacceptable
- Not tested
7.2.2 The reliability of the indicator
According to the calculated standard deviations and errors, rhodanine is a reliable indicator
for the determination of free cyanide concentration in 5-100 ppm cyanide solutions. The
calculated values are presented in table 31. As can be seen, the highest error was in the
analysis of 1 ppm cyanide solution. This lack of precision can be due to the difficulty in the
detection of the color change to mark the end-point, which is shown in figure 33. According
to this figure, 1 ppm sample ended up in a yellow color, which provided a low contrast for
end-point detection. On the other hand, 10 ppm sample showed a pink color at its end-point,
which provided high contrast to the primary color of the solution and consequently easier
detection of the end-point. As can be seen in table 24 to table 26, the % of error in the analysis
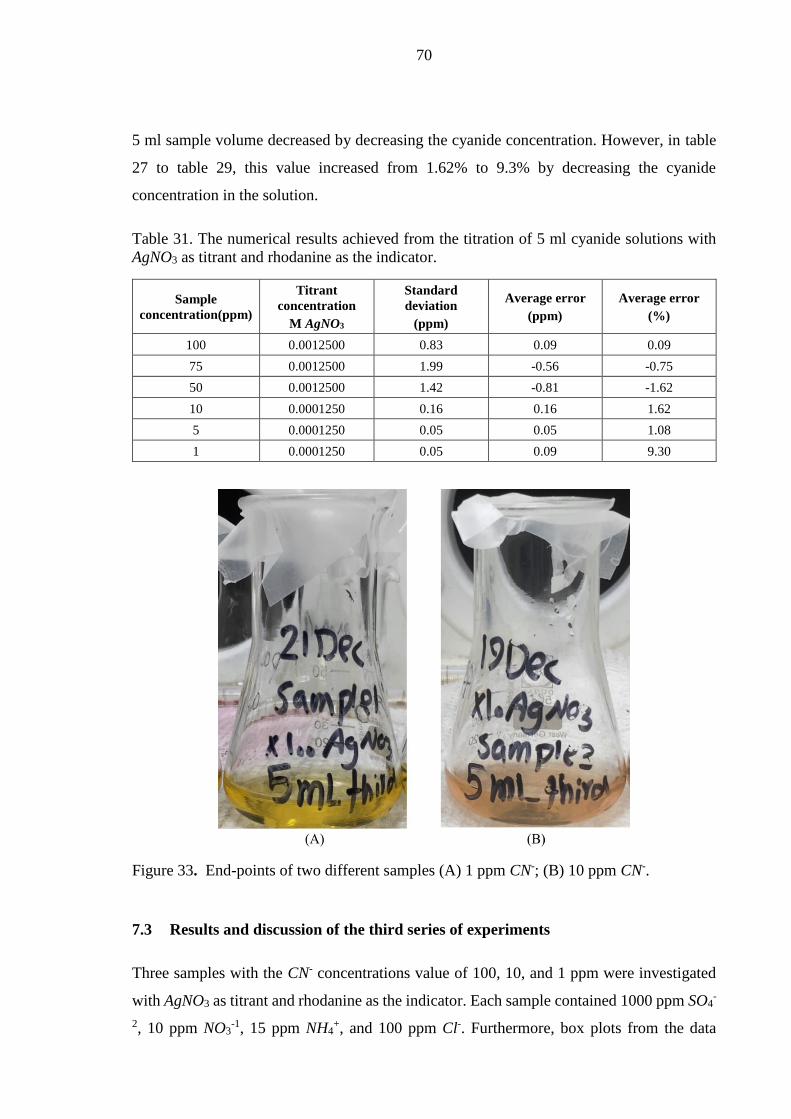
70
5 ml sample volume decreased by decreasing the cyanide concentration. However, in table
27 to table 29, this value increased from 1.62% to 9.3% by decreasing the cyanide
concentration in the solution.
Table 31. The numerical results achieved from the titration of 5 ml cyanide solutions with
AgNO3 as titrant and rhodanine as the indicator.
Sample
concentration(ppm)
Titrant
concentration
M AgNO3
Standard
deviation
(ppm)
Average error
(ppm)
Average error
(%)
100 0.0012500 0.83 0.09 0.09
75 0.0012500 1.99 -0.56 -0.75
50 0.0012500 1.42 -0.81 -1.62
10 0.0001250 0.16 0.16 1.62
5 0.0001250 0.05 0.05 1.08
1 0.0001250 0.05 0.09 9.30
Figure 33. End-points of two different samples (A) 1 ppm CN-; (B) 10 ppm CN-.
7.3 Results and discussion of the third series of experiments
Three samples with the CN- concentrations value of 100, 10, and 1 ppm were investigated
with AgNO3 as titrant and rhodanine as the indicator. Each sample contained 1000 ppm SO4-
2, 10 ppm NO3-1, 15 ppm NH4
+, and 100 ppm Cl-. Furthermore, box plots from the data

71
achieved from these samples with 100, 10, and 1 ppm pure cyanide solutions are compared
in figure 34 to figure 36. Finally, the average concentrations, standard deviations, average
errors, and % errors in the titrations are presented in table 32 to table 34 at the end of this
section.
Figure 34. CN- concentrations and errors from the analysis of 100 ppm cyanide solution and
synthetic mine water with 0.0012500 M AgNO3 as titrant and rhodanine as the indicator: (A
& B) 2 ml; (C & D) 5 ml; (E & F) 8 ml. Black lines show the maximum and minimum data,
blue box shows upper and lower quartile, and red line the median value.
(A)
(F) (E)
(D) (C)
(B)

72
The analysis of synthetic mine water containing 10 ppm free cyanide was conducted using
0.0001250 M AgNO3. The optimum titrant concentration for this sample was selected based
on the conducted experiment in section 7.2 for 10 ppm cyanide solution.
Figure 35. CN- concentrations and errors from the analysis of 10 ppm cyanide solution and
synthetic mine water with 0.0001250 M AgNO3 as titrant and rhodanine as the indicator: (A
& B) 2 ml; (C & D) 5 ml; (E & F) 8 ml. Black lines show the maximum and minimum data,
blue box shows upper and lower quartile, and red line the median value.
(A)
(F) (E)
(D) (C)
(B)

73
The analysis of synthetic mine water containing 1 ppm free cyanide was conducted using
0.0001250 M AgNO3. The optimum titrant concentration for this sample was selected based
on the conducted experiment in section 7.2 for 1 ppm cyanide solution.
Figure 36. CN- concentrations and errors from the analysis of 1 ppm cyanide solution and
synthetic mine water with 0.0001250 M AgNO3 as titrant and rhodanine as the indicator: (A
& B) 2 ml; (C & D) 5 ml; (E & F) 8 ml. Black lines show the maximum and minimum data,
blue box shows upper and lower quartile, and red line the median value.
(A)
(F) (E)
(D) (C)
(B)
74
Table 32. The average concentrations, standard deviations, average errors, and % errors in
the titration of synthetic mine water containing 100 ppm cyanide with 0.0012500 M AgNO3
as titrant and rhodanine as the indicator.
Sample
volume
(ml)
Titrant
concentration
M AgNO3
Average of the
obtained
concentration
(ppm)
Standard
deviation
(ppm)
Average
error
(ppm)
Average
error
(%)
2 0.0012500 99.80 2.03 -0.19 -0.19
5 0.0012500 96.86 0.99 -3.13 -3.13
8 0.0012500 96.26 1.14 -3.73 -3.73
Table 33. The average concentrations, standard deviations, average errors, and % errors in
the titration of synthetic mine water containing 10 ppm cyanide with 0.0001250 M AgNO3
as titrant and rhodanine as the indicator.
Sample
volume
(ml)
Titrant
concentration
M AgNO3
Average of the
obtained
concentration
(ppm)
Standard
deviation
(ppm)
Average
error
(ppm)
Average
error
(%)
2 0.0001250 10.41 0.40 0.41 4.1
5 0.0001250 10.17 0.19 0.17 1.75
8 0.0001250 10.16 0.05 0.16 1.69
Table 34. The average concentrations, standard deviations, average errors, and % errors in
the titration of synthetic mine water containing 1 ppm cyanide with 0.0001250 M AgNO3 as
titrant and rhodanine as the indicator.
Sample
volume
(ml)
Titrant
concentration
M AgNO3
Average of the
obtained
concentration
(ppm)
Standard
deviation
(ppm)
Average
error
(ppm)
Average
error
(%)
2 0.0001250 3.37 0.35 2.37 237.0
5 0.0001250 2.37 0.17 1.37 137.3
8 0.0001250 2.52 0.08 1.52 152.4
The obtained results showed that rhodanine can be successfully applied for the determination
of cyanide concentration in synthetic mine water with 10-100 ppm free cyanide. The
presence of 15 ppm NH4+, 10 ppm NO3
-, 1000 ppm SO4-2, and 100 ppm Cl- did not cause
significant interference. However, this method was not efficient enough for concentrations
as small as 1 ppm. As can be seen in table 35, the error in synthetic mine water containing 1
ppm free cyanide was 137.35% which was really higher in comparison to cyanide solution
with 1 ppm free cyanide (9.30%). The possible reason for this very high error can be due to
the difficulty in the visual detection (see figure 33) and maybe the presence of other

75
compounds in the synthetic mine water. The standard deviation, average error, % error in
the titration of 5 ml of synthetic mine water and cyanide solution are compared in table 35.
Table 35. The comparison between standard deviations, average errors, and % errors in the
titration of 5 ml of synthetic mine water and cyanide solutions with AgNO3 as titrant and
rhodanine as the indicator.
Sample
concentration
(ppm)
Synthetic mine water Cyanide solution
Standard
deviation
(ppm)
Average
error
(ppm)
Average
error
(%)
Standard
deviation
(ppm)
Average
error
(ppm)
Average
error
(%)
100 0.99 -3.13 -3.13 0.83 0.09 0.09
10 0.19 0.17 1.75 0.16 0.16 1.62
1 0.17 1.37 137.35 0.05 0.09 9.30
In conclusion, this study showed that AgNO3 as the titrant and rhodanine as the indicator can
determine cyanide in synthetic mine water. In the analysis of synthetic mine water with 100
ppm free cyanide, the average error was -3.13%. In comparison to some similar studies,
which considered copper as the interference, this average value was in a more acceptable
criterion. As an example, Jimenez-Velasco et.al (2014) studied the determination of free
cyanide concentration with AgNO3 as titrant and rhodanine as the indicator. The calculated
error in a solution containing 100 ppm cyanide and 61 ppm copper was 121%.
In another study, Breuer et.al (2011) studied the determination of free cyanide concentration
with AgNO3 as titrant and rhodanine as the indicator. The calculated error in a solution
containing 250 ppm cyanide and 500 ppm copper was 94%. The comparison of these studies
with the current one shows that rhodanine is a reliable indicator in the presence of 15 ppm
NH4+, 10 ppm NO3
-, 1000 ppm SO4-2, and 100 ppm Cl-. However, in the presence of copper
cyanide species, such as Cu (CN)2-, Cu (CN)3
-2, and Cu (CN)4-3 this method is associated
with high errors. The reaction of these species with AgNO3 and the consumption of titrant
are the main reasons for overestimated results for free cyanide concentration. Therefore, the
potentiometric end-point method is the preferable option for the determination of cyanide in
solutions with high copper concentration.

76
8 CONCLUSIONS
Cyanide can be found in the effluents of numerous industries including mining. The toxicity
and the concentration control of cyanide during gold and silver extractions necessitate the
precise detection and determination of this compound. Hence, the main aim of this research
was finding and then comparing experimentally the different available methods for
analyzing cyanide. Among different analysis method, silver nitrate titration as the most
commonly applied method in gold extraction industry was selected to determine free cyanide
concentration in aqueous solutions.
For this purpose, three series of experiments were conducted. In the first series of
experiments, AgNO3 as the titrant and KI in the presence of NH4OH as the indicator were
applied. In the second series of the experiments, AgNO3 as the titrant and rhodanine as the
indicator was used to determine the free cyanide concentration. In addition, the effect of
main interferences including sulfate, nitrate, ammonium, and chloride, on this analysis was
studied in the third series of the experiments.
In the first series of the experiments, the cyanide concentration was determined in 6 samples
containing 100, 75, 50, 10, 5, 1 ppm free cyanide. The analysis was conducted in 2 ml, 5 ml,
and 8 ml sample volume; in addition, each sample was titrated 5 times. 0.010, 0.001, and
0.002 M AgNO3 as the titrant and 10% KI, 10% NH4OH were prepared as the indicator. The
average error which varied from -1.51% to 64.95% showed that this indicator was not
reliable enough for free cyanide determination.
In the second series of the experiment, the similar procedure with different titrant
concentrations of 0.0012500, 0.0001250, and 0.0000125 M was conducted. The average
error which varied from -0.75% to 9.3% showed that the indicator was reliable for the
determination of samples with 5 ppm cyanide and higher. Hence, the 0.0012500 M AgNO3
was selected for the analysis of synthetic mine water with 100 ppm free cyanide. In addition,
0.0001250 M AgNO3 was chosen for the analysis of synthetic mine water with 10 ppm and
1 ppm free cyanide.

77
The last series of experiment, carried out using the optimum titrant and three different
samples volume, showed that AgNO3 as the titrant and rhodanine as the indicator could
successfully be applied for the free cyanide determination in the samples with 10 ppm
cyanide and higher. In addition, the presence of 1000 ppm sulfate, 10 ppm nitrate, 15 ppm
ammonium, and 100 ppm chloride did not cause any significant interferences. However, this
method was not efficient enough for concentrations as small as 1 ppm. The possible reason
for the higher error of about 137.35% could be due to the difficulty in the visual detection
and maybe the presence of main interferences in the synthetic mine water.
Further research on the free cyanide determination can be conducted in the presence of other
interferences which normally are found in mining effluents. These interferences include
S2O3-, SCN-, Cu (CN)2
-, Cu (CN)3-2, WAD cyanide, Zn+2, S-2, CNO-, NO3
-, and C2N2. The
effect of each interference can be studied individually and in the presence of other
interferences. Also, the decomposition of these components can be investigated in the
simulated environment to mining sites. By knowing the decomposition rate, the over or
lower estimated results can be interpreted more scientifically.
Based on the literature review, among different analysis method, the flow injection analysis
is a promising method for the determination of free cyanide concentrations in aqueous
solutions. In this method, all the associated cyanide in the cyanide complexes are liberated
before the test stars. Moreover, the low detection limit of about 0.01-200 ppm can meet the
strict emission standards to preserve the human health and the environment.
APPENDICES
Appendix I Results when KI in the presence of NH4OH was used as the indicator.
Appendix II Results when rhodanine was used as the indicator.

78
REFERENCES
Alonso-González, O., Jiménez-Velasco, C., Nava-Alonso, F., Alvarado-Hernández, F. &
González-Anaya, J. 2017. Free cyanide analysis by silver nitrate titration with sulfide ion as
interference. Mineral Engineering, 105, Pp. 19-21.
Archer, E. E. 1958. The Argentimetric Titration of Halide and Cyanide Ions with Dithizone
as Indicator. Analyst, 83, Pp. 571-579.
ASTM D2036-06, 2006. Standard Test Methods for Cyanides in Water, ASTM
International, West Conshohocken, PA.
ASTM D6888-04, 2004. Standard Test Method for Available Cyanide with Ligand
Displacement and Flow Injection Analysis (FIA) Utilizing Gas Diffusion Separation and
Amperometric Detection, West Conshohocken, PA.
Babut, G. B., Moraru, R. I. & Babut, M. C. 2010. Cyanide Management in Mining: An
Integrated Occupational-Environmental Approach. Annual of the University of Mining and
Geology “St. Ivan Rilski”, 53, Pp. 48-54.
BarbenAnalytical. 2015. Application Note: Cyanide Leach Process- pH. [web document].
Published_2015_[Referred_18.7.2018]._Available:_http://www.barbenanalytical.com/files
/Gold_Cyanide_AN_RevA.pdf.
Bark, L. S. & Higson, H. G. 1963. A Review of the Methods Available for the Detection and
Determination of Small Amounts of Cyanide. Analyst, 88: 1051, Pp. 751-760.
Barnes, D. E., Wright, P. J., Graham, S. M. & Jones‐Watson, E. A. 2000. Techniques for the
Determination of Cyanide in a Process Environment: A Review. Geostandards Newsletter,
24: 2, Pp. 183-195.

79
Bazrafshan, E., Ownagh, K. A. & Mahvi, A. H. 2012. Application of Electrocoagulation
Process Using Iron and Aluminum Electrodes for Fluoride Removal from Aqueous
Environment. Journal of Chemistry, 9: 4, Pp. 2297-2308.
Birmingham City University, 2011.Dot and cross structure of CN-.[web document].
Published_2011._[Referred_29.7.2018]._Available at:
https://www.thestudentroom.co.uk/showthread.php?t=1640049 _
Bojorge Ramírez, N., Salgado, A. M. & Valdman, B. 2009. The Evolution and
Developments of Immunosensors for Health and Environmental Monitoring: Problems and
Perspectives. Brazilian Journal of Chemical Engineering, 26: 2, Pp. 227-249.
Botz, M. M. 2001. Overview of Cyanide Treatment Methods. Mining Environmental
Management, Pp. 1-30.
Botz, M., Mudder, T. & Akcil, A. 2005. Cyanide Treatment: Physical, Chemical and
Biological Processes. In: Adams, M. D, Advances in Gold Ore Processing. New York:
Elsevier, Pp. 693-697.
Breuer, P. L., Sutcliffe, C. A. & Meakin, R. L. 2011. Cyanide Measurement by Silver Nitrate
Titration: Comparison of Rhodanine and Potentiometric End-points. Hydrometallurgy, 106:
3, Pp. 135-140.
Burgot, J. L. 2012. Titrimetric Methods Involving a Precipitation. In: Burgot, J. L. Ionic
Equilibria in Analytical Chemistry. New York: Springer-Verlag, Pp. 700-701.
Cameron, M. 2002. Picric Acid Hazards. [web document]. Published 2002, [Referred
19.7.2018]. Available at: https://oag.ca.gov/sites/all/files/agweb/pdfs/cci/safety/picric.pdf
Chaturvedi, S. I. 2013. Electro-Coagulation: A Novel Wastewater Treatment Method.
International Journal of Modern Engineering Research, 3: 1, Pp. 93-100.

80
Chemistry102. 2013. Titration. [web document]. Published 2013, [Referred 19.7.2018].
Available_at:_http://www.webassign.net/question_assets/ncsugenchem102labv1/lab_9/ma
nual.html
Comninellis, C. & Chen, G. 2010. Electrochemistry for the Environment. New York:
Springer, Pp. 245-246.
Ribecca, S. 2014. The Data Visualization Catalogue. [web document].
Published_2014._[Referred_25.9.2018]._Available at:
http://www.datavizcatalogue.com/methods/box_plot.html
Dai, X. 2005. The Development of a Flow Injection Analysis Method for the Quantification
of Free Cyanide and Copper Cyanide Complexes in Gold Leaching Solutions.
Hydrometallurgy, 76: 1-2, Pp. 87-96.
Destanoğlu, O. & Gümüş Yilmaz, G. 2016. Determination of Cyanide, Thiocyanate,
Cyanate, Hexavalent Chromium, and Metal Cyanide Complexes in Various Mixtures by Ion
Chromatography with Conductivity Detection. Journal of Liquid Chromatography, 39:9,
Pp. 465-474.
Donato, D. B., Nichols, O., Possingham, H., Moore, M., Ricci, P. F., Noller, B. N. 2007. A
Critical Review of the Effects of Gold Cyanide-bearing Tailings Solutions on Wildlife.
Environment International, 33:7, Pp. 974-984.
Eden, G. E., Hampson, B. L. & Wheatland, A. B. 1950. Destruction of Cyanide in Waste
Waters by Chlorination, Journal of Chemical Technology and Biotechnology, 69: 8,
Pp. 244-249.
Egekeze, J. O. & Oehme, F. W. 2011. Cyanides and Their Toxicity: A Literature Review.
Veterinary Quarterly, 2: 2, Pp. 104-114.
Eisler, R. 1991. Cyanide Hazards to Fish, Wildlife, and Invertebrates: A Synoptic Review,
Washington DC: U.S. Department of the Interior, Fish and Wildlife Service, Pp. 281-284.

81
EPA. 2010a. Toxicological Review of Hydrogen Cyanide and Cyanide Salts, Washington,
D.C.: U.S. Environmental Protection Agency. 91 p.
EPA. 2010b. Method OIA 1677-09: Available Cyanide by Ligand Exchange and Flow
Injection Analysis (FIA), Washington, D.C.: U.S. Environmental Protection Agency. 2 p.
Eyvaz, M. 2016. Treatment of Brewery Wastewater with Electrocoagulation: Improving the
Process Performance by Using Alternating Pulse Current. International Journal of
Electrochemistry Science, 111, Pp. 4988-5008.
Garcia-Segura, S., Eiband, M. M. S., De Melo, J. V. & Martínez -Huitle, C. 2017.
Electrocoagulation and Advanced Electrocoagulation Processes: A General Review about
the Fundamentals, Emerging Applications and Its Association with other Technologies,
Journal of Electroanalytical Chemistry, 801, Pp. 267-299.
Gary, L., Miessler, P. J., Fischer, D. & Tarr, A. 2014. Inorganic Chemistry, New York:
Pearson. 169 p.
Ghous, T. 1999. Flow Injection Analysis (FIA). Journal of the Chemical Society of Pakistan,
21: 4, Pp. 375-381.
Giuriati, C., Cavalli, S., Gorni, A., Badocco, D., Pastore, P. 2004. Ion Chromatographic
Determination of Sulfide and Cyanide in Real Matrices by Using Pulsed Amperometric
Detection on a Silver Electrode. Journal of Chromatography A, 1023: 1, Pp. 105-112.
Geological Survey of Finland. 2009. Vapaan Syanidipitoisuuden Määrtys Titraamalla
Hopeanitaatilla. Published 2009. [Referred 31.7.2018].
Hansen, E. H. & Wang, J. 2004. The Three Generations of Flow Injection Analysis.
Analytical Letters, 37: 3, Pp. 345-359.
Harvey, D. 2000. Modern Analytical Chemistry. New York: McGraw-Hill. 274 p.

82
Jaszczak, E., Polkowska, Ż., Narkowicz, S. & Namieśnik, J. 2017. Cyanides in the
Environment—analysis—problems and Challenges. Environmental Science and Pollution
Research, 24: 19, Pp. 15929-15948.
Jenny, R., Botz, M. M., Dimitriadis, D., Polglase, T., Phillips, W. 2001. Processes for the
Regeneration of Cyanide from Thiocyanate. Minerals and Metallurgical Processing, 18:
126-132, Pp. 126-132.
Jimenez-Velasco, C., Nava-Alonso, F., Uribe-Salas, A. & Alonso-Gonzalez, O. 2014.
Thermodynamic Analysis of Free Cyanide Determination by Silver Nitrate Titration in
Copper Bearing Solutions. Canadian Metallurgical Quarterly, 53: 2, Pp. 207-212.
Kem Kyoto Electronics Manufacturing CO., LTD. 2018. Kem Application Note: Free
cyanide in Silver plating solution Titrator [web document]. Published 2018. [Referred
22.7.2018]. Available at: http://www.kyoto-kem.com/en/pdf/industry/IronandSteel/ETIN-
01002.pdf
Kitis, M., Akcil, A. & Karakaya, E. Y. N. O. 2005. Destruction of Cyanide by Hydrogen
Peroxide in Tailings Slurries from Low Bearing Sulphidic Gold Ores. Journal of Minerals
Engineering, 18: 3, Pp. 353-362.
Kobya, M., Demirbas, E., Ozyonar, F., Sirtbas, G., Gengec, E. 2017. Treatments of Alkaline
Non-cyanide, Alkaline Cyanide and Acidic Zinc Electroplating Wastewaters by
Electrocoagulation. Process Safety and Environmental Protection, 105, Pp. 373-385.
Kobya, M., Demirbas, E., Parlak, N. U. & Yigit, S. 2010. Treatment of Cadmium and Nickel
Electroplating Rinse Water by Electrocoagulation. Environmental Technology, 31: 13,
Pp. 1471-1481.
Kuyucak, N. & Akcil, A. 2013. Cyanide and Removal Options from Effluents in Gold
Mining and Metallurgical Processes. Minerals Engineering, Pp. 13-29.

83
Lindler, E. & Pendley, B. D. 2013. A Tutorial on the Application of Ion-selective Electrode
Potentiometry: An Analytical Method with Unique Qualities, Unexplored Opportunities and
Potential Pitfalls. Analytica Chimica Acta, 762, Pp. 1-13.
Lipták, B. & Venczel, K. 2016. Analysis and Analyzers, New York: CRC Press. 271 p.
Lister, M. W. 1955. Some Observations on Cyanic Acid and Cyanates. Canadian Journal of
Chemistry, 33:2, Pp. 426-440.
Logsdon, M. J., Hagestein, K. & Mudder, T. 1999. The Management of Cyanide in Gold
Extraction. Ottawa: International Council on Metals and the Environment, Pp. 20-27.
Lottermoser, B. 2010. Mine Wastes, 3rd ed. Berlin: Springer-Verlag, Pp. 243-244.
Marriaga-Cabrales, N. & Machuca-Martínez, F., 2014. Fundamentals of electrocoagulation.
In: Peralta-Hernández, J. M., Rodrigo-Rodrigo, M. A. & Martínez-Huitle, C. A. In:
Evaluation of Electrochemical Reactors as a New Way to Environmental Protection, Kerala:
Research Signpost, Pp. 1-16.
Mendham, 2006. Vogels Textbook of Quantitative Chemical Analysis. 6th ed. New York:
Pearson Education. 358 p.
Milosavljevic, E. 2013. Measurement of Weak and Dissociable (WAD) Cyanide with a
Modified Potentiometric Titration. Minerals & metallurgical Processing, 30: 4, Pp. 191-204.
Moran, R. E. 1999. Cyanide in Mining- Some Observations on the Chemistry, Toxicity and
Analysis of Mining-Related Waters, Central Asia Ecology, Pp. 1-10.
Moussa, D. T., El-Naas, M. H., Nasser, M. & Al-Marri, M. J. 2017. A Comprehensive
Review of Electrocoagulation for Water Treatment: Potentials and Challenges. Journal of
Environmental Management, 186, Pp. 24-41.

84
Moussavi, G., Majidi, F. & Farzadkia, M. 2011. The influence of Operational Parameters on
Elimination of Cyanide from Wastewater Using the Electrocoagulation Process.
Desalination, 280: 1-3, Pp. 127-133.
Mudder, T. I., Botz, M. & Smith, A. 2001. Chemistry and Treatment of Cyanidation Wastes,
London: Mining Journal Books. Pp. 1-44.
Nollet, L. M. L. & De Gelder, L. S. P. 2007. Chromatographic (Electrophoretic) Technique.
In: Handbook of Water Analysis. 2nd ed. New York: CRC Press, Pp. 540-543.
Norman, D. K. & Raforth, R. L. 1994. Cyanide Heap Leaching, Washington DC:
Washington State Department of Natural Recourses. 3 p.
OCEANAGOLD. 2015. The Mining Process. [web document]. Published 2015. [Referred
18.7.2018]. Available at: http://www.waihigold.co.nz/mining/the-mining-process/
Parga, J. R., Shukla, S. S. & Carrillo-Pedroza, F. R. 2003. Destruction of Cyanide Waste
Solutions Using Chlorine Dioxide, Ozone and Titania. Waste Management, 23:2,
Pp. 183-191.
Pohlandt, A. F., Jones, C. & Lee, E. A. 1983. A Critical Evaluation of Methods Applicable
to the Determination of Cyanides. Journal of the Southern African Institute of Mining and
Metallurgy, 83: 1, Pp. 11-19.
Ryan, J. A. & Culshaw, G. W. 1944. The Use of p -Dimethylaminobenzylidene Rhodanine
as an indicator for the volumetric determination of cyanides. Analyst, 69: 825, Pp. 370-371.
Robards, K., Haddad, P. R. & Jackson, P. E. 1994. Principles and Practice of Modern
Chromatographic Methods. San Diego: Elsevier. Pp. 265-266.
Sarwar, M., Rashid, A. & Fatima, B. 1973. Micro-determination of Cyanide, Analytical
Letters, 6: 8, Pp. 755-759.

85
Sentruk, E. 2013. The Treatmnet of Zinc-cyanide Electroplating Rinse Water Using an
Electrocoagulation Process. Water Science and Technology, 68: 10, Pp. 2220-2227.
Siddiqui, M. R., Alothman, Z. A. & Rahman, N. 2017. Analytical techniques in
Pharmaceutical Analysis: A review. Arabian Journal of Chemistry, 10, Pp. 1409-1421.
Simeonova, F. P. & Fishbein, L. 2004. Hydrogen Cyanide and Cyanides. Geneva: World
Health Organization. Pp. 4-10.
Simovic, L. 1984. Kinetics of Natural Degradation of Cyanide from Gold Mill Effluents
(Doctoral Thesis). Hamilton: McMaster University. Pp. 33-38.
Singh, H. B. & Wasi, N. M. M. C. 1986. Detection and Determination of Cyanide-A Review.
International Journal of Environmental Analytical Chemistry, 26:2, Pp. 115-136.
Sulistyarti, H., Cardwell, T. J., De Castro, M. L. & Kolev, S. D. 1999. On-line Determination
of Cyanide in the Presence of Sulfide by Flow Injection with Pervaporation. Analytica
Chimica Acta, 390: 1-3, Pp. 133-139.
Sulistyarti, H. & Kolev, S. 2013. Online Ligand Exchange in the Determination of Weak
Acid Dissociable Cyanide by Gas Diffusion-flow injection analysis. Microchemical Journal,
111, Pp. 103-107.
Surleva, A., Gradinaru, R. & Drochioiu, G. 2012. Cyanide Poisoning: from Physiology to
Forensic Analytical Chemistry. International Journal of Crime Investigation, 2, Pp. 79-101.
Taylor, J. 2006. Toxicological Profile for Cyanide, New York: US Department of Health
and Human Services, Public Health Service, Agency for Toxic Substances and Disease
Registry, Pp. 146-147.
Vepsäläinen, M., Pulliainen, M. & Sillanpää, M. 2012. Effect of Electrochemical Cell
Structure on Natural Organic Matter (NOM) Removal from Surface Water through
Electrocoagulation (EC). Separation and Purification Technology, 99, Pp. 20-27.

86
Wang, J., 2006. Analytical Electrochemistry. New York: John Wiley & Sons, Pp. 165-166.
Woffenden, M., Noller, B., Noonan, K., Breuer, P., Cooper, P., Donato, D. 2008. Cyanide
Management: Leading Practice Sustainable Development Program for the Mining Industry.
1st ed. Canberra: Dept. of Industry, Tourism and Resources. Pp. 88-89.
Young, C. A., Taylor, P. R., Anderson, C. G. & Choi, Y. 2008. Hydrometallurgy 2008:
Proceedings of the Sixth International Symposium. 6th ed. Phoenix: Society of Mining,
Metallurgy, and Exploration, Inc. Pp. 731-735.
APPENDIX I, 1(1)
Table I-1. The average concentrations, standard deviations, average errors, and % errors in
the titration of the 10 ppm cyanide solution with 0.001 M and 0.010 M AgNO3 as titrant and
KI in the presence of NH4OH as the indicator.
Sample
volume
(ml)
Titrant
concentration
(M)
Average of the obtained
concentrations
(ppm)
Standard
deviation
(ppm)
Average
error
(ppm)
Average
error
(%)
5 0.010 19.76 - 9.76 97.6
5 0.001 1.65 - -8.35 -83.5
Table I-2. The average concentrations, standard deviations, average errors, and % errors in
the titration of the 5 ppm cyanide solution with 0.001 M AgNO3 as titrant and KI in the
presence of NH4OH as the indicator.
Sample
volume
(ml)
Titrant
concentration
(M)
Average of the obtained
concentrations
(ppm)
Standard
deviation
(ppm)
Average
error
(ppm)
Average
error
(%)
5 0.001 1.44 - -3.56 -71.16
Table I-3. The average concentrations, standard deviations, average errors, and % errors in
the titration of the 1 ppm cyanide solution with 0.002 M AgNO3 as titrant and KI in the
presence of NH4OH as the indicator.
Sample
volume
(ml)
Titrant
concentration
(M)
Average of the obtained
concentrations
(ppm)
Standard
deviation
(ppm)
Average
error
(ppm)
Average
error
(%)
5 0.002 2.92 - 1.92 192

APPENDIX II, 1(1)
Table II.1. The average concentrations, standard deviations, average errors, and % errors in
the titration of the 10 ppm cyanide solution with 0.0012500 M AgNO3 as titrant and
rhodanine as indicator.
Sample
volume
(ml)
Titrant
concentration
(M)
Average of the obtained
concentrations
(ppm)
Standard
deviation
(ppm)
Average
error
(ppm)
Average
error
(%)
5 0.0012500 10.30 0.23 0.3 3.06
Table II.2. The average concentrations, standard deviations, average errors, and % errors in
the titration of the 1 ppm cyanide solution with 0.0000125 M AgNO3 as titrant and rhodanine
as indicator.
Sample
volume
(ml)
Titrant
concentration
(M)
Average of the obtained
concentrations
(ppm)
Standard
deviation
(ppm)
Average
error
(ppm)
Average
error
(%)
5 0.0000125 1.15 0.03 0.15 15.70