analysis of educational tourism management at smart park
TRANSCRIPT

MIMBAR, Vol.34 No 1st (June) 2018 pp. 11-23
11Accredited Sinta 2 based on the decree No.040/P/2014, valid on February, 18, 2014 until February, 18, 2019
Analysis of Educational Tourism Management at Smart Park, Yogyakarta, Indonesia
1ANI WIJAYANTI, 2JANIANTON DAMANIK, 3CHAFID FANDELI, 4SUDARMADJI1Graduate School of Tourism, Gadjah Mada University, Jogjakarta-Indonesia; 2 Social and Political Sciences
Department, Gadjah Mada University, Jogjakarta-Indonesia; 3 Forestry Department, Gadjah Mada University, Jogjakarta-Indonesia; 4Geography Department, Gadjah Mada University, Jogjakarta-Indonesiaemail: [email protected]; [email protected]; [email protected]; [email protected]
Abstract. The concept of educational tourism developed as a consequence of the saturation of applying rigid and formal learning methods. Yogyakarta as a student and cultural city has several educational tourism objects, one of which is the Smart Park. Smart Park Yogyakarta as the most comprehensive science center in Southeast Asia offers various educational tourism program packages. The objective of this study is to analyze the Smart Park management model by conducting a survey to 200 visitors with data analyzed by SEM-PLS method. Data analysis is done in two ways, namely model feasibility test and significance test through bootstrapping process. Based on the data result analysis, the most dominant influence is management performance to the variation of tourism activities with path analysis of 0,653. The Indicator with the largest contribution is learning new technology by loading factor value of 0.872. In terms of product availability, almost all educational tourism activities are available, unless for the tourist attractions related to learning a new language.
Keywords: Educational Tourism, Tourist Demand, Tourist Experience
IntroductionThe Special Region of Yogyakarta has
been well known as a tourist destination. This province is one of the primary destinations after Jakarta, Bali, and Batam. The result of annual questionnaire of Dialogue on Tourism Market in Yogyakarta to several cities in Java since 2009 showed that study tour to Yogyakarta is the main choice for visitors outside Jakarta and Bali (Kedaulatan Rakyat Daily Report, 2012). In recent years, the study tour activity as a regular agenda of several schools and colleges has grown rapidly in Yogyakarta. It boosts the tourism and encourages the economic movement in Yogyakarta. Study tour is a form of non-formal education and learning involving tourism activities. Non-formal education is an education that includes directional communication held outside the school to gain knowledge in accordance with the needs (Sudjana, 2004 in Saepudin et.al., 2017).
The visit of thousands students from outside Yogyakarta through study tour program during school holidays increased
the excitement of small artisans to improve their products. During the visit, there was a process of interaction between tourists and local people in the form of exchange goods, services, and experience (Abdillah et.al., 2015). The interaction process raises the business opportunities in services, such as culinary, accommodation, transportation, tour guide, and information services as well as handicraft industry. From the description above, it can be seen that educational tourism has the important role in increasing tourism in Yogyakarta. The management of educational tourism product becomes a very important aspect to address recent strategic issues, i.e. developing the tourism management in favor of the sustainability of local economic development. The pattern of uneven spatial and tourists visit seasonality have led the management of tourism destination to apply inappropriate strategies.
The successful management of educational tourism products is measured by a number of tourists who have obtained quality experience and new knowledge in educational tourism activities. This experience was
Received: August 08, 2017, Revision: January 30, 2018, Accepted: June 04, 2018Print ISSN: 0215-8175; Online ISSN: 2303-2499. DOI: http://dx.doi.org/10.29313/mimbar.v34i1.2823.11-23Accredited B based on the decree No.040/P/2014, valid on February, 18, 2014 until February, 18, 2019. Indexed by DOAJ, Sinta, IPI
11

12 ISSN 0215-8175 | EISSN 2303-2499
ANI WIJAYANTI, et al. Analysis of Educational Tourism Management at Smart Park, Yogyakarta, Indonesia
determined by both primary and secondary suppliers. The primary suppliers include attractions and events, human resources, affinity travel planners, and tour operators. Secondary suppliers consist of transportation service, hospitality service, and marketing organization (Ritchie, 2003). The combination of both suppliers forms the educational tourism experiences of tourism products consumed by the tourists and becomes a parameter for the successful management of tourism destinations.
Educational tourism management mostly relies on a trial-and-error approach. This approach is applied due to the weak planning and limited resources. It is risky since it can provide inaccurate information about the objective reality in the field. Tourism study in Yogyakarta is focused more on partial products and tourism development plan. That kind of study is unable to produce a whole description of management for a thematic product such as educational tourism. The weak information have created unsustainable educational tourism development or at least inefficient one in the future and would potentially bring a negative impact on the tourism development in Yogyakarta.
The concept of educational tourism refers to a non-formal education which provides knowledge for tourists by performing a fun method of tourism learning activities. In this case, such method of learning process can be more quickly understood and remembered by the students. One of the factors that brought about this educational tourism concept is the saturation of learning method in a rigid and formal room. The forms of educational tourism activities include learning the history, art, culture, language, conferences, and visiting some colleges or schools. It is expected that such activities can support the formal learning activities in schools and function as a means to deepen the understanding of learning process.
In terms of market segments, educational tourism has a market segment consists of all students in formal and informal education from preschool to college levels. Educational tourism plays a role as a means of improving academic standards (Smith, 2013), and becomes the reason of making this study tour program a routine event, a part of curriculum in schools, or even an extracurricular activity. Therefore, the objective of this study is to analyze the educational tourism management model
in Smart Park by examining the effects of variables to one another and of the indicators on each variable. This study aims to analyze the model of educational tourism product management in Smart Park, Yogyakarta, Indonesia.
A study tour has different characteristic from those of other tourism activities. The educational tourism activities may vary from getting to know the schools, customs, learning the language to seminar and research activities (Yuan, 2008). Most of educational tourism participants are students who take some advantages from their vacation for traveling and getting knowledge at the same time. The activities in educational tourism among others are conferences, research, national and international student exchanges, school visit, language school, and study tour, which are organized both formally and informally in a natural and artificial tourist destination (Ritchie, 2003).
Educational tourism management is a complex activity because it involves a wide range of elements, including resources, times, and quality, which are all connected by a complex linked. Resources managed in the educational tourism consist of two types. First, human resources, i.e. individuals being engaged in the creation of educational tourism products such as architects, designers, surveyors, tourism workers, traders, suppliers, and other parties involved. Second, materials, i.e. all materials needed as parts of the educational tourism development processes such as materials for building, landscape, parking and walkway, furniture, and the core elements of tourism attraction (Swarbrooke, 2002). Product management in developing educational tourism destination begins with new ideas and initiatives closely related to tourism attractions and services (Godfrey and Clarke, 2000). The management has a dominant influence in the performance of tourism product management (Richards and Wilson, 2006), in which managers play an important role in designing tourist attractions as a result of initiatives and creativity of human resources involved.
The suitability of products is seen as a response to increasing a number of tourists with special interests, including educational tourists. In this case, tourism destinations are more focused on the products offered to differentiate them from other tourism products and compete in a highly competitive tourism environment (Sharpley and Telfer,
MIMBAR, Vol.34 No 1st (June) 2018 pp. 11-23
13Accredited Sinta 2 based on the decree No.040/P/2014, valid on February, 18, 2014 until February, 18, 2019
2002).
In the management of educational tourism products, a model is required to provide future-oriented information, indicates the alternative courses of action to be evaluated before being implemented, and provides the solutions in accordance with the existing potentials and problems. It has the main objective of facilitating a systematic thinking as well as descriptive, predictive, and normative functions (Rakhmat, 2001). Some tourism models can be presented to provide an overview and a reference in formulating educational tourism product management model in Yogyakarta. Related researches of tourism management model, among others are Management with Competitiveness and Attractiveness Approach (Vengesayi, 2003), Competitiveness Approach with Indicators of Strengths and Weaknesses (Dwyer, 2003), and Stakeholder Perspective Approach (Yoon, 2002).
The tourism management model developed by Vengesayi (2003) used the competitiveness and attractiveness approach and consisted of five propositions. The first is formed by a relationship between attractions, a combination of tourist activity, and attractiveness and competitiveness. The second is formed by a relationship between the level of tourism support facilities and management capabilities associated with attractiveness and competitiveness. The third is formed by density, security, human resource capacity, cooperation level, and competition among destinations as elements that build the environment. The fourth is formed by a relationship between the environment as a place where the tourism product is enjoyed and the attractiveness and competitiveness of destinations. And
the fifth is formed by a relationship between destination ability to attract tourists and to compete internationally with the high image and experience of a price. The tourism management model with competitiveness according to Dwyer (2003) includes several variables, namely resources, situational conditions, and competitiveness. According to Yoon (2002), a tourism destination can be managed using a stakeholder perspective model. The tourism stakeholders’ support for the planning and development of tourism is a key element for long-term successful operations, management, and sustainability of tourism destinations.
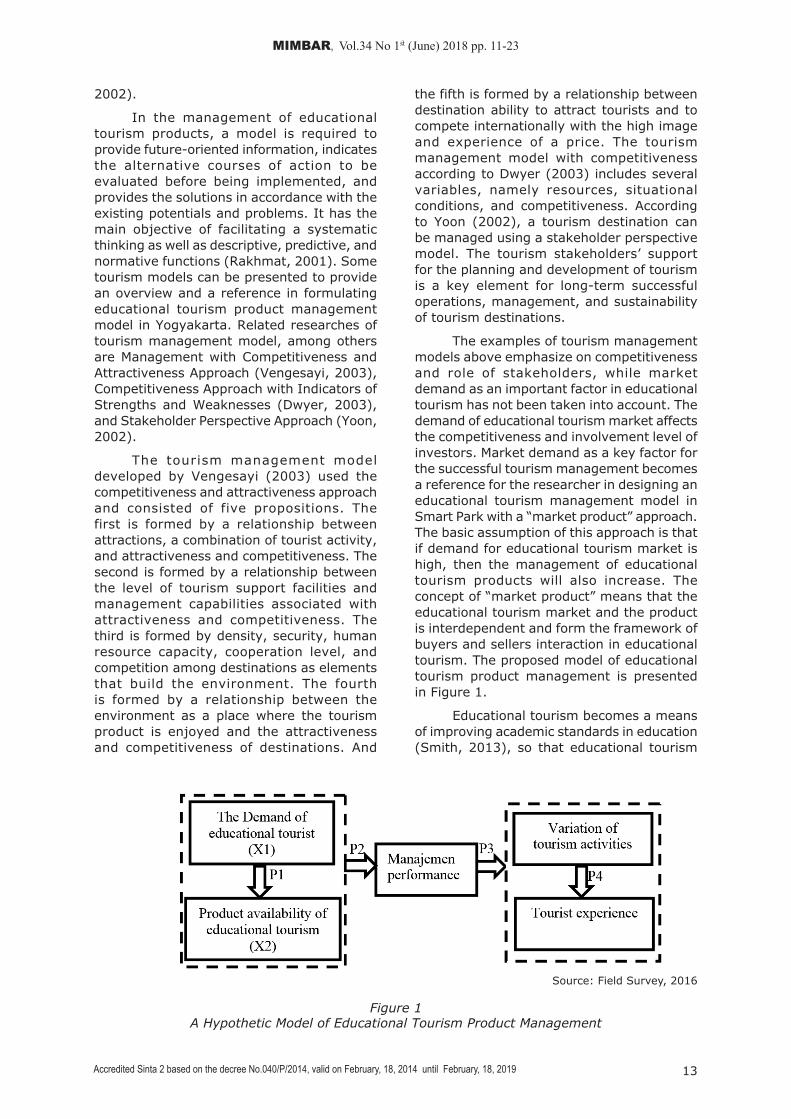
The examples of tourism management models above emphasize on competitiveness and role of stakeholders, while market demand as an important factor in educational tourism has not been taken into account. The demand of educational tourism market affects the competitiveness and involvement level of investors. Market demand as a key factor for the successful tourism management becomes a reference for the researcher in designing an educational tourism management model in Smart Park with a “market product” approach. The basic assumption of this approach is that if demand for educational tourism market is high, then the management of educational tourism products will also increase. The concept of “market product” means that the educational tourism market and the product is interdependent and form the framework of buyers and sellers interaction in educational tourism. The proposed model of educational tourism product management is presented in Figure 1.
Educational tourism becomes a means of improving academic standards in education (Smith, 2013), so that educational tourism
Source: Field Survey, 2016
Figure 1A Hypothetic Model of Educational Tourism Product Management

14 ISSN 0215-8175 | EISSN 2303-2499
ANI WIJAYANTI, et al. Analysis of Educational Tourism Management at Smart Park, Yogyakarta, Indonesia
travel becomes a strong motivation in order to develop education. A strong motivation leads to tourist demand and becomes an opportunity for the managers of destinations to meet the need. The demand gives a clear picture for the managers in designing products to fulfill the market demand and leading the tourists to visit the destinations (Vengesayi, 2003). Performance of management can be seen from the availability and feasibility of a product, including main facilities, additional facilities, services, and support services. The product availability that is adequate in quality and quantity affected variation in tourism activity designed by managers. Management process involved various stakeholders through several stages of management, including scanning, planning, implementation, and evaluation (Woodside and Martin, 2007). Various educational tourism activities are designed to create educational and experience of learning. Various study of tour activities to Israel, for example, are designed to increase students’ knowledge of Israel’s history, geography, language, religion, and culture through visiting the important sites, involving in excavations by archaeologists, learning Israel songs and dances, and following the conference (Cohen, 2008). Educational tourism activities greatly vary ranging from getting to know the schools and cultures, learning the language, attending the symposium or seminar, to following the research projects (Wang, 2008).
Research Methods The study examined a model built by
five latent variables, i.e: tourist demand (X1), products availability (X2), management performance (Y1), the variation of tourism activities (Y2), and level of tourist experience
(Y3), which is shown in Figure 2.
The quantitative data were obtained by conducting a survey to 200 visitors in Smart Park and measured by a four-point Likert scale (Riduwan, 2009). The sample was selected using purposive random sampling. Samples taken were tourist of at least 12 years old of age or over, most of them are junior and senior high school students who were doing study tours. The analytical method used was the Structural Equation Modeling (SEM) with an analysis tool of Partial Least Square (PLS). The model is specified via drag and drop by drawing the structural model for the latent variables and by assigning the indicators to the latent variables (Monecke and Leisch, 2012). Data analysis was performed in two ways, i.e: goodness of fit and test of significance using bootstrapping. The goodness of fit test consists of the goodness of fit test for an outer model (convergent validity, average variance extracted (AVE), composite reliability, Cronbach alpha) and inner model (R square and Q square). In order to validate the overall or aggregate performance between measurement and structural model that used GFI obtained from AVE multiplied by R2 (Tanenhaus et.al., 2005). The rule of thumb goodness of fit can be seen in Table 1.
Table 1Rule of Thumb
Parameter Rule of Thumb
Convergent validity
Loading Factor > 0.5
AVE > 0.5Composite reliability
> 0.60
Cronbach’s Alpha
> 0.60
Source: Field Survey, 2016
Figure 2. Analysis Model

MIMBAR, Vol.34 No 1st (June) 2018 pp. 11-23
15Accredited Sinta 2 based on the decree No.040/P/2014, valid on February, 18, 2014 until February, 18, 2019
R square 0.67 (strong); 0.33 (moderate); 0.19 (weak)
Q square 0.02 (small); 0.15 (fair); 0.35 (large)
GFI 0.1 (small); 0.25 (fair); 0.38 (large)
Source: Ghozali, 2012; Ghazali, 2006; and Santoso, 2002
The next stage after goodness of fit test and models is to meet the criteria of significance test using bootstrapping. Bootstrapping is modification techniques through resampling data that represent the true population (Davidson and Hinkley, 2006). The statistical test is significant when the value of t-statistic > t-table is 1.96. The relationship influence between variables is in the range of -1 to +1, which interpret weakly to excellent (Sarwono, 2006).
The research ins t rument was a questionnaire using four-point Likert measurement to measure the attitude, opinion, and perception of tourists (Djaali, 2008; Riduwan, 2009). The questionnaire used four alternative answers from strongly disagree (score 1) to strongly agree (score 4). The instrument test was performed to test the validity and reliability by spreading the questionnaire to 30 respondents first before disseminating them later to 200 respondents.
Smart Park ProfileSmart Park Yogyakarta i s the
most comprehensive science center in Southeast Asia as it covers some discipline of sciences, including history, physics, biology, mathematics, and chemistry. It was established in 2003 in the strategic area of 1.2 ha at Jl.Panembahan Senopati No. 1-3 Yogyakarta, 55122. The Smarts Park became a center of technology-based sciences and built with the concept of integrated area development and also provided spaces for expression. The tourism area of Smart Park consists of several areas, including playground, early childhood education in the west and east areas, planetarium, craft village, theater of science and library, oval building, box building, food court, and the souvenir counter. The plan site of Smart Park Yogyakarta can be seen in Figure 3.
Playground area covers all the open land that serve as reception and game zones. In this areas there are various learning zones,
such as maritime zone, my scenic village, color spectrum, dancing water park, the humming wall, pulley system, tree house, rocking bridge, teeter-totter, labyrinth, stone forum, president tread, gong peace, the replica of mini rocket, health zone, and traffic zone. There is a planetarium in the playground area along with early childhood education building, while on the east side there is a craft village which presents traditional creativities, such as making batik, pottery painting, and T-shirt painting. The main attractions of Smart Park Yogyakarta are oval and box buildings. Both oval and box buildings display various tourist attractions in favor of learning materials ranging from the phases of water life, ancient life to civilized life.
Source: Smart Park, 2016.
Figure 3 Smart Park Yogyakarta Plan
The market segment of Smart Park is mostly dominated by school-age visitors. A number of tourists in Smart Park from 2008 to 2015 was 7.744.260 people. The peak tourist visit was in 2010, while the lowest one was in 2008 (Figure 4). 2008 was the third year of five-year development phase, so that the visitors of Smart Park were still relatively few, namely 749.609 people. In 2009, the Municipal Government of Yogyakarta made an institutional arrangement in which the Technical Management Unit of Smart Park was changed into the Management Office to improve the services which then followed by an increase number of visitors with the peak season in 2010, i.e. 1.127.922 people. In 2011 and 2012, the number of tourists in Smart Park decreased again due to renovation which carried out in some areas to enhance tourist attraction.

16 ISSN 0215-8175 | EISSN 2303-2499
ANI WIJAYANTI, et al. Analysis of Educational Tourism Management at Smart Park, Yogyakarta, Indonesia
Instrument TestThe Validity Test is used to determine
the questionnaire’s ability to measure what should be measured by comparing the r-statistic value with the r-table value (Cooper et al., 2006; Malhotra and Birks, 2007), as
Tabel 2Results of Validity Test
NoStatement Item in the
questionnaire
r-Statistics conclusion No
Statement Item in the
questionnairer-Statistics conclusion
Tourist Demand (X1) 22 Information service 0.702 Valid
1 Heritage tourism 0.423 Valid 23 Transportation service -0.158 Invalid
2 Culture tourism 0.471 Valid 24 Accommodation service 0.178 Invalid
3 Language learning 0.456 Valid 25 Diversity of
souvenirs 0.487 Valid
4 Science learning 0.678 Valid 26 Culinary service 0.458 Valid
5 Information service 0.466 Valid 27 Parking area 0.571 Valid
6 Transportation service 0.054 Invalid 28 Toilet 0.572 Valid
7 Culinary service 0.516 Valid 29 Accessibility 0.206 Invalid
8 Accommodation service 0.336 Invalid Tourist Activities Variation (Y2)
9 Diversity of souvenirs 0.512 Valid 30 Culture tourism 0.592 Valid
10 Photographers services 0.303 Invalid 31 Conference event 0.744 Valid
Product Availability (X2) 32 Language learning 0.757 Valid
11 Educational tourism 0.594 Valid 33 Research 0.678 Valid
12 Parking area 0.654 Valid 34 Science learning 0.460 Valid
13 Accommodation service -0.051 Invalid 35 Heritage tourism 0.783 Valid
14 Information service 0.657 Valid 36 New technology
learning 0.418 Valid
15 Toilet 0.644 Valid Tourist Experience (Y3)
16 Culinary service 0.692 Valid 37 Language learning 0.749 Valid
17 Photographers services 0.315 Invalid 38 Culture tourism 0.806 Valid
18 Diversity of souvenirs 0.744 Valid 39 Heritage tourism 0.817 Valid
19 Disabled facilities 0.691 Valid 40 New technology learning 0.812 Valid
20 Transportation service 0.143 Invalid 41 Science learning 0.619 Valid
Management Performance (Y1)42 Community
involvement 0.236 Invalid21 Educational
tourism 0.692 Valid
Source: Field Survey, 2016
shown in Table 2.
Table 2 shows there are ten items of invalid statement smaller than r-table for 30 respondents, i.e 0.3610. The ten items were not used in the questionnaire distributed to 200 respondents.

MIMBAR, Vol.34 No 1st (June) 2018 pp. 11-23
17Accredited Sinta 2 based on the decree No.040/P/2014, valid on February, 18, 2014 until February, 18, 2019
of female visitors more than male visitors with the comparison of 65% to 35%. From marital status aspect it was recorded that 83.5% of visitors are unmarried, which is in accordance with the main market segment of Smart Park aimed for students. Visitors from Junior High School and Senior High School were recorded 76%, whereas the highest age group is 11 to 20 years (table 4). More than 40% of tourists visit the Smart Park more than once. They are not only go there for school’s study tour, but also for families’ vacation.
Perception of Smart Park Respon-dents
Perception is a process of understanding the surrounding environment including objects, people, and symbols or signs involving cognitive processes (Gibson, 1996 in Erhamwilda et.al., 2017). Respondents’ perceptions of the five variables in the Smart Park tourism product management model were calculated using three boxes method (Ferdinand, 2006). The index ranges for 200 respondents consist of three ranges which are 50 - 100 (low), 100.01 - 150 (medium), and 150.01 - 200 (high). The highest average total index of five variables is management
Tabel 3Reliability Test
Variable Cronbach Alpha (α) Critical Values ConclusionTourist Demand (X1) 0.671 0.6 ReliableProduct Availability (X2) 0.717 0.6 ReliableManagement’s Performance (Y1) 0.639 0.6 ReliableTourist Activities Variation (Y2) 0.756 0.6 ReliableTourist Experience (Y3) 0.767 0.6 Reliable
Source: Field Survey, 2016
Table 4Social Characteristics and Demographics of Smart Park Respondents
No Description F % No Description F %
1Gender 5 EducationMale 69 34.5 Junior High School 71 35.5Female 131 65.5 Senior High School 81 40.5
2
Age
6
Diploma 15 7.5< 20 124 62 Bachelor 24 1220 -30 50 25 Postgraduate 3 1.531 - 40 15 7.5 Others 6 341 – 50 8 40
7
Frequency of Visits> 50 3 1.5 Once 101 50.5
3Marital Status 2-3 Times 80 40Married 33 16.5 >3 Times 19 9.5Unmarried 167 83.5
Source: Field Survey, 2016
Sources: Smart Park, 2016Figure 4
Number of Smart Park Yogyakarta’s Visitors from 2008 to 2015
The reliability test was performed to find out the consistency of the questionnaire in measuring the same symptoms (Umar, 2003; Urbina, 2004). Reliability test results show that all variables are reliable because they have Cronbach alpha value greater than 0.6 (Table 3).
Social Characteristics and Demo-graphics of Smart Park Visitors (as Respondents)
The survey results revealed the number

18 ISSN 0215-8175 | EISSN 2303-2499
ANI WIJAYANTI, et al. Analysis of Educational Tourism Management at Smart Park, Yogyakarta, Indonesia
performance with the value of 54.62, while other variables fall into medium category (Table 5).
The highest management performance is information service with index value of 164.5. Information service is located in the main building, served by two staff members of public relation and marketing. Tour guides are available at every tourist attraction to give the information needed by the tourists. From the aspect of educational tourism attractions, Smart Park managers are able to package the tourism in accordance with tourists’ demand and the development of science. In addition, tourists have also a high expectation of the toilets and parking lots management and the Smart Park managers have successfully provided adequate, clean, and comfortable
toilets. The parking lot, located beside Smart Park and Senopati area, is also quite extensive and accommodative for the visitors.
Analysis of Tourism Management Model
Feasibility Test of Smart Park Management Model
The feasibility test of Smart Park model using Partial Least Square (PLS) consists of measurement model and structural model test. The feasibility test of the measurement model is performed to find out the validity and reliability of the indicator, while the structural model test is carried out to ensure the robust or accurate model (Figure 5).
Table 5Respondents’ Perception
No Tourist Demand (X1) Index Product Availability (X2) Index
ManagementPerformance
(Y1)Index
1 Heritage tourism (X1.1) 151.75 Educational Tourism (X2.1) 154 Educational
Tourism (Y1.1) 156.25
2 Culture tourism(X1.2) 142.75 Parking area (X2.2) 142 Information service(Y1.2) 164.5
3 Language learning(X1.3) 154.25 Information service (X2.3) 158.25 The diversity of
souvenirs (Y1.3) 149
4 Science learning (X1.4) 141.5 Toilet (X2.4) 149.25 Culinary service (Y1.4) 147.5
5 Information service(X1.5) 148 Culinary service (X2.5) 131 Parking area (Y1.5) 156.5
6 Culinary service (X1.6) 142.75 The diversity of souvenirs (X2.6) 162.5 Toilet (Y1.6) 154
7 The diversity of souvenirs(X1.7) 153 Disabled facilities
(X2.7) 127.25
Average of Total 147.71 146.32 154.62
No Variation of Tourist Activities (Y2) Index Tourist Experience
(Y3) Index
1 Culture tourism (Y2.1) 162.75 Language learning (Y3.1) 122.5
2 Conference(Y2.2) 142.75 Culture tour ism (Y3.2) 141
3 Language learning (Y2.3) 121 Heritage tourism (Y3.2) 140.5
4 Research (Y2.4) 147.5 New technology learning (Y3.4) 146.5
5 Science learning (Y2.5) 161.25 Science learning (Y3.5) 135.75
6 Heritage tourism (2.6) 161.25
7 New technology learning (Y2.7) 152
Average of Total 149.78 137.25
Source: Field Survey, 2016

MIMBAR, Vol.34 No 1st (June) 2018 pp. 11-23
19Accredited Sinta 2 based on the decree No.040/P/2014, valid on February, 18, 2014 until February, 18, 2019
Table 6 Loading Factor
Tourist Demand (X1)
Product Availability (X2)
Management Performance (Y1)
Variation of Tourism Activities
(Y2)
Tourist Experience
(Y3)X1.1 0.704 X2.1 0.707 Y1.1 0.756 Y2.1 0.518 Y3.1 0.785X1.2 0.525 X2.2 0.581 Y1.2 0.629 Y2.2 0.619 Y3.2 0.854X1.3 0.625 X2.3 0.667 Y1.3 0.837 Y2.3 0.573 Y3.3 0.784X1.4 0.796 X2.4 0.679 Y1.4 0.800 Y2.4 0.539 Y3.4 0.872X1.5 0.780 X2.5 0.583 Y1.5 0.703 Y2.5 0.839 Y3.5 0.601X1.6 0.756 X2.6 0.644 Y1.6 0.864 Y2.6 0.724X1.7 0.674 X2.7 0.707 Y2.7
Source: Field Survey, 2016
Table 7Value AVE, ρc, α, and R2
Variable AVE ρc α R2
Tourist Demand (X1) 0.529 0.839 0.779 0.1411Product Availability (X2) 0.545 0.877 0.831 0.1685Management Performance (Y1) 0.590 0.869 0.825Tourist Activities Variation (Y2) 0.616 0.888 0.840 0.2181Tourist Experience (Y3) 0.559 0.851 0.794 0.4287
Source: Field Survey, 2016
Source: Field Survey, 2016Figure 6
Bootstrapping Model
20 ISSN 0215-8175 | EISSN 2303-2499
ANI WIJAYANTI, et al. Analysis of Educational Tourism Management at Smart Park, Yogyakarta, Indonesia
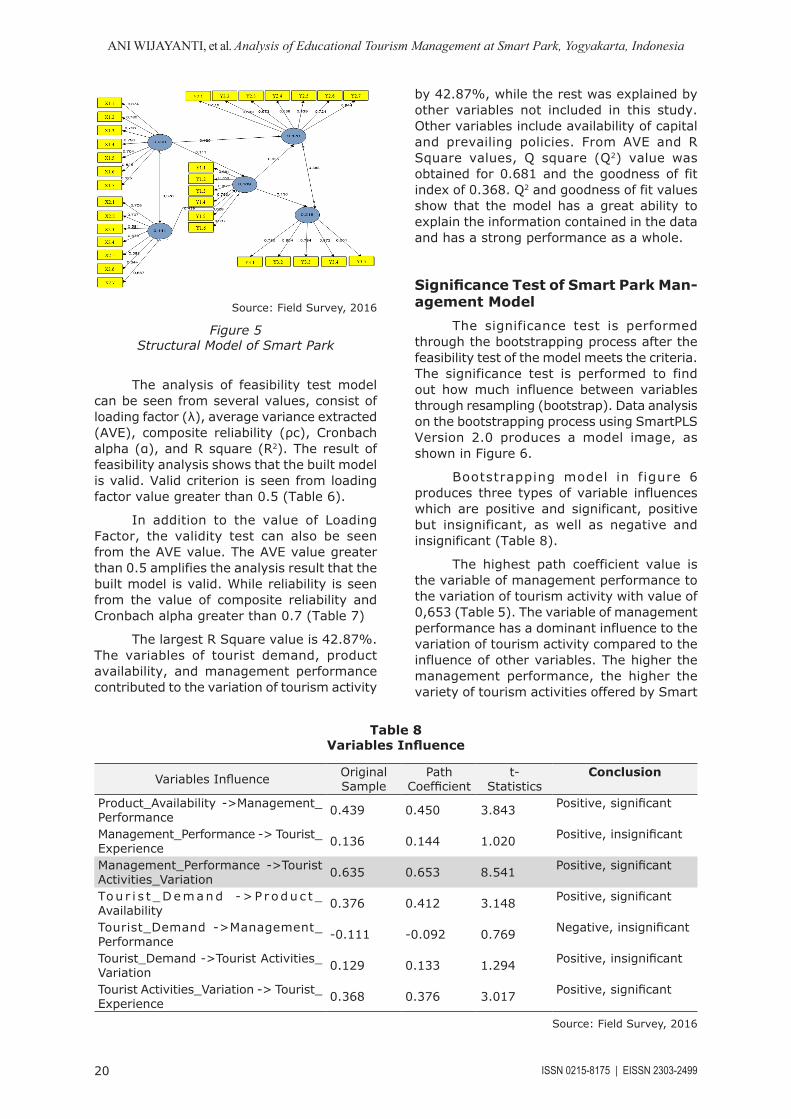
Source: Field Survey, 2016
Figure 5 Structural Model of Smart Park
The analysis of feasibility test model can be seen from several values, consist of loading factor (λ), average variance extracted (AVE), composite reliability (ρc), Cronbach alpha (α), and R square (R2). The result of feasibility analysis shows that the built model is valid. Valid criterion is seen from loading factor value greater than 0.5 (Table 6).
In addition to the value of Loading Factor, the validity test can also be seen from the AVE value. The AVE value greater than 0.5 amplifies the analysis result that the built model is valid. While reliability is seen from the value of composite reliability and Cronbach alpha greater than 0.7 (Table 7)
The largest R Square value is 42.87%. The variables of tourist demand, product availability, and management performance contributed to the variation of tourism activity
by 42.87%, while the rest was explained by other variables not included in this study. Other variables include availability of capital and prevailing policies. From AVE and R Square values, Q square (Q2) value was obtained for 0.681 and the goodness of fit index of 0.368. Q2 and goodness of fit values show that the model has a great ability to explain the information contained in the data and has a strong performance as a whole.
Significance Test of Smart Park Man-agement Model
The significance test is performed through the bootstrapping process after the feasibility test of the model meets the criteria. The significance test is performed to find out how much influence between variables through resampling (bootstrap). Data analysis on the bootstrapping process using SmartPLS Version 2.0 produces a model image, as shown in Figure 6.
Bootstrapping model in figure 6 produces three types of variable influences which are positive and significant, positive but insignificant, as well as negative and insignificant (Table 8).
The highest path coefficient value is the variable of management performance to the variation of tourism activity with value of 0,653 (Table 5). The variable of management performance has a dominant influence to the variation of tourism activity compared to the influence of other variables. The higher the management performance, the higher the variety of tourism activities offered by Smart
Table 8Variables Influence
Variables Influence Original Sample
Path Coefficient
t-Statistics
Conclusion
Product_Availability ->Management_Performance 0.439 0.450 3.843 Positive, significant
Management_Performance -> Tourist_Experience 0.136 0.144 1.020 Positive, insignificant
Management_Performance ->Tourist Activities_Variation 0.635 0.653 8.541 Positive, significant
Tou r i s t _Demand ->P r odu c t _Availability 0.376 0.412 3.148 Positive, significant
Tourist_Demand ->Management_Performance -0.111 -0.092 0.769 Negative, insignificant
Tourist_Demand ->Tourist Activities_Variation 0.129 0.133 1.294 Positive, insignificant
Tourist Activities_Variation -> Tourist_Experience 0.368 0.376 3.017 Positive, significant
Source: Field Survey, 2016

MIMBAR, Vol.34 No 1st (June) 2018 pp. 11-23
21Accredited Sinta 2 based on the decree No.040/P/2014, valid on February, 18, 2014 until February, 18, 2019
Park Yogyakarta. Management performance has a positive effect on the variation of tourism activities with a coefficient value of 0.653 and significant with a t-statistics value of 8.541. The management performance influences the variation of tourism activity by 63.50%. The higher the performance and the creative ideas, the higher the variation of tourism activity at some areas of, among others, playground area, early childhood education building, planetarium, craft village, oval building, box building, laboratory, and multimedia room. Based on field observations, Smart Park offered many variations of tourism activities which would take quite some time for tourists to enjoy the entire tourism attraction. Smart Park’s wide range of tourist attractions, both outdoor and indoor activities, are aimed for children and adults.
Management performance has a positive effect on the level of tourists experience with coefficient path value of 0.144, but not significant with a t-statistic value of 1.020. Management performance affects the experience level of tourists by 13.60%. The high management performance is not followed by the high level of tourist experience. The effect of two variables is evident from the index value shown in table 5. The managing performance index for educational tourism (Y1.1) is very high with the value of 156.25, but the level of tourist experience is still low at some tourist attractions, including tourist attractions related to the introduction of new languages with an index of only 122.5. It shows that management performance has an effect on the level of tourists’ experience, but insignificant because there is still some tourist attraction that has not been managed optimally. The notion of optimal management influenced by existing resources, including cost, staff, facilities, and infrastructure. Tourist attractions related to language learning in Smart Park are still in developing and cooperating with various parties, such as Sanatha Dharma University.
The tourist’s demand has a positive effect on the variation of tourism activities with the coefficient value of 0.133, but insignificant with the t-statistics value of 1.294. Smart Park tourist demand affects tourism activity variation of 12.90%. The influence of two variables is seen in language learning aspect. From the survey results, it is known that tourists have a very high demand on the aspects of language learning (X1.3) with an index of 154.25 (Table 5). While tourism activity related to language learning
(Y2.3) has not been designed optimally that can be seen from index value equal to 121. Smart Park has provided a vehicle to study English vocabulary located in the west of early childhood education building. The rides are only reserved for early-age visitors and cannot accommodate by junior or senior high school students. For the management of educational tourism, Smart Park needs to consider product design related with language learning as an effort to realize a management system that is responsive to market demand (Wijayanti et.al., 2017). In this case, managers are considered to develop language learning rides by adding the type of language for learning and aimed for various age groups.
Tourist demand has a negative effect on management performance with a coefficient value of -0.092, and insignificant with a t-statistics value of 0.769. Higher tourist demand has not yet had an impact on management performance of Smart Park. From the survey results, the highest tourist demand is on souvenirs with index value of 153 (X1.7). However, souvenir management (Y1.4) has a relatively low index value of,149 (Table 5). It shows that the management performance has not been fully influenced by tourist demand. Smart Park has provided a variety of souvenirs but has not yet had the identity of Smart Park as an educational tourism. In addition, the management of souvenirs can also be done through the promotion of creative products both individually and collectively (Dumasari and Rahayu, 2016).The management has a dominant influence on the performance of tourism product management, as in line with Richards and Wilson (2006) theory which stated that destination managers play an important role in designing tourist attractions as a result of initiatives and creativity of existing human resources.
ConclusionBased on the above discussion, it can
be concluded that the measurement of the model was valid and reliable. Table 2 (validity) indicates that the indicator used has an r-statistic value greater than r-table, while table 3 (reliability) shows the Cronbach alpha value of all variables greater than 0.6. Overall, the built model is strong but the contribution value between variables is not high enough and needs other variables involvement, such as availability of capital, regulations aspect, and cooperation with many stakeholders. The

22 ISSN 0215-8175 | EISSN 2303-2499
ANI WIJAYANTI, et al. Analysis of Educational Tourism Management at Smart Park, Yogyakarta, Indonesia
most dominant influence is the management performance to the variation of tourism activities. Management performance affects tourism activity variation for more than 50%. Meanwhile, the indicator that has the greatest contribution is learning new technology (Y3.4) and tourist experience by loading factor value of 0.872 (Table 6). This is in line with field observation result which shows that Smart Park as a science center has successfully provided various educational tourism attractions supported by highly developed technology.
However, Smart Park has not optimally managed tourism activities that involve education and language learning. Based on the survey result, the demand for such activities is quite high, ie 154.25 (Table 5). That data shows there is still a gap between tourist demand and product availability. Language learning courses are not available for all visitors, but only for younger children. This matter can be an input for the manager to design new tourism packages related to the development of language skills, for example, by making a language laboratory or creating a variety of interactive games that boost language skills for visitors.
This research has a limitation of some variables that have not been discussed yet. Several R2 variables values are still low, for example, R2 of product availability is only 0.1411. The tourism demand only contributed 14.11% on variance in product availability, while the remaining is explained by other variables. Therefore, further research can be conducted on other variables that might have an even greater contribution.
References
Abdi l lah, F., Janianton. D., Chaf id, F. , & S u d a r m a d j i . ( 2 0 1 5 ) . Development of Tourism Destination and Quality of Life of Local Communities. Mimbar Journal, 31 (2), 339-350.
Cohen, E.H. (2008).Youth Tourism to Israel. Educational Experiences of The Diaspora. Clevedon: Channel View Publications.
Cooper, R.D &Emory, C.W (2006), Business Research Methods, fifth edition, translated by Ellen Gunawan and Imam Nurmawan, Jakarta: Erlangga.
Davidson, A.C & Hinkley, D.V. (2006). Bootstrap Methods and Their Application.
Cambridge: Cambridge University Press.Djaali, (2008). Likert Scale. Jakarta : Pustaka
Utama.Dumasari & Tri, S.M.R. (2016). Management
Strategy of Creative Souvenir Micro Enterprise for The Empowerment of Craftsmen Peasant. MimbarJournal, 32(1), 175-186.
Dwye r, L .K .C . ( 2003 ) . Des t i na t i on Competitiveness: Determinants and Indicators, Current Issues in Tourism, 6(5),369-414.
Erhamwilda., Asep, D.S., & Nurul, A. (2017). Analysis of Early Childhood Teacher Perceptive of Sex Education in an Islamic Perspective. Mimbar Journal, 33(1), 81-89.
Ferdinand, A. (2006). Research Methods Management: Research Guidelines for Essay, Thesis, and Dissertation in Management Science. Semarang: Universitas Diponegoro.
Ghazali, G. (2006). Structural Equation Modelling: Alternative Method with Partial Least Square. Semarang: Penerbit Universitas Diponegoro.
Ghozali, I. (2012). Application of Multivariate Analysis with SPSS Program. Semarang : Universitas Diponegoro.
Godfrey, K& Clarke, J. (2000). The tourism development handbook: a practical approach to planning and marketing. London: Continuum.
Kedaulatan Rakyat Daily Report. (2012, July 17). Reading Tourism Planning DIY 2025. Retrieve from http://hpijogja.wordpress.com/2012/07/17/membaca-perencanaan-pariwisata-diy-2025/.
Malhotra, N.K & Birks, D.F. (2007). Marketing Research: An Applied Approach, 3rd European Edition. Harlow, UK: Pearson Education.
Monecke, A & Leisch, F. (2012). SemPLS: Structural Equation Modeling Ysung Partial Least Squares. Journal of Statistical Software,48(3),1-32. Retrieve from http://www.jstatsoft.org.
Rakhmat, J. (2001). Communication Psychology. Bandung: PT Remaja Rosdakarya.
Riduwan. (2009). Measurement Scale of

MIMBAR, Vol.34 No 1st (June) 2018 pp. 11-23
23Accredited Sinta 2 based on the decree No.040/P/2014, valid on February, 18, 2014 until February, 18, 2019
Research Variables. Bandung:Alfabeta.Richards, G & Wilson, J. (2006). Developing
Creativity in Tourist Experience: A Solution to the Social Reproduction of Culture, Tourism Management 27(6), 1209-23.
Ritchie, B.W. (2003). Managing Educational Tourism. Clevedon: Cromwell Press.
Saepudin., Jajat, S.A., Ade, S.A., & Ani, R. (2017). The Influence of Participation in Extracurricular Activities to Learning Motivation. Mimbar Journal, 33(2), 251-258.
Santoso, S. (2002). Processing Statistics Data in Professionally Way. Jakarta : PT. Elex Media Komputindo.
Sarwono, J. (2006). Quantitative and Qualitative Research Methods. Yogyakarta: Graha Ilmu.
Sharpley, R& Telfer D.J. (2002). Tourism and Development Concept and Issues. Clevedon: Channel View Publications.
Smith, A. (2013). The Role of Educational Tourism in Raising Academic Standards. African Journal of Hospitality, Tourism and Leisure,2(3),1-7.
Swarbrooke, J. (2002). The Development and Management of Visitors Attractions. London: Routledge
Tanenhaus, M., Vinci, E.V., Yves, M.C., & Carlo, L. (2005). PLS Path Modeling. Computational Statistic &Data Analysis, 48, 159-205.
Umar, H. (2003). Methods of Business Research. Jakarta: Gramedia Pustaka Utama.
Urbina, S. (2004). Essentials of Psychological Testing. New Jersey: John Willey & Sons.
Vengesayi, S. (2003). A Conceptual Modelof Tourism Destination Competitiveness and Attractiveness. Anzmac 2003 Conference proceedings. Adelaide, Australia,637-647. Retrievedfrom http://www.anzmac.org/conference_archive/2003/papers/CON20_vengesayis.pdf.
Wang, B. (2008). Education Tourism Market in China An Explorative Study in Dalian. International Journal of Business and Management, 3 (5),44-49.
Wijayanti, A., Janianton, D., Chafid, F., & Sudarmadji. (2017). Analysis of Supply and Demand to Enhance Educational Tourism Experience in the Smart Park of Yogyakarta, Indonesia. Economies Journal, 5 (4), 98-111.
Woodside., A & Martin, D. (2007). Tourism Management: Analysis, Behavior, and Strategy. Oxfordshire: CAB International.
Yoon, Y. (2002). Development of a Structural Model for Tourism Destination Competi-tiveness from Stakeholder’ Perspective (Doctoral Dissertation). Virginia Poly-technic Institute and State University. Retrieved from https://theses.lib.vt.edu/theses/available/etd-10032002 165524/unrestricted/TourismDestinationCompeti-tivenessYooshikYoon.pdf
Yuan, Y.E & Wu, C.K. (2008). Relationship Among Experiential Marketing, Experiential Value, and Customer Satisfaction.Journal of Hospitality & Tourism Research, 32(3), 387-410.