analysis of flexural behaviour of concrete beams...
TRANSCRIPT

VILNIUS GEDIMINAS TECHNICAL UNIVERSITY
Mantas ATUTIS
ANALYSIS OF FLEXURAL BEHAVIOUR OF CONCRETE BEAMS PRESTRESSED WITH BASALT FIBER REINFORCED POLYMER BARS
DOCTORAL DISSERTATION
TECHNOLOGICAL SCIENCES, CIVIL ENGINEERING (02T)
Vilnius 2018

Doctoral dissertation was prepared at Vilnius Gediminas Technical University in 2013–2018.
Supervisor
Prof. Dr Juozas VALIVONIS (Vilnius Gediminas Technical University, Civil Engineering – 02T).
The Dissertation Defence Council of Scientific Field of Civil Engineering of Vilnius Gediminas Technical University:
Chairman
Assoc. Prof. Dr Darius BAČINSKAS (Vilnius Gediminas Technical University, Civil Engineering – 02T).
Members:
Dr Nicholas FANTUZZI (University of Bologna, Italy, Civil Engineering – 02T),
Dr Shiho KAWASHIMA (Columbia University of the City of New York, United States, Materials Engineering – 08T),
Prof. Dr Romualdas KLIUKAS (Vilnius Gediminas Technical University, Civil Engineering – 02T),
Prof. Dr. Ričardas MAKUŠKA (Vilnius University, Chemical Engineering – 05T).
The dissertation will be defended at the public meeting of the Dissertation Defence Council of Civil Engineering in the Senate Hall of Vilnius Gediminas Technical University at 9 a. m. on 9 November 2018.
Address: Saulėtekio al. 11, LT-10223 Vilnius, Lithuania. Tel.: +370 5 274 4956; fax +370 5 270 0112; e-mail: [email protected]
A notification on the intend defending of the dissertation was send on 8 October 2018. A copy of the doctoral dissertation is available for review at VGTU repository http://dspace.vgtu.lt/ and at the Library of Vilnius Gediminas Technical University (Saulėtekio al. 14, LT-10223 Vilnius, Lithuania).
VGTU Press TECHNIKA 2018-043-M research publication book ISBN 978-609-476-132-4 © VGTU Press TECHNIKA, 2018 © Mantas Atutis, 2018 [email protected]

VILNIAUS GEDIMINO TECHNIKOS UNIVERSITETAS
Mantas ATUTIS
IŠ ANKSTO ĮTEMPTAIS BAZALTO PLUOŠTO STRYPAIS ARMUOTŲ LENKIAMŲJŲ BETONINIŲ ELEMENTŲ ELGSENOS ANALIZĖ
DAKTARO DISERTACIJA
TECHNOLOGIJOS MOKSLAI, STATYBOS INŽINERIJA (02T)
Vilnius 2018

Disertacija rengta 2013–2018 metais Vilniaus Gedimino technikos universitete.
Vadovas
prof. dr. Juozas VALIVONIS (Vilniaus Gedimino technikos universitetas, statybos inžinerija – 02T).
Vilniaus Gedimino technikos universiteto Statybos inžinerijos mokslo krypties disertacijos gynimo taryba:
Pirmininkas doc. dr. Darius BAČINSKAS (Vilniaus Gedimino technikos universitetas, statybos inžinerija – 02T).
Nariai:
dr. Nicholas FANTUZZI (Bolonijos universitetas, Italija, statybos inžinerija – 02T), dr. Shiho KAWASHIMA (Niujorko Kolumbijos universitetas, JAV, medžiagų inžinerija – 08T),
prof. dr. Romualdas KLIUKAS (Vilniaus Gedimino technikos universitetas, statybos inžinerija – 02T),
prof. dr. Ričardas MAKUŠKA (Vilniaus universitetas, chemijos inžinerija – 05T).
Disertacija bus ginama viešame Statybos inžinerijos mokslo krypties disertacijos gynimo tarybos posėdyje 2018 m. lapkričio 9 d. 9 val. Vilniaus Gedimino technikos universiteto senato posėdžių salėje.
Adresas: Saulėtekio al. 11, LT-10223 Vilnius, Lietuva. Tel.: (8 5) 274 4956; faksas (8 5) 270 0112; el. paštas [email protected]
Pranešimai apie numatomą ginti disertaciją išsiųsti 2018 m. spalio 8 d.
Disertaciją galima peržiūrėti VGTU talpykloje http://dspace.vgtu.lt/ ir Vilniaus Gedimino technikos universiteto bibliotekoje (Saulėtekio al. 14, LT-10223 Vilnius, Lietuva).

v
Abstract
In general, prestressed concrete (PC) is by far one of the most economical concrete construction techniques, but at the same time, it requires specific knowledge of the properties and behavior of this material. Precompression of the concrete by transferred prestressed force flexural stiffness can be increased and the main is-sue – cracking might be eliminated, correspondingly. Based on the development progress PC is widely being utilized in the construction of the structures for transport and energy sectors (bridges, viaducts, gasholders, reactors, oil&gas tanks, etc.). It has been used in order to store potentially dangerous materials during operation and to resist dynamic effects. However, even in PC case cracking appears, and it is common that it causes corrosion of conventional reinforcement. Finally, it influences the maintenance of existing infrastructure.
Within this research, the author develops the particular subject of concrete – application of new composite material – basalt fiber reinforced polymer (BFRP) to be used for prestressed concrete structures considering subsequent loading stages (stretching at the bulkheads, prestress transfer to concrete, application of service load, etc.). In order to design PC structures, it is significant to estimate effective prestress force with respect to the time-dependent process of concrete and reinforcement. In accordance with design codes requirements, typical formulas from regular concrete structures (RC) are to be used for the estimate of serviceability conditions of flexural PC members. However, a complete review of prestress losses and serviceability shall be employed in order to avoid errors in the structural prognosis of the PC structures with non-conventional composite re-inforcement.
Unlike other composites, experimental test work and calculation methods have yet to be developed for BFRP reinforcement in order to determine stress relaxation behavior. Currently, this phenomena is not fully documented in the lit-erature. Based on this, the author approached an innovative stress relaxation test method to describe the effect of stress relaxation and its impact on the final value of the effective prestress force. Full-scale testing beams were tested in order to evaluate the impact of prestress level (degree) to the flexural stiffness of concrete beams internally prestressed with BFRP bars.
The dissertation is structured within the introduction, three main chapters, verification of the results, the lists of references and author’s publications on the subject of the dissertation.
The topic of the thesis has been discussed in 9 articles: 3 – in the journals with an Impact Factor, 5 – in scientific journals of other international databases and 1 in the conference proceedings referred by the Clarivate Analytics Web of Science.
vi
Reziumė
Išankstinis įtempimas yra viena iš ekonomiškiausių statybinių konstrukcijų statybos būdų, tačiau iš inžinieriaus reikalauja gilesnių gelžbetonio mechanikos žinių. Iš anksto apgniuždant betoną galima padidinti statinių konstrukcijų stan-dumą bei eliminuoti vieną iš esminių trūkumų – pleišėjimą. Vystantis pramonei įtemptasis gelžbetonis vis labiau naudojamas specialiųjų transporto, energetikos bei susisiekimo statiniuose (tiltai, viadukai, saugyklos, reaktoriai, naftos, suskystintųjų gamtinių dujų, trašų rezervuarai ir talpyklos) užtikrinant potencialiai pavojingų medžiagų sandėliavimą ar atsparumą dinaminių apkrovų poveikiui. Dėl aplinkos poveikio gelžbetoninėse konstrukcijose atsiranda nepageidaujami plyšiai, pradeda vystytis armatūros korozija, o tai gali įtakoti tolimesnės minėtų konstrukcijų eksploatacijos kaštų padidėjimą.
Šiame darbe plėtojama dar viena gelžbetonio mechanikos tyrimų kryptis – naujos kompozitinės medžiagos pritaikymas įtemptojo betono konstrukcijoms armuoti, kai ši armatūra įtempiama į atsparas. Norint tinkamai suprojektuoti įtemptąsias betonines konstrukcijas reikia tiksliai įvertinti efektyvios išankstinio įtempimo jėgos dydį atsižvelgiant į ilgalaikius procesus betone bei armatūroje t. y. armatūros įtempių nuostolius. Atsižvelgiant į normų reikalavimus, taikomi skai-čiavimo metodai yra skirti įprastoms gelžbetoninėms konstrukcijoms, taip galimai apskaičiuojant galutinius įtempių nuostolius su paklaida, todėl yra reikalingas ar-matūros įtempių nuostolių skaičiavimo metodų ir eksperimentinių tyrimų tikslinimas, nes įtempiant armatūrą, keičiasi jos, kaip medžiagos mechaninės savybės, o tai turi įtakos efektyviosios išankstinio įtempimo jėgos nustatymui.
Skirtingai nuo kitų kompozitinių medžiagų mokslinių tyrimų rezultatų, šiuo metu pastebimas eksperimentinių tyrimų bei skaičiavimo metodų, tinkamų ba-zalto pluošto armatūros įtempių relaksacijos elgsenai įvertinti, trūkumas. Šiuo tikslu buvo parengta eksperimentinių tyrimų programa siekiant įvertinti armatūros įtempių relaksacijos įtaką išankstiniams armatūros įtempių nuostoliams bei i-šankstinio įtempimo jėgos dydžio įtaką betoninių elementų standumui. Todėl buvo atlikti natūralaus dydžio iš anksto įtemptais bazalto pluošto armatūros strypais armuotų lenkiamų betoninių sijų eksperimentiniai tyrimai.
Disertaciją sudaro įvadas, trys skyriai, bendrosios išvados, naudotos literatūros ir autoriaus publikacijų disertacijos tema sąrašai.
Disertacijos tema paskelbti 9 moksliniai strapsniai: 3 – žurnaluose turinčiuose citavimo rodiklį, 5 – kitų tarptautinių duomenų bazių leidiniuose ir 1 – konferencijų rinkinyje, referuojamame Clarivate Analytics Web of Science duomenų bazėje.

vii
Notations
Symbols
A – is the area of the beam cross-section;
Ac – is the area of plain concrete net section;
Acc – is the area of the compressive concrete above the neutral axis around the top surface of the cross-section;
effA – is the area of the age-adjusted transformed cross-section;
Ag – is the area of the gross cross-section;
Ap – is the cross-sectional area of prestressing bar;
As – is the cross-section area of steel rebar;
A0 – is the area of the transformed cross-section at time;
C – is the coefficient of pure creep;
C* – is the pure specific creep function;
Ec.eff – is the effective modulus of elasticity of concrete;
c.effE – is the age-adjusted effective elasticity modulus for concrete;
Ecm – is the secant modulus of elasticity of concrete;
Ecm.28 – is the elastic modulus of concrete at the age of 28 days;
Ep – is the elastic modulus of the prestressing bar;

viii
Es – is the Young modulus of the steel;
E0 – is the static elastic modulus of the polymer;
I – is the second moment of area of the beam cross-section;
Icr – is the second moment of area of a cracked cross-section;
topIcc – is the second moment of area of the compressive concrete above the neutral axis around the top surface of the cross-section;
Ie – is the effective moment of inertia after cracking; topIeff – is the second moment of area about the top surface of the transformed
cross-section; topI eff – is the second moment of the area about the top surface of the age-adjusted
transformed cross-section;
Ig – is the second moment of area of the gross cross-section; topI 0 – is the second moment of the transformed area about the top surface of the
cross-section at time of prestress transfer;
Ma – is the moment due to the applied service load;
Mcr – is the cracking moment;
Mdec – is the decompression moment;
Mext – is the externally applied moment;
Next – is the externally applied axial load;
P0 – is the force at prestress transfer; Pmax – is the force imposed on the prestressing bar by the hydraulic jack; Pm.t – is the effective force in the prestressing bar at time after the time-depen-
dent losses; Pm.0 – is the initial force in the prestressing bar immediately after transfer after
the instantaneous (short-term) losses; topSc – is the first moment of area about the top surface of the concrete cross-
section; topScc – is the first moment of area of the compressive concrete above the neutral
axis around the top surface of the cross-section; topSeff – is the first moment of area about the top surface of the transformed cross-
section; topS eff – is the first moment of area about the top surface of the age-adjusted trans-
formed cross-section; topS0 – is the first moment of the transformed area about the top surface of the
cross-section at prestress transfer; a – is the coefficient; b – is the coefficient; the width;

ix
e – is the eccentricity of the prestress; the base of the natural logarithm;
fcm – is the mean value of cylinder compressive strength of concrete;
fcm28 – is the compressive strength of concrete at the age of 28 days;
fu – is the ultimate tensile strength of prestressing bar;
k – is the spring elastic constant;
rp – is the relaxation function;
1/r – is the curvature of the cross-section;
sr.max – is the maximum crack spacing;
t – is the time being considered; the age of concrete (in days);
t0 – is the time at the stretching (tensioning at bulkhead) of prestressing bars;
tp – is the time at prestress transfer to concrete cross-section;
tq – is the time at the service load applied;
wk – is the crack width;
yp – is the y-coordinate of the level of prestressing bar (tendon);
ys – is the y-coordinate of the level of steel reinforcement;
zcp – is the distance between the center of gravity of the concrete section and the tendons;
βcc – is the coefficient which depends on the age of the concrete;
ΔM – is the restraining moment;
ΔN – is the restraining axial force;
ΔPc – is the losses of prestress due to creep of concrete;
ΔPc.ext – are the losses due to creep strain due to permanent service load;
ΔPc+s+r – are the time-dependent losses of prestress due to creep, shrinkage, and re-laxation;
ΔPel – is the losses of prestress due to elastic shortening of the member;
ΔPr – are the losses due to intrinsic relaxation;
ΔPs – are the losses due to concrete shrinkage;
ΔPμ(x) – is the losses due to friction at any distance x from the jacking end;
ΔPΘ – is the losses due to to change in temperature;
Δσpr – is the absolute value of the relaxation losses of the prestress;
pr – is the reduced relaxation of prestressing bar;
εc – is the compressive concrete strain; topc – is the top fiber strain of the cross-section;
εcs, εsh – is the shrinkage strain of concrete;

x
εp – is the strain in prestressing bar;
εp.dec – is the strain in prestressing bar due to decompression; .
– is the strain of composite element;
ε1 – is the strain of spring;
ε2 – is the strain of dash-pot;
ε0 – is the instantaneous strain at the level of the reference axis at the time of prestress transfer;
η – is the viscous constant;
η0 – is the Newtonian viscosity;
μ – is the coefficient of friction between the tendons and their ducts;
ρ1000 – is the value of relaxation loss (in %), at 1000 hours after tensioning and at a mean temperature of 20 °C;
σ – is the stress;
σc – is the compressive concrete stress;
σc.ext – is the tensile stress in concrete at the centroid of the prestressing bar;
σc.QP – is the stress in concrete at the centroid of the prestressing bar due to self-weight, initial prestress and other quasi-permanent live loads;
σp – is the stress in prestressing bar;
σp0 – is the initial tendon stress for relaxation;
σpi – is the maximum tensile stress applied to the tendon minus the immediate losses occurred during the stressing process;
σpm.0 – is the initial stress in the prestressing bar immediately after transfer after the instantaneous (short-term) losses;
σξ – is the average value of stress fulfilling Volterra‘s integral term;
σ1 – is the stress of the spring;
σ2 – is the stress of the dash-pot;
φ, φc – is the creep coefficient of concrete;
φp – is the relaxation coefficient of prestressing bar;
χ, χc – is the aging coefficient of concrete;
χp – is the aging coefficient of prestressing bar;
ψ(t) – is the creep function.

xi
Abbreviations
AAEMM – age-adjusted effective moduli method; ASSA – average stress-strain approach; AFRP – aramid fiber reinforced polymer; BFRP – basalt fiber reinforced polymer; CFRP – carbon fiber reinforced polymer; EMM – effective moduli method; FRP – fiber reinforced polymer; GFRP – glass fiber reinforced polymer; GM – general method; HSE – health and safety environment; LVDT – linear variable displacement transducer; RC – reinforced concrete; PC – prestressed concrete; ULS – ultimate limit state; SLS – serviceability limit state; QA – quality assurance.


xiii
Contents
INTRODUCTION ........................................................................................................... 1 Problem Formulation ................................................................................................. 1 Relevence of the Thesis ............................................................................................. 3 Object of the Research .............................................................................................. 4 Aim of the Thesis ...................................................................................................... 4 Tasks of the Thesis .................................................................................................... 4 Research Methodology ............................................................................................... 5 Scientific Novelty of the Thesis ................................................................................ 5 Pratical Value of the Research Findings ................................................................... 5 The Defended Statements .......................................................................................... 6 Approval of the Research Findings ........................................................................... 6 Structure of the Dissertation ....................................................................................... 7 Acknowledgments ...................................................................................................... 7
1. REVIEW OF THE PHYSICAL MODELS AND STRUCTURAL TYPES OF
VISCOELASTIC MATERIALS ................................................................................ 9 1.1. Prestressed Concrete for Structural Applications .............................................. 10 1.2. Fiber Reinforced Polymer Composites for Structural Applications .................. 14 1.2.1. Status Quo on the Development of Fiber Reinforced Polymers ............. 16 1.2.2. Research on Fiber Reinforced Polymers Properties .............................. 18 1.2.3. Research on Prestressed Concrete Structures with Fiber Reinforced
Polymer bars ................................................................................................... 19
xiv
1.2.4. Rheological Models of Viscoelastic Materials ....................................... 20 1.3. Effects in Aging Linearly Viscoelastic Materials .............................................. 23 1.4. Deflection Control ............................................................................................. 37 1.5. Cracking Control ............................................................................................... 39 1.6. Conclusions of Chapter 1 and Formulation of the Thesis Objectives ............... 41
2. ASSESSMENT OF PRESTRESS LOSSES AND SERVICEABILITY OF FLEXURAL PRESTRESSED CONCRETE MEMBERS ............................................ 43
2.1. Approximation of Relaxation Curve ................................................................ 44 2.2. Losses of Prestress Model by Means of Consewutive Phases ........................... 46
2.2.1. General Assumptions and Basic Principles ............................................. 46 2.2.2. Calculation Algorithm ............................................................................. 58
2.3. Analysis of Serviceability Behaviour ................................................................ 59 2.3.1. Proposal for Deflection Analysis ........................................................... 59 2.3.2. Proposal for Calculation of Crack Width ............................................... 61
2.4. Conclusions of Chapter 2 ................................................................................. 63
3. COMPARISON BETWEEN ANALYTICAL AND EXPERIMENTAL RESULTS OF PRESTRESSED ELEMENTS ............................................................... 65
3.1. Experimental Test of Basalt Fiber Reinforced Polymers Anchorage ................ 66 3.2. Experimental Test of Prestressed Concrete beams ............................................ 67 3.2.1. Jacking Setup ........................................................................................... 68 3.2.2. Beam Specimens ..................................................................................... 69 3.2.3. Experimental Test Scheme ...................................................................... 72 3.2.4. Discussion of the Test Results ................................................................. 73 3.3. Experimental Test of Stress Relaxation of Basalt Fiber Reinforced Polymer Bars ............................................................................................................ 79 3.3.1. Experimental Program of Testing Bars ................................................... 79 3.3.2. Test Specimens ........................................................................................ 81 3.3.3. Instrumentation ........................................................................................ 81 3.3.4. Results of the Experimental Work........................................................... 83 3.4. Validation of Theoretical Predictions ................................................................ 86 3.4.1. Prestress Losses ...................................................................................... 86 3.4.2. Load-Deflection Response ..................................................................... 90 3.4.3. Cracking Control .................................................................................... 92 3.5. Conclusions of Chapter 3 .................................................................................. 95
GENERAL CONCLUSIONS ........................................................................................ 97
REFERENCES .............................................................................................................. 99 LIST OF SCIENTIFIC PUBLICATIONS BY THE AUTHOR ON THE TOPIC OF
THE DISSERTATION ....................................................................................... 109 SUMMARY IN LITHUANIAN ................................................................................. 111
xv
ANNEXES1 ................................................................................................................ 127 Annex A. Declaration of Academic Integrity ......................................................... 128 Annex B. The Co-Authors’ Agreements to Present Publications Material in the
Dissertation .......................................................................................... 129 Annex C. Copies of the Scientific Publications by the Author on the Topic of the
Dissertation ............................................................................................ 133
1The annexes are supplied in the enclosed compact disc.

1
Introduction
Problem Formulation
European languages use the word “carcass” and pan-American refer to the “skel-eton” of a building or structure upon which a living body is hung and integrated. Early development of structural materials started from materials resisting com-pression, starting with stones and bricks, then developing into concrete and more recently high-strength concrete. For materials resisting tension, people used bamboo and ropes, then iron bars and steel, then high-strength steel. Later, mate-rials resisting both tension and compression, namely, bending were employed. Timber was utilized, then structural steel, reinforced concrete (RC) and finally prestressed concrete (PC) was developed.
In general, more concrete is produced than any other construction material in the world. There is no other material that could be used in lieu concrete to meet our demand for living infrastructure. PC, on the other hand, combines high-strength concrete and high-strength reinforcement in an “active” manner. This is achieved by prestressing reinforcement and keeping it against the concrete, thus putting the concrete into compression. This active combination results in a much better behavior of the two structural materials.
The historical development of prestressed concrete started in a different manner when prestressing was only intended to create permanent compression in

2 INTRODUCTION
concrete to improve its tensile strength. Later it became clear that prestressing the reinforcement steel was also essential to the efficient utilization of high-tensile reinforcement.
It is a well-established fact that the initial prestressing force applied to the concrete element undergoes a progressive process of reduction over a period of the design life. Consequently, it is important to determine the level of the pre-stressing force at each loading stage, from the stage of transfer of the prestressing force to the concrete to the various stages of prestressing available at service load, up to the ultimate limit state (ULS). Essentially, the reduction in the prestressing force appears due to instantaneous (short-term) losses during the fabrication or construction process and time-dependent (long-term) losses such as creep, shrink-age and stress relaxation of reinforcement.
However, even concrete member is prestressed, corrosion of reinforcement is still most frequent and most serious form of degradation of the concrete structure and leads to excessive maintenance costs of the remaining design life of the struc-tures. Concrete structures may also experience heating/cooling, freezing and wet-ting/drying cycles, which also promote concrete decay and subsequent steel cor-rosion. Non-metallic composite materials such as basalt fiber reinforced polymers (BFRP) posse attractive long-range potential because they are non-corrodible, non–magnetic and might be less sensitive to the environment of high tempera-tures. Mechanical properties of the basalt fiber polymers generally depend on the source of the basalt rock and the production process. Basalt fibers have high fire resistance and are much cheaper than the rest of the structural composites.
Unlike other construction materials, standard test methods have yet to be es-tablished for BFRP materials to determine constitutive properties regarding prac-tical use. In case of prestress force, estimation of the prestress losses over the time requires that stress relaxation be known, but none of the codes provide significant information to determine it. The mechanical properties, in turn, must be clearly specified in the design codes. Until this task is complete, an interim work shall be keenly aware of the discrepancies that may exist between experimental test data and design code provisions. Engineering judgment is paramount in assessing and applying technical information regarding the performance and behavior of PC members with BFRP reinforcement.
The present research is focused on the complete analysis of PC flexural mem-bers reinforced with BFRP bars considering stress relaxation phenomena of BFRP and various initial prestress. An eye on details throughout the unique and innova-tive experimental work confirms expected serviceability behavior to be applicable in practice.

INTRODUCTION 3
Relevance of the Thesis
Emerging breakthroughs in civil engineering suggest that concrete could be a part of the solution when it comes to planning for a sustainable development that en-compasses economic growth and industrial progress while minimizing the eco-logical issues. Thus, RC and PC play a key role in meeting the demand for convenient infrastructure for the growing population, and thus its sustainability is of utmost importance. In the case of structural engineering, practicing engineers can choose either between traditional design code methods, analytical and nume-rical techniques or experimental work in order to analyze PC flexural members. Although design code methods ensure safe design, do not reveal the actual post cracking stress-strain behavior of the cross section and often lack physical interp-retation in particular to FRP materials. Most of the research has focused on PC members with conventional steel reinforcement and research on PC flexural mem-bers reinforced with new type composites, such as BFRP, are scarce in the literature.
Stress relaxation of BFRP reinforcement, creep and shrinkage cause instantaneous (short-term) and time-dependent (long-term) deformations in PC structures. While it is generally accepted that the prestressing force and its losses do not affect the ultimate strength of PC member, a reasonably accurate prediction of the prestress losses is important to serviceability performance. If prestress losses are underestimated, and the limit of the tensile strength of concrete is reached it might cause much larger deflections than expected. On the other hand, if prestress losses are overestimated it could cause to greater camber (upward deflection) as well as unexpected cracking due to prestress.
Until today, the errors in predicting the exact prestress losses can be due to inaccuracy in the estimation of short-term and long-term material characteristics: stress relaxation of prestressing reinforcement, creep and shrinkage of concrete and inaccuracy of the method of analysis employed. The precise and adequate estimation of prestress losses leads to realistic effective prestressing as well as cracking and deformation analysis of PC flexural members. Within this study, analytical methods are proposed combining effects of creep and shrinkage of the concrete and stress relaxation of BFRP, deflections and cracking considered as an interrelated process. Experimental program and analytical calculations are performed in order to prove the reasonable accuracy of the results.
Speaking in general, PC members do require more care in design, construc-tion, and erection than those of ordinary RC due to of the higher strength, smaller section, and sometimes delicate design features involved. The basic desirability of PC is almost self-evident, but its widespread application will be advanced by engineers’ acquaintance with its principles and practice and further development

4 INTRODUCTION
of new cost-effective composite materials such as BFRP, design, and construc-tion.
Object of the Research
The object of present research is the influence of prestress level, and stress relax-ation behavior of basalt fiber reinforced polymer (BFRP) bars to the flexural behavior of prestressed concrete members.
Aim of the Thesis
The aim of the thesis is to propose new analytical methods for the prediction of stress relaxation of BFRP and effective prestress that directly influence the deflections and cracking of PC flexural beams.
Tasks of the Thesis
To achieve the aim of the thesis, the following tasks have to be solved:
1. To review empirical and analytical methods for estimation of prestress losses as well as mathematical (mechanical) models with the emphasis on the viscoelastic (stress relaxation of BFRP reinforcement, creep and shrinkage of concrete) behavior.
2. To develop an analytical method for estimation of prestress losses by means of relaxation behavior and mechanical properties of BFRP.
3. To develop analytical methods for deflection and cracking analysis of flexural PC beams with BFRP reinforcement.
4. To perform a new experimental investigation on stress relaxation of BFRP reinforcement specimens in particular to a different level of pre-stress.
5. To perform an experimental investigation on a deflection and cracking of real scale flexural PC beams with different level of prestress under static four-point bending tests.
6. To evaluate analysis of the adequacy of developed analytical methods for deflections and cracking in comparison with the obtained experimental results.

INTRODUCTION 5
Research Methodology
In order to achieve the aim of the thesis, qualitative research based on the theoret-ical continuum mechanics, analytical and experimental methods were performed. Evaluation of stress relaxation behavior of BFRP based on the differential equa-tion of the process of deformation and approximation of stress relaxation function based on Maxwell’s rheological model is proposed. The calculation method for prestress losses due to stress relaxation of BFRP is based on analysis of the issues related to stress-strain state methods among RC and PC. Regarding unique experimental program, stress relaxation rates for BFRP were observed based on stress relaxation functions. Also, an experimental program was expanded with the purpose to evaluate the influence of prestress level for flexural stiffness of the real scale concrete beams prestressed with BFRP bars.
Scientific Novelty of the Thesis
1. A new calculation method for estimation of prestress losses based on stress relaxation behavior of basalt fiber reinforced polymer (BFRP) bars, has been proposed.
2. As an alternative to the existing empirical methods in the design codes, new calculation methods for the determination of the deflections and cracking have been proposed.
3. Innovative experimental method for stress relaxation of BFRP has been proposed.
4. New experimental data on stress relaxation of BFRP bars are obtained.
5. New experimental results of concrete beams prestressed with BFRP bars under static short-term loading are obtained.
Practical Value of the Research Findings
In the present research a proposed analytical method for prestress losses estima-tion considering stress relaxation behavior of BFRP and certain consecutive phases of loading that cause degradation of initial prestress force. Also, calcula-tion methods regarding deflection and cracking analysis of concrete beams pre-stressed with BFRP bars. Unique equipment capable of keeping constant strain

6 INTRODUCTION
over relaxation time and stress relaxation test is proposed. The experimental pro-gram allows to investigate stress relaxation of BFRP reinforcement under several prestress levels. Based on experimental results, the stress relaxation coefficient for BFRP bars depending on prestress level is proposed. Experimental results shall be used by practicing engineers to use innovative composite materials as rein-forcement for future PC structures.
The Defended Statements
1. The proposed calculation method of prestress losses based on stress relaxation of basalt fiber reinforced polymers (BFRP) adequately esti-mates the effective prestress force.
2. Stress relaxation rate (%) of BFRP bars is varying value and proportionally increases due to an immediate increase of initial pre-stress.
3. Calculation methods for deflection and cracking analysis based on de-compression effect and stress relaxation of BFRP approach adequately assess serviceability limit state with respect to the concept of PC struc-tures.
Approval of the Research Findings
The results of this dissertation have been published in 9 publications, 3 among them in the journals with an Impact Factor and 1 in the conference proceedings referred by the Clarivate Analytics Web of Science. The major results of the re-search presented in this dissertation have been reported by 5 presentations at the following 5 scientific conferences in Lithuania and abroad:
– 17th Conference of Lithuanian Young Scientists Science – Future of Lith-uania. A thematic conference „Civil Engineering, Vilnius, Lithuania, 2014;
– 18th International Conference on Composite Structures (ICCS 18), Lis-bon, Portugal, 2015;
– 19th International Conference on Composite Structures (ICCS 19), Porto, Portugal, 2016;
– 12th International Conference Modern Building Materials, Structures and Techniques, Vilnius, Lithuania, 2016;
INTRODUCTION 7
– 3rd International Conference on Mechanics of Composites (MECHCOMP3), Bologna, Italy, 2017.
Structure of the Dissertation
The dissertation consists of an introduction, three chapters, general conclusions, list of the references (135 publications), list of 9 scientific publications, published by the author on the research topic, summary in Lithuanian and three annexes. Dissertation consists of 126 pages, the text contains 61 pictures and 19 tables.
Acknowledgments
Peform Ph.D. research is a long and challenging endeavour, but the people I have met and contributed with along the way have made it great experience I will al-ways cherish. I will remember the plentiful trips I took around the world to ex-ceptional research facilities and locations ranging form Lisbon to New York. First and foremost, the author expresses his great appreciation to his supervisor Prof. Dr Juozas Valivonis, the Head of the Department of Reinforced Concrete Struc-tures and Geotechnics for providing the guidance, knowledge, and motivation over this research work. Numerous innovative experiments which were vital to disclose the nature of the phenomenas in the investigation would have not happe-ned without his leadership.
In particular, I would like to express my deepest gratitude to Prof. Dr Algir-das Jonas Notkus, Assoc Prof. Dr Bronius Jonaitis, Prof. Dr Charles Dolan, Prof. Dr Oral Büyüköztürk, Prof. Dr Vytautas Vaičaitis for significant support impro-ving the quality of the dissertation. I am thankful to Dr Aidas Jokūbaitis for his willingness to help during the experimental works. Also, I would like to thank all of my collaborators at Vilnius Gediminas Technical University. This includes Assoc Prof. Dr Arnolas Šneideris, who always made a vast effort to ensure I had the necessary literature resources for completing my research work.
Lastly, I would like to thank my family for love and encouragement. And most of all for my loving, supportive, encouraging, and patient wife Eglė whose faithful support during all stages of this Ph.D. is utmost appreciated. Thank you.
The research presented was funded by Grant No. 09.3.3-LMT-K-712-04-0118 from the Lithuanian Science Council and covered by the European Union Structural Funds.


9
1 Review of the Physical models
and Structural Types of Viscoelastic Materials
The first chapter presents a review of physical and mechanical properties of com-posite materials among those Basalt fiber reinforced polymers (BFRPs) posse at-tractive long-range potential as the reinforcement for PC structures. From this standpoint, BFRP is defined as viscoelastic material based on fundamentals of rheology. It is assumed that readers are already acquainted with PC principles that would help to understand the complexity of the issues related to flexural members from initial prestress application over the static loading process. Also, common and new methods for analysis of stress-strain, prestress losses, serviceability limit state (deflections and cracking) of flexural PC members are explained in detail. Throughout this chapter, photographs of significant structures designed and con-structed in prestressed concrete using this fundamental concept are shown. Also, this chapter formulates the main objective and the tasks of the present research work. The review was partly presented in the articles published by Atutis (2010a), Atutis & Valivonis (2010b), Atutis et al. (2011), Atutis et al. (2013a), Atutis et al. (2013b), Atutis et al. (2015), Atutis et al. (2018a) and Atutis et al. (2018b).

10 1. REVIEW OF PHYSICAL MODELS AND STRUCTURAL TYPES OF…
1.1. Prestressed Concrete for Structural Applications
Prestressing has been revolutionary development, first as a material, but more im-portantly as a concept. As a concept, prestressing is valid and applicable practi-cally to all structural materials.
Currently, a growing industry requires to use optimized and affordable engi-neering materials and methods for sustainable construction. Due to great compres-sive strength properties concrete is still very competitive among structural mate-rials and have been successfully applied for construction engineering and other fields: energy (oil product storage units, gas pipelines and risers, gasholders, liq-uefied natural gas and terminals) and marine (cargo wharves, petroleum terminals, offshore platforms, piers, quays, jetties, dolphins, fender systems, bulkheads, floating barges and dry docks, etc.) infrastructure (FIP 1978, FIP 1982, Creazza et al. 1991, Gerwick 1992, Tsinker 1995, Tsinker 1997, Gaythwaite 2004, McConnell et al. 2004, DNV 2012, Meiswinkel et. al. 2013, Gaythwaite 2016, Ghali 2017) and transport sector (Meier 1987, Harding et al. 2010; Notkus 2010; Bhatt 2011; Kim 2014; Jokūbaitis et. al. 2016) (Fig. 1.1). The specifics of the environment of such an infrastructure requires of concrete to compete with high durability and quality requirements. The resistance of aggressive environmental conditions effects long-term maintenance of the infrastructure.
Regarding the energy industry by means of oil storage infrastructure, it often contains anaerobic bacterias which generate sulfides upon contact with seawater. In contact with oxygen, they convert to weak sulfuric acid, which can attack the surface of the concrete. Industry experts (FIP 1978, Gerwick 1992) indicate that if air is present over the crude oil, epoxy coating is warranted in the above-oil zones. The hydrogen sulfides (hereinafter – H2S) and sulfuric acids (hereinafter – H2SO4) which may, however, cause corrosion of steel reinforcement and embed-ment details, refined products, such as gasoline, may be aggressive.
Marine structures rank among the foremost applications of concrete. It was early recognized as the optimal material for harbor and marine structures because it combines durability, strength, and economy. Considering that concrete is immersed in seawater, a chemical attack on the concrete is maximized, i. e. reac-tivity between alkali in cement, and reactive aggregates might be increased by accelerating corrosion of conventional steel. The most serious aggressive element is chlorides, carried to the concrete surface by the splash of seawater. In order to resist environmental conditions mentioned above durability of concrete under-takes a key performance role (Tsinker 1995; Tsinker 1997, Gaythwaite 2004, Gaythwaite 2016; Ghali 2017).

1. REVIEW OF PHYSICAL MODELS AND STRUCTURAL TYPES OF… 11
Fig. 1.1. Potential employment of prestressed concrete for:liquid storage tanks (Ghali 2017) (a); port deep piles (Tsinker 1997) (b); floating barges units (Gerwick
1992) (c); long-span bridges (Bhatt 2011) (d)
Lack of resistance of an aggressive environment can lead to unexpected cracking, corrosion of reinforcement, larger deformations, deflections, and failure of concrete structure (Leonhardt 1977). Thus, prestressed reinforcement can be used in order to prevent from cracking and to minimize the penetration of the air and water.
Also, PC has been shown excellent cryogenic properties at low temperatures, i. e. –160 oC (FIP 1982). However, even concrete member is prestressed, corro-sion of reinforcement is still most frequent and most serious form of degradation of the concrete structure and can lead to necessary repair works and additional costs of the remaining operation time. In some cases, heating/cooling, freezing and wetting/drying cycles, can extremely impact concrete structures by causing corrosion of the reinforcement. Such mentioned consequences above provoked a considerable amount of research in order to find practible means of employing new composite materials such as fiber reinforced polymers (FRPs) (Abdelrahman et al. 1997, Sen et al. 1998, Lees et al. 1999, Torres et al. 2013, Atutis et al. 2015). Composite materials such as FRPs posse attractive potential due to good corrosion

12 1. REVIEW OF PHYSICAL MODELS AND STRUCTURAL TYPES OF…
resistance, mechanical properties and consequently are less sensitive to high tem-peratures, prestress losses than steel reinforcement (DNV2012). Thus, FRP could be a great alternative to conventional reinforcement. It was noticed that further research is required in order to evaluate the short-term and long-term properties. It is utmost important to ensure safe and optimum use of FRP materials in order to fulfill the requirements of the ultimate and serviceability limit states of pre-stressed concrete structures.
The main prestressing methods of FRP reinforcement were investigated by previous researchers (Fig. 1.2): 1) Stretching of the bars at bulkheads (prestressing bed) (Triantafillou et al. 1992; Meier 1995; Garden et al. 1998; Rosenboom et al. 2005; Abhijit et al. 2009; Diab et al. 2009; Atutis et al. 2015). In this case, FRP is being prestressed by hydraulic jacking system between external reaction frames (see Fig. 1.2a). Once the curing time of the epoxy adhesive is completed (ideal adhesive bond between FRP and concrete surface) prestressing force is transferred by releasing FRP reinforcement from external reaction frames (see Fig. 1.2b). In practice, such system can be used for in situ or precast concrete members where FRP plates or bars could be used as the reinforcement; 2) cambered-jacked beams (El-Hacha et al. 2001; Triantafillou et al. 1991). Regarding this method, beams are prestressed by FRP plate by means of cambering it to the upward direction, bonding the FRP reinforcement at the bottom (in tension zone). Jacking force is removed once the epoxy curing is completed (Fig. 1.2c). Practically, this system is applied to precast concrete structures for the strengthening purposes; 3) strengthening of existing beams by external prestress (Valivonis et al. 1995; Buyukozturk et al. 1998; Wight et al. 2001; El-Hacha et al. 2003; Kim et al. 2007; Woo et al. 2008; Yang et al. 2009; Pallegrino et al. 2009; Xue et al. 2010; Zhuo et al. 2009) (see Fig. 1.2d, e). This method is analogous to the conventional system by means of post-tensioning of unbonded FRP bars, and prestressing is transferred directly to the concrete member by pulling the anchor at one end, while the next one is fixed. In regard to installation matters, this system is complicated in order to strengthen existing structures with limited access to the supports (Fig. 1.2d).
Fig. 1.2. Schematic principles of prestress: prestressing methods (a)–(e);
Load-deflection relationship based on variation prestress level (f) (Marčiukaitis 2012)

1. REVIEW OF PHYSICAL MODELS AND STRUCTURAL TYPES OF… 13
Prestressing force effect has the influence of the stiffness of flexural member, but once the external load is applied to the member, it is very important to inves-tigate the reduction of the prestressing force at any state of flexural behavior. De-pending on prestress level, deformation and failure modes are different in com-parison with non–prestressed member while the mechanical characteristics of the beams are uniform.
Consequently, diverse deflection represents diverse resultant of stress in re-inforcement (Fig. 1.2e). Load-deflection diagram “1” shows that reinforcement observes the most of stress resultant and the beam is failed due to the elimination of the camber by the concrete stresses. In case of over reinforced cross-section, failure occurs due to the crushing of the concrete and non-effective use of the tensile strength of the reinforcement. By the increase of prestressing force value, the stresses of the concrete retake initial value by developing a certain deflection due to the appearance of the cracking. Further, the less stress of the reinforcement is contained (in case of less amount of reinforcement) the larger cracking and de-flections are developed up to the failure. Once the concrete and reinforcement observe limit stress, the behavior of diagrams “3” and “4” show, that the failure of the beam can occur. According to the behavior of load – deflection diagram “5” where prestress level is equal to zero, the development of cracking and de-flections reflects to the similar manner as in conventional RC.
From an economics point of view, Balafas et al. (2012) performed analysis method in order to predict optimal design and hence initial costs, of the RC and PC beams with FRP. A unique comparison of different alternative designs was drawn through a diagram of depth d plotted against flexural bar area Ap which allowed to identify ways in which FRP can be used at minimum cost, and to con-sider why FRPs are rarely used in practice. The diagrams (Figs. 1.3–1.4) were build up considering most of the governing constraints: ultimate strength condi-tions; deflection conditions; cost function and etc.
Fig. 1.3. Reinforced concrete beam with: steel rebar (a); fiber reinforced polymer
rebar (b) (Balafas et al. 2012)

14 1. REVIEW OF PHYSICAL MODELS AND STRUCTURAL TYPES OF…
Fig. 1.4. Prestressed concrete beam with: steel tendon (a); fiber reinforced polymer
tendon (b) (Balafas et al. 2012)
Considering RC beams, it is clear that steel is much cheaper (per unit volume) than FRP, so the constant cost line is much flatter (Fig. 1.3a, b). Beams with FRP need to be significantly deeper than with steel in order to comply with deflection conditions, but the amount of reinforcement required is less because of the tensile strength of the rebar. Comparison of the two plots for PC beams yields to conclu-sions that differ from those for RC sections (Fig 1.4). The optimum depth for both sections similar, which is logical given that prestressing allows the concrete to carry the load. Less material is needed for prestressing with FRP because those tendons are generally stronger, while the ultimate strength of the tendon enters by way of the balanced section criteria (Fig. 1.4b). In contrast to prestressed flexural elements, PC ought to be a logical application for FRP.
1.2. Fiber Reinforced Polymer Composites for Structural applications
In general, considerable corrosion of RC and PC members accelerated the re-search on non-metallic materials like FRPs for structural applications as non-cor-rosive reinforcement (ACI 2004, ISIS 2008). FRP reinforcements are manufac-tured from thousands of small organic or inorganic fibers that are embedded in a polymer matrix (Fig. 1.5).
Because manufacturers vary the production process, there can be considera-ble variance in strength, even within the same brand of the composite. High strength fibers of FRPs can be made of glass, aramid, carbon and other polymers with a volumetric fiber ratio of 60–65%. Matrix resin is usually epoxy. FRP rein-forcement is transversely anisotropic with the longitudinal axis being the strong axis.

1. REVIEW OF PHYSICAL MODELS AND STRUCTURAL TYPES OF… 15
Fig. 1.5. Fiber and matrix distribution: over the domestic rebar cross-section (Sovják 2012) (a); incisions in fiber from the nanoindentation tip (Fornůsek et al. 2009) (b)
Moreover, the properties are affected by loading history and duration as well as environmental conditions. These factors are interdependent and, consequently, it is difficult to determine the effect of each one in isolation while the others are kept constant.
The surface texture of the FRP may range considerably between the different FRP products commercially available, for example, sand-coated surface, etc. Some examples of different surface textures are shown in Figure 1.6. The surface texture roughness is manufactured in such way that good bond between the con-crete and FRP would be obtained. From this standpoint, FRP reinforcing bars can be configured in bars, rods, plates, and strands. Unlike traditional steel bars, there are no typical and standardized shape or surface configuration, the orientation of fiber and proportions among fiber and resin products. Moreover, there are no standard methods of FRP production (pultrusion, winding). Regarding FRP bars, there are various types of a cross-section such as round, solid, hollow, and square.
Fig. 1.6. Composite reinforcing bars: ribbed glass composite bars (Atutis et al. 2015)
(a); sand coated basalt composite bars (Atutis et al. 2018) (b); various samples of glass and carbon composite bars (Fico 2004) (c)

16 1. REVIEW OF PHYSICAL MODELS AND STRUCTURAL TYPES OF…
1.2.1. Status Quo on the Development of Fiber Reinforced Polymers
In regard to the type of FRP, mainly three types of fibers were used for FRP rein-forcement in concrete construction: glass (GFRP), carbon (CFRP) and aramid (AFRP). The physical and mechanical properties vary considerably between the different fiber types and may vary significantly for a given type of fiber as well. Some typical properties are given in Table 1.1.
The use of basalt FRP (BFRP) reinforcement is currently in the top research and development phase of composites (Wang et al. 2013, Wang et al. 2014a, Wang et al. 2014b, Wang et al. 2016a, Wang et al. 2016b, Atutis et al. 2018). The raw of basalt is a volcanic rock, and crushed stone melted at 1400-15000C and turned to the fibers. Mechanical properties of basalt fibers are very close or even better than remaining fibers (aramid, carbon, glass, etc.) (Kostikov 1995, Zoghi 2014). Properties of the basalt fiber generally depend on the source and the type of the basalt rock and the method of production. Basalt fibers have high-temperature resistance and are much cheaper than the rest of composite fibers (Bareišis et al. 2003, Kim 2014, Zoghi 2014). In particular, the price comparison of relevant composites is provided in Table 1.2.
BFRP is newly developed for application in civil infrastructure as a structural reinforcement material, displaying approximately 20% higher strength and mod-ulus, similar cost, and more chemical stability compared to GFRP and a wider range of working temperatures and much lower cost than CFRP (Sim et al. 2005). Due to the lack of studies, the application of BFRP faces low utilization.
Table 1.1. Typical properties of fiber reinforced polymers and prestressing steel
Fiber type
Tensile strength,
MPa
Moduli of elas-ticity, GPa
Ulti-mate strain
Density, kg/m3
, mm
Author
Glass 1418 60.2 0.0236 2500 14.55 Atutis et al. (2015)
Carbon 2250 147 0.0157 1900 8.00 Abdelrahman et al. (1997)
Aramid 1330 80 0.0405 1250 15.00 Toutanji et al. (1999)
Basalt 1098 45 0.0246 2500 12.45 Atutis et al. (2017)
Steel (B500A)
525 200 0.0250 7850 n/a CEN (2004)
Steel (Y1030)
830 205 0.0400 7850 n/a CEN (2004)

1. REVIEW OF PHYSICAL MODELS AND STRUCTURAL TYPES OF… 17
Table 1.2. Material costs
Material €/m3 €/kN/m (€ per m)
Reference
Concrete cm0178.014548 fe Balafas (2012)
Steel bar 0.015 Balafas (2012) Steel tendon 0.012 Balafas (2012) BFRPa (0.75) Galen CFRP (CARBOPREE) a (7.60) Sireg SpA CFRP (ARAPREE) a (9.80) Sireg SpA GFRP 0.010 Balafas (2012) FiBRA 0.055 Balafas (2012) a personal communication
Thus, a comprehensive understanding of the creep and relaxation behavior
of BFRP under prestress is critical for the application of BFRP as prestressing reinforcement and enhancing its utilization efficiency in construction.
In case of components, the polymer matrix of an FRP material consists of a resin binder and normally some fillers and additives. Primarily, the matrix has to bind the fibers together, provide lateral support to the fibers, protect the fibers from their surroundings and may beneficially influence some FRP material pro-perties. Polymer matrix materials are highly viscoelastic. Upon loading, they exhi-bit elastic deformations, while under constant load, slow viscous deformations occur. At increased temperature, long-term loading, their response tends to be more ductile, while low temperature results in a rigid and brittle behavior.
Epoxy resins are more expensive than polyesters and vinyl esters but are largely used in high-performance composites as they have the best mechanical properties, adhesion properties and excellent resistance to chemicals. Some typi-cal properties of polymer matrices are given in Table 1.3 below.
For structural fiber composites, among which FRP reinforcement for con-crete, unsaturated polyester, vinyl ester, and epoxy are often used as the polymer binder. For these resins, polyesters are the most general purpose and frequently applied, given the good processability, fairly good properties, and low cost.
Table 1.3. Typical properties of resins (Triantafillou 1992)
Resin type
Tensile Strength,
MPa
Modulus of elastic-ity,
GPa
Density, kg/m3
Cure shrinkage
Polyester 35–104 2.1–3.5 1100–1400 0.05–0.12 Vinyl ester 73–81 3.0–3.5 1100–1300 0.05–0.10 Epoxy 55–130 2.8–4.1 1200–1300 0.01–0.05

18 1. REVIEW OF PHYSICAL MODELS AND STRUCTURAL TYPES OF…
Vinyl esters process essentially like polyesters but provide improved mecha-nical and chemical performance (Nanni et al. 1993).
1.2.2. Research on Fiber Reinforced Polymers Properties
In general, because the initial application of FRPs in civil infrastructure is the replacement of steel reinforcement in concrete structures under aggressive envi-ronment, the durability of FRP under high temperatures is of significant interest. Other composites like CFRP exhibits superior performance in resisting different corrosive effects, whereas the GFRP exhibits relatively weak resistance to alkali and acid (Wang et al. 2014). For the newly developed BFRP, fewer durability studies have been performed compared to other FRP composites.
Within the limited literature of the durability of BFRP, most of them empha-sized alkali resistance and moisture absorption. Few studies investigated the deg-radation of BFRP sheets under seawater and analyzed the corrosion mechanism (Wei et al. 2011, Wu et al. 2014). Pearsosn et al. (2013) investigated that reduc-tion of tensile strength of BFRP is equal or less in comparison with steel bars over long-term conditions. El Refai et al. (2013) observed good fatigue resistance of BFRP reinforcement. It was revealed in the previous studies (Wang et al. 2014) that BFRP sheets exhibited high resistance to salt corrosion. Among other corro-sive environments, the degradation of BFRP bars shall still be further investigated.
Because the differences between FRP sheets and bars not only lies in the production technology but also in the matrix types (epoxy to vinyl ester), relevant forming temperatures and fiber volume fraction, those differences can impact the degradation behavior of BFRP under corrosive environments.
Fig. 1.7. Experimental testing equipment: tension – tension test of glass composite bar (Atutis et al. 2015) (a); creep test of basalt composite bar (Banibayat 2015) (b); tensile
test setup for aramid fiber reinforced polymer bar (Zou 2003) (c)
1. REVIEW OF PHYSICAL MODELS AND STRUCTURAL TYPES OF… 19
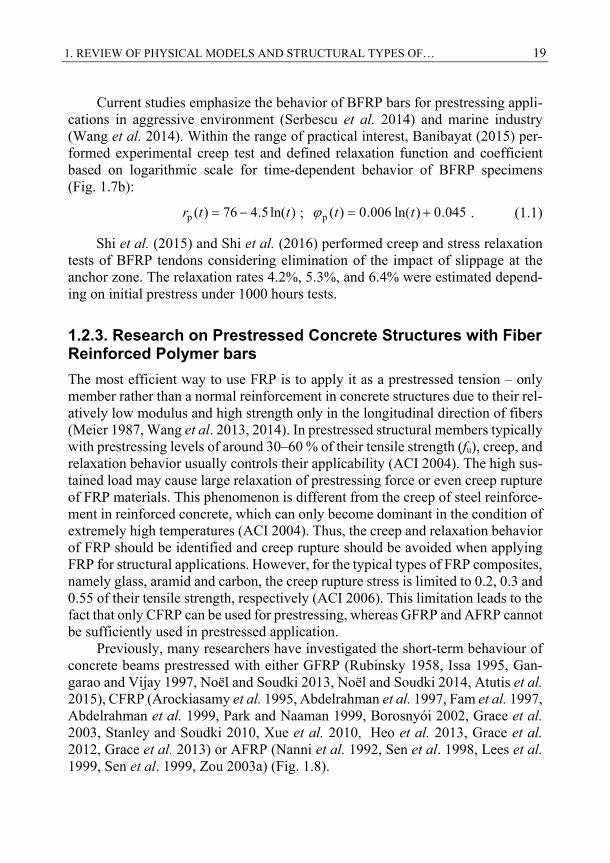
Current studies emphasize the behavior of BFRP bars for prestressing appli-cations in aggressive environment (Serbescu et al. 2014) and marine industry (Wang et al. 2014). Within the range of practical interest, Banibayat (2015) per-formed experimental creep test and defined relaxation function and coefficient based on logarithmic scale for time-dependent behavior of BFRP specimens (Fig. 1.7b):
)ln(5.476)(p ttr ; 045.0)ln(006.0)(p tt . (1.1)
Shi et al. (2015) and Shi et al. (2016) performed creep and stress relaxation tests of BFRP tendons considering elimination of the impact of slippage at the anchor zone. The relaxation rates 4.2%, 5.3%, and 6.4% were estimated depend-ing on initial prestress under 1000 hours tests.
1.2.3. Research on Prestressed Concrete Structures with Fiber Reinforced Polymer bars
The most efficient way to use FRP is to apply it as a prestressed tension – only member rather than a normal reinforcement in concrete structures due to their rel-atively low modulus and high strength only in the longitudinal direction of fibers (Meier 1987, Wang et al. 2013, 2014). In prestressed structural members typically with prestressing levels of around 30–60 % of their tensile strength (fu), creep, and relaxation behavior usually controls their applicability (ACI 2004). The high sus-tained load may cause large relaxation of prestressing force or even creep rupture of FRP materials. This phenomenon is different from the creep of steel reinforce-ment in reinforced concrete, which can only become dominant in the condition of extremely high temperatures (ACI 2004). Thus, the creep and relaxation behavior of FRP should be identified and creep rupture should be avoided when applying FRP for structural applications. However, for the typical types of FRP composites, namely glass, aramid and carbon, the creep rupture stress is limited to 0.2, 0.3 and 0.55 of their tensile strength, respectively (ACI 2006). This limitation leads to the fact that only CFRP can be used for prestressing, whereas GFRP and AFRP cannot be sufficiently used in prestressed application.
Previously, many researchers have investigated the short-term behaviour of concrete beams prestressed with either GFRP (Rubinsky 1958, Issa 1995, Gan-garao and Vijay 1997, Noël and Soudki 2013, Noël and Soudki 2014, Atutis et al. 2015), CFRP (Arockiasamy et al. 1995, Abdelrahman et al. 1997, Fam et al. 1997, Abdelrahman et al. 1999, Park and Naaman 1999, Borosnyói 2002, Grace et al. 2003, Stanley and Soudki 2010, Xue et al. 2010, Heo et al. 2013, Grace et al. 2012, Grace et al. 2013) or AFRP (Nanni et al. 1992, Sen et al. 1998, Lees et al. 1999, Sen et al. 1999, Zou 2003a) (Fig. 1.8).

20 1. REVIEW OF PHYSICAL MODELS AND STRUCTURAL TYPES OF…
Fig. 1.8. Experimental works of prestressed concrete members with: glass composites (Atutis et al. 2015) (a); carbon composites (Mertol et al. 2007) (b); carbon composites
(Abdelrahman et al. 1999) (c); bridge model with carbon composites (Grace et al. 2013) (d)
In case of long-term behavior, much less experimental research was carried out (Bryan et al. 1996, Zou 2003b, Karbhari et al. 2007) with regard to the analysis of serviceability and resistance of aggressive environmental conditions.
1.2.4. Rheological Models of Viscoelastic Materials
Based on rheology it is possible to consider the phenomenological approach of developing a constitutive model for linear viscoelasticity. Steel at elevated tem-peratures, concrete, and polymers are examples of viscoelastic behavior (Reddy 2013). The mathematical models of the viscoelastic constitutive behavior help en-giners analytically or numerically determine the mechanical system response. Vis-coelastic materials have a time-dependent stress response and even may have per-manent deformation. The viscoelastic response characteristics of a material are determined often using creep or stress relaxation tests and dynamic response to loads varying sinusoidally with time. The creep test involves determining the strain response under constant stress, and it is done under uniaxial tensile stress owing to its simplicity. Application of a constant stress σ0 produces a strain that, in general, contains three components: 1) an instantaneous; 2) plastic; and 3) de-layed reversible components:

1. REVIEW OF PHYSICAL MODELS AND STRUCTURAL TYPES OF… 21
00
)()(
t
tJt ; 0p0 )()( trEt , (1.2)
where J∞σ0 is the instantaneous component of strain; η0 is the Newtonian viscosity of the composite material; and ψ(t) is the creep function. The relaxation test in-volves the determination of stress under constant strain. Application of a constant strain ε0 produces stress that contains two components: E0 is the static elastic mod-ulus; and rp(t) is the relaxation function.
A qualitative understanding of the actual viscoelastic behavior of materials can be gained through spring-and-dashpot models. For a linear response, combinations of linear elastic springs and linear viscous dashpots are used. Two simple spring-and-dashpot models are the Maxwell model and the Kelvin-Voigt model (Malkin 1994, Bareišis 2003, Reddy 2013). The Maxwell model character-izes a viscoelastic fluid while the Kelvin-Voigt model represents a viscoelastic solid. Other combinations of these models are also used. Based on rheological models it is possible to consider intermediate models of materials which are be-tween solid and Newtonian fluid mechanics. The word viscoelastic is derived from the words “viscous”+ “elastic”; a viscoelastic material exhibits both viscous and elastic behavior. One can build up a model of linear viscoelasticity by considering combinations of the linear elastic spring and the linear viscous dash-pot; the dash-pot is a piston-cylinder (damper) arrangement, filled with a viscous fluid, a strain is achieved by dragging the piston through the fluid.
Considering the first model, which consists of an elastic spring element in series with a dash-pot element (Fig. 1.9a). One can divide the total strain into one for the spring ε1 and one for the dash-pot ε2. This model draws attention that nature consists of the bodies that connect elasticity and viscosity.
Fig. 1.9. Spring and dash-pot models: Maxwell element (a); the generalized Maxwell model (b); Kelvin-Voigt element (c); The generalized Kelvin-Voigt model (d);
Three-element models (e, f); Four-element models (g, h)

22 1. REVIEW OF PHYSICAL MODELS AND STRUCTURAL TYPES OF…
Solids that suddenly deformed exhibit elastic behavior and deformation size is proportional to the load (Hooke‘s law). To the contrary, under slow deformation, the velocity of deformation of the solid is proportional to the value of the load (Newton‘s law).
The stress-strain relation for the model is developed using the following stress-strain relationships of individual elements:
εkσ ; .
εησ , (1.3)
where k is the spring elastic constant, η is the dash-pot viscous constant, and the superposed dot indicates time derivative.
It is understood that the spring element responds instantly to stress, while the dash-pot cannot respond instantly due to its response is rate dependent. Note that when elements are connected in series, each element carries the same amount of stress while the strains are different in each element. Thus, it can be written as:
.
.
1 2 k
. (1.4)
Once this system is loaded, at first spring element deforms and the rest of loading belongs to the flow of viscous fluid in the cylinder. Maxwell model con-siders only Hooke‘s elastic deformation and does not determine the elastic defor-mation of the polymer due to the straightening of macromolecules (Lemini 2014). Also, time is important in order to cause mentioned deformation. Such “delayed” deformation (strain) shall be described based on Kelvin‘s proposal below (Figs 1.9c– 1.9d).
The Kelvin-Voigt element (Fig. 1.9d) consists of a linear elastic spring and element in parallel with a dash-pot element. One can divide the total stress into one for the spring σ1 and one for the dash-pot σ2. The stress-strain relation for the model is derived as follows:
t
kd
d21
. (1.5)
It is assumed that fluid is compressed in damper thus instantaneous load does not cause any of deformation in the viscous element. Elastic deformation appears after some time necessary for the displacement of the damper. Theories based on Maxwell and Kelvin-Voigt models compared with experimental work results shown that both models qualitatively reflect to the behavior of polymers. The first one better describes properties of linear polymers while the second one more be-longs to the polymers with a mesh type structure.

1. REVIEW OF PHYSICAL MODELS AND STRUCTURAL TYPES OF… 23
There are two three-element models proposed in the literature (Figs. 1.9e and 1.9f). In the first one an extra spring element is added in series to the Kelvin-Voigt element, and in the second one, a spring element is added in parallel to the Max-well element. The four-element models (Figs. 1.9g–1.9h) have constitutive rela-tions that involve second-order derivatives of stress and strain (Thien 2013). For-nůsek et al. (2009) successfully performed experimental tests of GFRP prestressed slabs from the micro level point of view. In order to calculate the stress relaxation of the tendons two parallel Kelvin’s chains viscoelastic model was as-sumed: one chain was used for glass fiber and the second was used for the matrix. Nanoindentation method was employed in order to determine the modulus of elas-ticity of both components. From the prestressed concrete point of view, more rig-orous models, such as Ross’s (Freudenthal et al. 1958) have been used to assist in approximately simulating the stress-strain-time behavior of concrete at the limit of proportionality with some limitations and predicting the creep strains (Nawy 2003).
1.3. Effects in Aging Linearly Viscoelastic Materials
There are quite many examples of viscoelastic materials with memory. As it was aforesaid concrete together with polymers (composites) are examples of viscoe-lastic behavior materials (Reddy 2013; Brinson&Brinson 2015). The mathemati-cal models of the viscoelastic constitutive behavior are needed to analytically or numerically determine the structural system response in order to better understand and design of structures. According to linear theory of viscoelasticity the general formulation of the uniaxial strain-stress law of concrete drives to an integral form which is very complex from computational point of view, so that simplified mod-els or approximate formulations of the integral form are great of interest, in order to obtain approximate results sufficiently refined for practical purposes without performing cumbersome structural calculations (Pisani 2000, Balevičius 2010, Balevičius et al. 2018).
In order to design PC elements, the value of effective prestressing force shall be known. There are several conditions such as materials used, fabrication prac-tices and methods which cause the force in the prestressing reinforcement to de-crease from initial force transferred by the jacking system. In general, prestress losses are defined as the reduction in the tensile stress in prestressing reinforce-ment. According to literature, they are categorized as either instantaneous losses or time-dependent losses (Lin et al. 1981, Collins et al. 1991, Kaklauskas et al. 2001b, Navrátil 2006, Marčiukaitis et al. 2007, Gilbert et al. 2011, Ghali et al. 2012, Marčiukaitis 2012, Marčiukaitis et al. 2013, Bažant et al. 2013, Gilbert et al. 2017). Instantaneous losses are affecting the prestress force as soon as it is

24 1. REVIEW OF PHYSICAL MODELS AND STRUCTURAL TYPES OF…
transferred to the concrete member at time t0 and may vary along the length of reinforcement. With respect to Eurocode 2 (CEN 2004) and fib Model Code 2010 (fib 2013) these losses are the difference between the force imposed on the tendon by the hydraulic jack Pmax and the force in the tendon immediately after transfer at a distance x from the active end of the reinforcement Pm0(x) as shown in Fig. 1.10:
)()( 0mmaxi xPPtP . (1.6)
During the time 0tt :
)()( pm.0p0m xAxP . (1.7)
The remaining losses occur gradually with a design life of PC element. These include losses caused by the gradual shortening of concrete at the prestressing reinforcement level due to creep and shrinkage and relaxation of the reinforce-ment. If we assume that Pm.t(x) is a force in the prestressing tendon at x from the active end of the prestressing reinforcement after all losses, then:
)()()( m.t0mrsc xPxPtP . (1.8)
Mean value of prestress force at time period 0tt due to the type of method of prestressing shall be estimated:
)()()( rsc0mm.t tPxPxP . (1.9)
Fig. 1.10. Dependence of prestress force over the time by stretching reinforcement
between the bulkheads according to CEN 2004 and fib 2013
Time
Prestress force
Pmax
Pm0(x)
Pm.t(x)
ΔPµ(x)
ΔPr(tp,t0)
ΔPc+s+r(tq,tp)
ΔPel
t0 tp t
StrechingPrestress release
Actual time

1. REVIEW OF PHYSICAL MODELS AND STRUCTURAL TYPES OF… 25
Due to the fact that both immediate and time-dependent losses consist of sev-eral components Eq. (1.7) shall be expanded:
PxPPPPxP )()( μrelmax0m , (1.10)
where ΔPel – elastic deformation losses; ΔPr – intrinsic relaxation losses; ΔPµ(x) –
losses due to friction at any distance x from the jacking end; P – losses due to change in temperature.
Until about 25 years ago, a pilot knowledge and research contained little cov-erage of prestressing polymers and composites for concrete structures (Zavadskas 1974; Valivonis 1995; ACI 440.4R 2004; fib 2013). In case of the losses predic-tion methods for FRPs have been developed over the last years, but simple, prac-tical solutions for accurate estimation of prestress losses have proved difficulties due to lack of successful experimental work results on a different kind of FRP.
The accurate estimation of losses requires more precise knowledge of mate-rial properties as well as the interaction between creep, shrinkage of concrete and the relaxation of the reinforcement. The current methods for the prediction of losses shall be classified according to their approach for the calculation of losses.
In terms of losses of stress in FRP tendons, the American Concrete Institute (ACI 440.4R 2004) and European regulations whether Comité Euro-International du Béton (CEB), European Committee for Standardization (CEN) and Fédération Internationale du Béton (fib) do not specify particular formulas for the prestress losses caused by major types of FRP relaxation, the Canadian Network of Centres of Excellence on Intelligent Sensing for Innovative Structures (ISIS) does, in par-ticular to AFRP and CFRP. The values of stress relaxation proposed in these reg-ulations are based on experimental test results (Odagiri et al. 1997; Dolan et al. 2000).
Looking to the Table 1.4 and Table 1.5 it is obvious that, current recommen-dations are not valid for calculation of prestress losses in flexural PC members due to stress relaxation of BFRP prestressing bars since they are based on steel tendon tests.
Table 1.4. Stress relaxation rates, %
Design Code AFRP BFRP CFRP GFRP
CEN 2004 – – – – ACI 440.4R 2004 6–18 – 2–8 – ISIS 2008 6–18 – 1.04–3.59 – fib 2013 11–25 – 2–10 4–14

26 1. REVIEW OF PHYSICAL MODELS AND STRUCTURAL TYPES OF…
Table 1.5. Formulas of stress relaxation in the bars
Reference Formula Conditions
CEN (2004)
5)1(75.0
10007.6
1000pi
pr 1039.5
te
5)1(75.0
10001.9
1000pi
pr 1066.0
te
Class 1 Relaxation loss (15.5–23.3%)
Class 2 Relaxation loss
(2.5–6.1%) 5)1(75.0
10008
1000pi
pr 1098.1
te Class 3
Relaxation loss (6.2–12.1%)
ISIS (2008)
)log(88.238.3pi
pr t
)log(345.0231.0pi
pr t
AFRP
CFRP
Sen et al. (1992) 5.1)24log(75.0
100pi
pr t
GFRP
Saadatmanesh and Tannous (1999)
up0
up0
p0
pr
/
)log(/
f
tbaf
CFRP
The loss of stress in a prestressing reinforcement occurs not only from rein-
forcement relaxation, but also from the losses due to concrete creep, shrinkage and elastic shortening, and these, in turn, reduce the relaxation of the tendon. Structural concrete member under stress continues to deform over a period of time due to the property of creep and steel under strain continues to lose stress over a period of time due to the property of relaxation. In addition, concrete shrinks due to loss of water as a result of drying and hydration. All these effects lead to losses of prestress over time, and this has to be taken into account within structural cal-culations.
Let the concrete beam be prestressed with the force at prestress transfer of P0 applied at an eccentricity of e. The compressive stress in concrete at the centre of the tendon will be given by:
I
eeP
A
P0
0c , (1.11)
where A and I are the area and the second moment of area of the beams cross-section.
The compressive concrete strain will be given by:

1. REVIEW OF PHYSICAL MODELS AND STRUCTURAL TYPES OF… 27
)(cm
cc tE
, (1.12)
where Ecm(t) is the secant modulus of elasticity of concrete at the time of prestress transfer and since stressing in prestressed concrete is done prior 28 days it shall be recalculated as below (CEN 2004):
cm28
3.0
cm28
cmcm
)()( E
f
tftE
. (1.13)
Here Ecm28 and fcm28 are elastic modulus and compressive strength at the age of 28 days.
If prestressing is applied prior 28 days after concrete hardening, the compres-sive strength of concrete at the age of t days shall be recalculated as below:
cm28cccm )()( fttf ;
2
1
cc28
125.0exp)(t
t , (1.14)
here βcc(t) is a coefficient which depends on the age of the concrete; t is the age of concrete in days.
Further, since prestressing reinforcement is fully bonded to concrete, the compressive strain in reinforcement is equal to the strain in concrete, and the com-pressive stress in prestressing reinforcement shall be given by:
cp ; )(
1)( cm
p2
0
cm
pcppp tE
E
I
Ae
A
P
tE
EE
. (1.15)
In case of elastic loss of force in the tendon shall be given as:
A
A
tE
Ee
I
APA
tE
Ee
I
P
A
PAPi
p
cm
p2p0p
cm
p200pp )(
1)(
. (1.16)
With respect to time-dependent losses, is the secant modulus of elasticity of concrete at the time of prestress transfer Ecm(t) is going to be replaced by the long-term Young’s modulus allowing creep deformation Ecm(t)/φ, where φ is the creep coefficient.
Moreover, the loss of prestress due to creep could be expressed as:
0pcm
p200c )(
PAtE
Ee
I
P
A
PP
; (1.17)

28 1. REVIEW OF PHYSICAL MODELS AND STRUCTURAL TYPES OF…
A
A
tE
Ee
I
A p
cm
p2
)(1
.
The loss due to concrete shrinkage and relaxation of the tendon:
pcss AEP p ; pprr AP . (1.18)
The loss due to creep strain due to permanent service loads which cause ten-sile stresses in concrete at the centroid of the tendon:
)(cm
pc.extc.ext tE
EP . (1.19)
The final losses due to mentioned time-dependent effects above:
pcm
pc.extprcsrsc )(
AtE
EEP p
. (1.20)
Considering the force at the bulkheads (prestressing bed) at the time of trans-fer, the prestress force including final losses shall be defined as:
rsc0maxm.t PPPP . (1.21)
Assuming 0m.t PP , and solving for 0P :
1rscmax
0
PPP . (1.22)
Thus Eq. (1.17) can be rewritten into absolute value:
11
rscmaxrsc
rscmaxrsc0
PPP
PPPPP . (1.23)
The numerator can be written as:
pprpcspcm
pc.ext
2max
)(1 AEA
tE
E
I
Ae
A
P
. (1.24)
Setting, that:
c.ext
2max
c.QP 1
I
Ae
A
P. (1.25)

1. REVIEW OF PHYSICAL MODELS AND STRUCTURAL TYPES OF… 29
It is possible to obtain final losses of prestress in the tendon due to concrete creep and shrinkage as well as relaxation of the tendon:
1
)(cm
pc.QPprpcs
prsc
tE
EE
AP . (1.26)
Eurocode 2 (CEN 2004) express slightly simplified equation to Eq. (1.26) as shown in Table 1.6.
In order to perform time-dependent losses due to creep and shrinkage of con-crete according to Eurocode 2 (CEN 2004), the total shrinkage strain εcs and creep coefficient φ(t,t0) shall be defined at certain time periods, i.e. at the time of pre-stress transfer (short-time) and the time between prestress transfer and applied service load (long-term).
Hence the value of total shrinkage strain εcs and related factors follow from:
cacdcs ; cd.0hsdscd ),( ktt ;30s
ssds
04.0)(
)(),(
htt
tttt
; (1.27)
RH6
cm.0
cmds2ds1cd.0 10exp11022085.0
f
f; (1.28)
3
0RH 155.1
RH
RH ; )(caasca ; (1.29)
6ckca 10)10(5.2)( f ; )2.0exp(1 2
1
as t , (1.30)
where εcd, εca, εcd.0 are the drying shrinkage strain, the autogenous shrinkage strain, and the basic drying shrinkage strain; kh is a coefficient depending on the notional size h0 which shall be defined as h0 = 2Ac/u; Ac is the concrete cross-section area, and u is the perimeter of that part of the cross-section which is exposed to drying, and t, ts are the age of the concrete at the moment considered, and the age of con-crete at the beginning od drying shrinkage (or swelling), in days. Coefficients εds1, εds2 depends on the type of cement; RH is the ambient relative humidity and RH = 100%; fcm, fck are the mean compressive strength of concrete (MPa) and characteristic compressive cylinder compressive strength (MPa), fcm = 10 MPa.
The creep coefficient ),( 0tt shall be calculated accordingly:
),(),( 0c00 tttt ; (1.31)
)()( 0cmRH0 tf ; 2130
RH1.0
100/11
h
RH ; (1.32)

30 1. REVIEW OF PHYSICAL MODELS AND STRUCTURAL TYPES OF…
Table 1.6. Formulas of time-dependent prestress losses
Reference Formulae CEN (2004)
),(8.0111
),(8.0
02cp
c
p
c
p
cm
p
QPc,0cm
pprpcs
rsc
ttzI
A
A
A
E
E
ttE
EE
.
Zamblauskaitė (2005) Karbhari (2007)
),( sshps ttE .
)(),( 0c0crps tttE .
prp
sccI
pscAprsc
1
kh
kr
kykE
Balevičius (2018)
),(),( 00ξpc ttCttE .
sh0shp0cps ),((),( kttyttE top .
Pisani (2000)
pp0rsc D
)],(),(),(),([),(),(1
1),(]1),()[1(),(]1),([),(
0p0p0c0cp0c0c
0c0cp0p0pp
p
pp
ttttttttDtttt
ttttDttttD
E
ttr
)],(),(),(),([),(),(1
),(),(1),(
),(),(
0p0p0c0cp0c0c
p
0p0ppp
p
pppp
ttttttttDtttt
E
ttttttr
E
ttrttr
.
effcm28
2
ccm28pp
ppp
11
/1
IE
e
AEAE
AED
cm
cm16
)(f
f ; 20.00
01.0
1)(
tt
;
0
00c
)(),(
tt
tttt
H ; (1.33)
33018
H 1500250)012.0(15.1 hRH ; (1.34) 7.0
cm1
35
f ;
2.0
cm2
35
f ;
5.0
cm3
35
f , (1.35)
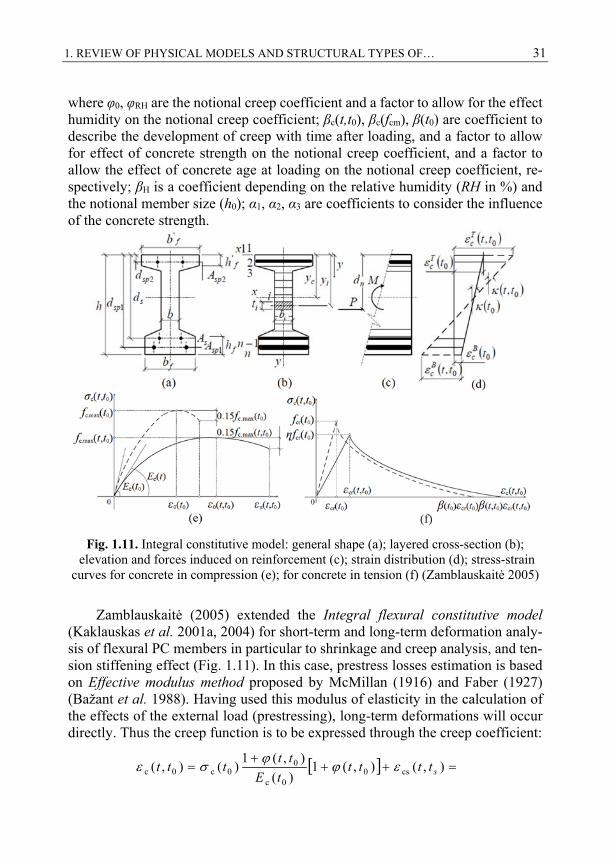
1. REVIEW OF PHYSICAL MODELS AND STRUCTURAL TYPES OF… 31
where φ0, φRH are the notional creep coefficient and a factor to allow for the effect humidity on the notional creep coefficient; βc(t,t0), βc(fcm), β(t0) are coefficient to describe the development of creep with time after loading, and a factor to allow for effect of concrete strength on the notional creep coefficient, and a factor to allow the effect of concrete age at loading on the notional creep coefficient, re-spectively; βH is a coefficient depending on the relative humidity (RH in %) and the notional member size (h0); α1, α2, α3 are coefficients to consider the influence of the concrete strength.
Fig. 1.11. Integral constitutive model: general shape (a); layered cross-section (b);
elevation and forces induced on reinforcement (c); strain distribution (d); stress-strain curves for concrete in compression (e); for concrete in tension (f) (Zamblauskaitė 2005)
Zamblauskaitė (2005) extended the Integral flexural constitutive model (Kaklauskas et al. 2001a, 2004) for short-term and long-term deformation analy-sis of flexural PC members in particular to shrinkage and creep analysis, and ten-sion stiffening effect (Fig. 1.11). In this case, prestress losses estimation is based on Effective modulus method proposed by McMillan (1916) and Faber (1927) (Bažant et al. 1988). Having used this modulus of elasticity in the calculation of the effects of the external load (prestressing), long-term deformations will occur directly. Thus the creep function is to be expressed through the creep coefficient:
),(),(1)(
),(1)(),( cs0
0c
00c0c stttt
tE
ttttt

32 1. REVIEW OF PHYSICAL MODELS AND STRUCTURAL TYPES OF…
),(),(
)(cs
0c.eff
0cstt
ttE
t ; (1.36)
),(1
)(),(
0
0c0c.eff tt
tEttE
. (1.37)
Eqs. (1.36) and (1.37) state, that the effective modulus of elasticity is related to sustained actions that maintain a constant value of stresses with time. Based on this proposal the cross-section of PC element is divided into a number of horizon-
tal layers and longitudinal strain ),( 0ci tt is to be estimated as:
),(1
),(),( 00c0ci ttr
ytttt itop , (1.38)
where yi is the distance of the i-th layer from the top fiber of the cross-section.),( 0c tttop , 1/r(t,t0) are the top fiber strain and curvature, respectively, and are
obtained from the expressions in Table 1.7. Considering these values, the losses due to creep and shrinkage can be estimated based on expressions in Table 1.6.
Later, Karbhari et al. (2007) presented a method to calculate the long-term prestress losses in PC flexural members with either CFRP or AFRP reinforcement. This method states that in PC member, the two ends of the prestressing tendon constantly move forward each other because of creep and shrinkage of concrete, thereby reducing the tensile stress in the tendon. In this case, a reduced relaxation value pr (Ghali 2012) and dimensionless coefficient χr as proposed by Saadat-
manesh et al. (1999) for AFRP tendon is equal to much less initial stress and is given by:
prrpr ;
d))5()(1(
)5()1(1
0
''
r
ba
ba ; (1.39)
03.0)1(' a ; 23
027.0)1('
b ; (1.40)
03.0 a ; 23
27.0
b ; p0
prrsp.c )(
t
, (1.41)
where λ = σp1/fpu; σp1 is the stress in the tendon 1 hour after the release of stress. Ratios σp1/ σp0 in the tests varied between 0.91 and 0.96 with the average 0.93; a, a’, b, b’ are tabulated variables given for λ = 0.4 and λ = 0.6; ζ is a dimensionless time function defining the shape of the tendon stress-strain curve; Ω is the ratio of the difference between the total stress losses Δσc+s+r and intrinsic relaxation Δσpr(t) to the initial stress σp0. This method differs from the one proposed by

1. REVIEW OF PHYSICAL MODELS AND STRUCTURAL TYPES OF… 33
Zamblauskaitė (2005) due to the principle of the effective modulus of elasticity and consideration of prestressing reinforcement relaxation.
Based on this method, in order to define the artificial restraining force, ΔN and related moment ΔM, the elastic modulus of the concrete is transferred to as age-adjusted modulus of concrete and given by:
),(1
)(),(
0
0c0c.eff
tt
tEttE
. (1.42)
Eq. (1.42) is defined from well known Age-adjusted effective modulus method proposed by Trost (1967) (Bažant et al. 1988). Considering the aging co-efficient χ(t,t0), the Eq. (1.36) shall be rewritten as:
),(1)(
)()(
)(
),(1)(),( 0
0c
0cc
0c
00c0c tt
tE
tt
tE
ttttt
)(
)()(
),(
)(
0c.eff
0cc
0c.eff
0c
tE
tt
ttE
t . (1.43)
This method is related to the case of variable stresses between σc(t0) and σ(t0). Finally, the strain and curvature are obtained from the expressions based on Ghali’s (2012) equations (Table 1.7). Considering Fig. 1.12 it is obvious, that in comparison with steel bars, FRP bars (due to lower modulus of elasticity) pro-duced less time-depending prestress losses. Also, based on the tests of AFRP bars, it shows that AFRP bars produced stress relaxation at the beginning of the pre-stress. Contrary, steel bars produce the same amount of stress relaxation at the level of prestress greater than 50%.
Fig. 1.12. Effect of creep and relaxation on time-dependent losses in prestressed
concrete member with aramid, carbon composites and steel tendons (Karbhari 2007)
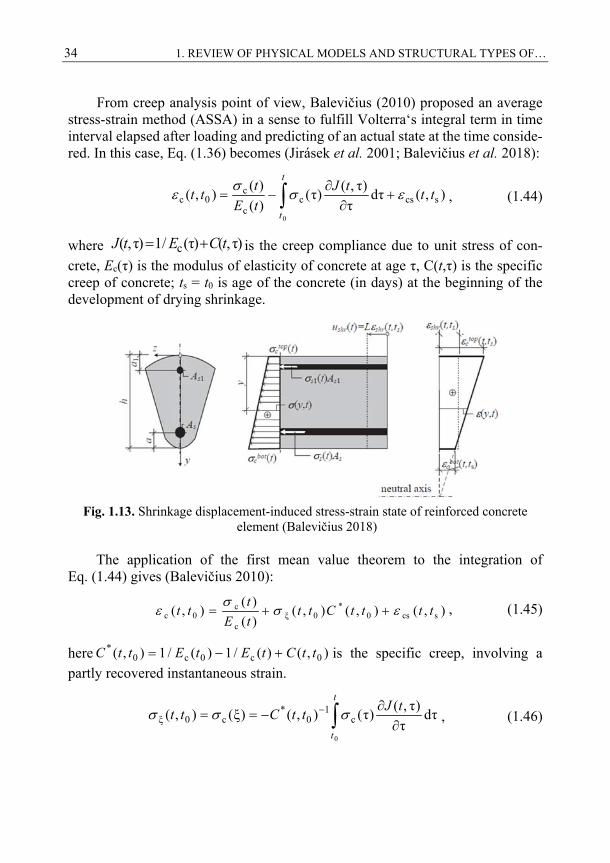
34 1. REVIEW OF PHYSICAL MODELS AND STRUCTURAL TYPES OF…
From creep analysis point of view, Balevičius (2010) proposed an average stress-strain method (ASSA) in a sense to fulfill Volterra‘s integral term in time interval elapsed after loading and predicting of an actual state at the time conside-red. In this case, Eq. (1.36) becomes (Jirásek et al. 2001; Balevičius et al. 2018):
),(dττ
)τ,()τ(
)(
)(),( scsc
c
c0c
0
tttJ
tE
ttt
t
t
, (1.44)
where )τ,()τ(/1)τ,( c tCEtJ is the creep compliance due to unit stress of con-crete, Ec(τ) is the modulus of elasticity of concrete at age τ, C(t,τ) is the specific creep of concrete; ts = t0 is age of the concrete (in days) at the beginning of the development of drying shrinkage.
Fig. 1.13. Shrinkage displacement-induced stress-strain state of reinforced concrete
element (Balevičius 2018) The application of the first mean value theorem to the integration of
Eq. (1.44) gives (Balevičius 2010):
),(),(),()(
)(),( scs0
*0ξ
c
c0c ttttCtt
tE
ttt
, (1.45)
here ),()(/1)(/1),( 0c0c0* ttCtEtEttC is the specific creep, involving a
partly recovered instantaneous strain.
dττ
)τ,()τ(),()ξ(),(
0
c1
0*
c0ξ
tJttCtt
t
t
, (1.46)
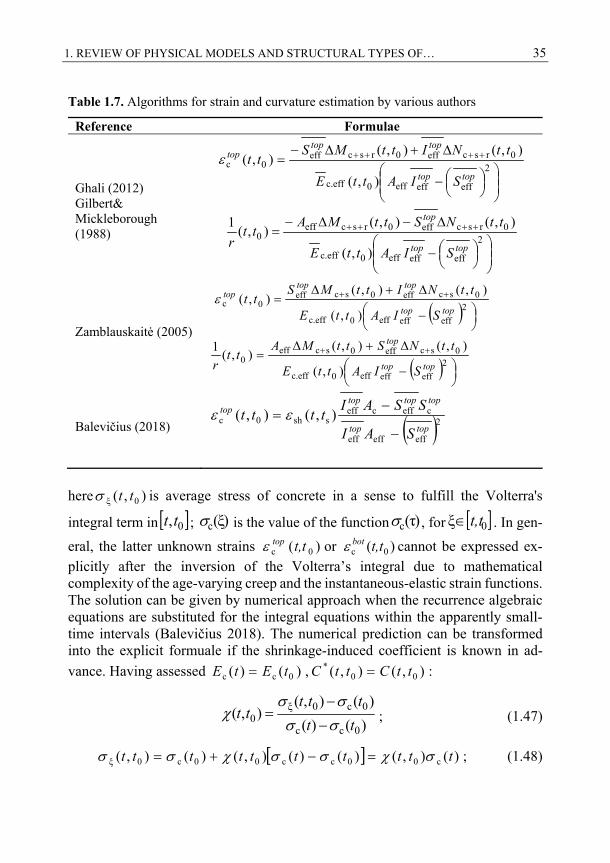
1. REVIEW OF PHYSICAL MODELS AND STRUCTURAL TYPES OF… 35
Table 1.7. Algorithms for strain and curvature estimation by various authors
Reference Formulae Ghali (2012) Gilbert& Mickleborough (1988)
2
effeffeff0c.eff
0rsceff0rsceff0c
),(
),(),(),(
toptop
toptoptop
SIAttE
ttNIttMStt
2
effeffeff0c.eff
0rsceff0rsceff0
),(
),(),(),(
1
toptop
top
SIAttE
ttNSttMAtt
r
Zamblauskaitė (2005) Balevičius (2018)
2
effeffeff0c.eff
0sceff0sceff0c
),(
),(),(),(
toptop
toptoptop
SIAttE
ttNIttMStt
2
effeffeff0c.eff
0sceff0sceff0
),(
),(),(),(
1
toptop
top
SIAttE
ttNSttMAtt
r
2effeffeff
ceffceffssh0c ),(),(
toptop
toptoptoptop
SAI
SSAItttt
here ),( 0ξ tt is average stress of concrete in a sense to fulfill the Volterra's
integral term in 0,tt ; )ξ(c is the value of the function )τ(c , for 0ξ t,t . In gen-
eral, the latter unknown strains )( 0c t,ttop or )( 0c t,tbot cannot be expressed ex-plicitly after the inversion of the Volterra’s integral due to mathematical complexity of the age-varying creep and the instantaneous-elastic strain functions. The solution can be given by numerical approach when the recurrence algebraic equations are substituted for the integral equations within the apparently small-time intervals (Balevičius 2018). The numerical prediction can be transformed into the explicit formuale if the shrinkage-induced coefficient is known in ad-
vance. Having assessed )()( 0cc tEtE , ),(),( 00* ttCttC :
)()(
)(),(),(
0cc
0c0ξ0 tt
ttttt
; (1.47)
)(),()()(),()(),( c00cc00c0ξ tttttttttt ; (1.48)

36 1. REVIEW OF PHYSICAL MODELS AND STRUCTURAL TYPES OF…
)](),(),(1[)(
)(),( 0c00
0c
c0c tEttCtt
tE
ttt
),(),(
)(),( scs
0c.eff
cscs tt
ttE
ttt
. (1.49)
In order to perform the estimation of losses in stress of the tendon (Table 1.6)
within definition of unknown strains )( 0c t,ttop or )( 0c t,tbot (Table 1.7) Bale-vičius (2018) have been used age-adjusted modulus based on AAEM approach proposed by Trost (1967) and later proved the results based on basic equilibrium by Gilbert et al. (1988) (Balevičius 2010).
Pisani (2000) proposed a general method (GM) for both the cross-section analysis and losses in the stress of PC flexural members with AFRP tendons. This is based on a visco-elastic constitutive law from continuum mechanics. It was as-sumed that both, concrete and AFRP are made as the visco-elastic hereditary ma-terial. Thus, the viscoelastic constitutive law of mentioned materials are written in the forms:
),()τ,(),,τ(d),(),,(),,( 0shcc0c0cc
0
tttJyxttJyxtyxtt
t
; (1.50)
t
t
tJttJtt0
)τ,()τ(d),()()( ppj0p0pjpj . (1.51)
Due to McHenry superposition principle:
),()(),()()τ,()τ(d),()( 0p0pj0pppjppj0pp0ppjpj
0
ttJtttJttJttJtt
t
t
t
tJ0
)τ,()τ(d ppj , (1.52)
here εpj(t) is the total strain, that is the sum of the compatible strain; Jp(t,t0) is the creep function of AFRP; tp is the age of the concrete (in days) immediately prior cut loose of the bars from the bulkheads; tp0 is the age of concrete (in days) due to streching of the bars.
Whereas to determine the stress distribution in the PC cross-section a Vol-terra integral equation by means of numerical integration over each time interval shall be solved. At the same time the algebraic method transforming the Volterra integrals into algebraic formulas by means of the assumption that the stress-de-pendent axial strain εp(t) – εn(t) at time t can be approximated by a linear function of the relaxation coefficient of the AFRP material:

1. REVIEW OF PHYSICAL MODELS AND STRUCTURAL TYPES OF… 37
Fig. 1.14. Comparison of numerical output (Pisani 2000) and experiments: numerical
relaxation rate versus experimental (a); Load-deflection curve: numerical versus experi-mental by Arockiasamy et al. (1995) (b)
),()(
)()()( 0p1
0p
0pnp tt
tE
ttt
, (1.53)
here εp(t) is a generic strain of AFRP tendon; εn(t) is a stress-independent inelastic strain; ε1 is an unknown term; φp(t) = b[24(t – t0)]a is the relaxation coefficient, where a = 0.21, b = 4.38×10⁻².
In spite of crude approximation, the solution for losses in the stress of PC member with AFRP tendons was proposed in particular to the algebraic equation which allows to overcome the problem of computing the Volterra integrals that affect common structural analysis, once the aging or relaxation coefficients of both concrete and tendons are available (Table 1.6).
1.4. Deflection Control
European regulation CEN (2004), fib (2013) present empirical method of calcu-lation of the member stiffness (EI) taking into account gross and cracked sections of the reinforced concrete element. At the gross section linear elastic behavior is typical for both concrete and reinforcement, while after cracking tension force in the section belongs to reinforcement:
III )/1()/1)(1()/1( rrr , (1.54)
here (1/r)I and (1/r)II are the curvatures at gross (uncracked) and cracked sections, respectively.
With respect to prestressed concrete, gradual value of deflection can be cal-culated in regard to the equation below:
csqp , (1.55)

38 1. REVIEW OF PHYSICAL MODELS AND STRUCTURAL TYPES OF…
here – δp is a camber due to prestressing force; δq is a deflection due to applied external load; δcs is a deflection due to shrinkage of concrete. A coefficient ζ is the interpolation factor which refers to the tension stiffening effect and can be de-fined:
2
a
cr1
M
M . (1.56)
The cracking moment Mcr is determined from elastic flexure formula and Ma represents the applied service load moment at which deflection is being calcu-lated. The factor β refers to the type of the applied load (in case of short-term loading, long-term and cyclic loading β belongs to 1 and 0.5, correspondingly).
In accordance with ACI 440.4R (2004) a modified Branson‘s equation is pro-posed in order to predict the short-term deflection of FRP prestressed beams as follow:
gcra
crgd
a
cr 1 IIM
MI
M
MI
mm
e
, (1.57)
where Ig is the gross moment of inertia; βd is a factor to soften the effective mo-ment of inertia in order to get more suitable correspondence to experimental re-sults.ACI Commity 440 recommends to use such formula βd = 0.5[Ep/Es+1]. Ep is the modulus of elasticity of FRP tendons; Es is the modulus of elasticity of steel, and Icr is the cracked moment of inertia.
Table 1.8. Proposals for effective moment of inertia estimation by various authors
Reference Formulae Bischoff (2005) Ghali (1993) ISIS (2008)
2acrg
cracrc
cre
/)1(1/1 MMI
II
MM
II cr
)](/5.01[ crg2
acrcr
crge
IIMMI
III
Toutanji et al. (2000)
gcra
crgd
a
cr 1 IIM
MI
M
MI
mm
e
sp /106 EEm , 3.0/ sp EE
1. REVIEW OF PHYSICAL MODELS AND STRUCTURAL TYPES OF… 39
In common, a value of 3 for the power m shall be used for conventional re-inforcement matters. For the same type of FRP Toutanji et al. (2000) suggested to take into account m = 6 – 10ρEp/Es when ρEp/Es<0.3. With respect to full-scale studies by Bischoff (2005) and Bischoff et al. (2011) it was found that the ratio Ig/Icr has an impact to accuracy of the original Branson’s equation (Table 1.8) for effective moment of inertia and tension stiffening effect depends on the power m and ratio Ig/Icr, and is overestimated for values Ig/Icr>3 when m is equal 3. Yost et al. 2003 indicated that power m should be used higher than 3 for FRP reinforce-ment. The factor βc represents tension stiffening and is assumed to equal Mcr/Ma. Also, based on Ghali’s (1993) proposal ISIS (2008) adopted another type of for-mulae for Ie estimation (Table 1.8).
In regard to prestressed concrete, it has been observed that in order to avoid a significant overestimation of the deflection, decompression moment Mdec has to be defined as the moment that produces zero stress at the extreme fiber of the concrete section (Atutis et al. 2015):
gg
geedec yA
IPePM . (1.58)
The mathematical formulae for the mentioned parameters and the methods for structural analysis of serviceability limit state (SLS) are given in the current codes such as ACI 440.4R (2004), CEN (2004) and fib (2013). These formula-tions, which rely on traditional concepts, have the advantage of simplicity but in-volve a large degree of uncertainty. Mota et al. 2006 performed database of 197 beams analysis in order to find an accurate and conservative equation to estimate deflections of FRP reinforced concrete members. It was pointed out that there is a critical need for reliability analysis of FRP code equations (Mousavi et al. 2012). It was noted that with an increasing number of samples in the database, results change dramatically. Extensive research efforts are being done by national and international concrete community for this topic (Gilbert et al. 1988, Valivonis et al. 1995, Jokūbaitis and Kamaitis 2000, Pisani 2000, Kaklauskas et al. 2001, Zou 2003c, Balaguru et al. 2009, Ghali 2012, Mias et al. 2013, Jakubovskis et al. 2014, Mias et al. 2015), most of it motivated by prestressed concrete techniques or flexural behavior of concrete due to effect of concrete creep and shrinkage.
1.5. Cracking Control
Design code (ACI 2004) recommendations of structural concrete with various type of FRP bars indicates that calculation of the maximum probable crack width

40 1. REVIEW OF PHYSICAL MODELS AND STRUCTURAL TYPES OF…
could be based on equation independently from the type of reinforcement (steel or FRP):
322
cbp
pk 2
2 sdkEw
, (1.59)
where σp, Ep are reinforcement stress and modulus of elasticity; β is ratio of dis-tance between neutral axis and tension face to distance between the neutral axis and centroid of reinforcement; dc is the thickness of cover from tension face to center of closest reinforcement; s is spacing of the bar; kb is a coefficient that accounts for the degree of bond between FRP bar and surrounding concrete. It is indicated that kb can vary from those of steel bars or tendons (ACI 2004).
Crack width calculation according to CEN (2004) for steel reinforced con-crete members are as follows:
)( smsmr.mak xsw , (1.60)
where εsm is the mean strain in the reinforcement at design loads; εcm is the mean strain in the concrete between the cracks; sr.max is the maximum crack spacing.
Maximum spacing between adjacent cracks can be calculated by the equation below:
p.eff2br.max /425.04.3 kkcs , (1.61)
where Φ is the bar diameter; c is the clear cover to the longitudinal reinforcement; k2 is the coefficient that accounts strain distribution, with k2 = 0.5 for bending and k2 = 1 for pure tension. The difference between the mean strain in the reinforce-ment and the mean strain in the concrete may be taken as:
p
pp.effet
p
pcmsm 6.01
p.effp
ct.eff
EkE E
f
, (1.62)
where fct.eff is the mean value of the axial tensile strength of concrete at the time cracking is expected; kt is the factor that depends on the duration of loading and belongs to 0.4 and 0.6 due to long-term and short-term loading, respectively.
Experimental results by Borosnyói (2002) indicated that in the case of PC members with steel tendons stabilized of crack pattern occurs under much lower average strain of reinforcement (εsm.rn) than in PC with CFRP tendons, inde-pendently of applied reinforcement ratio due to high bond capacity of sand coated surface of CFRP tendons: εsm.rn = εsm – K·ρeff ; K is the bond parameter.
Based on fracture mechanics and experimental works Jokūbaitis et al. (2000) proposed a relation between effective prestressing force and crack width at frac-ture state:
1. REVIEW OF PHYSICAL MODELS AND STRUCTURAL TYPES OF… 41
k
cc.eff
cr
c.effk
c
cte 12
wAhSwfP
, (1.63)
here Δc is concrete constant; hcr is a depth of the flexural crack; λ is the longitudinal reinforcement coefficient. In this case, prestressing force depends on mentioned measured cracking pattern parameters and vice versa.
1.6. Conclusions of Chapter 1 and Formulation of the Objectives of the Thesis
Based on the literature review, the following conclusions can be drawn:
1. BFRP shows advantageous chemical and mechanical properties and is cost-competitive among the remaining FRPs. Therefore, the use of BFRP as a prestressing reinforcement in concrete structures is currently in the research and development phase. Like relevant FRPs, BFRP can be re-garded as a viscoelastic material, consisting of high-strength fibers inte-grated into a resin matrix, thus exhibit stress relaxation. While design codes provide particular values of stress relaxation for commonly used FRPs (aramid, carbon, and glass), stress relaxation behavior of BFRP re-mains unclear. Limited experimental relaxation tests of BFRP bars are available.
2. The comparison of existing empirical design code formulas for stress re-laxation of conventional steel and FRP reinforcements show different re-sults. With an increase of initial stress level stress relaxation increase pro-portionally from the very beginning of prestressing of FRP. In case of steel reinforcement, the same proportional increase of stress relaxation appears at the higher choice of the initial stress level. It might be con-cluded that contrary to prestressed steel bars increase of initial stress level produces more constant relaxation rate for FRPs for the same time inter-val.
3. In order to assess the effective prestress of PC members with prestressed BFRP, prestress losses should be determined appropriately. While creep and shrinkage of concrete are well documented in design codes and vali-dated with numerous experimental data, inaccurate estimation of stress relaxation of BFRP would lead to underestimation or overestimation of prestress losses.
4. Accurate estimation of prestressing is frequently associated with the serviceability of PC members. Prestressing, by itself, improves durability by preventing cracking, which in turn minimizes the penetration of water

42 1. REVIEW OF PHYSICAL MODELS AND STRUCTURAL TYPES OF…
and air. However, cracking is an inevitable and natural phenomenon even for such structures. Most of design codes and recommendations handle crack width calculation for PC members in a manner similar to that for RC members. Since the bond interface among reinforcement and concrete plays a key role in determining crack width, methods used for steel bars shall not be used for BFRP bars without the improvements from experi-mental tests.
5. The design of FRP prestressed concrete members is typically governed by serviceability limit state requirements. The lower modulus of FRP bars can lead to greater deflections. Thus calculation method to predict ex-pected deflection with a reasonably high degree of accuracy is needed. With respect to the principles of PC, the camber due to decompression force shall be estimated for the final deflection calculation. It requires re-vision of approximate methods proposed by the design codes. Stress re-laxation of BFRP, as well as creep and shrinkage of concrete, have the impact to the variation of deflection over the time. The analytical analysis shall be proved by the experimental tests. No experimental tests of prestress level effect to flexural stiffness of PC members reinforced with BFRP bars are available.
In regard to the conclusions of the literature review, the following tasks are addressed to this doctoral thesis:
1. To develop an analytical method for estimation of prestress losses by means of relaxation behavior and mechanical properties of BFRP.
2. To develop analytical methods for deflection and cracking analysis of flexural PC beams with BFRP reinforcement.
3. To perform a new experimental investigation on stress relaxation of BFRP reinforcement specimens in particular to a different level of pre-stress.
4. To perform an experimental investigation on a deflection and cracking of real scale flexural PC beams with different level of prestress under four-point bending tests.
5. To evaluate the adequacy of the developed analytical methods in compar-ison with the obtained experimental results.
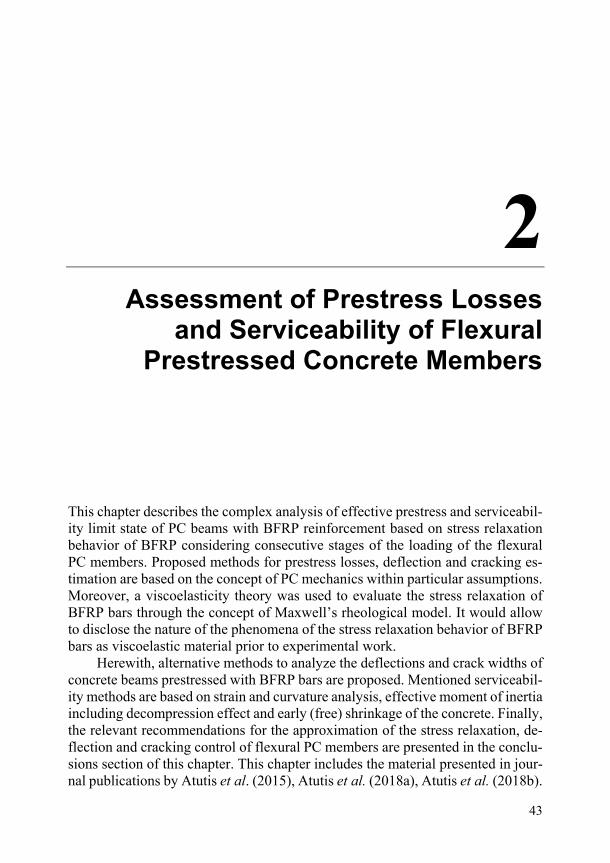
43
2 Assessment of Prestress Losses
and Serviceability of Flexural Prestressed Concrete Members
This chapter describes the complex analysis of effective prestress and serviceabil-ity limit state of PC beams with BFRP reinforcement based on stress relaxation behavior of BFRP considering consecutive stages of the loading of the flexural PC members. Proposed methods for prestress losses, deflection and cracking es-timation are based on the concept of PC mechanics within particular assumptions. Moreover, a viscoelasticity theory was used to evaluate the stress relaxation of BFRP bars through the concept of Maxwell’s rheological model. It would allow to disclose the nature of the phenomena of the stress relaxation behavior of BFRP bars as viscoelastic material prior to experimental work.
Herewith, alternative methods to analyze the deflections and crack widths of concrete beams prestressed with BFRP bars are proposed. Mentioned serviceabil-ity methods are based on strain and curvature analysis, effective moment of inertia including decompression effect and early (free) shrinkage of the concrete. Finally, the relevant recommendations for the approximation of the stress relaxation, de-flection and cracking control of flexural PC members are presented in the conclu-sions section of this chapter. This chapter includes the material presented in jour-nal publications by Atutis et al. (2015), Atutis et al. (2018a), Atutis et al. (2018b).

44 2. ASSESSMENT OF PRESTRESS LOSSES AND SERVICEABILITY OF FLEXURAL…
2.1. Approximation of Relaxation Curve
Firstly, it is assumed that relaxation is the reduction of stress over time subjected to sustained strain. With respect to the topic of this thesis, relaxation is a property of the composite prestressing reinforcement (FRP) and is independent of concrete properties, and also is defined as the loss of stress in a material held at constant length (Fig. 2.1).
Let us consider the model which consist of the elastic spring element in series with a dash-pot element (Fig 1.9a). In this case, the total strain can be divided into one for the spring ε1 and one for the dash-pot ε2. Therefore, the releation between elasticity and viscosity will be reflected by resin and fibers of linear composite (FRP). In this case, solids that suddenly deformed exhibit elastic behavior and deformation size is proportional to the load (Hooke’s law). To the contrary, under slow deformation, the velocity of deformation of the solid is proportional to the value of the load (Newton's law). It is obvious that the spring element responds instantly to stress, while the dash-pot cannot respond in the same way due to its response is rate dependent. Note that once elements are connected in series each element carries the same amount of stress while the strains are different in each element. Deformation of the composite element at any of time will be expressed below:
21
.
. (2.1)
Once the system is loaded, at first spring element deforms and the rest of loading belongs to the flow of viscous fluid in the cylinder. Only Hooke’s elastic strain will be considered, and elastic strain of the polymer due to the straightening of the macromolecules will not be determined.
Based on classical mechanics approach the elastic deformation of the spring and stresses is bounded by the Hooke’s law:
E
, (2.2)
where E is the elastic modulus of the spring. For a certain stress value, the elastic deformation suddenly appears as an
instantaneous one as the velocity of deformation variation depends on the velocity of the stress variation:
tEt d
d1
d
d 1 . (2.3)

2. ASSESSMENT OF PRESTRESS LOSSES AND SERVICEABILITY OF FLEXURAL… 45
Fig. 2.1. Stress relaxation phenomenon: variation of stress with time and maintained
strain constant thereafter (a); maintained length constant over time (b); approximation of relaxation curve at loading (c)
As mentioned earlier (Section 1.2.4), both elements of Maxwell’s model are
connected sequentially, so that the viscous element is exposed by the same stress as the elastic element. Further, according to Newton’s law, increasing strain-in-ducting the viscous solid, the velocity of the flow of high-velocity viscous solid increases proportionately:
σ = η∙ν, (2.4)
where is the viscosity of solid.
It can be assessed, that ν = dε2/dt, thus it gives:
td
d 2 . (2.5)
Further, writing the received deformation values into the equation (2.3), we deduce the differential equation for the deformation process:
tEt d
d1
d
d . (2.6)
The differential equation above allows us to describe cases of relaxation of stress in a composite polymer, when ε = const, and assuming that the stresses in FRP decrease to zero, i.e. dε2/dt = 0, then we obtain from equation (2.6):
tE
dd
. (2.7)
Time
Stress
t(a)
Relaxed stress =Δσp(τ)
τ
=ɛpEp(t0) =
ɛpr(τ,t0)
t0
=ɛpr(t,t0)
=Δσp(t)
τ2 τ3 τ4 τ5 log(t)
r(t)
=exp(-t/τ3) E3
E4
(c)
(b)
L =const
46 2. ASSESSMENT OF PRESTRESS LOSSES AND SERVICEABILITY OF FLEXURAL…
Integrating from 0 to t and from 0 to and assuming E/η = τ, we obtain:
t
0
dd
0
tE
. (2.8)
E
0lnln . (2.9)
)τ/exp()( 0 tt , (2.10)
where τ time of stress relaxation. Assuming tτ , we obtain:
1exp)( 0 t . (2.11)
According to Eq. (2.11) we get that τ shows how long the initial stresses have decreased e times. Also, equation (2.11) shows that for a very long experimental time (i.e. τt ):
exp)( 0 t . (2.12)
In this case, the stress is approaching to zero, but this phenomenon shall be confirmed by the experiments what is not common and yet not comfortable prac-tice due to specifics of required experimental equipment. Mathematically relaxa-tion curve at loading shall be approximated by a sum of exponentials (Fig. 2.1 c). Analyzing the relationship between the deformation and stress relaxation time of structural material, it can be seen that the time duration increases if the viscosity of the solid, in which the piston moves, increases, and the spring elasticity de-creases.
2.2. Losses of Prestress Model by Means of Consecutive Phases
2.2.1. General Assumptions and Basic Principles
The proposed model is based in the following assumptions: 1) instantaneous losses due to relaxation of BFRP occur at the beginning of prestress force appli-

2. ASSESSMENT OF PRESTRESS LOSSES AND SERVICEABILITY OF FLEXURAL… 47
cation (release from bullheads); 2) the cross-section of PC member remains ho-mogenous at uncracked and post-cracking behavior; 3) linear-elastic properties are assumed for non-prestressed steel and prestressing BFRP reinforcements as well as concrete; 4) plane sections remain plane and, as a consequence, the strain distribution is linear over the depth of the section; 5) perfect bond exists between the bonded reinforcement and concrete; 6) tensile stress in the concrete does not contribute to the cross-sectional properties; 7) in case of time-dependent prestress losses, stress-strain state is to be calculated based on age-adjusted effective mod-ulus method (Trost et al. 1967).
There are three critical phases of the design of PC members for serviceability. The first phase is instantaneous after the prestress is transferred to the concrete, i.e., when the member is subjected to the maximum prestress force and the exter-nal load is usually at a minimum. Instantaneous losses have taken place, but no final losses have yet occurred (Fig. 2.2).
Fig. 2.2. Proposed prestress losses model based on consecutive phases: correlation
between absolute time scale and losses due to the execution stage
Time
Stress
σmax
σm0(x)
σm.t(x)
Δσr(tp,t0)
Δσc+s+r(tq,tp)
Δσel
t0 tp tq
0tp
stretching at bulkheads
Phase
1 2
Instantaneousrelaxation prestressing
concretecasting
ts tq
concretecuring
transport and storage
load
3i
ti
tactual
Δσq(tq)
ts

48 2. ASSESSMENT OF PRESTRESS LOSSES AND SERVICEABILITY OF FLEXURAL…
Fig. 2.3. Analysis of strain in a cross-section: generic cross-section and positive M,
and y (a); strain diagram (b); an example of the cross-section (c); transformed uncracked cross-section (d)
In this case, prestress force at or immediately after the transfer is given as:
)( pppmaxm0 tAPP , (2.13)
where P0 is the initial jacking force. The instantaneous prestress change (the loss) in prestressing BFRP bar at the
time of transfer is (Fig. 2.4):
)(
1)()( p
0pp0ppp t
rytEt . (2.14)
In this respect, the cross-sectional analysis is going to be employed in order to determine two unknowns that define the strain diagram: strain ε0 at the level of the reference axis and the curvature of the cross-section 1/r0 (Fig. 2.3). The strain and stresses at any depth y below the reference axis are given by basic equations:
00
1
ry ; (2.15)
00
1
ryE . (2.16)
The stresses and its moments about the reference axis when integrating over the area give the stresses resultants:
A A A
Ayr
EAEAN d1
dd0
0i ; (2.17)
x
y
y
dA
ɛ0
ɛ
1/r0 M
(a) (b)
As1
(c)
h
as2
dp
Ap
as1 b
ap
(d)
As2
(αs2-1)As2
(αp-1)Ap
(αs1-1)As1

2. ASSESSMENT OF PRESTRESS LOSSES AND SERVICEABILITY OF FLEXURAL… 49
Fig. 2.4. Strain and stresses distribution at prestress transfer: section (a); elevation and forces induced on reinforcement (b); strain (c); stresses in concrete (d)
A A A
Ayr
EAyEAyM d1
dd 2
00i . (2.18)
When the two unknowns ε0 and 1/r0 are calculated from the Eqs. (2.15, 2.16) the internal actions are determined from the stresses using Eqs. (2.17, 2.18). This procedure forms the basis of both the instantaneous and time-dependent losses of prestress within this chapter.
For the instantaneous analysis the linear elastic stress-strain relationship of the concrete and reinforcement shall be applied:
0cc E ; (2.19)
0sisi E , (2.20)
where σc, σsi represent the stresses in the concrete, in the i-th non-prestressed rein-forcing bar (with i = 1, ..., ms).
At this stage, a BFRP bar is stretched between the bulkheads (before casting) at the prestressing bed in the form in which the concrete beam is cast. In this case, prestressing BFRP bar will be subjected to a constant strain, and the stresses in the bar will decrease with time tp to maintain the state of constant strain. This reduction in stresses is known as instantaneous relaxation Δσpr and will be derived from a relationship of the form:
pj0ppjpjpr ),( ttE , (2.21)
where φp(t,t0) is relaxation coefficient. Due to the lack of theoretical and experi-mental data it will be defined based on extensive work by Pouya Banibayat (2015):
y
As1
ɛ0(tp)
1/r0(tp)
(a) (c)
h
as2
dp
Ap
as1 b
ap
(b)
As2
xσ0(tp)
σp(tp)Ap
σs1(tp)As1
σs2(tp)As2Mi(tp)
(d)
50 2. ASSESSMENT OF PRESTRESS LOSSES AND SERVICEABILITY OF FLEXURAL…
0465.0),ln(006.0),( 00p tttt . (2.22)
Finally, stresses σpi in the j-th prestressing BFRP bar (with j = 1,...,mp) im-mediately after prestress transfer:
pr0pjpj E . (2.23)
After the concrete is hardened, the bond between reinforcement and sur-rounding concrete is established. The internal axial force and moment resisted by the component materials forming the cross-section and shall be given by equilib-rium:
c
s p
c
s p
1 1ipjpjpjsisisicc
1 1ipjpjsisicc
d,0
d,0
A
m
i
m
j
top
A
m
i
m
j
MAyAyAyM
NAAAH
. (2.24)
The internal axial force Ni and moment Mi shall be expressed in terms of the actual geometry and elastic modulus of the materials forming the cross-section:
0
1pjpj
1sisicmci
ps
m
j
m
i
EAEAEAN
pps
1prpj
01pjpjpj
1sisisicmc
1m
j
m
j
m
i
Ar
EAyEAyES ; (2.25)
0
1pjpjpi
1sisisicmci
ps
m
j
m
i
EAyEAyESM
pps
1prpjpj
01pjpj
2pj
1sisi
2sicmc
1m
j
m
j
m
i
Ayr
EAyEAyEI . (2.26)
In addition, due to aforesaid general assumptions, the cross-sectional proper-ties will be calculated by transforming the section into equivalent areas of the constituent materials. In this case, both reinforcements Asi and Apj will be transformed into equivalent areas of concrete:
As.eff = αsiAsi; Ap.eff = αpjApj, (2.27)

2. ASSESSMENT OF PRESTRESS LOSSES AND SERVICEABILITY OF FLEXURAL… 51
where αsi = Esi/Ecm is the modular ratio of the i-th steel bar; and αpj = Epj/Ecm is the modular ratio of the j-th prestressing BFRP bar (Fig. 2.3).
The computation of axial and flexural stresses in a PC section due to pre-stressing, and external loads and moments, requires a determination of the area, and the moment of inertia (second moment of area) of the section. The other properties frequently used to facilitate the computation of stresses are determined from these basic properties.
It is assmed that the top fiber of the cross-section is the reference axis. The area, the first moment and the second moment of the transformed area about men-tion reference axis at prestress transfer tp will be calculated from:
ps
1pipi
1sisig0 )1()1(
m
i
m
i
AAAA ; (2.28)
pi1
pipi1
sisisicg0
ps
)1()1( yAyAyASm
i
m
i
top
; (2.29)
2pi
1pipi
1
2sisisi
2cgg0
ps
)1()1( yAyAyAIIm
i
m
i
top
. (2.30)
From structural mechanics point of view, Eqs. 2.17, 2.18 could be written in the matrix form:
HER , (2.31)
where R is a vector of stresses resultants; H is area property matrix of the cross-
section; is strain distribution vector. The general form shall be written as:
0
0
2i
i
/1dd
dd
rAyAy
AyAE
M
N , (2.32)
where dA is the elemental area.
Eq. (2.32) can, therefore, be refined in the more general form:
pp 0
0
00
00cm
i
i
/1t
top
toptop
top
t rIS
SAE
M
N
. (2.33)
From Eqs. (2.32, 2.33) strain, curvature and the stresses at the top fiber im-mediately after prestress transfer tp:

52 2. ASSESSMENT OF PRESTRESS LOSSES AND SERVICEABILITY OF FLEXURAL…
2
000pcm
pi0pi0
0
2
00
pi0
0pi
pcmp0
)(
)()()()(
)(
1)(
toptop
toptop
top
top
top
top
top
SIAtE
tMStNI
I
SA
tMI
StN
tEt ; (2.34)
2
000pcm
pi0pi0
0
2
00
pi0
0pi
pcmp
0 )(
)()()()(
)(
1)(
1toptop
top
toptop
top
SIAtE
tNStMA
A
SI
tNA
StM
tEt
r. (2.35)
Stresses in the concrete are to be defined by replacing Eq. (2.35) into Eq. (2.19):
2
000
pi0p0p0
)()()(
toptop
topi
toptop
SIA
tMStNIt . (2.36)
Prior application of Eq. (2.34–2.36), we shall combine stresses resultants with prestressing forces into equivalent normal force and a moment:
)()()(
)()()(
pprpjpjpjpjpi
pprpjpjpi
tequivalent
equivalent
ptyAytPtM
tAtPtN
M
N
, (2.37)
where the subscript j refers to the j-th prestressing BFRP bar and ypj is its distance below the reference axis. In case of stresses, resultants are known, the instantane-ous axial strain and curvature at prestress transfer are given by:
equivalent
1
00
00
pcm
t0
0
)(
11
p
M
N
IS
SA
tEr
toptop
toptop
. (2.38)
Having inverted 2x2 matrix Eq. (2.38) is to be refined:
equivalent00
00
2
000pcmt0
0
)(
11
p
M
N
AS
SI
SIAtErtop
toptop
toptop
top. (2.39)

2. ASSESSMENT OF PRESTRESS LOSSES AND SERVICEABILITY OF FLEXURAL… 53
Fig. 2.5. Changes caused by creep, shrinkage, and relaxation after a lifetime of prestress: section (a); elevation and forces induced on reinforcement (b); strain (c); stresses in
concrete (d)
The second phase is reflected to the final losses that took place when the full-service load is applied to the flexural PC member (Fig. 2.5). In example, at time tp when the prestressing force is at a minimum, and the external service load is at a maximum.
The prestressing force at this phase is referred as the effective prestress. Men-tioned prestress force after the design life of prestressing ( pq tt ) shall be defined
as:
)( qppm0mt tAPP , (2.40)
where Δσp(tq) is the final losses in prestressing BFRP bar. In order to define the final prestress losses the time analysis of the cross
section will use the age-adjusted effective modulus method (AEMM) together with a relaxation approach. The change of strain in the top fiber and the change of the curvature through the duration of prestressing are calculated using the equi-valent properties of the age-adjusted transformed section.
Let us refine the Eq. (2.39) accordingly:
M
N
AS
SI
SIAtErtop
toptop
toptop
top
effeff
effeff
2
effeffeffpc.efft0
0
)(
11
q
, (2.41)
where effA , topSeff , topIeff are the area of the age-adjusted transformed section and its first and second moment about an axis through the top fiber. In the prestress losses
y
As1
Δɛ0(tq)Δ1/r0(tq)
(a) (c)
h
as2
dp
Ap
as1 b
ap
(b)
As2
xΔσ0(tq)
σp(tq)Ap
σs1(tq)As1
σs2(tq)As2Mi(tq)
(d)

54 2. ASSESSMENT OF PRESTRESS LOSSES AND SERVICEABILITY OF FLEXURAL…
procedure, the strain state is assumed to be held constant through the prestressing time period.
If the total strain is held constant and the strain of creep and shrinkage of the concrete change, then the instantaneous component of strain shall also change by an equal and opposite amount. As the instantaneous strain varies, so the concrete stresses do too so. The concrete stresses on the cross-section are, therefore, al-lowed to vary due to relaxation. As a result, the internal actions vary, and equilib-rium is not maintained. An axial force ΔN and bending moment ΔM as a sum of three terms shall be applied to the cross-section to restore equilibrium:
rsctq
M
N
M
N
M
N
M
N. (2.42)
If the creep were free to occur, the axial strain and curvature would increase over the prestressing time period (tq – tp) by the amounts φ(tq,tp)ε(tp) and φ(tq,tp)1/r(tp). The forces and moments necessary to prevent these deformations shall be determined by:
qt0
0
cc
ccpqc.eff
c
1),(
rIS
SAttE
M
Ntop
toptop
top , (2.43)
where cA , topSc , topIc are the area of the concrete and its first and second moment about an axis through the top fiber. The forces and moments necessary to prevent shrinkage are:
qc
ccsc.eff
s t
topS
AE
M
N
, (2.44)
where εcs is the free shrinkage over the prestressing time period (tq – tp). The forces and moments necessary to prevent the strain due to stress relaxa-
tion of prestressing BFRP bar are:
qprpipi
prpi
r tyA
A
M
N
. (2.45)
The change of both the strain and stresses in the top fiber as well as the change of the curvature through the duration of prestressing are calculated:

2. ASSESSMENT OF PRESTRESS LOSSES AND SERVICEABILITY OF FLEXURAL… 55
2
effeffeffqc.eff
qeffqeffq0
)(
)()()(
toptop
toptoptop
SIAtE
tNItMSt ; (2.46)
2
effeffeffqc.eff
qeffqeffq
)(
)()()(
1
toptop
top
SIAtE
tMAtNSt
r; (2.47)
2
effeffeff
peffpeffq
)()()(
toptop
toptoptop
SIA
tMStNIt . (2.48)
The resultants of the creep and shrinkage induced internal restraining forces on the concrete and stress relaxation on the BFRP bar are an increment of the axial force and an increment of the moment about the reference axis:
)(
1)(),([)( p
0cp0cpqc.effrscq t
rStAttENNNtN toptop
)(])( qprpicqsh tAAt ; (2.49)
prpipicqcsq0
cq0cpqc.effq ])()(1
)(),([)(
yAStt
rItSttEtM toptoptoptop ;
(2.50)
)(
1)()( q
0pq0pq t
rytEt top . (2.51)
In case of the third phase, due to some applied load cross-section is cracked. Axial force of cracked cross-section equilibrium Eqs. (2.25, 2.26) can be re-writ-ten as:
0
1 1pjpjsisi
0cmcc0cmcci
s p1 m
i
m
j
EAEAr
ESEAN
pps
1prpj
01pjpjpj
1sisisi
1m
j
m
j
m
i
Ar
EAyEAy . (2.52)
The internal moment Mi resisted by the cross-section at time tq can be ex-pressed n a similar manner.

56 2. ASSESSMENT OF PRESTRESS LOSSES AND SERVICEABILITY OF FLEXURAL…
Regarding this phase, it is assumed that the axial force and bending moment about the reference axis (Next and Mext) produce tension in the bottom of the cross section and compression at the top of the section. From this standpoint Eq. (2.52) can be expressed as:
0
1 1pjpjsisi
00cm
1prpjext
s p
cc
p
d1
m
i
m
jA
m
j
EAEAAr
yEAN
01pjpjpj
1sisisi
1ps
rEAyEAy
m
j
m
i
. (2.53)
With respect to bending moment cross section equilibrium it can be expressed:
cc
p
d1
00cm
1prpjpjext
A
m
j
Ayr
yEAyM
01
pjpj2
pj1
sisi2
si01 1
pjpjpjsisisi
1pss p
rEAyEAyEAyEAy
m
j
m
i
m
i
m
j
. (2.54)
Dividing Eq. (2.54) by Eq. (2.53) it derives:
01 1
pjpjsisi0
0cm
01 1
pjpjpjsisisi0
0cm
1prpj
1prpjpjext
s p
cc
s p
cc
p
p
d1
d1
0
m
i
m
jA
m
i
m
jA
m
j
m
j
EAEAAr
yE
EAyEAyAyr
yE
A
AyM
01pjpjpj
1sisisi
01pjpj
2pj
1sisi
2si
1
1
ps
ps
rEAyEAy
rEAyEAy
m
j
m
i
m
j
m
i
. (2.55)
Dividing the top and bottom of the right side of Eq. (2.55) by 1/r0 and also assuming that y = yn = –ε0/1/r0, the equation above for rectangular cross-section of width b becomes:

2. ASSESSMENT OF PRESTRESS LOSSES AND SERVICEABILITY OF FLEXURAL… 57
n1 1
pjpjsisi
0
ncm
n1 1
pjpjpjsisisi
0
ncm
1prpj
1prpjpjext
s pn
s pn
p
p
d
d
0 yEAEAybyyE
yEAyEAyybyyyE
A
AyM
m
i
m
j
yy
y
m
i
m
j
yy
ym
j
m
j
ps
ps
1pjpjpj
1sisisi
1pjpj
2pj
1sisi
2si
m
j
m
i
m
j
m
i
EAyEAy
EAyEAy
. (2.56)
In order to estimate yn, Eq. (2.56) may be solved by the employment of simple trial and error search. Having solved yn, the area, the first and the second moment of area of the compressive concrete above the neutral axis around the top surface of the cross-section shall be determined:
pss
1pipi
1sisi
1sisincc )()()1(
m
i
m
i
btmm
i
top AAAbyA ; (2.57)
pi1
pipi1
sisisi1
sisisi
2n
cc
pss
)()()1(2
yAyAyAby
Sm
i
m
i
btmm
i
toptop
; (2.58)
2pi
1pipi
1
2sisi
1
2sisisi
2
nn
3n
cc
pss
)()()1(212
yAdAaAy
byby
Im
i
m
i
btmm
i
toptop
. (2.59)
From notation point of view, the following sign convention were assumed in
this chapter: 1) axial force N is positive when tensile; 2) according horizontal di-rection, a bending moment M that produces tension at the bottom fiber and the related curvature 1/r0 are positive; 3) tensile stress σ and strain ε are positive; 4) the shrinkage of concrete εcs is a negative quantity; 5) the loss of tension in the prestressed bar due to stress relaxation, creep and shrinkage of concrete is gene-rally a negative quantity; 6) the number of prestressed bars (BFRP) and non-prest-ressed steel bars are denoted as mp and ms, respectively. The subscript “s” is used for steel bars and i = 1, …, ms. Likewise, the subscript “p” represents prestressed BFRP bar and i = 1, …, mp. All symbols are defined in the thesis where they first arized.

58 2. ASSESSMENT OF PRESTRESS LOSSES AND SERVICEABILITY OF FLEXURAL…
2.2.2. Calculation Algorithm
Herewith aforesaid calculation method for effective prestress force estimation in-cluding instantaneous and time-dependent losses by means of relaxation approach of BFRP is described in the flowchart as follows. This procedure forms the basis of analysis of prestress losses depending on the input data and actual phase con-sidered: instantaneous losses due to stress relaxation of BFRP at stretching (tp – t0); time-dependent losses (tq – tp); and applied external short-term static ser-vice loading (tq).
Fig. 2.6. Calculation algorithm for instantaneous losses of prestressed bars
at prestress release from bulkheads to the concrete beam
Data: h, b, leff, asi, api, Asi, Api, Ecm, fcm, Esi, fsi, Epi, fpu, P0, M0, t0, tp, tq, ts, RH
1.1 βcc(tp), fcm(tp), Ecm(tp) Eqs.(1.13-14)
1.4αsi(tp), αpi(tp) Eq.(2.27),
A0, S0top, I0
top Eqs.(2.28-30)
1.2Instantaneous relaxation of BFRP
1.3N(tp)=P0-ΔσprAp
M(tp)=Mg-P0(h-ap)-ΔσprApyp
1.5 ɛ0(tp)top, 1/r0(tp)
top Eqs.(2.34-35)
1.6 Δσp(tp) Eqs.(2.21)
1.7Prestress force at prestress release
Pm0=P0-Δσp(tp)Ap Eq.(2.13)
φp(tp), Δσpr(tp) Eqs.(2.21-22)
+M(tq)≥Mcr
Pha
se 1
Pha
se 2
2.1 βcc(tq), fcm(tq), Ecm(tq) Eqs.(1.13-14)
2.2 ɛcs(tq), φc(tq), φp(tp) Eqs.(1.13;1.27;1.31)
2.3 Ec.eff(tq) Eq.(1.42)
2.4αsi(tq), αpi(tq) Eq.(2.27),
Aeff, Sefftop, Ieff
top Eqs.(2.28-30)
2.5ΔNc(tq)+ΔNs(tq)+ΔNr(tq) Eqs.(2.43-45) ΔMc(tq)+ΔMs(tq)+ΔMr(tq) Eqs.(2.49-50)
2.6 Δ ɛ0(tq)top, Δ 1/r0(tq)
top Eqs.(2.46-47)
2.7 Δσp(tq) Eqs.(2.51)
2.8Effective prestress force
Pmt=Pm0-Δσp(tp)Ap Eq.(2.40)
No
3.1 yn Eq.(2.56)
Yes
3.2 Acc, Scctop, Icc
top Eqs.(2.57-59)
3.3Steps
2.6, 2.7, 2.8
Pha
se 3

2. ASSESSMENT OF PRESTRESS LOSSES AND SERVICEABILITY OF FLEXURAL… 59
2.3. Analysis of Serviceability Behaviour
2.3.1. Proposal for Deflection Analysis
In many PC structures, it is unlikely that the service load will be applied during the design life of the structural member. It is, therefore, reasonable to design PC members in such a way that cracking will occur under full-service load. The cal-culation of the deflection becomes a matter of practical importance due to a potential reduction of flexural stiffness after cracking that may result in an in-crease of deflection, but which still may be sufficient to exceed the acceptable serviceability limit state.
From a regulation point of view, the flexural stiffness of PC member can be taken into account in the estimation of deflection either by the well-known effec-tive moment of inertia, originally developed by Branson (1968) (ACI 440.4R 2004) or by CEN 2004 and fib 2013 proposals based on effective elastic modulus of concrete approaches.
Fig. 2.7. Typical variables of components of flexural prestressed concrete member:
elevation and forces induced on reinforcement (a); strain distribution depending on each stage (b); moment-deflection diagram (c)
From PC point of view, a major assumption that signifies the transition be-tween the performance of the member complying with principles of PC and the principles of RC will be explained.
Let the parameters 00 /1, rtop define the initial strain distribution in a PC
cross-section, and the section is subjected to a normal force N combined with a moment M at the top fiber producing cracking. At some point, the stress in con-crete is zero at the extreme fiber, but not in prestressing reinforcement due to decompression effect (Fig. 2.7). Thus, the strain parameters due to N, M are the sum of the strain parameters due to decompression forces N, Mdec and those due to cracking forces N, Mcr. The values of former ones are equal and opposite to
y
(a)
x
σp(tq,tp)Ap
σs1(tq,tp)As1
σs2(tq,tp)As2Mi(tq,tp)
Deflection
Moment
Prestress only(c)
EIg
cracking
1 2 3 4
(b)
Mmaxdecompression
EIcr
Mdec
Max. service load
ɛp
ɛs1
ɛs2
1-Mdec 2-Mcr 3-4Mpost.cr

60 2. ASSESSMENT OF PRESTRESS LOSSES AND SERVICEABILITY OF FLEXURAL…
the resultants of stresses σc(t) on the concrete and α times this stress on prest-ressing reinforcement. The decompression forces are given by:
p0
0
00
00
dec /1t
top
toptop
top
rIS
SA
M
N
. (2.60)
Also, the cracking forces will be:
deccr p
M
N
M
N
M
N
t
, (2.61)
where p
, tMN is taken from Eq. (2.33).
Hence the total strain at the midlength cross–section is determined as the sum of strains due to decompression forces and the strain due to cracking forces:
0
0
dec0
0
mid0
0
/1/1/1 rrr
toptoptop , (2.62)
where 00 /1, rtop is given by Eq. (1.54) (CEN 2004), but in the more general form:
II0
0
I0
0
0
0
/11
/1/1 rrr
toptoptop
. (2.63)
In general, taking into account such approach would lead to risk mitigation with respect to deflection analysis of BFRP-PC flexural members in order to avoid overestimation or underestimation of deflection values by design code provisions.
From proposed model point of view (Section 2.2.2), algorithm of deflection calculation would depend on the phase considered: 1) in case of decompression (tp), curvature to be calculation from Eq.2.35 (step 1.5); 2) under applied load (tq), the curvature to be calculated through the step 2.6 from Eq. 2.47. The final deflection shall be estimated as the sum of the members depending on actual phase (cf. Eq. 1.55). According to Gribniak et al. (2013) deflection shall be estimated with respect to curvature assessed and in general form:
200/1 lrk , (2.64)
where k is the factor due to the type of loading; l0 is the effective span of the beam.

2. ASSESSMENT OF PRESTRESS LOSSES AND SERVICEABILITY OF FLEXURAL… 61
2.3.2. Proposal for Calculation of Crack Width
Cracking is an inevitable and natural phenomenon in RC and even in PC flexural members. The check of crack width can be performed either in a simplified way through the verification of the requirements stated in the appropriate design codes or through a direct calculation.
In general, the calculation of crack width for PC structural members follows the procedure and the formulas given for RC members in Chapter 1.5, but this approach might not reflect to the prestress force effect. Basically, the crack width could be determined from the difference between the strain in the reinforcement and the strain in the concrete between cracks:
dxwS
r
cxsxk , (2.65)
where sr is the distance between the adjacent cracks while εsx, εcx are the real strains in the reinforcement and concrete along the length x, respectively.
From PC element point of view, let us assume that εsx = εp(tq) having assessed Δσc+s+r (tq) as per Eq. (2.51). Also, due to decompression force effect εcx = εp.dec. In this case, εp.dec is the strain in prestressing tendon starting from the state of decom-pression immediately prior to initiation of the first crack.
Fig. 2.8. Force and strain distribution at the stabilized cracking phase:
under initial prestress (a); under service load (b); force resultant distribution (c); flexural element subjected to axial tension (d); transfer of load (e); strain in
reinforcement (f); strain in concrete (g)
P0
Pe
P0
Pe
N N
sr sr.max
Fc
Fs+ΔFp
Δɛpr
N
Δɛp
x ɛsm
ɛc
y ɛcm
(a)
(b)
(d)
(e)
(f)
(g)
F F
Fp
(c)
Fp
Fc Fc

62 2. ASSESSMENT OF PRESTRESS LOSSES AND SERVICEABILITY OF FLEXURAL…
In order to perform as much as the realistic behavior of flexural PC element, the last but not least parameter in Eq. (2.66) shall be taken into account is the strain of the concrete due to shrinkage εcs(tq). Therefore, Eq. (2.65) shall be re-written as:
)()()( qcspp.decqpr.maxk tttsw , (2.66)
where εp.dec(tp) shall be estimated considering Eqs. (2.34, 2.35):
)(1
)()( p0
pp0pp.dec tr
ytt top . (2.67)
Free shrinkage strain εcs(tq) shall be estimated based on Eq. (1.27). With regard to crack width estimation, the most critical issue is to calculate
maximum cracking spacing, because existing regulation formula (Eq. 1.61) be-long mostly on many empirical constants. In this case, due to decompression over the cross-section, the maximum crack spacing will be given by:
)(3/1 nr.max yhs , (2.68)
where yn is going to be estimated from Eq. (2.56). In order to use Eq. (1.61) for maximum crack spacing estimation, factor kb
shall be known since bond performance plays a key role in determining the crack width and, however, a mentioned factor might be necessary to account for the different bond characteristics of the different FRP materials. Based on experi-mental work by Atutis et al. (2017). Analysis of the impact of the factor that accounts for the degree of the bond at the interface (contact) of FRP bars and concrete. According to Eq. (1.61) this coefficient varies from 0.8 to 1.6 due to the type of reinforcement and is recommended for steel reinforcement but not taking into account FRP. In regard to Eq. (1.59) this factor varies between 0.8 and 1.4 and shall be used for FRP applications depending on the type of FRP material. Once the GFRP is used, the width of crack values are in a good agreement with experimental results when kb is equal to 0.3 based Eq. (1.61). Good agreement was found among calculated and experimental values of crack widths as well tak-ing into account Eq. (1.59) when coefficient kb is equal to 0.85. In regard to BFRP, this factor should be determined experimentally due to lack of information within scientific literature and design codes.

2. ASSESSMENT OF PRESTRESS LOSSES AND SERVICEABILITY OF FLEXURAL… 63
2.4. Conclusions of Chapter 2
Within this Chapter, the following conclusions can be drawn:
1. The constitutive equation was proposed in order to perform an evaluation of stress relaxation history at loading under ε = constant. It was observed that stress relaxation in BFRP is a manifestation of viscoelasticity and based on Maxwell’s rheological model can be mathematically approxi-mated by a sum of exponentials. Unlike design code provisions, proposed equation produces the more realistic character of stress relaxation curve by having an increasing downward slope over the times, while empirical formulas from design codes provide the straight line of FRP stress relax-ation curves. Therefore, it cannot estimate even the instantaneous stress relaxation accurately. In order to prove the proposed approach, experi-mental tests of BFRP stress relaxation are utmost important.
2. In the present work, the prestress losses (instantaneous and time-depend-ent), cross-sectional stress-strain, deflection and cracking behavior of PC members reinforced with BFRP bars are described as an interrelated pro-cess. This complex approach allows to avoid disappearing of prestressing effect, such as camber or strain of decompression, as a base point and the principle of serviceability analysis of PC members.
3. The proposed calculation method for effective prestress force takes into account stress relaxation behavior of BFRP prestressing bars that allow to evaluate prestress losses accurately depending on certain consecutive stage: BFRP stretching at the bulkhead (reaction frame); release of prestressing from the bulkhead to concrete; at external loading applied, etc. The proposed method shall be verified by experimental measure-ments.
4. The proposed calculation method for deflection estimation of PC mem-bers with BFRP tendons is based on the major assumption that signifies the transition between the performance of the member complying with principles of PC and RC members. This method provides a technique that allows to expand existing design code equations by taking into account decompression effect. Unlike this approach, proposed calculation method based on stress relaxation approach might be used as an alternative one due to aforesaid considerations. The analytical analysis shall be proved by experimental tests.
5. The proposed method for crack width analysis allows performing realistic cracking behavior of flexural PC members considering the effect of de-compression and shrinkage of concrete: a strain in prestressing tendon starting from the state of decompression immediately prior to initiation of

64 2. ASSESSMENT OF PRESTRESS LOSSES AND SERVICEABILITY OF FLEXURAL…
the first crack and strain of the concrete due to free shrinkage. This would allow to avoid calculation errors caused by many empirical constants used in a manner similar to that for formulas applicable for RC members. This analytical approach shall be granted by experimental test.
65
3 Experimental Tests and
Validation of Theoretical Models of Prestressed Elements
This chapter provides information on detailed experimental program with a major focus to perform the tests of stress relaxation of BFRP and PC beams internally prestressed with BFRP bars. A few designs of anchorage have been used, and preliminary experiments were employed in order to find a successful grip and, finally, to determine the actual tensile strength of BFRP bars. Experimental results on tests of PC beams having a certain degree of prestressing level are reported. In general, a major interest of experimental investigation was to evaluate servicea-bility conditions of PC beams internally prestressed with BFRP bars.
An experimental program was split in two parts: 1) full-scale PC beams tested under static four-point load; 2) and stress relaxation of BFRP bars with respect to the constant strain. Three levels of prestress 40%, 45% and 55% of the tensile strength was selected. Twelve PC beams (three groups of four specimens) and nine (three groups of three specimens) were examined and the results are pre-sented in the text below.
This chapter includes the material presented in journal publications by Atutis et al. (2017), Atutis et al. (2018a), Atutis et al. (2018b).

66 3. EXPERIMENTAL TESTS AND VALIDATION OF THEORETICAL MODELS OF…
3.1. Experimental Test of Basalt Fiber Reinforced Polymers Anchorage
In general, the design of suitable anchorage system either temporary or permanent presents a major difficulty for FRP bars, as the brittle reinforcement, is able to fail in the grip itself due to the combined effects of shear and compressive stress added to the tensile strength. In order to use FRP bars properly, the stress that occur in the interface between the anchorage and the bar has to be suitably managed. Con-sidering the behavior of the FRP bar, the anchorage must be durable enough. An ideal anchorage solution shall be based on gradually transmitted tension stress from the bar to grip system. Thus further experiments are utmost necessary.
Tests on three concepts were made with respect to: 1) composite grip com-mercially known as Blocking system carbo (Fig 3.1a, b). This mechanical anchor-age relies on the friction between the reinforcing bar and the inner anchorage sur-face, where compressive stress perpendicular to the bar is applied. Blocking system carbo is composed by steel barrel (class C40) ( = 60 mm) and gripping longitudinally constant cone wedges of technopolymer reinforced with glass fi-bers (density 1.64 g/cm3, tensile strength 200 MPa); 2) conical grip system (Fig. 3.1c). This system consists of longitudinally curved wedges which transfer compressive stress to the back of the anchorage, where the tensile stresses are less; and 3) straight steel tube-sleeve system (Fig. 3.1e). In this bonded anchor an outer sleeve tube surrounds a resin by bonding it to anchor the FRP bar.
The first system was delivered by the company Sireg S.p.A. (Italy), and the remaining two systems were designed and manufactured by the author at the laboratory of Vilnius Gediminas Technical University (VGTU). Conical grip sys-tem was designed of two steel elements composed by threated parts in order to turn off steel cones without interface to the surface of BFRP specimen. Turning arm was constructed in order to maintain the anchorage prior to and after the test. Steel tube system was designed and constructed based on the required anchorage length of the specimen. The system was composed of = 33.7 mm and 300 mm length steel tube (class S355) and end plates in order to keep epoxy resin and to avoid any leakage of it.
Static tension-tension tests were performed according to ACI440 (2004) re-quirements (Fig. 3.1d). Experiments have shown that considering the 1st and the 2nd concepts it was not possible to determine the tensile strength of BFRP bars due to its slippage out from griped carbon and steel wedges or failure at the anchorage – bar interface. The shear fracture was initiated and observed. While considering the 3rd concept, the tensile strength of BFRP was determined by rup-ture of the bars without any epoxy debonding (Fig. 3.2 g, h). In this case, failure occurred through plastic instability, and the fracture pattern took place in the cen-tral portion of the BFRP bar with necking of the fibers.

3. EXPERIMENTAL TESTS AND VALIDATION OF THEORETICAL MODELS OF... 67
Fig. 3.1. Anchorage types for basalt fiber reinforced polymer bars tensile strength test:
blocking system carbo (Sireg S.p.A) (a) and (b); conical grip system (Atutis et. al. 2015) (c); trial assembly of conical grip system (d); sleeve anchor (Atutis et al. 2015) (e); bar
specimens (f); tensile-tensile test of bar specimen (g); fracture pattern of the bar (h)
3.2. Experimental Test of Prestressed Concrete Beams
In general, considering previously discussed prestressing methods (Section 1.1.1), and based on experimental work regarding the anchorage above a new internal prestressing system was designed in order to construct the beams for experimental

68 3. EXPERIMENTAL TESTS AND VALIDATION OF THEORETICAL MODELS OF…
tests with respect to maintenance of the effective prestress of flexural concrete beams prestressed with BFRP bars. The principle of the system was to conduct a certain level of prestressing by means of control of prestressing force reduction and its impact to the flexural stiffness of PC beams in particular to cambers, de-flections, crack widths and expected fracture pattern (failure type).
3.2.1. Jacking Setup
Firstly, BFRP tendons were connected with pretensioning steel rebars through special coupling type mounting details with internal threads, where ends of the BFRP are anchored in the steel tubes with external threads for locknut and passes fixed reaction frame supports, casting bed and formwork on the top (Atutis et al. 2018b). Later, BFRP were jacked to the certain level of prestress by a hydraulic jack, then measured by dynamometer and released from external reaction frame to the beams. Prior to release, beam specimens have to observe minimum 70 per-cent of the concrete compressive strength and the epoxy adhesive has to be fully cured in BFRP anchors due to prestress is transferred to the RC beam based on the adhesive bond of FRP bar and anchor tube interfaced by epoxy resin. Pre-stressing force is measured and controlled by dynamometers at the end of the re-action frame. The principle of preparation of PC beams and main consecutive phases are shown in Figures 3.2 and 3.3. Specimens are divided into certain series depending on different prestress levels 40%, 45%, and 55% of the ultimate strength ffu of the BFRP bars. Later, all PC BFRP beams are to be tested based on static four-point bending scheme and results are presented further in this paper.
Fig. 3.2. Principle of fabricated beam specimens based on prestressing bed (bulkheads):
prestressing bed L = 7000 mm (a); beam specimen H×B = 300×150 mm, L = 3200 mm (b); fixed end support – bulkhead for measurement of applied load (c);
jacking support – bulkhead support frame for application of the initial prestress (d)
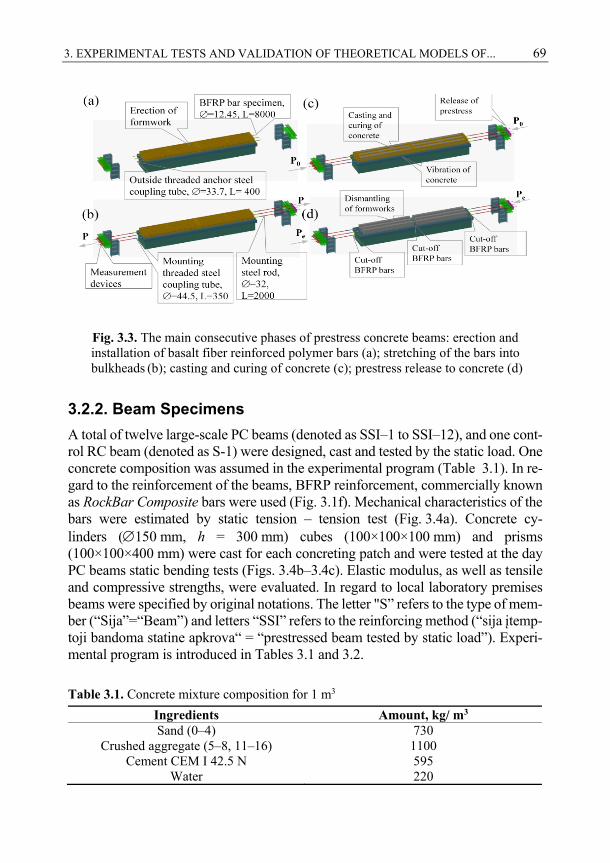
3. EXPERIMENTAL TESTS AND VALIDATION OF THEORETICAL MODELS OF... 69
Fig. 3.3. The main consecutive phases of prestress concrete beams: erection and installation of basalt fiber reinforced polymer bars (a); stretching of the bars into bulkheads (b); casting and curing of concrete (c); prestress release to concrete (d)
3.2.2. Beam Specimens
A total of twelve large-scale PC beams (denoted as SSI–1 to SSI–12), and one cont-rol RC beam (denoted as S-1) were designed, cast and tested by the static load. One concrete composition was assumed in the experimental program (Table 3.1). In re-gard to the reinforcement of the beams, BFRP reinforcement, commercially known as RockBar Composite bars were used (Fig. 3.1f). Mechanical characteristics of the bars were estimated by static tension – tension test (Fig. 3.4a). Concrete cy- linders (150 mm, h = 300 mm) cubes (100×100×100 mm) and prisms (100×100×400 mm) were cast for each concreting patch and were tested at the day PC beams static bending tests (Figs. 3.4b–3.4c). Elastic modulus, as well as tensile and compressive strengths, were evaluated. In regard to local laboratory premises beams were specified by original notations. The letter "S” refers to the type of mem-ber (“Sija”=“Beam”) and letters “SSI” refers to the reinforcing method (“sija įtemp-toji bandoma statine apkrova“ = “prestressed beam tested by static load”). Experi-mental program is introduced in Tables 3.1 and 3.2.
Table 3.1. Concrete mixture composition for 1 m3
Ingredients Amount, kg/ m3 Sand (0–4) 730
Crushed aggregate (5–8, 11–16) 1100 Cement CEM I 42.5 N 595
Water 220

70 3. EXPERIMENTAL TESTS AND VALIDATION OF THEORETICAL MODELS OF…
Fig. 3.4. Experimental tests of material properties: tension – tension test of basalt fiber reinforced polymer bars (a); cylinder compressive strength test of concrete (b); tensile
strength test of concrete prisms (c)
At the beginning of experimental program, reinforcement cages were de-signed and constructed as well as the appropriate concrete mixture was calculated. Due to the high tensile strength of BFRP bars, concrete mixture was designed for concrete strength above 40 MPa. (Table 3.1). The concrete had a 16 mm maxi-mum aggregate size. The water/cement ratio was about 0.37, and the cement con-tent was 450 kg/m3. Each beam series was split in 2 concrete batches. Twelve concrete cylinders were cast from each batch. 6 cylinders were tested in compres-sion prior release of the prestressing stress and six on the day of testing, according to CEN (2004) requirements. The elastic modulus of the concrete was evaluated on the day of testing of the beams. The average compressive strength of the con-crete ranged from 40.21 to 46.01 MPa among the beams tested.
At first, formwork and constructive steel reinforcement cages were erected (Fig. 3.5a). In order to ensure health and safety (HSE) requirements real scale testing beams were lifted from casting bed to the testing equipment place by in-stalled lifting lugs. Later, the main BFRP prestressing bars were installed, and connection details were calibrated (Fig. 3.5b). The prestressing force was applied using a hydraulic screw jack of 25-tons capacity until the required prestress level was achieved (Fig. 3.5c). The force was maintained constant after prestressing by locking nuts. The load was applied in increments using a hydraulic air pump. After prestressing, the readings of the strain gauges and the load cell were continuously recorded until the release of the prestressing force at a rate of 1 reading every 5 minutes. After prestressing of BFRP bars by a time approximately 24 hours, the concrete was cast for 6 beams at the same time. After pouring of concrete into formworks of the beams, certain concrete prisms were cast to measure shrinkage strain of the concrete (Fig. 3.5d, Table 3.3). 15 days after casting, the prestressing force was released by releasing the pressure of the hydraulic jack POWER TEAM.

3. EXPERIMENTAL TESTS AND VALIDATION OF THEORETICAL MODELS OF... 71
Fig. 3.5. Preparatory works prior experimental tests: mounting of the formworks and reinforcement cages (a); installation of prestressing reinforcement (b); mounting of
hydraulic jack (c); casting of concrete (d); visual quality inspection due to honeycombing (e); cut-off prestressing reinforcement, lifting and storage (f)
PC beams were taken out and precisely inspected in case of honeycombing, etc. After quality inspection (QA) beams were lifted by overhead crane to testing equipment place (Figs. 3.5e–3.5f).
No cracks were observed at the surface of the beams due to the lifting pro-cess. It should be mentioned that all beam series were fabricated and tested under the same loading conditions. Prestress force was released at tp = 15th day, and static four-point loading was applied at tq = 48th day after casting.

72 3. EXPERIMENTAL TESTS AND VALIDATION OF THEORETICAL MODELS OF…
Table 3.2. Main material properties of the beams
Beam h, mm
b, mm
l, mm
a1, mm
fu, MPa
εfu Ef, GPa
ρ, %
fck, MPa
Control S-1 301 149 3200 50 1098.3 0.0246 45 0.32 46.01 Series 1 SSI-1 303 150 SSI-2 300 149 3200 50 1098.3 0.0246 45 0.33 44.47 SSI-3 301 150 SSI-4 299 149 Series 2 SSI-5 300 150 SSI-6 303 152 3200 50 1098.3 0.0246 45 0.32 40.21 SSI-7 301 148 44.29 SSI-8 303 147 Series 3 SSI-9 301 151 SSI-10 302 150 3200 50 1098.3 0.0246 45 0.32 46.01 SSI-11 302 150 SSI-12 300 149
3.2.3. Experimental Test Scheme
Experimental beams were instrumented Novotechnik’s T50 linear voltage displa-cement transducers (LVDTs) with an accuracy of ±0.02% as shown in Figure 3.6, respectively. Also, LVDTs T50 were placed at the BFRP bar location of both ends of the beam to monitor any slippage during the experiment. The LVDTs and dy-namometer were connected to a laptop within automation processing equipment ALMEMO 25, and the readings were taken every 2 seconds.
The beams were tested under a static four-point loading scheme using 2 static concentrated loads, 0.96 m apart. (Fig. 3.6). The test was performed with incre-ments (5 kN) and paused for short periods to take readings of gauges and to meas-ure crack spacing and growth. Measurement base of all inductive sensors was 200 mm.
Fig. 3.6. Principal test scheme of the experimental work

3. EXPERIMENTAL TESTS AND VALIDATION OF THEORETICAL MODELS OF... 73
3.2.4. Discussion of the Test Results
In general, there is a difference of deflection measurement of PC beams in com-parison with regular RC beams. Prior load is applied PC beams exhibit camber due to initial prestress force effect (Fig. 3.7a). Increasing the load deflection varies from upwards to downwards up to failure (Fig. 3.7b). Comparative load-deflection responses for the all beams with different prestress level 40, 45 and 55 percent of fu appear in Figure 3.8 and Table 3.4. Inspection of these figures shows that the response of the BFRP prestressed beams is initially linear and tend to be identical. The linear part corresponds to the uncracked section and departures in this region due to differences in prestressing (jacking) level with respect to all beams. Once the applied load overcome the cracking load, the stiffness of the beams is being decreased.
Fig. 3.7. Deflection variation of tested prestressed concrete beams: prior loading (a);
at ultimate loading (b)
The comparaison of the experimental free shrinkage strains against the predicted ones by the Eurocode 2 (CEN 2004) method are compared in Table 3.2 below.
Table 3.3. Shrinkage strains of 100×100×400 mm prisms
Beam Time Predicted by CEN (2004)
Experimental
Series (1) SS-1÷4
t0 –1.401×10⁻⁴ –1.310×10⁻⁴ tp –2.090×10⁻⁴ –1.954×10⁻⁴
Series (2a) SS-5,6
t0 –1.364×10⁻⁴ –1.275×10⁻⁴ tp –2.072×10⁻⁴ –1.937×10⁻⁴
Series (2b) SS-7,8
t0 –1.394×10⁻⁴ –1.309×10⁻⁴ tp –2.081×10⁻⁴ –1.953×10⁻⁴
Series (3) SS-9÷12
t0 –1.425×10⁻⁴ –1.323×10⁻⁴ tp –2.110×10⁻⁴ –1.961×10⁻⁴

74 3. EXPERIMENTAL TESTS AND VALIDATION OF THEORETICAL MODELS OF…
Fig. 3.8. Experimental load-deflection curves of the series of prestressed concrete beams due to initial prestress level
Considering failure mode, all prestressed BFRP beams failed due to the rupture of the BFRP bars. Control beam S–1 failed in the compression zone due to the crushing of concrete. No slip of the BFRP bars was observed in any of the beams. Regarding beam Series 1 specimens SSI–1, SSI–2, SSI–3 and SSI–4 a midspan downward deflection at ultimate load ranged between 50.62 and 52.82 mm and it was about 1/50 of the span. Prior static loading average measured camber value was – 0.72 mm. Variation of measured cambers among beam Series 1, 2 and 3 is shown in Fig. 3.8. As it was expected no major variations regarding ultimate load neither of prestressed BFRP beams nor of beam S–1 were observed.
In case of series 2 specimens SSI–5, SSI–6, SSI–7, SSI–8 ultimate deflec-tions at midspan ranged between 43.60 to 51.15 mm, and it was about 1/55 of the member’s span. Average measured camber value was – 0.78 mm. With respect to beam Series 3 specimens SSI–9, SSI–10, SSI–11, SSI–12 ultimate deflections at midspan ranged between 36.96 and 46.05 mm or in other words, average deflec-tion of beam Series 3 was about 12 percent less in comparison with beam Series 2 specimens and 21 percent less than deflections of beam Series 1 specimens. Av-erage measured camber value of beam Series 3 was – 0.91 mm. Interestingly enough that the increase of prestressing force or jacking stress by 5 and 15 percent, correspondingly decrease ultimate deflection at midspan by 12 and 26 percent, respectively.
In regard to the type of the beam reinforcement, beam Series 1, 2 and 3 had 33, 40 and 47 percent lower midspan deflection at ultimate load than control beam S-1, respectively. This confirms the fact that prestress load released to the flexural concrete member effects member stiffness (EI), and an increase of the mem- ber stiffness can be achieved only by increasing prestressing, correspondingly
0
20
40
60
80
100
-2 13 28 43 58 73
Series (I)Ser ies (II)Ser ies (III)Control
Load, kN
Deflection, mm
0
2 0
- 2
Camber

3. EXPERIMENTAL TESTS AND VALIDATION OF THEORETICAL MODELS OF... 75
Table 3.4. Experimental values of the ultimate and serviceability limit states
Beam Cracking load, kN
Ultimate load, kN
Ultimate deflection,
mm
Failure mode
Control S-1 12.60 91.70 78.04 Crushing of concrete Series (1) SSI-1 34.50 93.22 52.82 SSI-2 34.40 89.51 53.46 Rupture of tendon SSI-3 36.20 94.17 52.16 SSI-4 34.00 93.27 50.62 Series (2) SSI-5 39.10 93.73 45.25 SSI-6 38.60 96.77 51.15 Rupture of tendon SSI-7 39.30 93.39 43.60 SSI-8 39.10 93.01 46.58 Series (3) SSI-9 43.50 93.23 40.28 SSI-10 43.00 101.1 46.05 Rupture of tendon SSI-11 42.50 93.62 36.96 SSI-12 43.50 99.81 41.65
decreasing of deflection of midspan of the uncracked and cracked sections either at serviceability or ultimate loads.
From the prestress level point of view, a midspan downward deflection at 60 percent of ultimate load (Pu.exp) of specimens SSI–1, SSI–5 and SSI–9 ranged be-tween 7.48 mm, 4.12 mm and 2.68 mm and it was less than 1/200 of the span. Similarly, specimens SSI–2, SSI–6 and SSI–10 contained 8.61 mm, 5.6 mm and 2.85 mm deflections, respectively. Beams SSI–3, SSI–7 and SSI–11 provided 9.15 mm, 5.25 mm and 3.14 mm deflections. Considering beams SSI–4, SSI–8 and SSI–12, those deflected to 6.75 mm, 5.35 mm and to 2.91 mm, accordingly whereas beam S–1 achieved 34.5 mm deflection at the same value of the load. Considering mentioned above, beams prestressed to 40, 45 and 55 percent of fu
produced 4.6, 7 and 12 times less average deflection in comparison with control beam S–1.
From cracking point of view, beams prestressed to 40 percent of fu SSI–1, SSI–2, SSI–3, SSI–4 had a cracking load (Pcr.exp) and ultimate load ratios – 0.370, 0.384, 0.384, 0.364 whereas Pcr.exp/Pu.exp of control beam S–1 was 0.137. Further, Pcr.exp/Pu.exp of series 2 specimens SSI–5, SSI–6, SSI–7, SSI–8 were 0.417, 0.398, 0.420, 0.380, respectively. Then, Pcr.exp/Pu.exp of Series 3 beams SSI–9, SSI–10, SSI–11, SSI–12 were 0.467, 0.425, 0.454, 0.436, accordingly. Particularly, the average stiffness of the group 1, 2 and 3 beams was 2.66, 2.47 and 2.24 times higher than the stiffness of beam S–1, correspondingly. This confirms the finding

76 3. EXPERIMENTAL TESTS AND VALIDATION OF THEORETICAL MODELS OF…
that such difference on the stiffness of the beams is caused due to compression stresses occurred in the tension zone of the beams by prestressing force. Hence, the increase of prestressing force by 5 and 15 percent provides 7 and 19 percent higher flexural stiffness of the beam.
The crack pattern of the tested beams is presented in Figures 3.9–3.12 where the failure cracks at the poor bending zone of each beam are visible. The crack distributions is given at the load 60 percent of Pu.exp and prestressing of 40 percent of ffu is producing a maximum crack width of 0.5 mm, and the number of cracks was not increased by increasing the rest of the load up to the failure. This stage is defined as stabilization of cracks when the number of cracks does not increase by increasing the load. Normally, at this stage 60 percent Pu.exp provides crack width 0.4 mm, and further crack width development is not in line with serviceability requirements. In regard to the rest of the beam groups, stabilization of cracks occur at higher than 60 percent of Pu.exp due to higher degree of prestressing. Increasing prestress level to 45 and 55 percent of fu it delivers consequently less number of cracks and 21 and 30 percent larger average spacing between cracks, accordingly.
It should be mentioned that the crack width was measured within the constant moment zone, and at the level of the bottom BFRP bars, 50 mm from the bottom surface of the concrete.
Table 3.5. The measured response of cracks at 60% of the ultimate load
Beam No of cracks
Maximum crack width,
mm
Average crack spacing,
mm
Maximum crack spacing,
mm Control S-1 4 2.0 313 360 Series 1 SSI-1 7 0.4 170 290 SSI-2 8 0.5 159 225 SSI-3 7 0.4 166.5 220 SSI-4 7 0.4 175 210 Series 2 SSI-5 6 0.2 203 245 SSI-6 6 0.25 200 245 SSI-7 6 0.2 208 270 SSI-8 6 0.2 200 305 Series 3 SSI-9 4 0.1 283 340 SSI-10 5 0.1 221.5 275 SSI-11 4 0.15 295 330 SSI-12 5 0.1 256 340

3. EXPERIMENTAL TESTS AND VALIDATION OF THEORETICAL MODELS OF... 77
Fig. 3.9. Cracking pattern of beam Series 1
Fig. 3.10. Cracking pattern of beam Series 2
The relationship of the maximum, minimum and average crack widths (here-inafter – wmax, wmin, wavg) for all the cracks at 60 percent of Pu.exp are shown in Figure 3.13a. The average values of the ratios wmin/ wavg and wmax/ wavg were 0.36 and 1.77, 0.76 and 1.33, 0.9 and 1.20 for the beam group 1, 2, 3, respectively. With respect to control beam S–1, ratios wmin/ wavg and wmax/ wavg were 0.72 and 1.21 and were close to the average values of the beams of Series 2. Cracking pat-tern was monitored in terms of crack width and height.
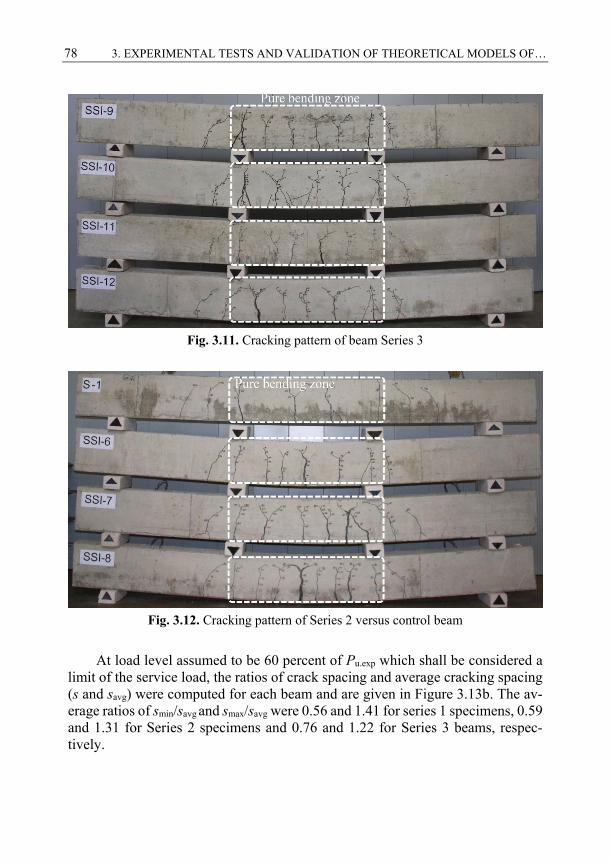
78 3. EXPERIMENTAL TESTS AND VALIDATION OF THEORETICAL MODELS OF…
Fig. 3.11. Cracking pattern of beam Series 3
Fig. 3.12. Cracking pattern of Series 2 versus control beam
At load level assumed to be 60 percent of Pu.exp which shall be considered a limit of the service load, the ratios of crack spacing and average cracking spacing (s and savg) were computed for each beam and are given in Figure 3.13b. The av-erage ratios of smin/savg and smax/savg were 0.56 and 1.41 for series 1 specimens, 0.59 and 1.31 for Series 2 specimens and 0.76 and 1.22 for Series 3 beams, respec-tively.

3. EXPERIMENTAL TESTS AND VALIDATION OF THEORETICAL MODELS OF... 79
Fig. 3.13. Variation of maximum and minimum values at serviceability state:
crack width (a); crack spacing (b)
Regarding the mentioned ratios above of control beam S–1 were 0.83 and 1.15, accordingly. A control beam S–1 had consequently larger spacing between the cracks and less variation of the crack spacing than PC (Series 1, 2 and 3).
3.3. Experimental Test of Stress Relaxation of Basalt Fiber Reinforced Polymer Bars
Once the anchorage of BFRP bars was solved, it was also possible to start with stress relaxation experimental works. As it was mentioned above, BFRPs have excellent resistance to creep, but for a prestressing tendon, relaxation is more im-portant than a creep, since relaxation reduces the available prestressing force. Es-timation of the prestress loss over time requires that stress relaxation of the tensile element shall be known. Matrix resin and fibers can be assumed as viscoelastic materials and due to time exhibit stress relaxation. BFRP is not yet included in design codes. Thus none of the codes provide significant information in order to determine the prestress losses due to stress relaxation and mechanical properties belong to scientist’s interpretation and various prognosis. Further, the author has proposed an experimental program and implemented an innovative equipment capable to sustain stress reduction under constant strain. Experimental data and results are explained below.
0
0,4
0,8
1,2
1,6
2
2,4
0 0,5 1 1,5 2
minimum
maximum
w, mm
wavg, mm
wmax = 2.07 wavg(SSI-1)
w min = 0.26 wavg (SSI-4)
wmin = 0.72 wavg (S-1)
wmax = 1.21 wavg(S-1)
(a)
0
0,4
0,8
1,2
1,6
2
0 200 400 600
s/savg
savg, mm
smax = 1.71 savg (SSI-1)
smin= 0.44 savg (SSI-2)
smin = 0.83 savg (S-1)
smax = 1.15 savg (S-1)
(b)

80 3. EXPERIMENTAL TESTS AND VALIDATION OF THEORETICAL MODELS OF…
3.3.1. Experimental Program of Testing Bars
Stress relaxation tests were conducted on modular prestress transfer system (Fig. 3.14) capable of resisting constant strain for 1000 h and more. Three sets of direct tension tests were carried out on 9 BFRP bar specimens (BP-1÷BP-9), com-mercially known as RockBar Composite bars, comprising three types of prestress force (40, 45, and 55 %) and one type of diameter ( = 12.45 mm). Each bar was provided with anchors at each end to ensure no breakage of the bar at the jaws or slippage from the grips. The anchors consisted of a threaded steel pipe filled with epoxy resins and designed according to ACI 440.3R-04 (2004). For the sake of these experiments, each specimen had separate prestress reaction frame (R-1 to R-9) as for the uniform conditions (Fig. 3.15). All tests were carried out at room temperature (20 °C±3 °C), and 40–45% relative humidity using a proposed uni-versal prestress transfer system. Most of the test specimens were exposed to a predefined environment for a period of 1000 h, which is considered long enough for stress reduction processes to stabilized and is recommended by ACI 440.4R-04 (2004) and JSCE-E 531(1995).
Fig. 3.14. Principle of stress relaxation test: reaction frame H×B = 256×310 mm,
L = 1200 mm (a); stress transfer frame H×B = 256×310 mm, L = 800 mm (b); bolts 4×M18 (c); BFRP specimen = 12.55 mm, L = 2000 mm and end anchors
= 33.7 mm, L = 350 mm (d); dynamometer ring = 170 mm (e); stress transfer rod = 12/16 mm, L = 850 mm (g); nuts 2×M33 (h);
mechanical watch-type extensometer with base 200 mm (i)

3. EXPERIMENTAL TESTS AND VALIDATION OF THEORETICAL MODELS OF... 81
Fig. 3.15. Main phases of the experimental test: connection of frames and installation of
basalt fiber reinforced polymer bar specimen (a); fixed connection and installation of transfer rod (b); prestress transfer and installation of extensometer (c);
screwed nuts and removal of the transfer frame
3.3.2. Test Specimens
All the specimens have constant = 12.45 mm and a length of 2000 mm. BFRP bars were treated by sandblasting over the length and anchored with seamless steel tubes (details “D-3” and “D-6”) with an outer = 33.7 mm and a thickness of 5 mm (Fig. 3.16). Epoxy resin was used to fill the gap between the steel tube and the BFRP bar, and the specimen was allowed to be cured for 3 (three) days to ensure that sufficient bond strength is achieved. Remaining details of prestress system are shown in Figures 3.14 and 3.16.
Fig. 3.16. Workshop details of relaxation test equipment
3.3.3. Instrumentation
A new system was developed in order to measure the load loss when strain is fixed. The prestressing load is applied through a hydraulic jack, but the jack did

82 3. EXPERIMENTAL TESTS AND VALIDATION OF THEORETICAL MODELS OF…
not prestress the specimen/anchor directly. Instead, a prestress rod which was at-tached to the anchor through the anchor connector threaded both sides seamless steel tube (detail D-2, Fig. 3.16). Further, major phases of prestress transfer were followed: mounting of flange type connection by transfer frame (R-0) and reaction frames (R-1÷R-9); installation of the BFRP specimen; screwing bolts and nuts; hydraulic jack attached, and the specimen prestressed; once actual prestress is transferred, the bolts and nuts were screwed, and transfer frame was removed. Reaction frame remains for 1,000 h test regime.
The hydraulic jack was manually controlled approximately at 5 kN/min. Then, the force was unloaded with the hydraulic jack, and the force was trans-ferred to the specimen (Figs 3.15 and 3.17).
It was very inportant to apply initial force without subjecting the specimen to any shock or vibration. The rate of loading was 200±50 N/mm2. Fixed strain after the prestress is applied to the specimen and maintaind for 120±2 sec. Records after the following times elapsed: 1, 3, 6, 15, 30, 45 minutes; 1, 1.5, 2, 4, 10, 24, 48, 72, 96, 120 hours; later, every 24 hours subsequently.
Fig. 3.17. Process of stress relaxation test: installation of hydraulic jack (a); hydraulic jack pump (b); test specimens after removal of prestressing frame (c); measurement
of prestress decrement from mechanical extensometer at dynamometer ring (d); measurement of strain by mechanical extensometer at midspan of the bar (e)

3. EXPERIMENTAL TESTS AND VALIDATION OF THEORETICAL MODELS OF... 83
3.3.4. Results of the Experimental Work
In principle, stress relaxation was not a common task because of difficulties that the strain of the specimen shall remain constant over the prestress of the specimen. In this study, experimental equipment was designed in order to measure key de-liverables: initial load at mechanical extensometer on dynamometer ring (Pdyn) and deformation of BFRP bar specimen (εb) which allows to eliminate auxiliary deformation of reaction frame and to determine the base point of pure stress re-laxation (Fig 3.18a).
Mutual relaxation was estimated by the following expression:
0
dyn0
0
e)(
P
tPP
P
P
, (3.1)
where P0 is initial prestress load; ΔPe is effective prestress force after elimination of prestress decrement at mechanical extensometer on dynamometer ring at the end of reaction frame.
Then stress relaxation rate of bar specimen was calculated:
0
bbbdyn0
0
fe)(
P
AEtPP
P
PP
, (3.2)
where ΔPf is the loss of prestress force due to the strain of the testing frame (stress relaxation equipment) due to initial prestress; Δεb is a measured strain of the BFRP bar after deformation of reaction frame; Eb is the elastic modulus of BFRP bar; Ab
is a cross section of BFRP bar. The results presented in Figure 3.18 have been obtained, highlighting a
marked regression of the strength retention of the bar axial stress over the experi-mental time interval [0, 1000 hours]:
0
dyn00
0
e0))((
P
tPPP
P
PP
. (3.3)
According to JSCE (1995) the relaxation curve shall be plotted on a semi-logarithmic graph where the relaxation value (%) is presented on an arithmetic scale on the vertical axis, and test time in hours is represented on a logarithmic scale on the horizontal axis. An approximation line shall be derived from the graph data using the least-square method:
tbaY logr , (3.4)
where Y is relaxation rate (%); a, b are empirical constants; and t is time (in hours).

84 3. EXPERIMENTAL TESTS AND VALIDATION OF THEORETICAL MODELS OF…
Fig. 3.18. Experimental test results: the principle of stress relaxation estimation
(Series 3) (a); Stress relaxation curves due to initial prestress (b)
It is also recommended that the relaxation rate after 1 million hours (approx-imately 114 years) shall be evaluated from the approximation line; this value rep-resents the million hours relaxation rate. Where the service life of the structure in which the FRP is to be used is determined in advance, the relaxation rate for the number of years of service life (“service life relaxation rate”) shall be determined. It is shown in Fig. 3.18b that the logarithm fitting curves might well represent the relation of strength reduction to aging time, in which the R2 values of the fitted curves are 0.9808, 0.9877 and 0.9896 for the BFRP bars under prestressing of 0.4fu, 0.45fu, and 0.45fu, respectively.
Table 3.6. Predicted values of the stress relaxation rate at 1000 hours
Initial stress
Series
Specimen
No.
Mean a
Mean b
Predicted load re-tention,
%
Predicted relaxation
rate, %
Mean value of
relaxation rate, %
0.4fu
BP-1 5.42 5.72 Series 1 BP-2 98.665 0.655 94.28 5.76
BP-3 5.98
0.45fu BP-4 6.01
6.04 Series 2 BP-5 99.213 0.686 93.96 6.09 BP-6 6.02
0.55fu
BP-7 6.5 6.67 Series 3 BP-8 99.178 0.863 93.33 7.1
BP-9 6.4
66
68
70
72
74
760,
00,
84,
048
,012
0,0
240,
033
6,0
528,
060
0,0
720,
088
8,0
960,
010
56,0
P dynP bar
(a)
Y1(t) = -0.686ln(t) + 99.213R² = 0.980
Y2(t) = -0.655ln(t) + 98.665R² = 0.987
Y3(t) = -0.863ln(t) + 99.178R² = 0.989
92
93
94
95
96
97
98
99
100
0 150 300 450 600 750 900 1050
Series 1Series 2Series 3
σ0-Δσe/σ0, %
Time, h
(b)
P, kN
P0
∆Pf
Pe (t)
Pb(t)
Pdyn
(t)
Time, h
Pur
e st
ress
rel
axat
ion

3. EXPERIMENTAL TESTS AND VALIDATION OF THEORETICAL MODELS OF... 85
Fig. 3.19. Experimental curves of relaxation factor: depending on instantaneous
relaxation time at certain prestress level (a); depending on prestress level at 1000 h (b)
Because the usual requirement for reliable fitting curves is that R2 should be greater than 0.95, the current fitting relationships shall be treated as acceptable. In regard to prestress force effect on the stress degradation rate, the relation of the prestressing ratios to the parameters before ln(x) is represented in Figure 3.18b. A logarithm equation is adopted to describe the relation accurately, which shows a good fit to the existing experimental data.
Relaxation curves shown in Figure 3.18b can be approximated by relaxation factor that would be used in order to verify calculation algorithm described in Section 2.2.2. In this case, it can be assumed that:
0
er
. (3.5)
Having this ratio from experimental data (Fig. 3.19a) general form depending on prestressing ratio at certain loading shall be expressed:
1)ln()0673.00929.0166.0( 2r tpp , (3.6)
where p is the prestress ratio, and t is the time period (hours). A polynomial equa-tion is adopted to describe the relation accurately, which shows a good fit to the existing experimental data (R2 is equal to 1). Eq. (3.6) allow to estimate relaxation factor that would be used in order to calculate prestress losses of PC beams based on prestress level taking into account that instantaneous stress relaxation may occur within the first 1000 h of prestressing.
φ1(t) = 0.0069ln(t) + 0.0079R² = 0.980
φ2(t)= 0.0065ln(t) + 0.0134R² = 0.987
φ3(t)= 0.0084ln(t) + 0.0096R² = 0.993
0,01
0,03
0,05
0,07
0,09
0 150 300 450 600 750 900 1050
Series 1Series 2Series 3
Δσe/σ0
Time, h
(a)
(x = t)
φr = 0.166p2 – 0.0929p + 0.0673R² = 1
0,05
0,055
0,06
0,065
0,07
0,35 0,4 0,45 0,5 0,55 0,6
Δσe/σ0
p, %
(b)
(x = p)

86 3. EXPERIMENTAL TESTS AND VALIDATION OF THEORETICAL MODELS OF…
3.4. Validation of Theoretical Predictions
This Chapter serves comparison analysis of prestress losses, deflection and crack-ing based on verification of theoretical assumptions taking into account experi-mental results of real scale PC beams and relaxation tests of BFRP specimens. The focus is to validate the accuracy of proposed calculation algorithms leading to the adequate prediction of the prestress losses and serviceability.
3.4.1. Prestress losses
This Section considers a comparative analysis of the calculated and experimental results. The difference between the methods capable to predict prestress losses is described and compared with experimental data (Fig 3.20).
Fig. 3.20. Stress distribution in prestressed basalt fiber reinforced polymer bars based on theoretical and experimental values of stress relaxation: series 1 (a); series 2 due to the
different compressive strength of concrete (b) and (c); series 3 (d)
350
400
450
500
550
0 10 20 30 40 50
c+s (No stress relaxation)c+s+r(Banibayat 2015)c+s+r(Proposed method)
σp, MPa
time, days
SSI-1..4
(a)
400
450
500
550
600
0 10 20 30 40 50
c+s (No stress relaxation)c+s+r(Banibayat 2015)c+s+r(Proposed method)
σp, MPa
time, days
SSI-5..6
(b)
400
450
500
550
600
0 10 20 30 40 50
c+s (No stress relaxation)c+s+r(Banibayat 2015)c+s+r(Proposed method)
σp, MPa
time, days
SSI-7..8
(c)
500
550
600
650
700
0 10 20 30 40 50
c+s (No stress relaxation)c+s+r(Banibayat 2015)c+s+r(Proposed method)
σp, MPa
time, days
SSI-9..12
(d)

3. EXPERIMENTAL TESTS AND VALIDATION OF THEORETICAL MODELS OF... 87
Table 3.7. Comparison of loss in stress due to calculated and experimental values of φr
Beam Series
σp0, MPa
Δσp, MPa
Δσp/σp0, %
c+s c+s+r c+s+r(exp) c+s c+s+r c+s+r(exp) SSI-1÷ SSI-4 (1) 457.8 41.44 59.05 62.91 9.05 12.89 13.74 SSI-5, SSI-6 (2) 521.0 50.97 70.97 76.98 9.78 13.62 14.78 SSI-7, SSI-8 (2) 521.0 47.45 67.50 73.50 9.10 12.96 14.11 SSI-9÷SSI-12 (3) 622.0 55.26 72.20 90.91 8.88 11.61 14.62 Note: c – concrete creep; s – concrete shrinkage; r – stress relaxation of BFRP according to Banibayat 2015; r(exp) – stress relaxation of BFRP according to present experiments
To start with, analysis on estimation of losses in stress was based on
comparison of different calculation approach of prestress losses: 1) major focus on losses due to concrete creep and shrinkage (Zamblauskaitė 2005, Balevičius 2010, Balevičius 2018); and 2) focusing on full range of prestress losses due to concrete creep and shrinkage and stress relaxation of prestressing reinforcement. Moreover, in regard to latter, the impact of instantaneous relaxation of BFRP for time-dependent losses is described further on.
From prestess point of view, Series 1 beams (prestressed to 40 percent of fu) contained 9.05% prestress losses considering concrete creep and shrinkage and 3.84% higher losses in stress including stress relaxation of BFRP based on Bani-bayat’s (2015) relaxation factor and 4.69% higher losses due to experimental value of φr (Atutis et al. 2018). Effective prestress force ranged from initial prest-ress force 55.73 kN to 50.69 kN, 48.54 kN, and 48.07 kN, accordingly. Due to mentioned above the decrease of stress in BFRP bars is shown in Figure 3.20a. Further, Series 2 beams (prestressed to 45% of fu) posse difference in losses of stress due to unlike compressive concrete strength: beams SSI-5, SS-6 contained 9.78% losses ignoring stress relaxation and 3.84% to 5% higher losses including assumed (Banibayat 2015) and experimentally gained values of φr, while beams SSI-5, SS-6 considering mentioned factors produced 3.86% to 5.01% higher losses, respectively and lead to decrease of initial stress from 521 MPa to 470 MPa with no relaxation included, from 450 MPa to 444 MPa including relaxation fac-tors, accordingly (SSI-5, SSI-6) and to 473 MPa not included relaxation, but from 453.5 MPa to 447.5 MPa including relaxation factors of BFRP in case of beams SSI-7 and SSI-8, respectively (Figs 3.20b, c). Finally, considering beam Series 3 (prestressed to 55 percent of fu) it is visible that the difference of losses in stress taking into account φr as assumed based on Banibayat’s (2015) proposal and experimentally gained φr expands to 3.01%, while considering beam Series 1 and 2 it varies from 0.85% (SSI-1÷ SSI-4) to 1.16% (SSI-5, SSI-6) and 1.15% (SSI-7, SSI-8), respectively (Table 3.7). It shall be explained based on experimental results.

88 3. EXPERIMENTAL TESTS AND VALIDATION OF THEORETICAL MODELS OF…
Fig. 3.21. Schematic relaxation behavior at different initial stress levels: regular
prestressed steel (a); theoretical relation (Banibayat 2015) (b); experimental relation (Atutis et al. 2018) (c)
Having assessed that increasing prestress level (from 40 to 45% and 55%) stress relaxation of prestressed BFRP increase and varies (depending on time) from 0.049 (at stretching) and 0.057 (at load applied) to 0.052 (at stretching) and 0.059 (at load applied), and 0.059 (at stretching) and 0.069 (at load applied), respectively (Fig. 3.21c), while φr proposed by Banibayat (2015) remains constant due prestress level and belongs to 0.04 (at stretching) and 0.047 (at load applied) (Fig. 3.21b). Lastly, in regard to beam Series 3 effective prestress force ranged from an initial value of 75.72 kN to 68.96 kN, 66.08 kN and 64.66 kN based on the same manner of comparison above.
Further, strain distribution over the cross section of beams is to be analyzed by means of comparison of calculated and experimentally measured strains of flexural PC beams described in Section 3.2. The key criteria was assumed that stress relaxation of BFRP is included into theoretical calculations. The proposed algorithm based on stress relaxation approach (Section 2.2) was applied for strain analysis of the experimental results. Average values of the strain at the top and the bottom of the cross section obtained based on effective modulus method (EMM) that was used by Zamblauskaitė (2005), and average stress-strain appro-ach (ASSA) proposed by Balevičius (2010) were assumed in the calculations. The calculated average strain of all beams have been compared with the experimental results and are presented in Figure 3.22 and Table 3.8.
The results of the average strain of PC beams cross-section show that the proposed algorithm (Section 2.2.2) based on stress relaxation of BFRP approach assures adequate estimation of the strain and good agreement with experimental values was attained.
relaxation
Stress level of no relaxation
Strain
Stress
Strain
Stress
Strain
Stress
(a) (b) (c)
Δσ p
r
Δσ p
r
Δσ p
ri
Δσ p
ri+
1
constant relaxation
relaxationvaries

3. EXPERIMENTAL TESTS AND VALIDATION OF THEORETICAL MODELS OF... 89
Fig. 3.22. Strain distribution over cross section: beam Series 1 (a); beam Series 2 (b) and
(c); beam Series 3 (d)
Table 3.8. Strain over the beam cross-section based on calculated and experimental values
Beam (Series)
F, kN
εtop ×10-3 εbtm ×10-3 Exp. EMM ASSA Author Exp. EMM ASSA Author
SSI-1÷ SSI-4
(1)
40 –1.076 –1.036 –1.094 –1.094 1.497 1.465 1.548 1.548 60 –1.232 –1.208 –1.276 –1.276 2.638 2.588 2.730 2.730 80 –1.408 –1.381 –1.458 –1.458 3.780 3.709 3.913 3.913
SSI-5, SSI-6
(2)
40 –1.218 –1.195 –1.261 –1.261 1.349 1.324 1.397 1.397 60 –1.391 –1.364 –1.440 –1.440 2.511 2.463 2.599 2.599 80 –1.564 –1.534 –1.619 –1.619 3.672 3.602 3.801 3.801
SSI-7, SSI-8
(2)
40 –1.151 –1.128 –1.128 –1.191 1.383 1.357 1.432 1.432 60 –1.325 –1.300 –1.300 –1.372 2.526 2.478 2.615 2.615 80 –1.499 –1.471 –1.471 –1.552 3.669 3.601 3.798 3.798
SSI-9÷ SSI-12
(3)
40 –1.266 –1.242 –1.242 –1.311 1.227 1.203 1.270 1.270 60 –1.439 –1.497 –1.497 –1.490 2.362 2.317 2.454 2.454 80 –1.611 –1.581 –1.581 –1.668 3.498 3.431 3.622 3.621
0,0
50,0
100,0
150,0
200,0
250,0
300,0
-2 1 4
40 kN50 kN60 kN70 kN80 kN90 kNEMM(exp)
h, mm
Strain, ×10-3
(a)41-1.5 1
yn=48.57 mm
0,0
40,0
80,0
120,0
160,0
200,0
240,0
280,0
-2 1 4
40 kN50 kN60 kN70 kN80 kN90 kNEMM(exp)
h, mm
Strain, ×10-3
(b)4 1-1.5 1
yn=53.35 mm
4
0,0
40,0
80,0
120,0
160,0
200,0
240,0
280,0
-2 1 4
40 kN50 kN60 kN70 kN80 kN90 kNEMM(exp)
h, mm
Strain, ×10-3
(c)4 1-1.5 1
yn=50.33 mm
40,0
40,0
80,0
120,0
160,0
200,0
240,0
280,0-2 1 4
40 kN50 kN60 kN70 kN80 kN90 kNEMM(exp)
h, mm
Strain, ×10-3
(d)41-1.5 1
yn=52.65 mm

90 3. EXPERIMENTAL TESTS AND VALIDATION OF THEORETICAL MODELS OF…
It was noticed that calculated strain values based on proposed algorithm as-sure from 1.6 to 3.5% higher than experimental values, while average strain esti-mated by EMM vary from 5% to 6.5% less than experimental values and thus might be underestimated that would lead to not anticipated errors. Also, the anal-ysis of strain distribution shown that average strain based on proposed algorithm is equal to the values calculated by ASSA (2010) approach, thus this prove the adequacy of the viscoelastic laws used for the concrete and BFRP reinforcement behavior.
3.4.2. Load-Deflection Response
Figures 3.23a–3.23d show the values of experimental and analytical deflection values (δcalc/δexp) of beam Series 1, 2 and 3. Average values of deflections were obtained based on the effective moment of inertia (Ie) derived by ACI (2004) and including decompression moment effect, Eurocode 2 (CEN 2004), Toutanji et al. (2000) and author’s proposal (Sections 1.4 and 2.3.1). At the service load equiv-alent to 60% of ultimate load beam Series 1 (SSI-1÷SSI-4) produced average de-flection 7.2 mm that is 11.6% higher than calculated using traditional ACI (2004) equation for Ie (δcalc = 6.45 mm) and from 21.9% to 64% less than calculated by Toutanji’s et al. (δcalc=9.22 mm), authors’s (δcalc = 15.59 mm) and CEN (2004) (δcalc = 20.02 mm). It is evident from Fig. 3.23a that deflections derived by ACI (2004) without taking into consideration the decompression moment are underestimated theoretical values (δcalc/δexp = 0.90) in comparison with experi-mental results (Fig. 3.24a). According to Toutanji et al. (2000), author’s and Eu-rocode 2 (CEN 2004) equations, the ratios δcalc/δexp are 1.28, 2.17 and 2.78, re-spectively that lead structural engineers to overestimation of deflections with quite sufficient safety margin. Increasing prestress level to 45% beam Series 2a, 2b con-tained less average deflections from 5.31 mm, 4.38 mm, accordingly. At the same time deflection ratios δcalc/δexp according to equations by Toutanji et al. (2000), the author’s proposal and Eurocode 2 (CEN 2004) decreased to 1.17, 2.0 and 2.24 (Series 2a) and 1.17, 1.93 and 2.06 (Series 2b), respectively (Fig. 3.23b,c). With respect to decompression moment effect, it leads to overestimated deflections (ra-tios δcalc/δexp equal to 1.28 and 1.22) while taking into account no decompression, deflections still remain underestimated (ratios δcalc/δexp equal to 0.89 and 0.88). In regard to beam Series 3, deflections remain to decrease due to higher prestress level (55%) that lead to decreasing of the ratios δcalc/δexp to 1.50 and 1.81 according to equation by author’s proposal and Eurocode 2 (CEN 2004) while ratios δcalc/δexp increased to 1.29, 1.39 and 1.10 according to formulas by Toutanji et al. (2000), ACI (2004) including decompression and without its consideration. This could be explained that due to no direct relation of power m and coefficient βd and prestress level.

3. EXPERIMENTAL TESTS AND VALIDATION OF THEORETICAL MODELS OF... 91
Fig. 3.23. Load-deflection curves: beam Series 1 (a); beam Series 2 (b) and (c);
beam Series 3 (d)
Those parameters shall be evaluated and proved experimentally in the future. With regards to post-cracking behavior, the assessment of the decompression ef-fect is also more visible (Fig. 3.23 and Fig. 3.24b). At the ultimate load, all men-tioned methods underestimate deflection of experimental PC beams. In the case of beam Series 1 ratio δcalc/δexp varies from 0.91, 0.93 to 0.96 based on Toutanji et al. (2000), author and Eurocode 2 (CEN 2004), accordingly. In case of formulae by ACI (2004), even decompression is assesed, it poses to underestimation of de-flections (δcalc/δexp = 0.93), while no decompression leads to 56% higher underes-timation of deflections (δcalc/δexp = 0.56). Further, according to the author’s pro-posal and Eurocode 2 (CEN 2004) it delivers the analytical curves that have very similar character to experimental diagrams and increasing prestress level to 45%, and 55% produce deflection close to experimental values (δcalc/δexp varies from 0.93 to 0.79 and 0.93 to 0.88), respectively (Fig. 3.24b).
0
20
40
60
80
100
-2 8 18 28 38 48
ExperimentalCEN (2004)ACI (2004)ACI (2004)(cf.Eq.1.58)Toutanji (2000)Proposed method
Load, kN
Deflection, mm
(a)
Icr
Ig
Service load
0
20
40
60
80
100
-2 8 18 28 38 48
ExpperimentalCEN (2004)ACI (2004)ACI (2004)(cf.Eq.1.58)Toutanji (2000)Proposed method
Deflection, mm
Load, kN
(b)
Icr
Ig
Service load
0
20
40
60
80
100
-2 8 18 28 38 48
ExperimentalCEN (2004)ACI (2004)ACI (2004)(cf.Eq.1.58)Toutanji (2000)Proposed method
Load, kN
Deflection, mm
(c)
Icr
Ig
Service load
0
20
40
60
80
100
-2 8 18 28 38 48
ExperimentalCEN (2004)ACI (2004)ACI (2004)(cf.Eq.1.58)Toutanji (2000)Proposed method
Load, kN
Deflection, mm
(d)
Service load
Icr
Ig

92 3. EXPERIMENTAL TESTS AND VALIDATION OF THEORETICAL MODELS OF…
Fig. 3.24. Comparison of the ratios of theoretical and experimental deflections: at
service load (a); at ultimate load (b)
Regarding ACI (2004) code, taking into account decompression effect, due to an increase of prestressing to 45% and 55% deflection ratios δcalc/δexp slightly decrease from 0.83 to 0.74, however having no decompression assessed deflection ratios δcalc/δexp increase considerably from 0.50 to 0.34, respectively. This is mainly due to the effect of power m and coefficient βd that are empirical constants proposed originally for particular cases.
3.4.3. Cracking Control
In regard to cracking analysis, average values of crack width were derived by methods proposed by ACI (2004), Eurocode 2 (CEN 2004) and author’s proposal based on decompression moment effect included but not limited to early relaxa-tion of BFRP and shrinkage of concrete. The proposed method is described in Section 2.3.2. Figures 3.25–3.28 compare the values of experimental and analyti-cal crack width values of beam Series 1, 2 and 3. At the service load equivalent to 60% of ultimate load beam Series 1 (SSI-1÷SSI-4) produced average crack width 0.4 mm that is 77.3% less than calculated CEN (2004) equation (wk.calc = 1.76 mm) and 67% less than based on ACI (2004) recommendations (wk.calc = 1.22 mm) (Fig. 3.25a–3.25b). Such difference is caused due to recom-mended values of the factor kb that normally used for steel reinforcement and ba-sed on CEN (2004) and ACI (2004) it belongs to 0.8 and 1.2, respectively. In order to improve analytical values mentioned factor was assumed as 0.05 for CEN (2004) and 0.3 for ACI (2004) equations and this lead to less overestimation of crack width, wk.calc/wk.exp = 1.85 and wk.calc/wk.exp = 1.30, accordingly. However, the least difference of wcalc/wexp obtained by calculated crack width based on author‘s proposal (Eq. 2.67) and was 1.25 (Table 3.9).
0,00,40,81,21,62,02,42,8
Series 1 Series 2a Series 2b Series 3Calculated (ACI 2004)Calculated (ACI 2004, cf. Eq.1.58)Calculated (CEN 2004)Calculated (Toutanji 2000)Calculated (Proposed method)
δcalc/δexp
Beam series
(a)
Exp
0,00,20,40,60,81,01,2
Series 1 Series 2a Series 2b Series 3Calculated (ACI 2004)Calculated (ACI 2004, cf. Eq.1.58)Calculated (CEN 2004)Calculated (Toutanji 2000)Calculated (Proposed method)
δcalc/δexp
Beam series
(b)
Exp

3. EXPERIMENTAL TESTS AND VALIDATION OF THEORETICAL MODELS OF... 93
Fig. 3.25. Distribution of crack width of beam Series 1: according to CEN (2004) (a);
according to ACI (2004) (b)
Fig. 3.26. Distribution of crack width of beam Series 2a: according to CEN (2004) (a);
according to ACI (2004) (b)
Fig. 3.27. Distribution of crack width of beam Series 2b: according to CEN (2004) (a);
according to ACI (2004) (b)
15
17
19
21
23
25
0,00 0,50 1,00 1,50
Experimental
CEN(kb=0.8)
CEN(kb=0.05)
Proposal
M, kNm
w, mm
(a)
15
17
19
21
23
25
0,00 0,50 1,00 1,50
Experimental
ACI(kb=1.2)
ACI(kb=0.3)
Proposal
M, kNm
w, mm
(b)
16
18
20
22
24
0,00 0,50 1,00 1,50
Experimental
CEN(kb=0.8)
CEN(kb=0.05)
Proposal
M, kNm
w, mm
(a)
16
18
20
22
24
0,00 0,50 1,00 1,50
Experimental
ACI(kb=1.2)
ACI(kb=0.3)
Proposal
M, kNm
w, mm
(b)
16
18
20
22
24
0,00 0,50 1,00 1,50
Experimental
CEN(kb=0.8)
CEN(kb=0.05)
Proposal
M, kNm
w, mm
(a)
16
18
20
22
24
0,00 0,50 1,00 1,50
Experimental
ACI(kb=1.2)
ACI(kb=0.3)
Proposal
M, kNm
w, mm
(b)

94 3. EXPERIMENTAL TESTS AND VALIDATION OF THEORETICAL MODELS OF…
Fig. 3.28. Distribution of crack width of beam Series 3: according to CEN (2004) (a);
according to ACI (2004) (b)
Up to 45% of prestress level, beam Series 2a contained 0.20 mm average crack width that was 30% overestimated by authors proposal while changing kb
from 0.8 to 0.05 it reduced overestimation from 8.55 times to 3.6 times based on CEN (2004) and varying kb from 1.2 to 0.3 overestimation of crack width decrea-sed from 5.95 times to 1.5 times according to ACI (2004) approach. Author‘s pro-posal gave the closest form of analytical curve to the experimental diagram by having wk.calc/wk.exp = 1.30 (Figs. 3.26a–3.26b) and average wk.calc/wk.exp = 1.25 for beam Series 2b due to higher compressive strength (Figs. 3.27a–3.27b).
Table 3.9. Calculated and experimental values of crack width at service load
Beam
Series
Experi-mental
wk.exp, mm
Proposed by author
wk.calc, mm
CEN ACI CEN ACI
kb = 0.8
(recom-mended)
kb = 1.2
(recom-mended)
kb = 0.05
(assumed)
kb = 0.30
(assumed)
wk.calc, mm
wk.calc, mm
wk.calc, mm
wk.calc, mm
Series 1
SSI-1÷SSI-4 0.40 0.50 1.760 1.220 0.74 0.52 Series 2a
SSI-5, SSI-6 0.20 0.26 1.710 1.190 0.72 0.30
Series 2b
SSI-7, SSI-8 0.20 0.25 1.680 1.170 0.71 0.29
Series 3
SSI-9÷SSI-12 0.12 0.15 1.300 0.90 0.55 0.23
19
20
21
22
23
24
25
0,00 0,50 1,00 1,50
Eksperimental
CEN (kb=0.8)
CEN (kb=0.05)
Proposal
M, kNm
w, mm
(a)
19
20
21
22
23
24
25
0,00 0,50 1,00 1,50
Eksperimental
ACI (kb=1.2)
ACI (kb=0.3)
Proposal
M, kNm
w, mm
(b)

3. EXPERIMENTAL TESTS AND VALIDATION OF THEORETICAL MODELS OF... 95
In particular to beam Series 3, based on author’s prediction, ratio wk.calc/wk.exp = 1.25 while considering CEN (2004), wk.calc/wk.exp = 10.8 (kb = 0.8) and wk.calc/wk.exp = 4.5 (kb = 0.05). Finally, wk.calc/wk.exp = 7.5 (kb = 1.2) and wk.calc/wk.exp = 1.92 (kb = 0.3) were predicted using equation by ACI(2004) (Figs. 3.28a–3.28b). It is evident that among design codes used for this analysis, ACI (2004) provides the closest characteristic values to experimental results with assumption kb = 0.3.
3.5. Conclusions of Chapter 3
1. The experimental investigation of 13 full-scale beams has shown that BFRP reinforcement can be successfully employed for linear internal pre-stressing by using the appropriate anchor and prestress transfer system capable to undertake a certain level of prestress. Beam Series 1, 2 and 3 had 33%, 40%, and 47% less deflection of midspan at ultimate load than RC (control) beam. This confirms that prestress effects member flexural stiffness and increasing initial prestressing, deflections of midspan are de-creasing correspondingly. The increase of prestressing force by 5% and 15%, deflection at midspan decreases by 12% and 26%, respectively.
2. The experimental investigation of stress relaxation of 9 BFRP specimens has shown that BFRP exhibit low relaxation under constant strain up to relaxation time. The increment of the level of prestressing to 40%, 45%, and 55% produce a loss in stress due to relaxation by 5.72%, 6.04% and 6.67%, respectively. Investigation shows that an increase of initial stress level stress relaxation increases proportionally exactly from the beginning of prestress. Moreover, the increase of initial stress produces increasing not constant, but increasing stress relaxation percentages.
3. Based on experimental results, assumed constant stress relaxation per-centages based on Banibayat’s (2015) model underestimate the results of prestress losses analysis. In order to improve the adequacy of the devel-oped prestress losses stress relaxation behavior shall be evaluated based on present experimental results.
4. Stress-strain values defined by the author‘s proposed calculation method based on stress relaxation approach assures adequate calculation of the average strain over the cross-section. Calculated strain values based on the proposed method were from 1.6 to 3.5% higher than experimental ones.
5. According to the author’s proposed method based on stress relaxation ap-proach of BFRP, it delivers the analytical load-deflection curves that have

96 3. EXPERIMENTAL TESTS AND VALIDATION OF THEORETICAL MODELS OF…
a similar character to experimental diagrams and remains with safety mar-gin under service load.
6. From design codes point of view, the analysis of deflections based on a comparison of calculated and experimental values confirms the necessity to take into account the decompression moment effect in particular to the estimation of effective moment of inertia. In case of design code formula with no consideration of decompression could lead to 56% higher underestimation of deflections.
7. Using the proposed calculation method in the cracking analysis, calcu-lated crack widths were in good agreement with experimental results (greater 1.23 to 1.36 times than experimental ones) depending on the increase of prestressing level from 5% to 15%.

97
General Conclusions
Summarizing the findings of the dissertation, the following conclusion could be drawn:
1. The literature review showed that there are no particular values of stress relaxation of BFRP reinforcement for analysis of prestress losses. Calcu-lation of prestress losses due to stress relaxation in a manner similar to that for steel or other FRPs would lead to inaccurate estimation results.
2. In contrary to prestressed steel bars, where an increase of stress relaxation appears at the higher choice of the initial stress level with an increase of initial stress level in BFRP prestressing bars, stress relaxation increases proportionally at low prestress level.
3. The proposed calculation method for effective prestress force takes into account stress relaxation behavior of BFRP prestressing bars that allow to evaluate prestress losses accurately depending on the certain consecutive stage of PC members.
4. Stress-strain values defined by the author‘s proposed method based on stress relaxation approach assures adequate calculation of the average strain over the cross-section. Calculated strain values were up to 3.5% higher than the experimental results. It means that predictions by the pro-posed method were more accurate than using other authors technique.

98 GENERAL CONCLUSIONS
5. Analysis has shown that deflections were underestimated by 56% in comparison with experimental results having no decompression moment considered in the estimation of effective moment of inertia from design code provisions. In the present work, it was proposed to perform with decompression moment considered in regard to the principles of PC behavior.
6. Unlike this design code approach, proposed calculation method based on stress relaxation of BFRP might be used as an alternative one. It delivers the analytical load-deflection curves with similar character to experimen-tal diagrams.
7. The proposed method for crack width analysis allows to perform realistic cracking behavior of PC beams prestressed with BFRP bars considering the effect of decompression and shrinkage of concrete. Based on this method calculated crack widths were in good agreement with experi-mental results. Experimental values were overestimated by 25–30% by theoretical ones.
8. The experimental results showed that the increase of prestress level sig-nificantly impact the stiffness of the beams. Beams prestressed with 40%, 45% and 55% of the ultimate tensile strength of BFRP produced 33%, 40%, and 47% less deflection that in comparison with RC beam. The in-crease of prestressing force by 5% and 15%, deflection at midspan de-creases by 12% and 26%, respectively.
9. Unique experimental investigation of stress relaxation of BFRP bars showed that BFRP exhibit stress relaxation rates 5.72%, 6.04% and 6.67% depending on prestressing level 40%, 45%, and 55%, respectively. With an increase of initial stress level stress relaxation increases propor-tionally from low prestress level.
10. Based on experimental results, the stress relaxation coefficient is pro-posed for BFRP reinforcement. A polynomial equation is evaluated to de-scribe the relationship of prestress ratio, relaxation time and the mechan-ical properties of BFRP.
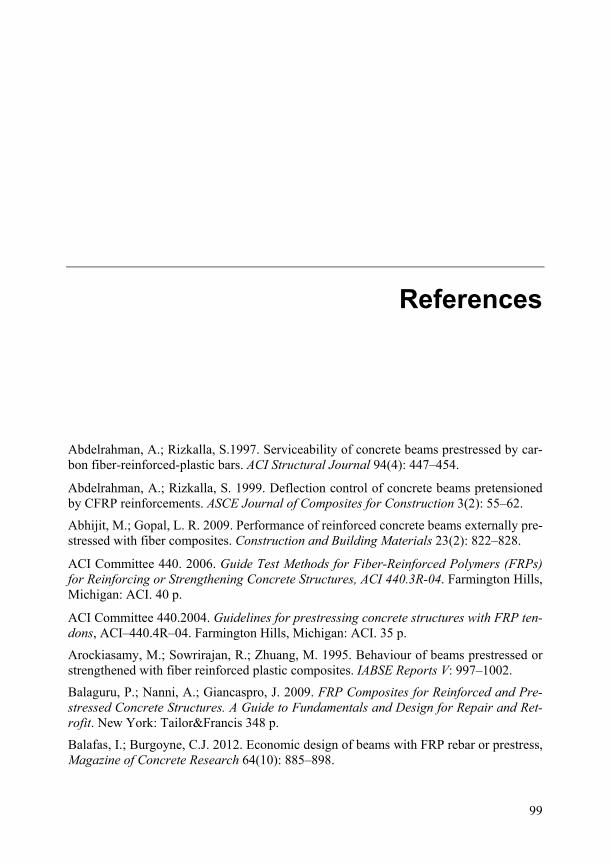
99
References
Abdelrahman, A.; Rizkalla, S.1997. Serviceability of concrete beams prestressed by car-bon fiber-reinforced-plastic bars. ACI Structural Journal 94(4): 447–454.
Abdelrahman, A.; Rizkalla, S. 1999. Deflection control of concrete beams pretensioned by CFRP reinforcements. ASCE Journal of Composites for Construction 3(2): 55–62.
Abhijit, M.; Gopal, L. R. 2009. Performance of reinforced concrete beams externally pre-stressed with fiber composites. Construction and Building Materials 23(2): 822–828.
ACI Committee 440. 2006. Guide Test Methods for Fiber-Reinforced Polymers (FRPs) for Reinforcing or Strengthening Concrete Structures, ACI 440.3R-04. Farmington Hills, Michigan: ACI. 40 p.
ACI Committee 440.2004. Guidelines for prestressing concrete structures with FRP ten-dons, ACI–440.4R–04. Farmington Hills, Michigan: ACI. 35 p.
Arockiasamy, M.; Sowrirajan, R.; Zhuang, M. 1995. Behaviour of beams prestressed or strengthened with fiber reinforced plastic composites. IABSE Reports V: 997–1002.
Balaguru, P.; Nanni, A.; Giancaspro, J. 2009. FRP Composites for Reinforced and Pre-stressed Concrete Structures. A Guide to Fundamentals and Design for Repair and Ret-rofit. New York: Tailor&Francis 348 p.
Balafas, I.; Burgoyne, C.J. 2012. Economic design of beams with FRP rebar or prestress, Magazine of Concrete Research 64(10): 885–898.

100 REFERENCES
Balevičius, R. 2010. An average stress strain approach to creep analysis of RC uncracked elements, Mechanics of Time-Dependent Materials 14: 69–89.
Balevičius, R.; Augonis, M. 2018. The effects of bond, shrinkage anf creep on cracking resistance of steel and GFRP RC members, Composite Structures 187: 85–101.
Banibayat, P.; Patnaik, A. 2015. Creep rupture performance of basalt fiber-reinforced po-lymer bars, ASCE Journal of Aerospace Engineering 28(3): 1–9.
Bažant, Z.; Buyukozturk, O. 1988. Mathematical Modeling of Creep and Shrinkage of Concrete. New York: Wiley. 459 p.
Bažant, Z.; Yu, Q. 2013. Relaxation of prestressing steel at varying strain and temperature: viscoplastic constitutive relation, ASCE Journal of Engineering Mechanics 139(7): 814–823.
Bischoff, P. 2005. Reevaluation of deflection prediction for concrete beams reinforced with steel and fiber reinforced polymer bars. ASCE Journal of Composites for Construc-tion 131(5): 752–767.
Bischoff, P.; Gross, S. 2011. Design approach for calculation deflection of FRP-reinforced concrete, ASCE Journal of Composites for Construction 15(4): 490–499.
Bhatt, P. 2011. Prestressed Concrete Design to Eurocodes. London: Spon Press. 617 p.
Buyukozturk, O.; Hearing, B. 1998. Failure behaviour of precracked concrete beams ret-rofitted with FRP, ASCE Journal of Composites for Construction 2(3): 138–144.
Borosnyói, A. 2002. Serviceability of CFRP Prestressed Concrete Beams. PhD thesis. Budapest University of Technology and Economics. 285 p.
Brinson, H.F.; Brinson, L.C. 2015. Polymer Engineering Science and Viscoelasticity. An Introduction. New York: Springer. 488 p.
Bryan, P. E.; Green, M. F. 1996. Low temperature behaviour of CFRP prestressed con-crete beams, Canadian Journal of Civil Engineers 23(2): 464–470.
Canadian Network of Centres of Excellence on Intelligent Sensing for Innovative Struc-tures (ISIS). 2008. Prestressing concrete structures with fibre-reinforced polymers. De-sign Manual No. 5. Winnipeg: ISIS Canada Corporation. 149 p.
Collins, M. P; Mitchell, D. 1991. Prestressed Concrete Structures. New Jersey: Eng-lewood Cliffs. 766 p.
Comité Euro-International du Béton (CEB). 1984. Structural Effects of Time-Dependent Behaviour of Concrete. Bulletin No. 142. Saint-Saphorin: Georgi Publishing Company. 393 p.
Creazza, G.; Mele, M. 1991. Advanced Problems in Bridge Construction. New York: Springer–Verlag Wien. 298 p.
Diab, H.; Iwashita, K. 2009. Short and long-term bond performance of prestressed FRP sheets anchorage, Engineering Structures 31(5): 1241–1249.

REFERENCES 101
Det Norske Veritas. 2012. Offshore Concrete Structures, DNV–OS–C502.Høvik:102 p.
Dolan, C. W.; Hamilton, H. R.; Bakis, C. E.; Nanni, A. 2000. Design recommendations for concrete structures prestressed with FRP tendons, Draft Final Report, University of Wyoming, Department of Civil and Architectural Engineering, Report DTFH61-96-C-00019, Laramie Wyoming: 133 p.
European Committee for standardization (CEN). Design of concrete structures. Part 1-1: General rules and rules for buildings. Eurocode 2, EN 1992–1–1. Brussels: 230 p.
El Refai, A. 2013. Durability and fatigue of basalt fiber-reinforced polymer bars gripped with steel wedge anchors, ASCE Journal of Composites for Construction 17(6): 1–11.
El-Hacha, R.; Wight, R. G.; Green, M. F. 2001. Prestressed carbon fiber reinforced poly-mer sheets for strengthening structures, Progress in Structural Engineeringand Materials 3: 111–121.
El-Hacha, R.; Green, M. F.; Wight, R. G. 2003. Innovative system for prestressing fiber-reinforced polymer sheets, ACI Structural Journal 100(3): 305–313.
Fam, A. Z.; Rizkalla, S. H.; Tadros, G. 1997. Behavour of CFRP for prestressing and shear reinfrocements of concrete highway bridges, ACI Structural Journal 94(1): 77–86.
Fédération Internationale du Béton (fib). 2007. FRP reinforcement in RC structures, fib Bulletin No.40. Lausanne: EPFL. 160 p.
Fédération Internationale de la précontrainte. 1978. Recommendations for the Design of Prestressed Concrete Oil Storage Tanks. FIP Report. London. 44 p.
Fédération Internationale de la précontrainte. 1982. Cryogenic Behavior of Materials for Prestressed Concrete.FIP Report. London: Wexham Springs. 84 p.
Fico, R. 2004. Limit States Design of Concrete Structures Reinforced with FRP Bars. PhD Thesis. University of Naples Federico II, Naples, Italy, 167 p.
fib (International Federation for Structural Concrete). 2013. Model Code for Concrete Structures 2010, Berlin: Ernst & Sohn, 245 p.
Fornůsek, J; Konvalinka, P; Sovják, R; Vítek, J. L. 2009. Long-Term Behaviour of Con-crete Structures Reinfroced with Prestressed GFRP Tendons, Cumputation Methods and Experimental Measurements XIV, 18: 535–545.
Freudenthal, A. M.; Roll, F. 1958. Creep and Creep Recovery of Concrete under High Compressive Stress, ACI Concrete Journal, 1111–1142.
Gaythwaite, J. W. 2004. Design of Marine Facilities for the Berthing, Mooring and Repair of Vessels. ASCE Press. 524 p.
Gaythwaite, J. W. 2016. Design of Marine Facilities. Engineering for Port and Harbour Structures, Reston, Virginia: ASCE Press. 734 p.
Garden, H. N.; Hollaway, L. C. 1998. An experimental study of the failure modes of rein-forced concrete beams strengthened with prestressed carbon composite plates, Composites Part B: Engineering 29(4): 411–424.

102 REFERENCES
GangaRao, H. V. S; Vijay. P. V.1997. Aging of structural composites under varying en-vironmental conditions. Proc. 3rd Int Symp. Non-Metallic (FRP) Reinforcement for Con-crete Structures, JCI.
Gerwick, B.1992. Construction of Prestressed Concrete Structures, New York: John Wiley & Sons. 591 p.
Gilbert, I. R.; Mickleborough, N. C. 1988. Design of Prestressed Concrete, London: Spon Press. 547 p.
Gilbert, I. R.; Ranzi, G. 2011. Time-Dependent Behaviour of Concrete Structures, Lon-don: Spon Press. 447 p.
Gilbert, I. R.; Mickleborough, N. C.; Ranzi, G. 2017. Design of Prestressed Concrete to Eurocode 2, Boca Raton: CRC Press. 665 p.
Ghali A. 1993. Deflection of reinforced concrete members: a critical review. ACI Struc-tural Journal 90(4):364–373.
Ghali, A.; Favre, R.; Eldbadry, M. 2012. Concrete Structures. Stresses and Deformations, London: Spon Press. 637 p.
Ghali, A. 2017. Circular Storage Tanks and Silos, CRC Press. 387 p.
Grace, N.; Singh, S. B. 2003. Design approach for carbon fiber-reinforced polymer pre-stressed concrete bridge beams, ACI Structural Journal 100(3): 365–376.
Grace, N.; Enomoto, T.; Baah, P.; Bebawy, M. 2012. Flexural behaviour of CFRP precast prestressed decked bulb T-beams, ASCE Journal of Composites for Construction 16(3): 225–234.
Grace, N.; Ushijima, K.; Matsagar, V.; Wu, C. 2013. Performance of AASHTO-type bridge model prestressed with carbon fiber-reinforced polymer reinforcement, ACI Struc-tural Journal 110(3): 491–501.
Gribniak, V.; Cervenka, V.; Kaklauskas, G. 2013. Deflection prediction of reinforced con-crete beams by design codes and computer simulation, Engineering Structures 56: 2175–2186.
Harding, J. E.; Parke, G. E. R.; Ryall, M. J. 2010. Bridge Management. Inspection, Maintenance, Assessment and Repair. New York: Tailor&Francis. 888 p.
Heo, S.; Shin, S.; Lee, C. 2013. Flexural behavior of concrete beams internally prestressed with unbonded carbon-fiber-reinforced polymer tendons, ASCE Journal of Composites for Construction 17(2): 167–175.
Issa, M. A. 1995. Prestress losses in fiberglass pretensioned concrete compression mem-bers, Materials and Structures 28: 330–339.
Jakubovskis, R.; Kaklauskas, G.; Gribniak, V.; Weber, A.; Juknys, M. 2014. Serviceabil-ity analysis of concrete beams with different arrangements of GFRP bars in the tensile zone, ASCE Journal of Composites for Construction 18(5): 1–10.

REFERENCES 103
Japan Society of Civil Engineers (JSCE). 1995. Test Method for Tensile Properties of Continous Fiber Reinforced Materials, JSCE-E 531. Tokyo: JSCE Concrete Committee: 77 p.
Jirásek, M.; Bažant, Z. 2001. Inelastic Analysis of Structures. Chichester: Wiley&Sons. 758 p.
Jokūbaitis, V.; Kamaitis, Z. 2000. Cracking and Repair of Reinforced and Prestressed Concrete Structures. Monograph. Vilnius: Technika. 155 p.
Jokūbaitis, A.; Marčiukaitis, G.; Valivonis, J. 2016. Influence of technological and envi-ronmental factors on the behaviour of the reinforcement anchorage zone of prestressed concrete sleepers, Construction and Building Materials 121: 507–518.
Kaklauskas, G. 2001a. Integral Flexural Constitutive Model for Deformational Analysis of Concrete Structures. Monograph.Vilnius: Technika.140 p.
Kaklauskas, G.; Bačinskas, D.; Zamblauskaitė, R. 2001b. Deformations of Reinforced Concrete Members. Vilnius: Technika. 206 p.
Kaklauskas, G. 2004. Flexural layered deformational model of reinforced concrete mem-bers, Magazine of Concrete Research 56(10): 575–584.
Karbhari, V. M.; Youakim S. A. 2007. An approach to determine long-term behaviour of concrete members prestressed with FRP tendons, Construction and Building Materials 21: 1052-1060.
Kim, Y. J.; Green, M. F.; Wight, R. G. 2007. Flexural behavior of reinforced and pre-stressed concrete beams including strengthening with prestress carbon fibre reinforced polymer sheets: Application of a fracture mechanics method, Canadian Journal of Civil Engineering 34(5): 664–677.
Kim, Y. J. 2014. Advanced Composites in Bridge Construction and Repair, Cambridge: Woodhead Publishing (Elsevier). 351 p.
Kostikov, V. I. 1995. Fibre Science and Technology. Soviet Advances Composites Tech-nology Series. Russian Academy of Sciences. Dordrecht: Springer. 694 p.
Lees, J. M.; Burgoyne, C. J. 1999. Experimental study of influence of bond on flexural behavior of concrete beams pretensioned with aramid fiber reinforced plastics, ACI Struc-tural Journal96 (3): 377–385.
Leonhardt, F.1977. Crack Control in Concrete Structures. IABSE Surveys S-4(77): 26 p.
Lemini, D. G. 2014. Engineering Viscoelasticity. New York: Springer. 359 p.
Lin, T. Y.; Burns, N. H. 1981. Design of Prestressed Concrete Structures. New York: Wiley&Sons. 646 p.
Malkin, A. Y. 1994. Rheology Fundamentals. Moscow: Reasearch Institute of Plastics. ChemTec Publishing. 326 p. (in Russian).
Marčiukaitis, G.; Jonaitis, B.; Papinigis, V.; Valivonis, J. 2007. Design of Reinforced Con-crete Structures According to Euronorms, Vilnius: Technika. 340 p. (in Lithuanian).

104 REFERENCES
Marčiukaitis, G. 2012. Prestressed Concrete, Vilnius: Technika. 296 p. (in Lithuanian).
Marčiukaitis, G. 2013. Influence of Technological Factors on the Behavior of Concrete and Reiforced Concrete, Vilnius: Technika. 284 p. (in Lithuanian).
McConnell, K.; Allsop, W.; Cruikshank, I. 2004. Piers, Jetties and Related Structures Exposed to Waves. Guidelines for Hydraulic Loadings, London: ICE (Thomas Telford). 133 p.
Meier, U. 1987. Proposal for a carbon fiber reinforced composite bridge across the strait of Gibraltar at its narrowest site. Proceedings of the Institution of Mechanical Engineers, 201(2):73–78.
Meiswinkel, R.; Meyer, J.; Schnell, J. 2013. Beton Kalender. Design and Construction of Nuclear Power Plants, Berlin: Wiley. 150 p.
Meier, U. 1995. Strengthening of structures using carbon fibre/epoxy composites, Con-struction and Building Materials 9(6): 341–351.
Mertol, H. C.; Rizkalla, S. H.; Scott, P.; Lees, J. M.; El-Hacha, R. 2007. Durability and fatigue behaviour of concrete beams prestressed with CFRP, Proceedings of the 3rd Inter-national Conference on Durability and Field Applications of Fiber-Reinforced Polymers (FRP) Composites for Construction: 17–24.
Mias, C.; Torres, L.; Turon, A.; Barris, C. 2013. Experimental study of immediate and time-dependent deflections of GFRP reinforced concrete beams. Composite Structures 96(2): 279–285.
Mias, C.; Torres, L.; Guadagnini, M.; Turon, A. 2015. Short and long-term cracking be-havior of GFRP reinforced concrete beams. J Compos Part B: Eng 77(8): 223–231.
Mota, C.; Alminar, S.; Svecova, D. 2006. Critical review of deflection formulas for FRP-RC members, ASCE Journal of Composites for Construction 10(3):183-194.
Mousavi, S. R.; Esfahani, M. R. 2012. Effective moment of inertia prediction of FRP-reinforced concrete beams based on experimental results. ASCE Journal of Composites for Construction 16(5): 490–498.
Navrátil, J. 2006. Prestressed Concrete Structures, Brno: Akademicke Nakladatelstvi. 184 p.
Nanni, A.; Tanigaki, M. 1992. Pretensioned prestressed concrete members with bonded fiber reinforced plastic tendons: development and flexural bond length (Static), ACI Struc-tural Journal 89: 433–441.
Nanni, A. 1993. Fiber-Reinforced-Plastic (FRP) Reinforcement for Concrete Structures. Properties and Applications. Elsevier Science Publishers. 436 p.
Nawy, E. G. 2003. Prestressed concrete. A fundamental approach. Prentice Hall. 939 p.
Notkus, A. J. 2010. Fundaments of Bridges Design, Vilnius: Technika. 256 p. (in Lithua-nian).
REFERENCES 105
Noël, M. Soudki, K. 2013. Effect of prestressing on the performance of GFRP-reinforced concrete slab bridge strips, ASCE Journal of Composites for Construction 17(2): 188–196.
Noël, M. Soudki, K. 2014. Fatigue behavior of full-scale slab bridge strips with FRP rein-forcement, ASCE Journal of Composites for Construction 19(2): 1–9.
Odagiri, T.; Matsumoto, K.; Nakai, H. 1997. Fatigue and relaxation characteristics of con-tinuous aramid fiber reinforced plastic rods, Proceedings of the 3rd International Sympo-sium on FRP reinforcement for concrete structures, Sapporo, Japan: 227–234.
Park, S. Y.; Naaman, A. E. 1999. Dowel behaviour of tensioned fiber reinforced polymer (FRP) tendons, ACI Structural Journal 96(5): 799–807.
Pallegrino, C.; Modena, C. 2009. Flexural strengthening of real scale RC and PRC beams with end-anchored pretensioned FRP laminates. ACI Structural Journal 106(3): 319–328.
Pearson, M.; Donchev, T.; Salazar, J. 2013. Long – term behaviour of prestressed basalt fibre reinforced polymer bars, Procoedia Engineering 54: 261–269.
Pisani, M.A. 2000. Long-term behaviour of beams prestressed with aramid fibre cables Part 1: a general method, Engineering Structures 22:1641–1650.
Reddy, J. N. 2013. An Introduction to Continuum Mechanics. New York: Cambridge Uni-versity Press. 479 p.
Rosenboom, O. A.; Rizkalla, S. H. 2005. Fatigue behavior of prestressed concrete bridge girders strengthened with various CFRP systems, FRPRCS-7597-612.
Rubinsky I. A.; Rubinsky A. 1954. A preliminary investigation of the use of fiberglass for prestressed concrete, Magazine of Concrete Research 6(17): 71–78.
Saadatmanesh, H.; Tannous, F. E. 1999. Long-term behaviour of aramid fiber reinforced plastic (AFRP) tendons, ACI Materials Journal 96(3): 291–299.
Sen, R.; Issa, M.; Mariscal, D. 1992. Feasibility of Fiberglass Pretensioned Piles in a Marine Environment. Report. Florida: The University of South Florida. 320 p.
Sen, R.; Shahawy, M.; Rosas, J.; Sukumar, S. 1998. Durability of Aramid Pretensioned Elements in a Marine Environment, ACI Structural Journal 95(5): 578–586.
Sen, R.; Shahawy, M.; Rosas, J.; Sukumar, S. 1999. Durability of aramid fiber reinforced plastic pretensioned elements under tidal/thermal cycles, ACI Structural Journal 96(1): 95–104.
Serbescu, A.; Guadagnini, M.; Pilakoutas, K. 2014. Mechanical characterization of basalt FRP rebars and long-term strength predictive model, ASCE Journal of Composites for Construction 19(2): 1–13.
Sim, J.; Park, C.; Moon, D.Y. 2005. Characteristics of basalt fiber as a strengthening ma-terial for concrete structures. Composites Part B: Engineering 36(7): 504–12.
Shi, J; Wang, X; Wu, Z; Zhu, Z. 2015. Creep behavior enhancement of a basalt fiber-reinforced polymer tendon, Construction and Building Materials 94: 750–757.

106 REFERENCES
Shi, J.; Wang, X.; Huang, H.; Wu, Z. 2016. Relaxation behaviour of prestressed fiber-reinforced polymer tendons considering anchorage slippage, Journal of Composite Mate-rials 51(9): 1275–1284.
Sovják, R.; Konvalinka, P. 2012. Creep behavior and residual flexural capacity of GFRP and CFRP prestensioned concrete slabs, Asian Review of Civil Engineering (ARCE) 1(1): 30–37.
Stanley, T. K. N.; Soudki, K. 2010. Shear behaviour of externally prestressed beams with carbon fiber-reinforced polymer tendons, ACI Structural Journal 107(4): 443–450.
Toutanji, H. A.; Saafi, M. 2000. Flexural behavior of concrete beams reinforced with glass fiber – reinforced polymer (GFRP) bars, ACI Structural Journal 97(5): 712–719.
Thien, N. P. 2013. Understanding Viscoelasticity. An Introduction to Rheology. Heidel-berg: Springer. 207 p.
Tsinker G. 1995. Marine Structures Engineering: Specialized Applications. Springer. 566 p.
Tsinker G. 1997. Handbook of Port and Harbor Engineering.Geotechnical and Structural Aspects, Springer. 1054 p.
Torres, L.; Sharaky, I.; Barris, C.; Baeba, M. 2013. Experimental study of the influence of adhesive properties and bond length on the bond of NSM FRP Bars in Concrete. Jour-nal of Civil Engineering and Management 22(6): 808–817.
Triantafillou, T. C.; Deskovič, N. 1991. Innovative prestressing with FRP sheets: Mechan-ics of short –term behaviour, ASCE Journal of Engineering Mechanics 117(7): 1652–1672.
Triantafillou, T. C.; Deskovič, N.; Deuring, M. 1992. Strengthening of concrete structures with prestressed fiber reinforced plastic sheets, ACI Structural Journal 89(3):235–244.
Valivonis, J; Jurkša, A. 1995. Obobshchionyj metod raszheta izgibajemych zhelezobet-onnych elementov s dopolnytelnym wneshnym nemetalitsheskim armrovanijem, Zhelezo-betonnyje konstrukciji 17(1): 43–38. (in Russian).
Wang, X; Wu, Z; Wu, G; Zhu, H; Zen, F. 2013. Enhancement of basalt FRP by hybridi-zation for long-span cable-stayed bridge, Composites: Part B, 44: 184–192.
Wang, X; Shi, J; Liu, S; Yang, L; Wu, Z. 2014a. Creep behavior of basalt fiber reinforced polymer tendons for prestressing application, Materials and Design, 59: 558–564.
Wang, X; W, G; Wu, Z; Dong, z; Xie, Q. 2014b. Evaluation of prestressed basalt fiber and hybrid fiber reinforced polymer tendons under marine environment, Materials and Design, 64: 721–728.
Wang, X; Shi, J; Wu, Z; Zhu, Z.2016a. Fatigue Behavior of Basalt Fiber-Reinforced Pol-ymer Tendons for Prestressing Applications, ASCEJournal of Composites for Construc-tion20 (3): 1–10.

REFERENCES 107
Wang, X; Shi, J; Wu, Z; Zhu, Z. 2016b. Creep strain control by pretension for basalt fiber-reinforced polymer tendon in civil applications, Materials and Design, 89: 1270–1277.
Wight, R. G.; Green, M. F.; Erki, M. A. 2001. Prestressed FRP sheets for post strengthen-ing reinforced concrete beams, ASCE Journal of Composites for Construction 5(4): 214–220.
Woo, S. K.; Nam, J. W.; Kim, H. J.; Han, S. H.; Byun, K. J. 2008. Suggestion of flexural capacity evaluation and prediction of prestress CFRP strengthened design. Engineering Structures, 30(12): 3751–3763.
Xue, W.; Tan, Y.; Zeng, L. 2010. Flexural response predictions of reinforced concrete beams strengthened with prestressed CFRP plates, Composite Structures 92(3): 612–622.
Yang, D. S.; Park, S. K.; Neale, K. W. 2009. Flexural behavior of reinforced concrete beams strengthened with prestressed carbon composites, Composite Structures 88(4): 497–508.
Yost, J. R.; Gross, S. P.; Dinehart, D. W. 2003. Effective moment of inertia for glass fiber-reinforced polymer reinforced concrete beams, ACI Structural Journal 100(6): 732–739.
Zavadskas, E.; Kamaitis, Z.; Kudzys, A. 1974. Study of prestress losses in composite lam-inated timber elements, Beton i Zelezobeton (Concrete Structures) 6: 115–124 (in Rus-sian).
Zhuo, J.; Wang, F.; Li, T. 2009. Application of FRP Strap in an Innovative Prestressed Method, ASCE Journal of Materials in Civil Engineering 21(4): 176–180.
Zoghi, M. 2014. The International Handbook of FRP Composites in Civil Engineering, CRC Press. 692 p.
Zou, P. X. W. 2003a. Long-term properties and transfer length of fiber-reinforced poly-mers, ASCE Journal of Composites for Construction 7(3): 10–19.
Zou, P. X. W. 2003b. Long-term deflection and cracking behaviour of concrete beams prestressed with carbon fiber-reinforced polymer tendons, ASCE Journal of Composites for Construction 7(3): 187–193.
Zou, P. X. W. 2003c. Theoretical study on short-term and long-term deflections of fiber reinforced polymer prestressed concrete beams, ASCE Journal of Composites for Con-struction 7(3): 285–291.


109
List of Scientific Publications by the
Author on the Topic of the Dissertation
Publications in the Reviewed Scientific Journals
Atutis, M; Valivonis, J.; Atutis, E. 2018a. Experimental study of concrete beams prestressed with basalt fiber reinforced polymers. Part II: Stress relaxation phenomenon, Composite Structures 202:344–354. Oxford: Elsevier. ISSN 0263-8223. [Clarivate Analytics Web of Science, IF: 4.193].
Atutis, M.; Valivonis J.; Atutis, E. 2018b. Experimental study of concrete beams prestressed with basalt fiber reinforced polymers. Part I: Flexural behavior and servicea-bility, Composite Structures 183:114–123. Oxford: Elsevier. ISSN 0263–8223. [Clarivate Analytics Web of Science, IF: 4.193].
Atutis, M; Valivonis J; Atutis, E. 2015. Analysis of serviceability limit state of GFRP prestressed concrete beams. Composite Structures 134: 450–459. Oxford: Elsevier. ISSN 0263-8223. [Clarivate Analytics Web of Science, IF: 4.193].
Atutis, E.; Budvytis, M.; Atutis, M. 2013a. Experimental study on the flexural and shear analysis of concrete beams reinforced with glass fiber-reinforced (GFRP) bars, Science – future of Lithuania: civil and transport engineering, aviation technologies 5(5): 467–473. Vilnius: Technika. ISSN 2029-2341. http://dx.doi.org/10.3846/mla.2013.73

110 LIST OF SCIENTIFIC PUBLICATIONS BY THE AUTHOR ON THE TOPIC OF THE …
Atutis, E.; Valivonis, J.; Atutis, M. 2013b. Experimental analysis on flexural behaviour of concrete beams with GFRP reinforcement, Engineering Structures and Techniques, 5(2): 76–81. Vilnius: Technika. ISSN 2029-2317.
Atutis, M.; & Valivonis, J. 2011. Anchorage characteristics of non-metallic reinforcement for concrete, Engineering Structures and Techniques 3(2): 72–78. Vilnius: Technika. ISSN 2029-2317.
Atutis, M. 2010a. Calculating the carrying capacity of flexural prestressed concrete beams with non-metallic reinforcement, Science – future of Lithuania: civil and transport engineering, aviation technologies 2(6): 5–13. Vilnius: Technika. ISSN 2029-2341. http://dx.doi.org/ 10.3846/mla.2010.104
Atutis, M.; & Valivonis, J. 2010b. Reinforcement cahracteristics of prestressed concrete beams with fiber-reinforced polymer tendons, Engineering Structures and Techniques 2(2): 71–78. Vilnius: Technika. ISSN 2029-2317.
Publications in Other Editions
Atutis, E.; Atutis, M.; Budvytis, M.; Valivonis, J. 2017. Serviceability and Shear Response of RC beams prestressed with various types of FRP bars, Procedia Engineering 172: 60–67. Modern Building Materials, Structures and Techniques (MBMST 2016). Amsterdam: Elsevier Ltd. ISSN 1877-7058.
Atutis, M.; Atutis, E.; Valivonis, J. 2017. Prestress losses due to relaxation of basalt fiber reinforced polymers. Proceedings of the Third International Conference on Mechanics of Composites (MECHCOMP3). Bologna: Societa’ Editrice Esculapio. ISSN 2421-2822. 110–111.
Atutis, M.; Valivonis, J.; Atutis, E. 2016. Experimental study of flexural behaviour of concrete beams prestressed with basalt fiber reinforced plastics. Proceedings of the 19th International Conference on Composite Structures (ICCS19). Porto: Societa’ Editrice Esculapio. ISSN 2421-2822. 177–178.
Atutis, M.; Valivonis, J.; Atutis, E. 2015. The issues related to flexural behaviour of FRP prestressed concrete beams. Proceedings of the 18th International Conference on Composite Structures (ICCS18). June 15-18, 2015, Lisbon, Portugal. 74–75.

111
Summary in Lithuanian
Įvadas Problemos formulavimas
Iš anksto įtemptas gelžbetonis yra vienas iš ekonomiškai efektyviausių gelžbetoninių konstrukcijų tipų. Šio tipo konstrukcijos vis plačiau naudojamos energetikos, transporto infrastruktūros statiniuose. Skaičiuojant iš anksto įtemptuosius gelžbetoninius elementus yra svarbu žinoti išankstinės įtempimo jėgos dydį, kuris priklauso nuo įvairių reiškinių, sukeliančių įtempių nuostolius armatūroje ir taip mažinančius išankstinio įtempimo jėgos didumą priklausomai nuo elemento apkrovimo stadijos (armatūros įtempimo į atsparas, elemento sandėliavimas be išorinės apkrovos poveikio, elemento apkrovimo išorine apk-rova). Išankstiniai armatūros įtempių nuostoliai turi didelę įtaką armatūros išankstiniams įtempiams, betono apgniuždymui, gelžbetoninių konstrukcijų įtempių ir deformacijų bū-viui bei priklauso nuo armatūros rūšies ir jos įtempimo būdo. Įtempus armatūrą į atsparas įtempiai armatūroje laikui bėgant mažėja. Pagrindinės išankstinių įtempių nuostolių prie-žastys yra greitai pasireiškiantis betono valkšnumas, betono traukumas, iš anksto įtemp-tosios armatūros relaksacija ir kt. Išankstinės įtempimo jėgos kitimą laike lemia gamybos metu atsirandantys nuostoliai (iškart patiriami arba trumpalaikiai) ir nuostoliai, kurių at-siranda atleidus armatūrą, vadinami nuo laiko priklausantys (antriniais) arba ilgalaikiais. Skaičiuojant išankstinių įtempių nuostolius didelę įtaką turi pasirinktas betono įtempių ir deformacijų matematinis modelis. Įvarių šalių projektavimo normos rekomenduoja ana-logiškus medžiagų fizinių ir mechaninių rodiklių vertinimo modelius, tačiau skirtingus įtempių nuostolių vertinimo bei skaičiavimo metodus. Nepriklausomai nuo gelžbetoninių

112 SUMMARY IN LITHUANIAN
konstrukcijų tipo bei armatūros įtempimo būdo atsparumas korozijai vis dar lieka pagrin-dine kliūtimi, apribojančia šių konstrukcijų eksploataciją agresyvioje aplinkoje, o tai gali lemti papildomus eksploatacijos kaštus statinių naudotojams jas remontuojant. Tokiu at-veju, kaip alernatyva, gali būti taikomos naujos ir inovatyvios kompozitinės medžiagos, tokios kaip, neplieninės kompozito arba polimerų pluošto armatūros strypai (angl. FRP), kurie pasižymi didesniu nei plieno tempiamuoju stipriu, antimagnetinėmis savybėmis, ats-parumu korozijai, pakankamu atsparumu nuovargiui, mažu šilumos laidumu, didesniu nei plieno stiprio ir masės santykiu bei galimai mažesniais išankstinio įtempimo nuostoliais dėl armatūros relaksacijos lyginant su plienine armatūra. Anglies, stiklo, aramido pluošto kompozitai, naudojami aviacijos ir kosmoso bei automobilių pramonėje iš dalies pakeičia tradicines natūralias medžiagas. Naujų konstrukcinių medžiagų poreikis nuolat auga, ku-riama vis daugiau kompozitinių medžiagų rūšių ir labai dažnai stokojama informacijos apie jų savybes. Viena tokių – bazalto pluošto kompozitas. Tai neorganinis cheminis pluoštas, kurio žaliava – vulkaninė uoliena – pigesnė už stiklo. Bazalto pluoštas turi visus teigiamus anksčiau minėtų kompozitų požymius, ir remiantis eksperimentiniais tyrimais, yra atsparesnis aukštoms temperatūros bei šarmams, o tempiamasis medžiagos stipris gali būti išnaudojamas suteikiant išankstinį įtempimą.
Nepasaint vis didėjančio mokslininkų susidomėjimo pritaikyti naujas kompozitines medžiagos statybos pramonėje, praktinį šių medžiagų panaudojimą riboja tiek projekta-vimo normų reikalavimų, tiek naujų eksperimentinių tyrimų rezultatų stoka. Suteikus ar-matūrai išankstinius įtempius, pasikeičia visos konstrukcijos įtempių ir deformacijų būvis, laikui bėgant įtempiai joje mažėja, tačiau deformacija lieka pastovi. Armatūros įtempių relasakcijos elgsenai didelę įtaka turi medžiagos struktūra bei pradiniai jos įtempiai. Tokių tyrimų trūksta, todėl svarbu nustatyti bazalto pluošto armatūros įtempių relaksacijos reikš-mes priklausomai nuo pradinių jos įtempių, siekiant įvertinti efektyvų išankstinio armatū-ros įtempimo dydį ir jo įtaką betoninių sijų armuotų iš anksto įtemptais bazalto pluošto strypais tinkamumo ribiniam būviui.
Darbo aktualumas
Bazalto pluošto kompozitai gali būti taikomi iš anksto įtemptoms betoninėms konstrukci-joms armuoti. Tačiau, dauguma iš anksto įtemptų gelžbetininių konstrukcijų tyrimų buvo skirta tradicine plienine armatūra armuotiems elementams. Norint tinkamai suprojektuoti ir pagaminti betonines konstrukcijas, armuotas iš anksto įtemptais bazalto pluošto stry-pais, tradicinių gelžbetoninių konstrukcijų skaičiavimo metodai gali nevisiškai atspindėti realią šių konstrukcijų elgseną veikiant išorinei apkrovai. Tai ypač aktualu norint tiksliai apskaičiuoti išankstinio įtempimo jėgos dydį ir jos nuostolius, kuriuos aprašantys inžine-riniai metodai apytiksliai atspindi sudėtingą konstrukcinės medžiagos elgseną. Naudojant kompozitines medžiagas ir jas iš anksto įtempiant, kompozito armatūros relaksacijos elgsena yra itin svarbi išankstinių įtempių nuostolių priežastis nustatant efektyviąją išankstinio įtempimo jėgą. Adekvatus bazalto pluošto armatūros įtempių relaksacijos įver-tinimas leidžia tiksliau įvertinti iš anksto įtemptų betoninių konstrukcijų pleišėjimo pobūdį ir deformacijas.

SUMMARY IN LITHUANIAN 113
Remiantis konstrukcinių medžiagų kontinuumo mechanikos (reologinių) modelių, išankstinių įtempių nuostolių, pleišėtumo ir įlinkių metodikų analizės rezultatais buvo pa-siūlytas efektyviosios išankstinio įtempimo jėgos vertinimo modelis ir sudarytas skaičia-vimo algoritmas atsižvelgiant į įtemptosios bazalto pluošto armatūros įtempių relaksacijos nuostolius bei jų pasireiškimo eiliškumą. Pasiūlytos įlinkių ir pleišėjimo skaičiavimo me-todikos, tinkančios iš anksto įtemptais bazalto pluošto strypais armuotų betoninių konst-rukcijų skaičiavimui.
Tyrimo objektas
Darbe nagrinėjama išankstinių armatūros įtempių ir jos įtempių relaksacijos įtaka betoni-nių elementų, armuotų iš anksto įtemptais bazalto pluošto strypais, elgsenai.
Darbo tikslas
Šios disertacijos tikslas – pasiūlyti naujus bazalto pluošto armatūros įtempių relaksacijos bei efektyviosios išankstinio įtempimo jėgos nustatymo modelius, kuriais remiantis būtų galima vertinti iš anksto įtemptųjų betoninių elementų deformacijas ir pleišėjimą.
Darbo uždaviniai
Darbo tikslui pasiekti sprendžiami šie uždaviniai:
1. Išanalizuoti empyrinius ir analitinius išankstinių įtempių nuostolių skaičiavimo me-todus atsižvelgiant į konstrukcinių medžiagų klampiai tamprią (armatūros relaksaci-jos, betono valkšnumo bei susitraukimo) elgseną.
2. Pasiūlyti analitinį armatūros įtempių nuostolių dėl įtempių relaksacijos vertinimo mo-delį, atsižvelgiant į bazalto pluošto mechanines savybes.
3. Pasiūlyti iš anksto įtemptų betoninių elementų armuotų bazalto pluošto armatūra ir veikiamų statine apkrova įlinkių bei plyšio pločio vertinimo modelius.
4. Atlikti bazalto pluošto armatūros įtempių relaksacijos nuostolių eksperimentinius ty-rimus veikiant skirtingiems išankstiniams įtempiams.
5. Eksperimentiškai ištirti iš anksto įtemptais bazalto pluošto strypais armuotų betoninių sijų, veikiamų statine apkrova, įlinkius ir pleišėjimą.
6. Lyginant eksperimentinius ir apskaičiuotus įlinkių ir pleišėjimo rezultatus, atlikti pa-siūlytų analitinių modelių adekvatumo analizę.
Tyrimų metodika
Darbe taikomi teoriniai kontinuumo mechanikos, analiziniai ir eksperimentiniai metodai. Siūlomas bazalto pluošto armatūros relaksacijos elgsenos vertinimas pagrįstas deformaci-jos proceso diferencialine lygtimi, o įtempių relaksacijos kitimo funkcijos aproksimacija pagrįsta Maksvelo reologiniu modeliu. Armatūros įtempių nuostolių dėl bazalto pluošto

114 SUMMARY IN LITHUANIAN
armatūros įtempių relaksacijos vertinimo modelis pagrįstas esamų betoninių ir gelžbeto-ninių elementų įtempių bei deformacijų būvio metodų trūkumų analize. Eksperimentinių tyrimų metu bazalto pluošto strypų bandiniams nustatytos įtempių relaksacijos nuostolių reikšmės, pagrįstos įtempių relaksacijos funkcijomis. Eksperimentiniai tyrimai taip pat skirti betoninių sijų, armuotų iš anksto įtemptais bazalto pluošto strypais standumo anali-zei, įvertinant skirtingus pradinius armatūros įtempius. Atlikta teorinių ir eksperimentinių rezultatų analizė.
Mokslinis naujumas
1. Pasiūlytas naujas bazalto pluošto armatūros išankstinių įtempių relaksacijos nuostolių skaičiavimo metodas, pagrįstas bazalto pluošto kompozito elgsena.
2. Kaip alternatyva praktikoje taikomiems tinkamumo ribinio būvio charakteristikų apskaičiavimo metodams, pasiūlytos iš anksto įtemptais bazalto pluošto strypais armuotų betoninių elementų įlinkių it plyšio pločio vertinimo modeliai.
3. Pasiūlytas inovatyvus bazalto pluošto armatūros įtempių relaksacijos nuostolių eksperimentinių tyrimų metodas.
4. Gauti nauji bazalto pluošto įtempių relaksacijos nuostolių eksperimentinių ty-rimų rezultatai.
5. Gauti nauji trumpalaike apkrova veikiamų iš anksto įtemptais bazalto pluošto strypais armuotų betoninių elementų eksperimentinių tyrimų rezultatai.
Darbo rezultatų praktinė reikšmė
Disertacijoje pasiūlyti išankstinių bazalto pluošto armatūros įtempių nuostolių skaičia-vimo metodas, paremtas bazalto pluošto relaksacijos elgsena. Taip pat pasiūlyti iš anksto įtemptais bazalto pluošto strypais armuotų lenkiamų betoninių elementų įlinkių ir pleišė-tumo analitiniai skaičiavimo metodai, paremti išankstinio apgniuždymo vertinimu. Skir-tingai nuo daugelio teorinių modelių, remiantis pasiūlytais algoritmais galima apskaičiuoti liekamąjį išankstinės įtempimo jėgos dydį įvertinant bazalto pluošto armatūros įtempių nuostolių dėl relaksacijos reikšmes kartu arba atskirai nuo betono valkšnumo ir susitrau-kimo, tiksliau apskaičiouti įlinkius ir prognozuoti plyšių vystymąsi, atsižvelgiant į išanks-tinį apgniuždymą. Pasiūlytas bazalto pluošto armatūros įtempių relaksacijos koeficientas gali būti universaliai taikomas įvairiems išankstinio įtempimo dydžiams nustatyti.
Ginamieji teiginiai
1. Pasiūlytas analitinis išankstinių armatūros įtempių nuostolių skaičiavimo meto-das, paremtas bazalto pluošto kompozito (BFRP) relaksacijos elgsena, leidžiai tiksliau apskaičiuoti efektyviąją išankstinio armatūros įtempimo jėgą.
2. Bazalto pluošto armatūros įtempių dėl relaksacijos nuostolio reikšmė (%) yra kintamas dydis ir didėjant pradiniams išankstiniams įtempiams proporcingai di-dėja.

SUMMARY IN LITHUANIAN 115
3. Pasiūlyti įlinkių ir plyšio pločio skaičiavimo metodai, paremti išankstinio apg-niuždymo bei BFRP armatūros įtempių relaksacijos elgsena, leidžia vertinti len-kiamų betoninių elementų tinkamumo ribinį būvį, kuris atitinka išankstinio įtem-pimo koncepciją.
Darbo rezultatų aprobavimas
Disertacijos tema paskelbti 9 moksliniai straipsniai, iš kurių 3 – žurnaluose turinčiuose cituojamumo rodiklį, o 1 – konferencijų rinkiniuose, referuojamuose Clarivate Analysis Web of Science duomenų bazėje. Disertacijoje atliktų tyrimų rezultatai buvo paskelbti 5 pranešimuose 5 konferencijose Lietuvoje ir užsienyje:
– 17-oji Jaunųjų mokslininkų konferencijoje Lietuva be mokslo – Lietuva be atei-ties, Vilnius, Lietuva, 2014.
– 18-oji tarptautinė konferencija 18th International Conference on Composite Structures, Lisabona, Portugalija, 2015.
– 19-oji tarptautinė konferencija 19th International Conference on Composite Structures, Porto, Portugalija, 2016.
– 11-oji tarptautinė konferencija „Modern Building Materials, Structures and Tech-niques“, Vilnius, Lietuva, 2016.
– 3-ioji tarptautinė konferencija 3rd International Conference on Mechanics of Composites MECHCOMP3, Bolonija, Italija, 2017.
Disertacijos struktūra
Disertaciją sudaro įvadas, 3 skyriai, bendrosios išvados, autoriaus mokslinių publikacijų disertacijos tema sąrašas (9 publikacijos), santrauka lietuvių kalba ir 3 priedai.
Disertacijos apimtis – 126 puslapiai. Tekste panaudoti 61 paveikslai, 19 lentelių ir 135 literatūros šaltiniai.
Padėka
Autorius nuoširdžiai dėkoja savo mokslinio darbo vadovui, Gelžbetoninių konstrukcijų ir geotechnikos katedros vedėjui prof. dr. Juozui Valivoniui už puikią lyderystę, motyvaciją, vertingas žinias ir patarimus rengiant disertaciją. Disertacijos autorius dėkoja doc. dr. Al-girdui Jonui Notkui, doc. dr. Broniui Jonaičiui, prof. dr. Charles Dolan, prof. dr. Oral Büyüköztürk, prof. dr. Vytautui Vaičaičiu, kurių patirtis ir kompetencija padėjo reikšmin-gai pagerinti disertacinio darbo kokybę. Autorius taip pat dėkoja dr. Aidui Jokūbaičiui bei doc. dr. Arnoldui Šneideriui už geranorišką pagalbą atliekant eksperimentinius tyrimus.
Autorius nuoširdžiai dėkoja savo tėvams, Audrutei ir Petrui, broliui Edgarui, uošviams Irenai ir Visvaldui bei mylimai žmonai Eglei už nuolatinį palaikymą, kantrybę ir paramą rengiant disertaciją. Disertacinio darbo autorius dėkoja Lietuvos mokslo tarybai už suteiktą paramą, finansuojamą pagal Europos Sąjungos struktūrinių fondų projektą Nr. 09.3.3-LMT-K-712-04-0118.
116 SUMMARY IN LITHUANIAN
1. Klampiai tamprių medžiagų fizinių modelių ir konstrukcijų tipų apžvalga
Pirmajame disertacijos skyriuje pateikiama neplieninės armatūros savybių, iš anksto į-tempto gelžbetonio konstrukcijų probleminių sričių (eksploatacija agresyvioje aplinkoje) išankstinių įtempių nuostolių bei tinkamumo ribinio būvio nustatymo metodų literatūros šaltinių apžvalga. Aptartos neplieninės armatūros ir betono fizinės ir mechaninės savybės, kurios lemia išankstinės įtempimo jėgos mažėjimą. Pristatyti bazalto pluošto armatūros privalumai ir perspektyvos. Analizuojami išankstinio įtempimo būdų privalumai ir trūku-mai. Aprašomi neplieninės armatūros įtempių relaksacijos elgsenos įpatumai bei jos įtaka nustatant iškart patiriamus ir nuo laiko priklausomus nuostolius. Skyriuje apibūdintos pag-rindinės iš anksto įtempto gelžbetoninių lenkiamų elementų pagrindinės apkrovimo stadi-jos. Aptarti tradiciniai metodai – efektyviojo modulio (McMillan 1916, Faber 1927), se-nėjančios medžiagos efektyviojo modulio (Trost 1967) bei nauji ir inovatyvūs metodai – bendrasis (Pisani 2000) bei vidutinių ekvivalentinių įtempių ir deformacijų (Balevičius 2010) metodai lenkiamų elementų įtempių ir deformacijų būviui nustatyti. Apžvelgti pro-jektavimo normų reglamentuojami išankstinių įtempių nuostolių, įlinkių ir pleišėjimo prognozavimo metodai.
Parodyta, kad neplieninės (polimerinės) armatūros relaksacijos elgsena skiriasi nuo tradicinio plieno armatūros, todėl norint tinkamai įvertinti relaksacijos nuostolio reikšmę (%) yra reikalinga atlikti sudėtingus inžinerinius skaičiavimus arba aproksimuoti relaksa-cijos kreivę remiantis eksperimentiniai tyrimais. Pastaruoju atveju yra būtinas bandymo įrenginys, galintis išlaikyti pastovią bandinio deformaciją per visą relaksacijos laiką. Taip pat buvo parodyta, kad norint tiksliai apskaičiuoti iš anksto įtemptų betoninių lenkiamų elementų tarpatramio įlinkį ir vidutinį plyšio plotį, tiesioginis paprastojo gelžbetonio skai-čiavimo formulių taikymas nebūtinai atspindi realią iš anksto įtemptos konstrukcijos elgseną. Tinkamumo ribinio būvio analizei įtakos turi tikslus išankstinės įtempimo jėgos bei jos sukelto išankstinio apspaudimo nustatymas.
2. Lenkiamųjų iš anksto įtemptųjų betoninių elementų išankstinių armatūros įtempių nuostolių ir tinkamumo ribinio būvio analizė
Antrajame skyriuje pasiūlytas analitinis skaičiavimo metodas išankstinių įtempių nuosto-liams nustatyti, atsižvelgiant į bazalto pluošto armatūros įtempių relaksaciją. Ši metodika leidžia nustatyti kokią įtaką išankstinės įtempimo jėgos dydžiui turi armatūros įtempių relaksacija priklausomai nuo elemento apkrovimo stadijos (S2.1 pav.). Autoriaus pasiūly-toje armatūros įtempių nuostolių skaičiavimo metodikoje nagrinėjami šie pagrindiniai apkrovimo etapai: 1) bazalto pluošto armatūros įtempimas į atsparas (laiko momentu t0). Laikoma, kad šioje stadijoje iš karto pasireiškia bazalto pluošto armatūros įtempių relak-sacija ir kinta proporcingai nuo apkrovos pradžios; 2) elemento apspaudimas (laiko mo-mentu tp). Šioje stadijoje atleidus atsparas elementui perduodamas išankstinis įtempimas. Skaičiuojant armatūros įtempių nuostolius vertinami bazalto pluošto armatūros įtempių relaksacija, betono susitraukimas ir valkšnumas; 3) elemento apkrovimas išorine apkrova (laiko momentu tq).
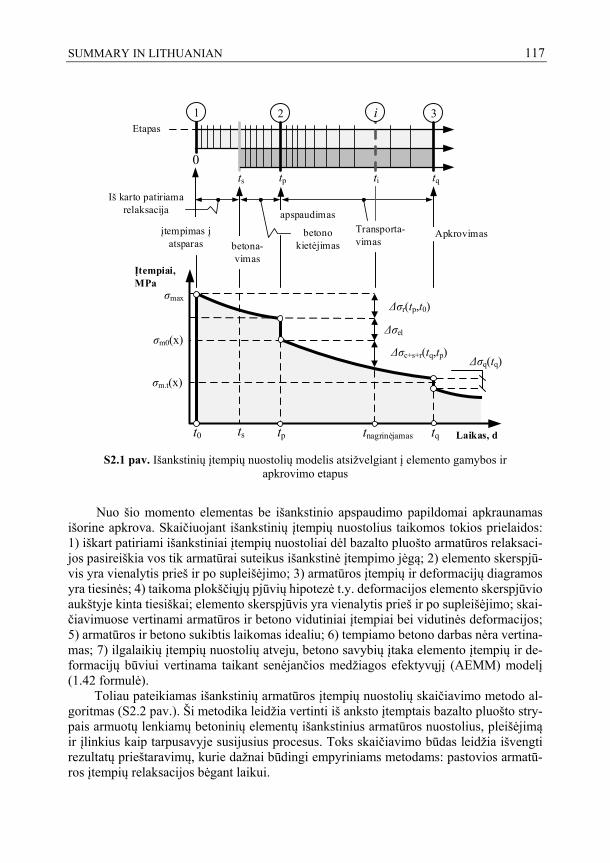
SUMMARY IN LITHUANIAN 117
S2.1 pav. Išankstinių įtempių nuostolių modelis atsižvelgiant į elemento gamybos ir
apkrovimo etapus
Nuo šio momento elementas be išankstinio apspaudimo papildomai apkraunamas išorine apkrova. Skaičiuojant išankstinių įtempių nuostolius taikomos tokios prielaidos: 1) iškart patiriami išankstiniai įtempių nuostoliai dėl bazalto pluošto armatūros relaksaci-jos pasireiškia vos tik armatūrai suteikus išankstinė įtempimo jėgą; 2) elemento skerspjū-vis yra vienalytis prieš ir po supleišėjimo; 3) armatūros įtempių ir deformacijų diagramos yra tiesinės; 4) taikoma plokščiųjų pjūvių hipotezė t.y. deformacijos elemento skerspjūvio aukštyje kinta tiesiškai; elemento skerspjūvis yra vienalytis prieš ir po supleišėjimo; skai-čiavimuose vertinami armatūros ir betono vidutiniai įtempiai bei vidutinės deformacijos; 5) armatūros ir betono sukibtis laikomas idealiu; 6) tempiamo betono darbas nėra vertina-mas; 7) ilgalaikių įtempių nuostolių atveju, betono savybių įtaka elemento įtempių ir de-formacijų būviui vertinama taikant senėjančios medžiagos efektyvųjį (AEMM) modelį (1.42 formulė).
Toliau pateikiamas išankstinių armatūros įtempių nuostolių skaičiavimo metodo al-goritmas (S2.2 pav.). Ši metodika leidžia vertinti iš anksto įtemptais bazalto pluošto stry-pais armuotų lenkiamų betoninių elementų išankstinius armatūros nuostolius, pleišėjimą ir įlinkius kaip tarpusavyje susijusius procesus. Toks skaičiavimo būdas leidžia išvengti rezultatų prieštaravimų, kurie dažnai būdingi empyriniams metodams: pastovios armatū-ros įtempių relaksacijos bėgant laikui.
Laikas, d
Įtempiai, MPa
σmax
σm0(x)
σm.t(x)
Δσr(tp,t0)
Δσc+s+r(tq,tp)
Δσel
t0 tp tq
0tp
įtempimas į atsparas
Etapas
1 2
Iš karto patiriama relaksacija apspaudimas
betona-vimas
ts tq
betono kietėjimas
Transporta-vimas
Apkrovimas
3i
ti
tnagrinėjamas
Δσq(tq)
ts

118 SUMMARY IN LITHUANIAN
S2.2 pav. Išankstinių armatūros įtempių nuostolių skaičiavimo algoritmas
Atsižvelgiant į iškarto patiriamos bazalto pluošto armatūros įtempių relaksacijos svarbą, pasiūlyta įtempių relaksacijos kitimo funkcijos aproksimacija, pagrista Maksvelo reologiniu modeliu. Šiuo atveju galima aprašyti relaksacijos funkcijos formą eksponentine diagrama. Norint gauti tinkamą rezultatų tikslumą, reikalinga atlikti eksperimentinius ty-rimus, kurie pagrįstų eksponentinės arba kitos (logaritminės) diagramos taikymą. Remian-tis literatūros analize, autoriaus pasiūlytame skaičiavimo algoritme taikoma Banibayat (2015) pasiūlyta relaksacijos koeficiento išraiška iškart patiriamai bazalto pluošto arma-tūros relaksacijai nustatyti:
0465,0)ln(006,0)(p tt , (S1.1)
čia t ir t0 – atitinkamai, nagrinėjamas ir išankstinio įtempimo laikas, valandomis.
Pradiniai duomenys: h, b, leff, asi, api, Asi, Api, Ecm, fcm, Esi, fsi, Epi, fpu, P0, M0, t0, tp, tq, ts, RH
1.1 βcc(tp), fcm(tp), Ecm(tp) Iš.(1.13-14)
1.4αsi(tp), αpi(tp) Iš.2.27),
A0, S0top, I0
top Iš.(2.28-30)
1.2Iškart patiriami relaks. nuostoliai
1.3N(tp)=P0-ΔσprAp
M(tp)=Mg-P0(h-ap)-ΔσprApyp
1.5 ɛ0(tp)top, 1/r0(tp)
top Iš.(2.34-35)
1.6 Δσp(tp) Iš.(2.21)
1.7Iš. įtempimo jėga atleidimo metu
Pm0=P0-Δσp(tp)Ap Iš.(2.13)
φp(tp), Δσpr(tp) Iš.(2.21-22)
+M(tq)≥Mcr
1 et
apas
2 et
apas
2.1 βcc(tq), fcm(tq), Ecm(tq) Iš.(1.13-14)
2.2 ɛcs(tq), φc(tq), φp(tp) Iš.(1.13;1.27;1.31)
2.3 Ec.eff(tq) Iš.(1.42)
2.4αsi(tq), αpi(tq) Iš.(2.27),
Aeff, Sefftop, Ieff
top Iš.(2.28-30)
2.5ΔNc(tq)+ΔNs(tq)+ΔNr(tq) Iš.(2.43-45) ΔMc(tq)+ΔMs(tq)+ΔMr(tq) Iš.(2.49-50)
2.6 Δ ɛ0(tq)top, Δ 1/r0(tq)
top Iš.(2.46-47)
2.7 Δσp(tq) Iš.(2.51)
2.8Efektyvioji iš. įtempimo jėga Pmt=Pm0-Δσp(tp)Ap
Iš.(2.40)
Ne
3.1 yn Iš.(2.56)
Taip
3.2 Acc, Scctop, Icc
top Iš.(2.57-59)
3.3Žingsniai
2.6, 2.7, 2.8
3 et
apas

SUMMARY IN LITHUANIAN 119
S2.2 pav. Iš anksto įtemptojo lenkiamojo gelžbetoninio elemento: veikiančios įrąžos (a);
deformacijų pasiskirstymas priklausomai nuo ribinio būvio stadijos (b); lenkimo momento ir įlinkio priklausomybės diagrama (c)
Tinkamumo ribinio būvio analizei buvo pasiūlyta patikslinti JAV projektavimo normų įlinkių skaičiavimo metodiką. Šiuo atveju skaičiuojant efektyvųjį inercijos mo-mentą siūloma papildomai vertinti dekompresijos efektą (S2.3 pav.). Šio efekto vertinimas buvo pagrįstas eksperimentinių tyrimų rezultatais. Tam tikru laiko momentu, iš anksto įtemptų betoninių elementų įlinkis priklauso nuo elemento apkrovimo stadijos. Lyginant su įprasto gelžbetinio lenkiamais elementais, papildomai reikalinga vertinti įšlinkį nuo išankstinio apgniuždymo.
S2.3 pav. Elemento įrąžų ir deformacijų pasiskirstymas ruože tarp plyšių: išankstinio įtempimo
suteikimas (a) išorinės apkrovimas (b); įrąžų pasiskirstymas (c); plyšių formavimasis (d); apkrovos pasiskirstymas (e); armatūros deformacijų pasiskirstymas (f); betono deformacijų pasiskirstymas
(g)
y
(a)
x
σp(tq,tp)Ap
σs1(tq,tp)As1
σs2(tq,tp)As2Mi(tq,tp)
Įlinkis, mm
Lenkimo momentas, kNm
Iš. įtempimas(c)
EIg
pleišėjimas
1 2 3 4
(b)
Mmaxdekompresija
EIcr
Mdec
Maks. apkrova
ɛp
ɛs1
ɛs2
1-Mdec 2-Mcr 3-4Mpost.cr
P0
Pe
P0
Pe
N N
sr sr.max
Fc
Fs+ΔFp
Δɛpr
N
Δɛp
x ɛsm
ɛc
y ɛcm
(a)
(b)
(d)
(e)
(f)
(g)
F F
Fp
(c)
Fp
Fc Fc

120 SUMMARY IN LITHUANIAN
Tokiu atveju, skaičiuojant iš anksto įtemptais bazalto pluošto strypais armuotų len-kiamų betoninių sijų įlinkius siūloma įvertinti išankstinio apspaudimo įtemptąja armatūra ribinį būvį eliminuojant dekompresijos momentą (2.62 formulė):
gg
geedec yA
IPePM
, (S1.2)
čia Pe – efektyvioji išankstinio įtempimo jėga; e – ekscentricitetas; Ag ir Ig – atitinkamai, nesupleišėjusio skerspjūvio plotas ir inercijos momentas; yg – atstumas nuo nesupleišėju-sio skerspjūvio svorio centro iki skerspjūvio viršutinio krašto.
Disertaciniame darbe taip pat pasiūlytos plyšio pločio ir deformacijų priklausomai nuo elemento apkrovimo stadijos bei atstumo tarp plyšių priklausomybės (S2.3 pav.). Skaičiuojant plyšio plotį įvertinamos išankstinio apspaudimo įtemptąja armatūra bei su-sitraukimo deformacijos:
))()()(( qcspp.decqpr.maxk tttsw ; (S1.3)
)(3/1 nr.max yhs , (S1.4)
čia εp(tq) – iš anksto įtemptosios armatūros deformacija nagrinėjamu apkrovimo metu; εp.dec(tp) – išankstinio apspaudimo įtemptąja armatūra elemento deformacija nagrinėjamu išorinės apkrovos metu (2.67 formulė); εcs(tq) – betono traukumo deformacija.
3. Iš anksto įtemptųjų elementų eksperimentiniai tyrimai ir teorinių prielaidų tikrinimas
Trečiajame skyriuje aprašomi atlikti natūralaus dydžio iš anksto įtemptų lenkiamų gelž-betoninių sijų eksperimentiniai tyrimai ir jų rezultatai. Šių bandinių eksperimentinę prog-ramą sudarė 12 iš anksto įtemptų sijų, kurios buvo suskirstytos į 3 serijas priklausomai nuo išankstinio įtempimo dydžio, atitinkamai 40 %, 45 % ir 55 % nuo tempiamojo bazalto pluošto armatūros tempiamojo stiprio. Viena neįtemptoji sija, buvo panaudota, kaip kont-rolinė išankstinio įtempimo efekto lenkiamajam standumui palyginti. Sijų bandymams buvo panaudota bazalto pluošto armatūra RockBar Composite, kurios tempiamasis stipris fu = 1098,3 MPa, tamprumo modulis Ef = 45 GPa. S3.1 paveiksle parodyta bandomųjų sijų apkrovimo schema.
S3.1 pav. Sijų bandymų ir matavimų schema

SUMMARY IN LITHUANIAN 121
S3.1 lentelė. Eksperimentinių sijų pagrindinės charakteristikos
Sija (Serija)
h, mm
b, mm
l, mm
a1, mm
fu, MPa
εfu Ef, GPa
ρ, %
fck, MPa
S-1 301 149 3200 50 1098,3 0,0246 45 0,32 46,01 Serija 1 SSI-1 303 150 SSI-2 300 149 3200 50 1098,3 0,0246 45 0,33 44,47 SSI-3 301 150 SSI-4 299 149 Serija 2 SSI-5 300 150 SSI-6 303 152 3200 50 1098,3 0,0246 45 0,32 40,21 SSI-7 301 148 44,29 SSI-8 303 147 Serija 3 SSI-9 301 151 SSI-10 302 150 3200 50 1098,3 0,0246 45 0,32 46,01 SSI-11 302 150 SSI-12 300 149
S3.2a–S3.2d paveiksluose palygintos eksperimentinės ir apskaičiuotos įlinkių reikš-
mės pagal Europos (CEN) ir JAV (ACI) projektavimo, Toutanji (2000) rekomendacijas efektyviajam inercijos momentui Ie nustatyti, bei pagal autoriaus pasiūlytą metodiką, at-sižvelgiant į BFRP armatūros įtempių relaksaciją (žr. skyrių 2.3.1). Atliekant rezultatų analizę pastebėta, kad teoriniuose skaičiavimuose neįvertinant išankstinio apgniuždymo pagal JAV projektavimo normas apskaičiuoti įlinkiai yra 56 % mažesni nei eksperimenti-niai. Iš pateiktų grafikų (S3.2 pav.) taip pat yra matyti, kad pagal siūlomą metodiką ir Europos projektavimo normas apskaičiuotų apkrovos ir įlinkių priklausomybių charakte-ris atitinka eksperimentinius rezultatus, atitinkamai, o apskaičiuotų ir eksperimentinių į-linkių santykiai δcalc/δexp sumažėja nuo 2,17 iki 1,50 ir nuo 2,24 iki 1,81, kai išankstinis įtempimas padidėja nuo 5% iki 15 %.
S3.3–S3.5 paveiksluose pateiktos pleišėjimo parametrų teorinės ir eksperimentinės reikšmės. Šiuo atveju buvo lyginamos vidutinės eksperimentinių ir apskaičiuotų pagal Eu-ropos, JAV projektavimo normas bei autoriaus pasiūlytas metodikas vidutinių plyšio plo-čio reikšmės. Buvo pastebėta, kad taikant koeficiento kb reikšmes, naudojamas tradicinio plieno armatūros atveju, iš anksto įtemptų gelžbetoninių sijų armuotų bazalto pluošto ar-matūra apskaičiuotasis vidutinio plyšio plotis gali būti iki 77,3 % didesnis nei eksperimen-tinis. Atsižvelgiant į eksperimentinius matavimus ir keičiant koeficiento kb vertes, kaip pavaizduota S3.3–S3.5 paveiksluose, esant 40 % išankstinio įtempimo dydžiui santykis wcalc/wexp ženkliai sumažėja, atitinkamai, iki wk.calc/wk.exp = 1,85 ir wk.calc/wk.exp = 1,30. Re-miantis autoriaus pasiūlyta metodika (2.67 formulė) teorinių ir eksperimentinių plyšio plo-čių santykis buvo wk.calc/wk.exp = 1,25. Kai išankstinio įtempimo dydis yra 55 % armatūros tempiamojo stiprio, remiantis autoriaus pasiūlyta išraiška gauta, kad wk.calc/wk.exp = 1,25. Tuo tarpu remiantis Europos bei JAV projektavimo normomis, minėtos santykinės reikš-mės yra didesnės, atitinkamai, wk.calc/wk.exp = 10,8 (kb =0,8) ir wk.calc/wk.exp = 4,5 (kb = 0,05) bei wk.calc/wk.exp = 7,5 (kb = 1,2) ir wk.calc/wk.exp = 1,92 (kb = 0,3).
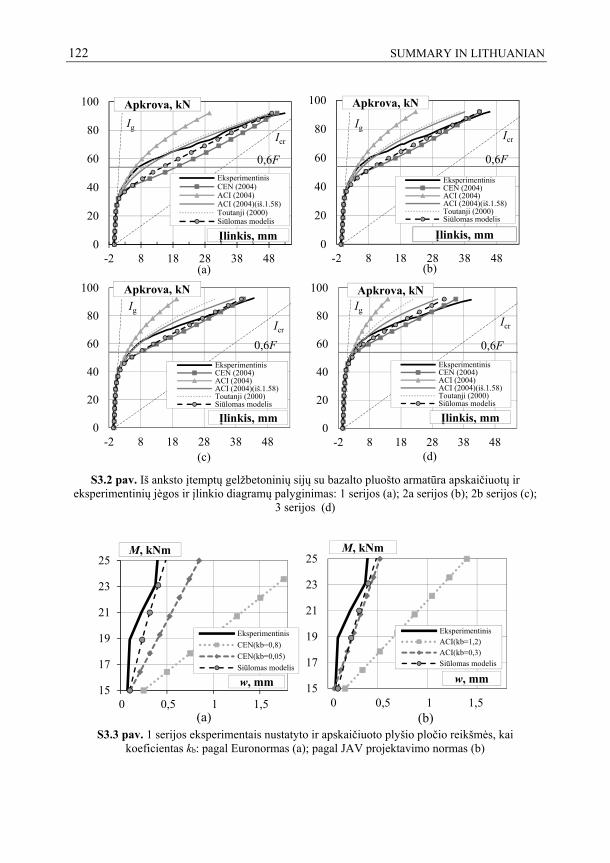
122 SUMMARY IN LITHUANIAN
S3.2 pav. Iš anksto įtemptų gelžbetoninių sijų su bazalto pluošto armatūra apskaičiuotų ir
eksperimentinių jėgos ir įlinkio diagramų palyginimas: 1 serijos (a); 2a serijos (b); 2b serijos (c); 3 serijos (d)
S3.3 pav. 1 serijos eksperimentais nustatyto ir apskaičiuoto plyšio pločio reikšmės, kai
koeficientas kb: pagal Euronormas (a); pagal JAV projektavimo normas (b)
0
20
40
60
80
100
-2 8 18 28 38 48
EksperimentinisCEN (2004)ACI (2004)ACI (2004)(iš.1.58)Toutanji (2000)Siūlomas modelis
Apkrova, kN
Įlinkis, mm
(a)
Icr
Ig
0,6F
0
20
40
60
80
100
-2 8 18 28 38 48
EksperimentinisCEN (2004)ACI (2004)ACI (2004)(iš.1.58)Toutanji (2000)Siūlomas modelis
Įlinkis, mm
Apkrova, kN
(b)
Icr
Ig
0,6F
0
20
40
60
80
100
-2 8 18 28 38 48
EksperimentinisCEN (2004)ACI (2004)ACI (2004)(iš.1.58)Toutanji (2000)Siūlomas modelis
Apkrova, kN
Įlinkis, mm
(c)
Icr
Ig
0,6F
0
20
40
60
80
100
-2 8 18 28 38 48
EksperimentinisCEN (2004)ACI (2004)ACI (2004)(iš.1.58)Toutanji (2000)Siūlomas modelis
Apkrova, kN
Įlinkis, mm
(d)
0,6F
Icr
Ig
15
17
19
21
23
25
0 0,5 1 1,5
Eksperimentinis
CEN(kb=0,8)
CEN(kb=0,05)
Siūlomas modelis
M, kNm
w, mm
(a)0 0,5 1 1,5
15
17
19
21
23
25
0 0,5 1 1,5
EksperimentinisACI(kb=1,2)ACI(kb=0,3)Siūlomas modelis
M, kNm
w, mm
(b)0 0,5 1 1,5

SUMMARY IN LITHUANIAN 123
S3.4 pav. 2 (SSI-5,6) serijos eksperimentais nustatyto ir apskaičiuoto plyšio pločio reikšmės,
kai koeficientas kb: pagal Euronormas (a); pagal JAV projektavimo normas (b)
S3.5 pav. 3 serijos eksperimentais nustatyto ir apskaičiuoto plyšio pločio reikšmės, kai
koeficientas kb: pagal Euronormas (a); pagal JAV projektavimo normas (b)
S3.2 lentelė. Eksperimentiškai nustatytų relaksacijos nuostolio reikšmės
Išanksti-nis įtem-
pimas
Serija
Bandinio
Nr.
Likutinis i-šankstinio įtempimo dydis, %
Nustatytas re-laksacijos nuos-
tolis, %
Vidutinis re-laksacijos nuostolis,
%
0,4fu BP-1 5,42
5,72 1 Serija BP-2 94,28 5,76 BP-3 5,98
0,45fu
BP-4 6,01 6,04 2 Serija BP-5 93,96 6,09
BP-6 6,02
0,55fu BP-7 6,5
6,67 3 Serija BP-8 93,33 7,1 BP-9 6,4
16
18
20
22
24
0 0,5 1 1,5
Eksperimentinis
CEN(kb=0,8)
CEN(kb=0,05)
Siūlomas modelis
M, kNm
w, mm
(a)0 0,5 1 1,5
16
18
20
22
24
0 0,5 1 1,5
Eksperimentinis
ACI(kb=1,2)
ACI(kb=0,3)
Siūlomas modelis
M, kNm
w, mm
(b)0 0,5 1 1,5
19
20
21
22
23
24
25
0 0,5 1 1,5
Eksperimentinis
CEN (kb=0,8)
CEN (kb=0,05)
Siūlomas modelis
M, kNm
w, mm
(a)0 0,5 1 1,5
19
20
21
22
23
24
25
0 0,5 1 1,5
Eksperimentinis
ACI (kb=1,2)
ACI (kb=0,3)
Siūlomas modelis
M, kNm
w, mm
(b)0 0,5 1 1,5

124 SUMMARY IN LITHUANIAN
Lyginant projektavimo normas, tiksliausi plyšio pločio skaičiavimo rezultatai gau-nami remiantis JAV projektavimo normomis, kai kb = 0,3.
Siekiant tiksliau nustatyti išankstinės įtempimo jėgos liekamąjį dydį priklausomai nuo įtempių relaksacijos nuostolių buvo atlikti bazalto pluošto armatūros strypų įtempių relaksacijos bandymai. Bandiniai buvo suskirstyti į 3 serijas priklausomai nuo išankstinio įtempimo dydžio 40 %, 45 % ir 55 %. Pasirinktas bandinių relaksacijos laikas – 1000 h. Apkrovimo žingsnis 200±50 N/mm2. Pasiekus reikalingą įtempimo lygį bandiniai toliau neapkraunami ir laikomi 120±2 sekundžių. Laiko intervalai, kada nuskaitomi indikatorių rodmenys: 1, 3, 6, 15, 30, 45 minutės, 1, 2, 4, 10, 24, 48, 72, 96, 120 valandų, vėliau, kas 24 valandas. Eksperimentinės bazalto pluošto armatūros relaksacijos nuostolio reikmės (%) pateiktos S3.2 lentelėje. Remiantis eksperimentinių tyrimų rezultatais buvo nustaty-tos bazalto pluošto armatūros strypų įtempių relaksacijos kreivės, kurias tiksliausiai ga-lima aprašyti logaritminėmis įtempių relaksacijos koeficiento φr diagramomis. Priklauso-mai nuo išankstinio įtempimo dydžio jos pateiktos S3.6a–S3.6b paveiksluose.
S3.6 pav. Eksperimentinės relaksacijos koeficiento priklausomybės: priklausomai nuo įtempimo
dydžio (a); priklausomai nuo įtempimo dydžio, kai t = 1000 h (b)
Remiantis eksperimentų rezultatais pasiūlyta įtempių relaksacijos koeficiento aps-kaičiavimo formulė:
1)ln()0673,00929,0166,0( 2r tpp . (S1.5)
Atlikus išankstinių įtempių nuostolių analizę gauta, kad remiantis eksperimentinėmis relaksacijos koeficiento φr reikšmėmis (S1.5 formulė) bazalto pluošto armatūros išanksti-nių įtempių nuostoliai nuo 0,85 %; 1,16 % ir 3,01 % didesni nei priimant šio koeficiento reikšmes pagal Banibayat (2015) pasiūlyta priklausomybę. Atsižvelgiant į tai, nustatyta, kad bazalto pluošto armatūros relaksacijos elgsena priklauso nuo išankstinio įtempimo dydžio reikšmės t.y. didėjant išankstinio įtempimo jėgos dydžiui, armatūros relaksacijos nuostolio reikšmė taip pat didėja.
φ1(t) = 0,0069ln(t) + 0,0079R² = 0,9808
φ2(t)= 0,0065ln(t) + 0,0134R² = 0,9875
φ3(t)= 0,0084ln(t) + 0,0096R² = 0,9931
0,01
0,03
0,05
0,07
0,09
0 150 300 450 600 750 900 1050
1 Serija2 serija3 serija
Δσe/σ0
t, val.
(a)
0,09
0,07
0,05
0,03
0,01
φr= 0,166p2 - 0,0929p + 0,0673R² = 1
0,05
0,055
0,06
0,065
0,07
0,35 0,4 0,45 0,5 0,55 0,6
Δσe/σ0
p, %
(b)
0,07
0,065
0,06
0,055
0,050,35 0,4 0,45 0,5 0,55 0,6

SUMMARY IN LITHUANIAN 125
S3.7 pav. Iš anksto įtempto gelžbetonio lenkiamų sijų su bazalto pluošto armatūra įtempių
armatūroje pasiskirstymas: 1 Serijos (a); 2a Serijos (b); 2b Serijos (c); 3 Serijos (d)
S3.7a–S3.7d paveiksluose pateikti pradinių bazalto pluošto armatūros įtempių ir laiko priklausomybės grafikai. Esant 40 % išankstinio įtempimo dydžiui (S3.7a pav.) pra-diniai armatūros įtempiai netolygiai mažėja, kai skaičiavimuose vertinama iš karto pati-riama bazalto pluošto armatūros įtempių relaksacija. Kai išankstiniai armatūros įtempiai padidėja iki 45 % (S3.7b–S3.7c pav.) ir 55 % (S3.7d pav.), armatūros įtempių nuostoliai padidėja netolygiai. Iš minėtų grafikų matyti, išankstiniai armatūros įtempių nuostoliai apskaičiuoti pagal pasiūlytą metodiką yra didesni nei apskaičiuoti remiantis Banibayat (2015) metodika. Pasiūlytoje metodikoje yra vertinamas armatūros išankstinio įtempimo dydis, kuris turi įtakos armatūros įtempių relaksacijos elgsenai. Tuo tarpu minėtoje Bani-bayat (2015) metodikoje yra priimta, kad įtempių relaksacijos reikšmė yra pastovus dydis, o tai prieštarauja eksperimentinių tyrimų rezultatams. Eksperimentiškai pagrįstos bazalto pluošto armatūros įtempių relaksacijos elgsenos vertinimas leidžia tiksliau apskaičiuoti iš anksto įtemptosios bazalto pluošto armatūros įtempių relaksacijos nuostolius.
350
400
450
500
550
0 10 20 30 40 50
c+s (Įtempių relaksacijos nėra)c+s+r(Banibayat 2015)c+s+r(Siūlomas modelis)
σp, MPa
Laikas, d
1 Serija
(a)
400
450
500
550
600
0 10 20 30 40 50
Įtempių relaksacijos nėra)c+s+r(Banibayat 2015)c+s+r(Siūlomas modelis)
σp, MPa
Laikas, d
2a Serija
(b)
400
450
500
550
600
0 10 20 30 40 50
c+s (Įtempių relaksacijos nėra)c+s+r(Banibayat 2015)c+s+r(Siūlomas modelis)
σp, MPa
Laikas, d
2b Serija
(c)
500
550
600
650
700
0 10 20 30 40 50
c+s (Įtempių relaksacijos nėra)c+s+r(Banibayat 2015)c+s+r(Siūlomas modelis)
σp, MPa
Laikas, d
3 Serija
(d)

126 SUMMARY IN LITHUANIAN
Bendrosios išvados
Apibendrinus atliktų tyrimų rezultatus galima teigti, kad:
1. Literatūros analizė parodė, kad projektavimo normose nėra pateiktų įtemptosios bazalto pluošto aramatūros įtempių relaksacijos nuostolio reikšmių konstrukci-niams skaičiavimams atlikti.
2. Bazalto pluošto armatūros relaksacijos elgsena skiriasi nuo įprastosios plieno ar-matūros t. y. priešingai nei plieninės armatūros atveju, kai armatūros įtempių re-laksacija vertinama įtempiams pasiekus apie 50 % jos tempiamojo stiprio, iškart patiriama bazalto pluošto armatūros relaksacija didėja proporcingai nuo pat įtem-pimo pradžios.
3. Remiantis pasiūlytu skaičiavimo metodu efektyviąjai išankstinei įtempimo jėgai nustatyti, galima tiksliai įvertinti bazalto pluošto armatūros įtempių nuostolius dėl relaksacijos priklausomai nuo elemento apkrovimo stadijos.
4. Pasiūlytas skaičiavimo metodas leidžiai tiksliai nustatyti įtempių ir deformacijų pasiskirstymą skerpjūvyje. Gautos apskaičiuotų deformacijų reikšmės 3,5 % di-desnės už eksperimentų rezultatus. Atlikta analizė parodė, kad naudojant siūlomą skaičiavimo metodiką gaunama mažesnė paklaida, lyginant su kitų autorių me-todikomis.
5. Eksperimentinai tyrimai patvirtino pasiūlytos metodikos tinkamumą, kai yra at-sižvelgiamą į išankstinį apgniuždymą skaičiuojant efektyvųjį inercijos momentą pagal JAV projektavimo normas. Neatsižvelgiant į tai, gauti apskaičuoti įlinkiai 56 % mažesni už eksperimentiškai nustatytus įlinkius .
6. Remiantis pasiūlytu įlinkių skaičiavimo metodu gautos teorinės apkrovos ir įlin-kio priklausomybės atitinka eksperimentiškai ištirtų kreivių pobūdį.
7. Pasiūlytas plyšio pločio skaičiavimo metodas, pagrįstas išankstinio elemento apspaudimo ir betono traukumo deformacijos vertinimu, užtikrina adekvačią iš anksto įtemptais bazalto pluošto armatūros strypais armuotų betoni-nių elementų pleišėtumo analizę. Gautos plyšių pločių teorinės reikšmės 25–30 % viršija eksperimentines.
8. Šiame darbe aprašyti unikalūs bazalto pluošto armatūros strypų įtempių relaksa-cijos eksperimentiniai tyrimai. Tyrimai parodė, kad esant išankstinių įtempių reikšmėms 40 %, 45 % ir 55 % gautos atitinkamos įtempių relaksacijos nuostolio reikšmės 5,75 %, 6,04 % ir 6,67 %.
9. Eksperimentiniai tyrimai parodė, kad išankstinis bazalto pluošto armatūros įtem-pimas padidino sijų standumą. Sijos, kurių armatūra buvo įtemta 40 %, 45 % ir 55 % nuo tempiamojo stiprio, atitinkamai gauti 33 %, 40 % ir 47 % mažesni įlinkiai nei neįtemtosios sijos.
10. Pasiūlyta bazalto pluošto armatūros įtempių relaksacijos koeficiento, kuris pri- klauso nuo išankstinio įtempių lygio bei mechaninių armatūros savybių, apskai-čiavimo formulė.

127
Annexes1
Annex A. Declaration of Academic Integrity Annex B. The Co-authors’ Agreement to Present Publications Material in Dissertation Annex C. Copies of Scientific Publications by the Author on the Topic of Dissertation
1The annexes are supplied in the enclosed compact disc
Mantas ATUTIS
ANALYSIS OF FLEXURAL BEHAVIOUR OF CONCRETE BEAMS PRESTRESSED WITH BASALT FIBER REINFORCED POLYMER BARS
Doctoral Dissertation
Technological Sciences, Civil Engineering (02T)
IŠ ANKSTO ĮTEMPTAIS BAZALTO PLUOŠTO STRYPAIS ARMUOTŲ LENKIAMŲJŲ BETONINIŲ ELEMENTŲ ELGSENOS ANALIZĖ
Daktaro disertacija
Technologijos mokslai, statybos inžinerija (02T) 2018 10 08. 13 sp. l. Tiražas 20 egz. Vilniaus Gedimino technikos universiteto leidykla „Technika“, Saulėtekio al. 11, 10223 Vilnius http://leidykla.vgtu.lt Spausdino BĮ UAB „Baltijos kopija“ Kareivių g. 13B, 09109 Vilnius