analysis of impediments to fair housing...
TRANSCRIPT

Analysis of Impediments
To Fair Housing Choice
Nashville-Davidson
Metropolitan Development
and Housing Agency
FINAL September, 2010

MDHA Analysis of Impediments to Fair Housing
Table of Contents
Executive Summary ........................................................................................................................ 1
Introduction................................................................................................................................... 10
Community Profile........................................................................................................................ 14
Housing ..................................................................................................................................... 20
Economy ................................................................................................................................... 27
Transportation ........................................................................................................................... 28
Impediments to Fair Housing Choice ........................................................................................... 30
Public Sector ............................................................................................................................. 30
Private Sector ............................................................................................................................ 36
Public and Private Sector .......................................................................................................... 45
Summary of Impediments to Fair Housing Choice ...................................................................... 48
Proposed Actions to Affirmatively Further Fair Housing ............................................................ 49
Recordkeeping .............................................................................................................................. 54
Appendix A: Meeting Notes from Public Forum on Housing Discrimination............................. 56

MDHA Analysis of Impediments to Fair Housing
Page 1
Executive Summary In Fiscal Year 2008, the U.S. Department of Housing and Urban Development (HUD) reported a
record number of housing discrimination complaints for the nation as a whole. The 10,552
complaints, a four percent increase over the previous year, can be viewed positively and
negatively. An increase in the number of complaints indicates that more people are aware of their
right to fair housing choice and are willing to take action to protect that right. Conversely, the
record number of complaints serves as a reminder that housing discrimination remains prevalent
in today’s society. As a recipient of the Community Development Block Grant (CDBG), the
Nashville-Davidson Metropolitan Development and Housing Agency (MDHA) certifies in its
application for federal funds that it will affirmatively further fair housing by conducting an
analysis of impediments to fair housing choice, take appropriate actions to overcome the effects
of any impediments identified, and maintain records reflecting that analysis and actions in this
regard.
MDHA is committed to ensuring fair housing choice for all residents within Davidson County.
In the fall of 2009, MDHA conducted an Analysis of Impediments to Fair Housing Choice, or AI
for short, in order to identify barriers to fair housing choice and develop strategies to overcome
those barriers. The AI is a formal evaluation of housing discrimination and barriers to fair
housing choice. This analysis serves as the basis for fair housing planning within Davidson
County and provides essential information to policy makers, administrative staff, housing
providers, lenders, and advocates help affirmatively further fair housing choice. The AI is
organized into the following sections:
Introduction
The Introduction discusses fair housing in general and the types of impediments to fair housing
choice.
Community Profile
The Community Profile provides demographic information to put fair housing within a local
context and analyzes the degree of segregation and restricted housing by race, ethnicity,
disability status, and familial status.
MDHA Analysis of Impediments to Fair Housing
Page 2
Analysis of Impediments to Fair Housing
The analysis is divided into three sections: the public sector, private sector, and the public-
private sector. Public sector analysis reviews the local policies and procedures that regulate,
monitor, or otherwise impact rental, sales, and property insurance practices. These policies can
play a significant role in limiting or promoting fair housing choice. The private sector analysis
examines impediments within the private marketplace, including the actions of landlords,
property managers, real estate agents, lenders, and other parties involved in the provision of
housing. The public-private sector analysis focuses on areas of fair housing that are provided
through a partnership of both the public and private sector, including enforcement, education and
outreach. The analysis revealed the following impediments to fair housing choice within the
county:
Impediment #1: Lack of Public Awareness: There is evidence that a substantial
number of persons who suffer from discrimination do not report it. A HUD study found
that of the people who suspect housing discrimination, only 1% reported the case to a
government agency.1 Among the reasons for a lack of reporting include the inability to
identify the discrimination and the belief that nothing will result from the report. In some
cases, limited English proficiency plays a role as well. The largest impediment to fair
housing choice is a lack of consumer education regarding fair housing rights. There is a
need for a multi-faceted approach that can effectively reach all effected parties, including
housing consumers, housing professionals and landlords, government officials, and
public advocacy groups.
Impediment #2: Need for Greater Coordination: Greater coordination is needed
among housing providers, housing professionals, government agencies, and advocacy
groups. Coordination can be increased in both quality and quantity. The agencies already
involved in fair housing efforts can collaborate more to maximize effectiveness. In
addition, there is a need to include a greater number of organizations in the process in a
more consistent manner. These agencies include other departments of Metro government,
outside agencies, and federally-funded subrecipients.

MDHA Analysis of Impediments to Fair Housing
Page 3
Impediment #3: Disparate Treatment in the Rental Market: The statistics reported by
local fair housing agencies and the U.S. Department of Housing and Urban Development
indicate discrimination based on race, disability and familial status, especially in the
rental market. Disparate treatment in the provision of rental housing is a clear
impediment to fair housing choice.
Impediment #4: Disparate Treatment in Subprime Lending: Analysis of lending data
required by the Home Mortgage Disclosure Act (HMDA) revealed that minority
households were more likely to receive a high-cost loan than White households.
Disparate treatment in mortgage lending is a clear impediment to fair housing choice.
Impediment #5: Lack of Awareness Among Metro Boards and Staff: The Tennessee
Fair Housing Council reports that some Metro boards such as Fire and Building Codes
have failed to grant reasonable accommodations to persons with disabilities and Metro
Codes has approved occupancy for multi-family buildings that do not comply with the
Fair Housing Act.
Proposed Actions to Affirmatively Further Fair Housing
The report concludes with a list of suggested actions that MDHA can undertake to eliminate the
effects of the identified impediments and to affirmatively further fair housing choice within its
jurisdiction.
Public Awareness
MDHA will utilize multiple avenues to outreach to the public to communicate their right to fair
housing choice and how to identify and report potential discrimination. Efforts will include:
1.1 Material Distribution: MDHA will distribute fair housing marketing materials aimed at
educating County residents of their right to fair housing, how to identify discrimination,
and how to report it. The goal of the material is to reach people who experience
discrimination but do not report it. MDHA will research strategies for increasing
awareness in “low minority” areas and collaboration opportunities with other agencies,
institutions of higher education, churches, and schools.

MDHA Analysis of Impediments to Fair Housing
Page 4
1.2 Fair Housing Website and Hotline: MDHA will maintain a dedicated fair housing page
on its website. The webpage will act as an information clearinghouse for residents,
housing professionals working in Davidson County, and all Metro employees. The
website will also include periodic updates related to fair housing. For those without
internet access, MDHA will continue to sponsor the Fair Housing Hotline, a recorded
message system that provides information on how to file a complaint and referral
information to local fair housing agencies.
1.3 Media Advertising and Press Releases: MDHA will use display ads in minority papers
to advertise local fair housing resources, including its web page. MDHA will issue
periodic press releases to highlight current issues, publication of reports, the Fair Housing
Conference and other newsworthy events.
1.4 Coordination with Non-Profits and Other Government Agencies: MDHA will work
closely with fair housing agencies, non-profit housing professionals, and other local
government agencies to ensure fair housing efforts are coordinated amongst agencies.
MDHA will serve as an information resource to other Metro departments for fair
housing-related issues.
1.5 Fair Housing Conference: MDHA will continue to sponsor an annual fair housing
conference to highlight local fair housing issues, solutions, and to raise awareness. The
conference will serve as an educational forum for the general public and local housing
professionals. The conference will be held in April to coincide with the national
celebration of Fair Housing Month.
Metro Nashville and Davidson County Compliance and Procedure
2.1 FHA Compliance Officer: The Metro Planning Department will continue to support an
FHA compliance officer to respond to complaints regarding land use discrimination. This
action is required as part of the consent decree between the Department of Justice and the
Metro government.
2.2 Staff Training: New Metro staff and elected officials involved with land use and zoning
decisions will receive training on fair housing and the Fair Housing Act. This includes
Metropolitan Council, Director of Council Staff, Special Counsel advising on zoning and

MDHA Analysis of Impediments to Fair Housing
Page 5
land use, Metro Planning Commission (MPC), Advisors to the MPC, Zoning
Administrator, and the Board of Zoning Appeals.

MDHA Analysis of Impediments to Fair Housing
Page 6
MDHA Compliance and Procedure
2.3 Subrecipient Monitoring Compliance and Capacity Building: MDHA will
continually monitor all of its subrecipient organizations and contractors for compliance
with federal rules and regulations. Before participating in MDHA’s programs, the
subrecipient must agree to:
comply all federal, state and local laws relating to fair housing and equal opportunity,
operate their facilities and services and conduct their outreach on a nondiscriminatory
basis, and
adopt policies to ensure effective communication with applicants, beneficiaries, and
members of the public who have hearing, vision, or speech impairments regarding the
availability of accessible services, activities and facilities.
Where necessary, MDHA will sponsor capacity building sessions to ensure all
subrecipients are well-trained to administer their programs in a manner that affirmatively
furthers fair housing.
2.4 Neighborhood Improvement: MDHA’s Neighborhood Improvement Program will fund
infrastructure and community development projects in low-income areas. The goal of the
program is to provide opportunities for collaboration and expand existing resources for
investments that are critical to neighborhood infrastructure and that support neighborhood
enhancement. MDHA will give additional consideration to areas with high minority
concentration. Over the course of the five-year plan, it is expected that this program will
receive approximately 30% of CDBG allocations.
2.5 Site and Neighborhood Standards: New rental housing assisted with HOME funds
must meet site and neighborhood standards per the HOME regulations. One purpose of
these standards is to ensure that rental housing is not concentrated in minority
neighborhoods. MDHA will review each proposal to determine its potential effect on the
racial makeup of the neighborhood and all viable alternatives. The goal of this standard is
to produce a reasonable distribution and balance of housing choices within and outside
areas of minority concentration.

MDHA Analysis of Impediments to Fair Housing
Page 7
2.6 Affirmative Marketing Plans: MDHA will require each HOME-funded project
containing 5 or more HOME-assisted housing units to develop an Affirmative Marketing
Plan. Affirmative marketing differs from general marketing activities as it specifically
targets potential tenants and homebuyers who are least likely to apply for the housing, in
order to make them aware of available affordable housing opportunities.
Each project will summarize what segment of the populations it is targeting and specific
actions it will take to market to those populations. Specific actions include use of
commercial media, neighborhood outreach, and marketing through local organizations
such as community organizations, places of worship, employment centers, fair housing
groups, and housing counseling agencies. In addition, each covered project will:
Distribute information to potential owners and tenants about Federal fair housing
laws and MDHA’s affirmative marketing policy.
Use the Equal Housing Opportunity logo on all advertising for the property and on all
tenant applications.
Visibly display a fair housing poster in the office where tenants pick up applications.
Maintain records that describe actions taken by the property to affirmatively market
units and records to assess the results of these actions.
MDHA will review its affirmative marketing performance and that of HOME-assisted
properties as part of the monitoring process and on an annual basis as part of the CAPER
report. The review will include an analysis of deficiencies and will recommend corrective
actions where necessary.
2.7 Visitability: Visitability is a design concept that enables persons with disabilities to
visit relatives, friends, and neighbors in their homes within a community. Visitability also
expands the availability of housing options for individuals who may not require full
accessibility. Applicants to MDHA’s Affordable Housing Program and Rental
Rehabilitation Program will receive additional consideration for incorporating visitability
elements into their properties. A visitable unit is defined as a unit where at least one
entrance at grade (with no step), is approached by an accessible route, such as a sidewalk,

MDHA Analysis of Impediments to Fair Housing
Page 8
and the entrance door and all interior doors on the first floor are at least 34 inches wide,
offering 32 inches of clear passage space.
2.8 Accessibility and Section 504 Compliance: MDHA will ensure compliance with
Section 504 of the Rehabilitation Act of 1973 for all of its CDBG and HOME-funded
projects. This includes accessibility for all new non-housing facilities, feasible alterations
to existing non-housing facilities, and operation of its existing non-housing facilities.
MDHA will periodically update its self-assessment and transition plan to ensure all
facilities are in compliance.
Applicants to MDHA’s Affordable Housing Program and Rental Rehabilitation Program
will receive additional consideration for providing more than the required number of
accessible units. In addition, MDHA will encourage its partners to distribute accessible
units throughout its funded properties and make them available in a sufficient range of
sizes and amenities so as not to limit choice. All funded properties will be required to
adopt policies that reasonable accommodation/ modification and outreach regarding the
availability of accessible units.
2.9 Limited English Proficiency: MDHA will conduct a four factor analysis to ensure that
persons with Limited English Proficiency have meaningful access to programs funded by
the Consolidated Plan. MDHA will develop a Language Assistance Plan (LAP) to
provide a framework for the provision of timely and reasonable language assistance.
2.10 Homeowner Rehabilitation: MDHA’s Homeowner Rehabilitation Program will provide
deferred loans to disabled homeowners to make needed home repairs and accessibility
modifications.
2.11 Homebuyer Outreach and Education: MDHA will affirmatively market its
Downpayment Assistance Program to minority populations. In addition, the program will
incorporate fair housing and fair lending education into its required counseling
component. The goal of the program is to increase the affordability of homeownership for
households earning less than 80% of the area median income.
2.12 Referral and Enforcement: MDHA will continue to partner with the Tennessee Human
Rights Commission (THRC) and the Tennessee Fair Housing Council, and the Metro

MDHA Analysis of Impediments to Fair Housing
Page 9
Human Relations Commission to respond to and investigate fair housing complaints. Fair
housing agencies will be encouraged to apply to the CDBG Community Services
Program for funding of testing and enforcement efforts. Potential projects would include
in-depth audit testing of housing practices within the rental and sales markets focused on
identifying any patterns and practices, such as neighborhood steering, or other forms of
housing choice denials that could be potential violations of fair housing laws.
2.13 Fair Housing Initiatives Program (FHIP): MDHA will explore the possibility of
participating in the FHIP program. Through FHIP, MDHA can participate in the
Education and Outreach Initiative (EOI) to offer a comprehensive range of fair housing
activities that explain to the general public and housing providers what equal opportunity
in housing means and what housing providers need to do to comply with the Fair
Housing Act. Activities may include developing education materials, analyzing local
impediments to housing choice, providing housing counseling and classes, convening
meetings that bring together the housing industry with fair housing groups, developing
technical materials on accessibility, and mounting public information campaigns.

MDHA Analysis of Impediments to Fair Housing
Page 10
Introduction The following section is meant to provide a summary of fair housing laws and requirements and
is not intended as a legal resource. Residents who have a discrimination complaint should seek
additional guidance from fair housing experts for interpretation of the Fair Housing Act.
Title VIII of the Civil Rights Act of 1968 (Fair Housing Act), as amended, prohibits
discrimination in the sale, rental, and financing of dwellings, and in other housing-related
transactions, based on race, color, national origin, religion, sex, familial status, and disability.
This protection extends to most housing.i The law makes the following actions illegal if based on
race, color, national origin, religion, sex, familial statusii, or disability:
Refuse to rent or sell housing
Refuse to negotiate for housing
Make housing unavailable
Deny a dwelling
Set different terms, conditions or privileges for sale or rental of a dwelling
Provide different housing services or facilities
Falsely deny that housing is available for inspection, sale, or rental
For profit, persuade owners to sell or rent (blockbusting) or
Deny anyone access to or membership in a facility or service (such as a multiple listing
service) related to the sale or rental of housing.
Given its importance in the ability to acquire housing, the law extends to mortgage lending
activities as well. The Fair Housing Act prohibits the following actions based on race, color,
national origin, religion, sex, familial status or disability:
i In some circumstances, the Act exempts owner-occupied buildings with no more than four units, single family housing sold or rented without the use of a broker and housing operated by organizations and private clubs that limit occupancy to members. ii Familial status includes households with children under the age of 18 living with parents or legal custodians, pregnant women, and people in the process of getting custody of children under the age of 18.
MDHA Analysis of Impediments to Fair Housing
Page 11
Refuse to make a mortgage loan.
Fail to provide information regarding loans.
Impose different terms or conditions on a loan, such as different interest rates, points or
fees.
Discriminate in appraising property.
Refuse to purchase a loan.
Set different terms or conditions for purchasing a loan.
The Act provides protection for persons exercising a fair housing right and persons assisting
others against threats, coercion, intimidation, and interference. In addition, the law prohibits
advertisements and statements that indicate a limitation or preference based on race, color,
national origin, religion, sex, familial status, or disability. The advertising prohibition applies to
single-family and owner-occupied housing that is otherwise exempt from the Fair Housing Act.
Finally, the act extends additional protection to persons with disabilities. Federal law defines a
disability as any "physical or mental impairment which substantially limits one or more of [a]
person's major life activities, a record of having such an impairment, or being regarded as having
such an impairment." Major life activities means functions such as caring for one's self,
performing manual tasks, walking, seeing, hearing, speaking, breathing, learning and working.
A landlord or property manager may not refuse a request to make reasonable modifications to a
dwelling or common use area if the modification is necessary for the disabled person to use the
housing. A reasonable accommodation is at the resident’s request and when a client voluntarily
makes exceptions to their standard rules/policies to accommodate the resident’s disability. The
requested accommodation must be reasonable and should not present an undue burden on the
landlord. If the accommodation is not reasonable or if it would impose an undue hardship on the
landlord, the request may be denied.
Nor is the landlord allowed to refuse a request to make reasonable accommodations in rules,
policies, practices, or services if the modification is necessary for the disabled person to use the
housing. Landlords may require a resident to pay for modifications to the property and require
that those modifications be removed when the resident vacates the property. If the modification

MDHA Analysis of Impediments to Fair Housing
Page 12
were for something that federal law already requires a landlord to have in place then the landlord
would be responsible for the cost of the modifications. As with accommodations, the
modifications must be reasonable.
The Fair Housing Act also requires newly constructed multifamily dwellings with four or more
units to include certain basic design features of accessibility intended to make the units usable by
a person who is or becomes disabled. Accessibility standards include: (a) public use and
common use areas which are readily accessible to and usable be persons with disabilities; (b)
doors designed to allow passage into and within the units which are sufficiently wide to allow
passage by persons in wheelchairs; (c) an accessible route into and through each unit; (d) light
switches, electrical outlets, thermostats, and other environmental controls in accessible locations;
(e) reinforcements in bathroom walls to allow later installation of grab bars; and (f) usable
kitchens and bathrooms such that an individual in a wheelchair can maneuver about the space.
Housing developments also have to comply with the American Disabilities Act (ADA). While
the ADA does not generally apply to residential housing, certain ADA issues arise with the
accessibility of common use areas in residential developments if the facilities are open to persons
other than owners, residents, and their guests. Examples include: sales and rental offices, sales
areas in model homes, pools and clubs open to the general public and reception rooms that can
be rented to non-residents.
As a recipient of the Community Development Block Grant (CDBG), MDHA certifies in its
application for federal funds that it will affirmatively further fair housing by conducting an
analysis of impediments to fair housing choice, take appropriate actions to overcome the effects
of any impediments identified, and maintain records reflecting that analysis and actions in this
regard.
The Department of Housing and Urban Development (HUD) defines impediments to fair
housing as:
Any actions, omissions, or decisions taken because of race, color, religion, sex, disability,
familial status, or national origin which restrict housing choices or the availability of
housing choice; or

MDHA Analysis of Impediments to Fair Housing
Page 13
Any actions, omissions, or decisions which have the effect of restricting housing choices
or the availability of housing choice on the basis of race, color, religion, sex, disability,
familial status, or national origin.
It is important to note that the concept of impediments to fair housing choice includes local laws
and administrative policies that affect the location, availability, and accessibility of housing.
Policies and practices that appear neutral may serve to adversely affect a person’s ability to
secure housing because of their race, color, religion, sex, disability, familial status, or national
origin.

MDHA Analysis of Impediments to Fair Housing
Page 14
Community Profile The City of Nashville was first charted in 1806 and became the permanent capital of Tennessee
in 1843. In 1963, the City of Nashville and Davidson County merged to form the “Metropolitan
Government of Nashville and Davidson County”. Today, Metro Nashville is a friendly,
progressive city with a diverse economy, strong transportation links, and many institutions of
higher education. The area enjoys a reputation as an excellent place to live due to its attractive
natural setting, pleasant neighborhoods, relatively low cost of living, and the quality of
amenities. Nashville consistently ranks among the lowest for cost-of-living in comparable cities
across the nation and within the Southeast. The overall cost of living is 95% of the national
average. All components (groceries, housing, utilities, etc.) of cost-of-living are typically below
the national average.
Situated on the Cumberland River in middle Tennessee, Nashville Metro serves as the regional
center of the 13-county Nashville-Davidson–Murfreesboro–Franklin Metropolitan Statistical
Area (MSA). The region has enjoyed steady growth over the last several decades. Over the last
forty years, Nashville’s population has increased by an average of 4,294 persons on annual basis.
If the rate of growth from 2000 to 2008 would continue at its current rate, Nashville’s population
would reach 640,207 in 2010 and top 675,000 by 2015 (TABLE 2.1).
TABLE 2.1: Davidson County Growth and Projections Year Population Ten Year Change % Change 1970 Census 448,003 1980 Census 477,811 29,808 6.7% 1990 Census 510,784 32,973 6.9% 2000 Census 569,891 59,107 11.6% 2008 ACS 626,144 2010 projection 640,207 70,316 12.3% 2015 projection 675,365
The most recent data projections performed by the Metro Planning Department show large
population gains in the central business district, and the eastern and southeastern sections of the
county. At the same time, the majority of the areas immediately outside of the central business
district show population decline. Like most metropolitan regions, much of the growth in the

MDHA Analysis of Impediments to Fair Housing
Page 15
Nashville MSA is occurring in the suburban areas (TABLE 2.2). Rutherford and Williamson
County account for a large portion of the area’s growth (GRAPH 2.1).
TABLE 2.2: Population Growth 1980 to 2008 1980-1990 1990-2000 2000-2008 Davidson 7% 12% 10% MSA 16% 25% 23% Tennessee 7% 16% 8% US 10% 13% 7% Note: Cannon, Hickman, Macon, Smith, and Trousdale counties were added to the Nashville MSA as of December 2003.
GRAPH 2.1: Population Increase by County
Population Growth: 2000-2008
56,253
67,247
44,814
25,025 20,994
10,465 3,484
0
10,000
20,000
30,000
40,000
50,000
60,000
70,000
80,000
Davidson Rutherford Williamson Sumner Wilson Robertson Cheatham
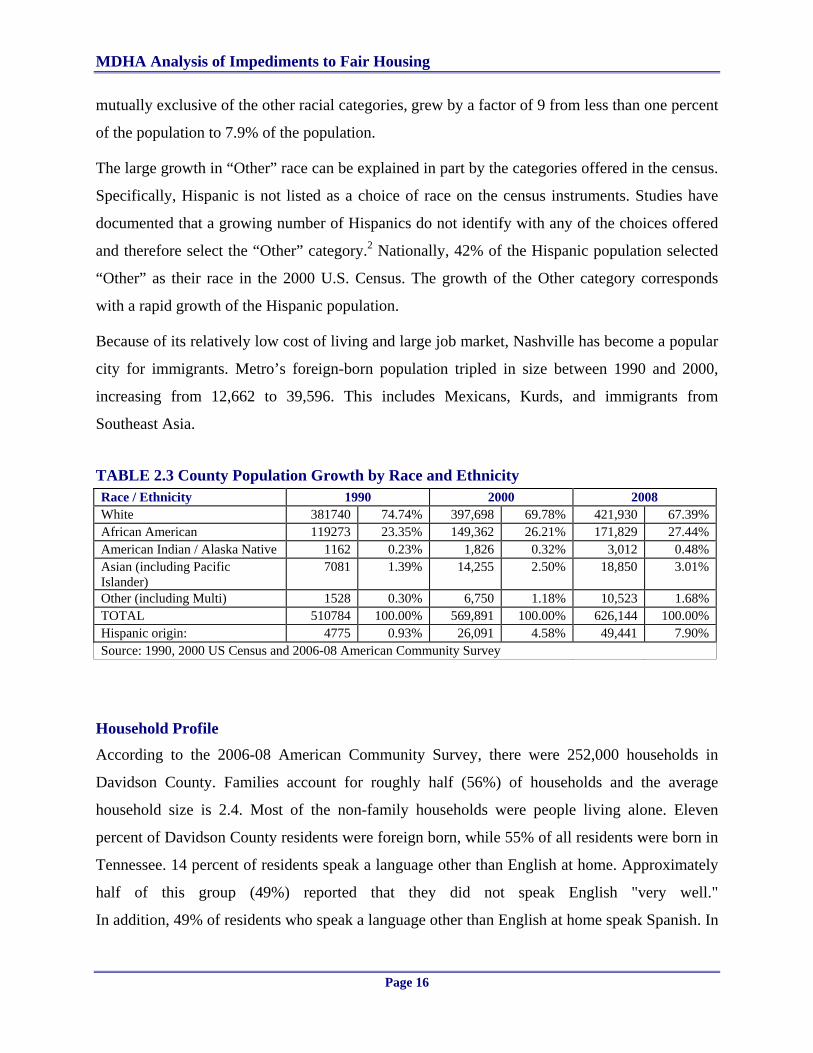
Over the last twenty years, Metro Nashville has grown more diverse in terms of racial and ethnic
background (TABLE 2.3). In 1990, three out of every four County residents were White.
According to the estimates for 2006-08, White residents now account for two out of every three
residents. These numbers do not suggest a pattern of “white flight”. The numbers suggest that
minority populations have grown at a faster rate than the White population. In fact, the White
population grew by approximately 37,000 (7%). By comparison, the African American
population grew by 44%. The number of residents identifying themselves as Other Race or
Multiracial is six times larger (600%) in 2008 than in 1990. The Asian population almost tripled
in size and the American Indian/Alaskan Native population nearly doubled. The Hispanic
population, which is considered an ethnicity for purposes of the census and therefore not
MDHA Analysis of Impediments to Fair Housing
Page 16
mutually exclusive of the other racial categories, grew by a factor of 9 from less than one percent
of the population to 7.9% of the population.
The large growth in “Other” race can be explained in part by the categories offered in the census.
Specifically, Hispanic is not listed as a choice of race on the census instruments. Studies have
documented that a growing number of Hispanics do not identify with any of the choices offered
and therefore select the “Other” category.2 Nationally, 42% of the Hispanic population selected
“Other” as their race in the 2000 U.S. Census. The growth of the Other category corresponds
with a rapid growth of the Hispanic population.
Because of its relatively low cost of living and large job market, Nashville has become a popular
city for immigrants. Metro’s foreign-born population tripled in size between 1990 and 2000,
increasing from 12,662 to 39,596. This includes Mexicans, Kurds, and immigrants from
Southeast Asia.
TABLE 2.3 County Population Growth by Race and Ethnicity Race / Ethnicity 1990 2000 2008 White 381740 74.74% 397,698 69.78% 421,930 67.39% African American 119273 23.35% 149,362 26.21% 171,829 27.44% American Indian / Alaska Native 1162 0.23% 1,826 0.32% 3,012 0.48% Asian (including Pacific Islander)
7081 1.39% 14,255 2.50% 18,850 3.01%
Other (including Multi) 1528 0.30% 6,750 1.18% 10,523 1.68% TOTAL 510784 100.00% 569,891 100.00% 626,144 100.00% Hispanic origin: 4775 0.93% 26,091 4.58% 49,441 7.90% Source: 1990, 2000 US Census and 2006-08 American Community Survey
Household Profile
According to the 2006-08 American Community Survey, there were 252,000 households in
Davidson County. Families account for roughly half (56%) of households and the average
household size is 2.4. Most of the non-family households were people living alone. Eleven
percent of Davidson County residents were foreign born, while 55% of all residents were born in
Tennessee. 14 percent of residents speak a language other than English at home. Approximately
half of this group (49%) reported that they did not speak English "very well."
In addition, 49% of residents who speak a language other than English at home speak Spanish. In

MDHA Analysis of Impediments to Fair Housing
Page 17
terms of educational attainment, 85% people 25 years and over graduated from high school and
one-third have a bachelor's degree or higher.
Disability
In the 2000 census, twenty percent of county residents over the age of five reported some form of
disability. A summary of the disabled population by type of disability is reported in TABLE 2.4.
Approximately twenty thousand residents reported a sensory disability, which includes
blindness, deafness, or a severe vision or hearing impairment. 45,863 residents reported a
physical disability, including disabilities that substantially limit one or more basic physical
activities, such as walking, climbing stairs, reaching, lifting, or carrying. Of the 35,885 disabled
persons of working age, 13,070 (36%) were reported as unemployed.
TABLE 2.4: Disabled Population by Age and Type of Disability Disability Type under 15 16 to 64 65 and older Total Sensory disability 793 10,042 9,240 20,075 Physical disability 1,029 25,170 19,664 45,863 Mental disability 4,035 15,936 7,979 27,950 Self-care disability 904 7,617 7,078 15,599 Go-outside-home disability -- 24,338 14,410 38,748 Employment disability -- 44,821 -- 44,821 Total 6,761 127,924 58,371 193,056 Source: 2000 Census
Income
Per capita personal income in the Nashville MSA has been steadily rising since 1999. In 2008,
per capita personal income was $39,325. This represents a small 1.2% increase over 2007.
Personal income as a whole increased by 5.8 percent from 2006 to 2007 and by an additional 3.3
percent from 2007 to 2008.
The median household income in Davidson County was $46,780 according to the 2006-2008
American Community Survey (ACS). There are some correlations between household income
and race and ethnicity (TABLE 2.5). African American, Hispanic, and “Other Race” households
are more heavily represented in the lower income levels and have fewer households in the upper
income levels. Other Race households have the greatest correlation. 69% of all Other Race
households were in the lowest two income groupings while only 11% placed in the highest two
income groupings.

MDHA Analysis of Impediments to Fair Housing
Page 18
TABLE 2.5: Household Income by Race and Hispanic Ethnicity Income Level White African American Asian Other Multiracial Hispanic Less than $25,000 20% 38% 14% 37% 28% 31% $25,000 to $50,000 28% 29% 31% 32% 19% 35% $50,000 to $75,000 20% 17% 25% 20% 24% 19% $75,000 to $100,000 11% 8% 12% 5% 13% 6% More than $100,000 22% 7% 17% 6% 16% 9%
GRAPH 2.2: Household Income by Race and Hispanic Ethnicity
0%
20%
40%
60%
80%
100%
White AfricanAmerican
Asian Other Multiracial Hispanic
Less than $25,000 $25,000 to $50,000 $50,000 to $75,000$75,000 to $100,000 More than $100,000
According to the ACS, approximately sixteen percent of people were below the poverty line. The
presence of children in a household, especially those with a single parent, is one of the greatest
indicators of poverty. Twenty-six percent of children under 18 were below the poverty level and
30% of single-mother families had incomes below the poverty level. In addition, eleven percent
of all seniors had incomes below the poverty level.
Racial and Ethnic Concentrations within Davidson County
There are several significant geographic concentrations of minorities within Davidson County. In
addition, there are several areas that have a significantly lower percentage of minority
households than the county as a whole. The dissimilarity index is one tool used to describe the
level of racial and ethnic segregation and integration within a community. The dissimilarity

MDHA Analysis of Impediments to Fair Housing
Page 19
index represents the percentage of one group that would have to move to a new neighborhood to
achieve perfect integration with another group. An index score can range in value from 0
(complete integration) to 100 (complete segregation). It should be stressed that while it is
statistically possible for the index to approach zero, it is unrealistic for communities to be
completely uniform given the general preference for a household to choose housing near others
who share similar cultural characteristics and values such as language and religion. The
dissimilarity index is more appropriately used a relative measure to compare different
communities.
TABLE 2.6: Dissimilarity Index for Davidson County by Race and Census
Race / Ethnicity 1980 1990 2000
American Indian and Alaska Native 0.30 0.26 0.21
Asian & Pacific Islander 0.42 0.43 0.41
Black / African American 0.66 0.61 0.57
Hispanic 0.22 0.23 0.46
Source: U.S. Census Housing Patterns: Racial and Ethnic Residential Segregation in the United States: 1980-2000
According to 2000 Census numbers, Davidson County has a dissimilarity index between Non-
Hispanic Whites and African Americans of 0.57 at the census tract level. This suggests that 57
percent of the African American population would need to relocate to a new census tract within
the county to achieve a perfectly uniform distribution throughout the county. The dissimilarity
index in 2000 is significantly lower than the 1980 measurement (0.66) and 1990 (0.61).
By comparison, Davidson County was less segregated (had a lower dissimilarity index) than
thirty-four out of forty-four large metropolitan areas in the last census. The average dissimilarity
index for Non-Hispanic Whites and African Americans in the areas studied was 0.64.
The dissimilarity index shows that Hispanic households are becoming more concentrated
(segregated). In 1980 and 1990, the index was low at 0.22 and 0.23, respectively. In 2000, the
index essentially doubled to 0.46. This increase brings the county’s index in line with southern
metropolitan areas and the nation’s metropolitan areas on average. Census housing patterns in
2000 show that larger metro areas and metros areas with a higher percent of Hispanic households

MDHA Analysis of Impediments to Fair Housing
Page 20
are more likely to be more segregated. In addition, metropolitan areas with the largest increases
in Hispanic population between 1980 and 2000 generally experienced larger increases in
segregation than metropolitan areas with relatively small increases in the Hispanic or Latino
population. The dissimilarity index for Asian and Pacific Islander households remained fairly
steady at 0.41 to 0.43. Nationally, there was a correlation between the rate of growth of the Asian
and Pacific Islander population and increases in dissimilarity. This trend mirrors the trend for
Hispanic households described above. One contributing factor to this increased segregation could
be the desire for newly arrived immigrants to settle into ethnic enclaves to ease the transition into
a new area.
TABLE 2.7: Racial Composition of Davidson County Municipalities White African
American American
Indian Asian Pacific
Islander Other Race
Multi- racial
Total Hispanic
Davidson County 381,783 147,696 1,679 13,275 403 13,816 11,239 569,891 26,091
Nashville (balance) 359,581 146,235 1,639 12,992 400 13,677 11,000 545,524 25,774
Ridgetop 1,041 16 1 6 - 2 17 1,083 11
Lakewood 2,230 69 6 6 - 13 17 2,341 44
Goodlettsville 11,909 1,354 30 226 2 90 169 13,780 204
Forest Hills 4,528 66 3 65 - 19 29 4,710 36
Berry Hill 515 109 1 16 - 13 20 674 23
Belle Meade 2,903 10 1 14 - 6 9 2,943 21
Oak Hill 4,325 44 5 74 1 12 32 4,493 34
Davidson County 67% 26% 0% 2% 0% 2% 2% 100% 5%
Nashville (balance) 66% 27% 0% 2% 0% 3% 2% 100% 5%
Ridgetop 96% 1% 0% 1% 0% 0% 2% 100% 1%
Lakewood 95% 3% 0% 0% 0% 1% 1% 100% 2%
Goodlettsville 86% 10% 0% 2% 0% 1% 1% 100% 1%
Forest Hills 96% 1% 0% 1% 0% 0% 1% 100% 1%
Berry Hill 76% 16% 0% 2% 0% 2% 3% 100% 3%
Belle Meade 99% 0% 0% 0% 0% 0% 0% 100% 1%
Oak Hill 96% 1% 0% 2% 0% 0% 1% 100% 1%
The most recent U.S. Census data available shows a high correlation between Census Tracts with
high concentrations of low-income families and high concentrations of minority households.
TABLE 2.7A lists all of the Census Tracts within the County from the lowest median family
income to the highest. Census tracts with the dark shading are those with minority populations
greater than 75% and those with the light shading are those with minority populations between
50 and 75%. The fourteen tracts with the lowest median family income all have minority
populations greater than 75%.

MDHA Analysis of Impediments to Fair Housing
Page 21
TABLE 2.7A: Median Family Income and Minority Concentration by Census Tract Census Tract
Median Family Income for Tract
Tract MFI: % of MSA Minority Population % Minority % Poverty
144 $7,200 13.89 1,933 87.19 68.44 124 $8,266 15.94 3,006 82.20 65.90 148 $10,599 20.44 3,145 97.64 66.76 140 $17,422 33.60 2,015 85.35 46.29 136 $17,813 34.36 6,745 98.32 39.83 160 $18,594 35.87 941 76.19 48.38 139 $20,063 38.70 1,732 98.24 36.84 118 $20,112 38.79 3,871 94.14 45.57 119 $21,317 41.12 2,279 92.34 32.71 162 $22,325 43.06 2,943 85.13 37.05 143 $23,313 44.97 1,917 98.46 33.00 138 $23,646 45.61 1,673 98.47 35.83 137 $24,063 46.41 4,900 94.18 31.88 142 $24,313 46.90 2,137 95.79 33.54 114 $25,791 49.75 3,793 71.16 28.06 126 $26,029 50.21 1,488 83.22 21.67 135 $28,875 55.70 1,271 58.68 19.92 123 $29,036 56.01 1,309 50.60 26.29 133 $29,229 56.38 1,422 31.34 18.93 165 $29,722 57.33 1,131 21.50 43.29
107.02 $30,081 58.02 1,240 37.27 21.52 113 $30,565 58.96 3,029 54.93 21.94 161 $31,042 59.88 1,185 59.19 20.77
158.01 $31,353 60.48 4,010 55.76 16.26 172 $31,645 61.04 303 18.86 14.00
107.01 $31,917 61.56 993 23.53 14.79 141 $32,250 62.21 375 70.75 16.70
127.01 $32,337 62.37 5,026 95.42 23.41 163 $32,917 63.49 1,994 82.53 24.71
109.03 $32,997 63.65 4,202 85.44 23.27 110.01 $33,560 64.73 3,804 59.97 24.62
125 $33,750 65.10 158 67.52 25.87 117 $34,578 66.70 3,211 52.13 19.58
191.08 $34,663 66.86 1,676 56.03 13.90 127.02 $34,821 67.16 1,883 83.61 13.97 174.01 $35,684 68.83 831 37.40 16.79 158.02 $36,168 69.76 2,724 47.92 13.40 104.02 $36,223 69.87 1,579 30.13 23.47
122 $36,440 70.29 750 29.90 14.06 146 $36,538 70.48 1,132 49.09 31.04 175 $36,554 70.51 574 18.56 16.34
190.01 $36,680 70.75 4,189 55.09 18.44 170 $37,031 71.43 1,688 55.95 23.80
128.02 $37,500 72.33 3,246 72.02 15.68 109.04 $37,589 72.50 2,436 89.04 16.46 190.04 $37,835 72.98 1,728 46.78 13.63 181.01 $38,961 75.15 1,863 39.22 16.23 104.01 $40,094 77.34 923 26.89 13.33
116 $40,841 78.78 1,874 36.34 10.61 190.03 $41,000 79.08 2,089 52.08 19.15
173 $41,222 79.51 1,370 41.48 11.28

MDHA Analysis of Impediments to Fair Housing
Page 22
Housing
Metro Nashville has a diverse selection of neighborhoods and housing, including downtown
condominiums, urban historic districts, and suburban single-family subdivisions. Approximately
63% of the housing stock is single unit housing. The remainder is divided somewhat evenly
between small multifamily buildings with less than 10 units (15%) and larger developments
(21%). A majority of the housing stock is more than thirty years old (GRAPH 2.3). However,
during the last housing boom, owners took advantage of low interest rates to make a large
number of renovations and repairs. In 2006, Metro Codes issued 3,469 permits for additions and
alterations, a 24.29 percent increase from 2005.
GRAPH 2.3: Age of Housing Stock by Tenure
12,251
33,50142,011 43,621
28,97612,252
16,411
43,869 39,590
9,169
0
10,000
20,000
30,000
40,000
50,000
60,000
70,000
80,000
90,000
100,000
Pre 1940 1940-60 1960-80 1980-00 2000-09*
Ow ner Renter
Nashville experienced the same housing bubble as the rest of the nation. In 2006, Metro issued a
record number of building permits only for that number to drop substantially in the following
three years (GRAPH 2.4). Most housing markets in the southeastern region are soft because of
weak economic conditions and more restrictive credit standards. During the 12 months ending

MDHA Analysis of Impediments to Fair Housing
Page 23
September 2009, sales of single-family homes and condominium units decreased by 25 percent
to 16,600 homes. The number of condominium units sold decreased by 38 percent to 2,400 units.
The median price of a single-family home sold in September 2009 decreased by nearly 6 percent
to $160,000 and the median price of a condominium unit sold decreased by 4 percent to
$142,500, compared with median prices recorded in September 2008. Local housing
professionals are confident that the Nashville market will experience a rebound in sales volume
in 2010 as excessive inventory is exhausted, aided in part by the extension of federal tax credits,
government-backed lending assistance, and low mortgage rates.
GRAPH 2.4: Housing Permits by Year
Housing Units by Year
3,6303,818
4,089
3,253
1,548
1,0991,178 1,2011,039
2,290
819381
0
500
1,000
1,500
2,000
2,500
3,000
3,500
4,000
4,500
2004 2005 2006 2007 2008 2009*
Single Family Multifamily
Housing Needs
Davidson County’s homeownership rate of 61% is lower than the state’s homeownership rate
(70%) and the nation’s (67%), but comparable to other urban counties such as Fulton, GA (59%),
Shelby, TN (63%), and Knox, TN (68%). Many homeowners in the county may be
overextended. HUD identifies any household paying more than thirty percent of household
income as cost burdened. Cost burdened households are at a greater risk of facing foreclosure in
times of fiscal distress such as unemployment.
HUD considers any household that has a cost burden, is overcrowded (defined as more than
person per room), or is without complete kitchen or plumbing facilities to have a housing

MDHA Analysis of Impediments to Fair Housing
Page 24
problem. The graphs below depict the number of households with housing problems for renters
(GRAPH 2.5) and owners (GRAPH 2.6). The great majority of these households are cost
burdened. There is a clear and direct correlation between income and the number of households
with a housing problem. Approximately 70% of all renters who earn less than 50% of the area
median income are considered to have a housing problem.
In Davidson County, the Fair Market Rent (FMR) for a two-bedroom apartment is $761. In order
to afford this level of rent and utilities, without paying more than 30% of income on housing, a
household must earn $30,440 annually or approximately $14.63 an hour (assuming full-time
work). In order to afford the FMR for a two-bedroom apartment, a minimum wage earner must
work 89 hours per week, 52 weeks per year. Alternatively, a household must include 2.2
minimum wage earner(s) working 40 hours per week year-round in order to make the two
bedroom FMR affordable. Monthly Supplemental Security Income (SSI) payments for an
individual are $674 in Davidson County. If SSI represents an individual's sole source of income,
$202 in monthly rent is affordable, while the FMR for a one-bedroom is $662.
GRAPH 2.5: Renter Housing Problems as Percent of Income
% Renter Households with Housing Problems by Income
16,139 11,716
9,444
3,466
7,456 4,052
15,409
38,292
0%
10%
20%
30%
40%
50%
60%
70%
80%
90%
100%
0-30 30-50 50-80 80+
% of Area Median Income
No Problem Housing Problem

MDHA Analysis of Impediments to Fair Housing
Page 25
GRAPH 2.6: Owner-Occupied Housing Problems as Percent of Income
% Owner Households with Housing Problems by Income
5,799
5,0858,363
9,971
83,217
12,0344,456
2,461
0%
20%
40%
60%
80%
100%
0-30 30-50 50-80 80+
% of Area Median Income
No Problem Housing Problem
Disproportionate Housing Needs
After every census, HUD publishes a dataset called the Comprehensive Housing Affordability
Strategy (CHAS) data set that must be included in a jurisdiction’s Consolidated Plan. The 2000
CHAS data provides a breakdown of housing problems by tenure, income, race, and household
type. As defined by HUD, a disproportionate housing need exists for a specific racial or ethnic
group if the percentage of that racial or ethnic group’s households within a particular category of
need is at least 10% higher than found for the category as a whole.
The CHAS data below (TABLE 2.8) reveals the following disproportionate level of housing
need:
African American Owners (30-50% AMI)
Hispanic Owners and Renters at all income levels
Native American Renters (0-30% AMI)
Native American Owners (30-50% AMI)
Asian Renters (30-50% AMI)
Asian Owners at all income levels

MDHA Analysis of Impediments to Fair Housing
Page 26
TABLE 2.8: CHAS Data by Race Household by Type, Income, & Housing Problem Renters Owners Total All Households
0-30% income 68.4 70.2 68.9 30-50% income 74.3 53.3 66.4 50-80% income 38 41 39.3 all incomes 38.5 22.2 29.5 Number of Households 105,974 131,386 237,360 Number with Housing Problems 40,800 29,168 70,021 African American
0-30% income 66.7 75.2 68.1 30-50% income 66.8 63.7 65.9 50-80% income 31.8 46.8 37.4 all incomes 43.8 29.6 37.9 Number of Households 31,980 22,490 54,470 Number with Housing Problems 14,007 6,657 20,644 Hispanic
0-30% income 79.2 94.2 81 30-50% income 85.8 82.1 85.1 50-80% income 49.8 61.5 52.2 all incomes 57.1 43.1 53.6 Number of Households 4,963 1,666 6,629 Number with Housing Problems 2,834 718 3,553 Native American
0-30% income 94.2 0 82.3 30-50% income 56.3 78.9 60.6 50-80% income 26.7 9.1 22.7 all incomes 32 14.6 26.1 Number of Households 528 268 796 Number with Housing Problems 169 39 208 Asian
0-30% income 73 86.7 75 30-50% income 97.3 56.3 89.9 50-80% income 33.7 55.4 42.7 all incomes 47.1 36.3 42.7 Number of Households 2,280 1,570 3,850 Number with Housing Problems 1,074 570 1,644 Native Hawaiian/Pacific Islander
0-30% income 57.1 0 57.1 30-50% income 0 0 0 50-80% income 13.8 0 13.8 all incomes 32.4 21.1 30.1 Number of Households 74 19 93 Number with Housing Problems 24 4 28

MDHA Analysis of Impediments to Fair Housing
Page 27
Economy
Like the rest of the nation, Davidson County’s economy entered into recession toward the end of
2007. Unemployment spiked to its highest levels at the end of 2009. The graph below
demonstrates the jump from 2007 to 2009 where the rate is approaching 10% (GRAPH 2.7).
Economists forecast that the recession should end in the next year and unemployment will return
to previous levels within two to three years. GRAPH 2.8 depicts trends in annual employment
growth.
GRAPH 2.7: Labor Force and Unemployment
County Unemployment Rate: 2007-2009
0.0
2.0
4.0
6.0
8.0
10.0
12.0
Jan Feb Mar Apr May Jun Jul Aug Sep Oct Nov Dec
Per
cen
t U
nem
plo
yed
2007 2008 2009
GRAPH 2.8: Employment by County, Metro Area, and State
-6.00%
-4.00%
-2.00%
0.00%
2.00%
4.00%
6.00%
2000 2001 2002 2003 2004 2005 2006 2007 2008 2009
County MSA State

MDHA Analysis of Impediments to Fair Housing
Page 28
Before the recession began, the area benefited from low unemployment, consistent job growth,
and significant investment. The recession has been somewhat softened by the local economy’s
diversity. Nashville’s economic base is anchored in several areas, including finance and
insurance, health care, music and entertainment, publishing, transportation technology, higher
education, biotechnology, and tourism and conventions (TABLE 2.9).
TABLE 2.9: Businesses and Employment by Industry Group Industry Group Establishments Employees Health Care and Social Assistance 1542 54,265 Public Administration 113 47,218 Retail Trade 2349 45,847 Accommodation and Food Services 1251 40,717 Education Services 183 3,146 Admin., Support, Waste Mgmt., Remediation 1065 29,648 Manufacturing 770 26,990 Wholesale Trade 1585 22,182 Professional, Scientific and Technical Services 2018 21,495 Transportation and Warehousing 437 20,359 Finance and Insurance 1212 18,976 Construction 1239 17,147 Other Services (except Public Admin.) 1941 14,558 Information 570 11,593 Real Estate and Rental and Leasing 834 7,706 Arts, Entertainment, and Recreation 563 5,263 Management of Companies and Enterprises 91 4,250 Utilities 16 1,682 Unclassified Establishments 67 355 Agriculture, Forestry, Fishing and Hunting 8 209 Mining 12 197 Source: TN Dept. of Labor & Workforce Dev
Transportation
Transportation within the county is heavily dependent on the automobile. According to the latest
census numbers, 81% of workers within the county drove to work alone and 9% carpooled. Only
2 percent took public transportation. Among those who commuted to work, it took them on
average 23.1 minutes to get to work.
Davidson County is served by the Metropolitan Transit Authority. The AccessRide program is a
publicly funded paratransit service, which operates specialized van services for persons with
disabilities who are unable to use regular fixed-route buses. AccessRide provides door-to-door

MDHA Analysis of Impediments to Fair Housing
Page 29
paratransit service within Davidson County 1.5 miles from a regular bus route, excluding
commuter or express service.
Nashville is also served by the regional Nashville Area Metropolitan Planning Organization
(MPO). The MPO coordinates, directs, and allocates federal funds for various transportation
projects and programs. The Board provides policy direction, a forum for transportation and air
quality decisions, and approves major transportation planning reports and documents. Federal
law requires all urbanized areas with a population of at least 50,000 to maintain a “3-C”
transportation planning process: Continuing, Comprehensive, and Cooperative. The MPO serves
that function in Davidson, Rutherford, Sumner, Wilson, and Williamson counties, and parts of
Maury and Robertson counties.

MDHA Analysis of Impediments to Fair Housing
Page 30
Impediments to Fair Housing Choice The analysis of impediments is divided into three sections: the public sector, private sector, and
the public-private sector. Public sector analysis reviews the local policies and procedures that
regulate, monitor, or otherwise impact rental, sales, and property insurance practices. These
policies can play a significant role in limiting or promoting fair housing choice. The private
sector analysis examines impediments within the private marketplace, including the actions of
landlords, property managers, real estate agents, lenders, and other parties involved in the
provision of housing. The public-private sector analysis focuses on areas of fair housing that are
provided through a partnership of both the public and private sector, including enforcement,
education, and outreach.
Public Sector
An analysis of impediments would not be complete without examining the actions within in the
public sector that have an effect on fair housing choice. Government policies and procedures that
regulate, monitor, or otherwise impact rental, sales, and property insurance practices can play a
significant role in promoting fair housing choice.
State of Tennessee Fair Housing Law
Tennessee’s fair housing law has received substantial equivalence certification from the U.S.
Department of Housing and Urban Development (HUD). This certification indicates that the
State has a fair housing law that provides substantive rights, procedures, remedies and judicial
review provisions that are substantially equivalent to the federal Fair Housing Act and has the
capacity to enforce it. The Tennessee Human Rights Commission (THRC) has cooperative
agreements with the U.S. Department of Housing and Urban Development (HUD) and the Equal
Employment Opportunity Commission (EEOC) that allows THRC to coordinate their
investigations and avoid duplication of efforts in seeking an end to discrimination. THRC is an
independent state agency charged with preventing and eradicating discrimination in employment,
public accommodations, and housing. The Commission has its central office in Nashville.

MDHA Analysis of Impediments to Fair Housing
Page 31
Zoning and Building Codes
Building codes, zoning ordinances, and other local policies that overwhelmingly serve the public
good can have disparate impacts on the housing choice of the protected classes. Building codes
provide minimum standards for the design, construction, and use of buildings in order to protect
public health and safety. Codes that require certain amenities or setbacks can affect the
feasibility of providing low- and moderate-income housing development. These requirements
may serve as an impediment to fair housing choice if the low income population consists
primarily of protected classes, such as racial minorities.
The County has incorporated the 2003 and 2006 International Building Codes into its building
code. HUD has found that these codes are in compliance with the Fair Housing Act in terms of
design standards.
Zoning ordinances regulate how property can be utilized, maintain the character of a
neighborhood and provide for orderly growth. Some state and local governments have enacted
laws that limit or exclude housing facilities for persons with disabilities or homeless people from
certain residential areas. The Department of Justice, HUD, and most courts that have addressed
the issue agree that density restrictions are generally inconsistent with the Fair Housing Act.
MDHA reviewed the local zoning ordinance and found no adverse effects on the availability of
housing for minorities, families with children, and persons with disabilities. Nor did the review
reveal any zoning policies promoting a pattern or concentration of low income housing or overly
restrictive policies that would prevent affordable housing development.
Zoning ordinances with a single-family zoning district must contain a definition of family. The
definition cannot be written in a way to exclude certain family members, families which are not
biologically related or are non-traditional, or have a disparate impact on one of the protected
classes. In 1995, the Supreme Court reviewed City of Edmonds v. Oxford House, Inc. where the
City of Edmonds cited a halfway house for violating a city ordinance because it was located in a
neighborhood zoned for single-family residences. The ordinance defined “family” as “persons
related by genetics, adoption, or marriage, or a group of five or fewer [unrelated] persons.”
While the Court did not find the ordinance in violation of the Fair Housing Act, the Court ruled
that the ordinance was not exempt from the Fair Housing Act since it sets a limit for the number
of unrelated occupants but not related occupants.

MDHA Analysis of Impediments to Fair Housing
Page 32
Upon its review, MDHA found that the zoning code is not overly restrictive in its definition of
occupancy or family. The ordinance uses the following definition for family:
An individual, or two or more persons related by blood, marriage or law, or, unless
otherwise required by federal or state law, a group of not more than three unrelated
persons living together in a dwelling unit. Servants and temporary nonpaying
guests having common housekeeping facilities with a family are a part of the
family for this code;
A group of not more than eight unrelated mentally retarded, mentally handicapped,
or physically handicapped persons, including two additional persons acting as
houseparents or guardians, living together as a single housekeeping unit in
accordance with Tennessee Code Annotated § 13-24-102. For purposes of this
subsection, 'mentally handicapped' and 'physically handicapped' includes persons
being professionally treated for drug and/or alcohol dependency or abuse. For the
purposes of this subsection, "mentally handicapped" does not include persons who
are mentally ill and, because of such mental illness, pose a likelihood of serious
harm as defined in Tennessee Code Annotated § 33-6-501, or who have been
convicted of serious criminal conduct related to such mental illness.
A group of not more than eight unrelated persons over the age of sixty-five,
including two additional persons acting as houseparents or guardians, living
together as a single housekeeping unit.
The updates to the Fair Housing Act in 1988 was in part intended to prohibit the application of
special requirements through land-use regulations, restrictive covenants, and conditional or
special use permits that have the effect of limiting the ability of (the disabled) to live in the
residence of their choice in the community. This also includes regulation and licensing
requirements for group homes. The great majority of group homes for persons with disabilities
are subject to state regulations intended to protect the health and safety of their residents. HUD
has found that licensing requirements are necessary and serve a legitimate purpose. However,
local decision makers must also recognize that not all individuals with disabilities living in group
home settings desire or need the same level of services or protection and requests for reasonable
accommodation should be honored where appropriate. The zoning ordinance was revised in 2009

MDHA Analysis of Impediments to Fair Housing
Page 33
to include language that specifically states the procedures to be followed for persons making
reasonable accommodation requests and that a determination must be made within 30 days:
The provisions of this title shall in every instance be construed, applied and
enforced in a manner consistent with applicable federal law, including but not
limited to the Fair Housing Act, 42 U.S.C. § 3601 et. seq.; the Americans with
Disabilities Act, 42 U.S.C. § 12132, et. seq.; and the Religious Land Use and
Institutionalized Persons Act, 42 U.S.C. § 2000cc et. seq. Notwithstanding any
other provision of this title to the contrary, the zoning administrator shall make
reasonable accommodations in the rules, policies, and practices of his office so that
handicapped or disabled persons or a provider of housing for a handicapped or
disabled person are not discriminated against and are afforded an equal opportunity
to use and enjoy dwellings.
MDHA reviewed the dispersion of licensed group homes that serve persons with disabilities
(ATTACHMENT 1). There is a lack of licensed homes in the southwestern portion of the
County. Otherwise, licensed group homes are not concentrated.
In 2009, the Metropolitan Government entered into a consent decree to resolve a federal lawsuit
regarding land use discrimination. The Metropolitan Government had denied a building permit to
an organization that wanted to operate a substance abuse program. The consent decree requires
the Metropolitan Government to train nearly 100 employees and officials who make zoning and
land use decisions on the requirements of the FHA, to appoint a compliance officer to receive
complaints and ensure compliance with the settlement, and to provide periodic reports to the
Justice Department. As part of the settlement, the Metropolitan Government rescinded the
amendment to its zoning code and adopted a reasonable accommodation policy for individuals
with disabilities.
Municipal Services and Neighborhood Revitalization
In 1963, the City of Nashville and the Davidson County government merged to form the
“Metropolitan Government of Nashville and Davidson County”. Delivery of municipal services
was organized into the General Services District (GSD) and the Urban Services District (USD).
The GSD embraces the entire area of Davidson County and its residents are taxed to support

MDHA Analysis of Impediments to Fair Housing
Page 34
those services, functions and debt obligations which are deemed properly chargeable to the
whole population. Such services include general administration, police, fire protection, courts,
jails, health, welfare, hospitals, streets and roads, traffic, schools, parks and recreation, airport
facilities, auditoriums, public housing, urban renewal, planning and public libraries. USD
residents are charged an additional tax to support those services, functions and debt obligations
which benefit only the USD. Such services include additional police protection, storm sewers,
street lighting and refuse collection.
There are also seven smaller municipalities within Davidson County: Belle Meade, Berry Hill,
Forest Hills, Lakewood, Oak Hill, a portion of Goodlettsville, and a portion of Ridgetop. These
municipalities share responsibilities of municipal services and governance with Metro.
MDHA reviewed the provision of municipal services and did not find evidence of an impediment
to fair housing choice. MDHA also reviewed racial and ethnic demographic data collected for its
annual performance reports for HUD and found no evidence of impediments.
MDHA Design Review Committee
MDHA provides for some oversight of its redevelopment districts through the Design Review
Committees. These committees review building permit applications referred by the Codes
Department for developments within the eight redevelopment districts, and provides informal
feedback on proposed development projects. Each redevelopment district has two local
representatives. The Committee’s decisions can be appealed to an Administrative Appeals Board
comprised of three members of MDHA management.
Affordable Housing Programs
New rental housing assisted with HOME funds must meet site and neighborhood standards per
the HOME regulations. One purpose of these standards is to ensure that rental housing is not
concentrated in minority neighborhoods. MDHA reviews each proposal to determine its potential
effect on the racial makeup of the neighborhood and all viable alternatives. A review of the
location of subsidized housing shows that units are not concentrated (ATTACHMENT 2).

MDHA Analysis of Impediments to Fair Housing
Page 35
Planning Commission
The Metro Planning Commission (MPC) reviews and approves subdivision plats, minor changes
to planned unit developments and urban design overlay districts, detailed neighborhood design
plans, community plan (sub area) updates and amendments, and bonds. It also reviews and
recommends to the Board of Zoning Appeals all special exception uses within Metro and all
variances within the Urban Zoning Overlay district.
The Commission is made up of 10 members who serve a four-year term without compensation,
except for the Metro Councilmember who serves a two-year term. A member may serve no more
than two consecutive terms. Eight of the 10 members are appointed by the Mayor and confirmed
by a majority vote of the Metro Council. The ninth member is the chair of the Metro Council’s
Planning & Zoning Committee and the tenth member is the Mayor.
Zoning Board of Appeals
The Metropolitan Board of Zoning Appeals (BZA) reviews and approves variances to zoning
code standards, special exception permits, changes to non-conforming uses and structures, and
appeals of a zoning administrator interpretation of the zoning code. The BZA holds public
hearings on any of these items within 60 days of an application being filed. The Board of Zoning
Appeals (BZA) is made up of seven members who serve a five-year term without compensation.
A member may serve no more than two consecutive terms. To be eligible to serve, a nominee
may not hold any public office or be employed by the Metro Government. Members are
appointed by the Mayor and confirmed by the Metro Council.
Visitability
While not required by law, the lack of visitable housing could potentially serve as an impediment
to fair housing choice for persons with disabilities. HUD defines a visitable unit as a unit where
at least one entrance at grade (with no step), is approached by an accessible route, such as a
sidewalk, and the entrance door and all interior doors on the first floor are at least 34 inches
wide, offering 32 inches of clear passage space. Other design features can include:
All wall switches controlling light fixtures and fans not more than 48 inches above
finished floor

MDHA Analysis of Impediments to Fair Housing
Page 36
Step-free entrances with an accessible route from a parking area or public way
Reinforced bathroom walls to support grab bars
First floor washroom/powder room designed to provide wheelchair access to both the
water closet and lavatory
All exterior and interior doors provide at least thirty two inches of clearance
Hallway width of at least forty two inches
An accessible rout through the hallways and passageways of the floor level served by the
step free entrance.
Private Sector
Discrimination is the most common form of impediments to fair housing choice within the
private sector. Discrimination exists when a tenant, prospective tenant or homebuyer is treated
differently than others on the basis of belonging to one of the protected classes. This may involve
refusing to rent or sell to someone, or doing so under different terms and conditions.
Discrimination can be found in many areas of the housing market, including but not limited to:
The sale and rental of housing and real estate practices such as blockbusting, deed
restrictions, trust or lease provisions, conversions of apartments to all-adult occupancy,
inaccessible design, or management firm “occupancy quotas”
Banking and insurance policies and practices pertaining to the financing, sale, purchase,
rehabilitation, and rental of housing that may affect the achievement of fair housing
choice
The discriminatory provision of mortgage brokerage services
Housing discrimination also includes the refusal to make reasonable accommodation for persons
with disabilities, such as waiving a no-pets policy for service animals or allowing alterations to
the unit. Based on the number of complaints received by HUD (Table 3.1), the most common
forms of discrimination on a national basis include the refusal to rent a dwelling and disparate
terms, conditions, and privileges associated with renting or sales of a housing unit. Table 3.2
shows that approximately four out of every five discrimination complaints were based on race or

MDHA Analysis of Impediments to Fair Housing
Page 37
disability. It should be noted that these statistics are based on the number of complaints received.
Actual discrimination may differ due to lack of reporting for certain types of discrimination. The
lack of reporting is discussed in greater detail in the next section.
MDHA held a public forum on September 16, 2009 to discuss housing discrimination with
community advocates and professionals in the housing industry. Minutes from the meeting can
be found in Appendix A.

MDHA Analysis of Impediments to Fair Housing
Page 38
TABLE 3.1: National Housing Discrimination Complaints by Discriminatory Action
Discriminatory Action FY2005 FY2006 FY2007 FY2008
Terms, Conditions, Privileges, Services, and Facilities in the Rental or Sale of Property 57% 58% 58% 56% Refusal to Rent 25% 26% 26% 26% Failure to Make a Reasonable Accommodation 18% 18% 21% 23% Coercion, Intimidation, Threats, Interference, and Retaliation 13% 13% 15% 13% Discriminatory Financing 6% 5% 4% 3% Discriminatory Notices, Statements, or Advertisements 7% 5% 6% 8% Refusal to Sell 4% 3% 2% 2% False Representation that a Dwelling is Not Available 3% 2% 2% 3%
Non-compliance with Design and Construction Requirements 4% 2% 2% 2% Failure to Permit a Reasonable Modification 2% 1% 2% 2% Steering 1% 1% 1% 1% Redlining <0.5% <0.5% <0.5% <0.5%
Insurance Discrimination <0.5% <0.5% <0.5% <0.5%
TABLE 3.2: National Housing Discrimination Complaints by Basis for Discrimination
FY2005 FY2006 FY2007 FY2008 Basis for Discrimination # % # % # % # %
Disability 3,766 41% 4,110 40% 4,410 43% 4,675 44% Race 3,472 38% 4,043 39% 3,750 37% 3,669 35% Familial Status 1,414 15% 1,433 14% 1,441 14% 1,690 16% Sex 961 10% 997 10% 1,008 10% 1,133 11% National Origin 1,225 13% 1,427 14% 1,299 13% 1,364 13% Hispanic/Latino 860 9% 931 9% 784 8% 848 8% Religion 218 2% 258 2% 266 3% 339 3% Color 142 2% 154 1% 173 2% 262 2% Retaliation 452 5% 577 6% 588 6% 575 5%
Total Complaints Filed 9,254 10,328 10,154 10,552
Table 3.3 and Graph 3.1 present complaints data summarized at the county, state, and national
level. The data was collected from HUD's Office of Fair Housing and Equal Opportunity
(FHEO) reporting system (TEAPOTS). A filed complaint does not mean that a discriminatory
act occurred; only that it was alleged. Davidson County’s statistics mirror those of the nation and
the state, except for the number of complaints based on National Origin.

MDHA Analysis of Impediments to Fair Housing
Page 39
TABLE 3.3: Housing Discrimination Complaints by Basis Basis National Tennessee Davidson Race 14,148 35% 331 47% 59 44%
Asian 290 1% 1 0% 0 0% Asian and White 33 0% 0 0% 0 0% Black or African American 11,516 29% 244 34% 46 35% Black and White 617 2% 27 4% 7 5% Hawaiian or Pacific Islander 24 0% 0 0% 0 0% Native American 216 1% 5 1% 3 2% Native American and Black 62 0% 1 0% 1 1% Native American and White 37 0% 2 0% 1 1% White 1,148 3% 30 4% 1 1% Other Multi-Racial 205 1% 21 3% 0 0%
Color 828 2% 28 4% 3 2% National Origin 5,234 13% 118 17% 32 24% National Origin - Hispanic 3,283 8% 88 12% 28 21% Disability 17,233 43% 297 42% 45 34% Familial Status 6,467 16% 94 13% 16 12% Religion 1,139 3% 26 4% 6 5% Sex 4,139 10% 101 14% 13 10% Retaliation 2,363 6% 13 2% 4 3% Total 40,009 708 133

MDHA Analysis of Impediments to Fair Housing
Page 40
GRAPH 3.1 FHEO Cases by Type of Discrimination
35%
2%
13%
8%
43%
16%
3%
10%
6%
47%
4%
17%
12%
42%
13%
4%
14%
2%
44%
2%
24%
21%
34%
12%
5%
10%
3%
0% 5% 10% 15% 20% 25% 30% 35% 40% 45% 50%
Race
Color
National Origin
National Origin - Hispanic
Disability
Familial Status
Religion
Sex
Retaliation
National Tennessee Davidson

MDHA Analysis of Impediments to Fair Housing
Page 41
The data in Table 3.4 was provided by the Tennessee Fair Housing Council (TFHC). 83% of the
complaints received by TFHC centered on rental issues.
TABLE 3.4: TFHC Housing Discrimination Complaints by Basis Basis
Ren
tal
Sal
es
Len
ding
Insu
ranc
e
Zon
ing
Har
assm
ent
Oth
er
Tot
als
Per
cent
Race 45 0 0 0 0 5 0 50 30% Color 3 0 0 0 0 0 0 3 2% Religion 2 0 0 0 0 0 0 2 1% National origin 11 1 0 0 0 1 0 13 8% Sex 4 0 0 0 0 0 0 4 2% Disability 61 2 1 0 15 0 2 81 49% Familial status 13 0 0 0 0 1 0 14 8% Total 139 3 1 0 15 7 2 167 Percent 83% 2% 1% 0% 9% 4% 1%
TABLE 3.5: THRC Housing Discrimination Complaints by Basis Basis
Rental Refusal Sales Refusal All Complaints
Percent
Race/Color 5 1 27 28% National Origin 1 13 14% Familial status 11 11% Disability 2 1 24 2% Sex (Gender) 1 10 10% Religion 2 2% Harassment/Coercion 9 9% Total 9 2 96
TABLE 3.6: THRC Housing Discrimination Complaints by Basis Basis
Nas
hvil
le
Ant
ioch
Joel
ton
Mad
ison
Can
e R
idge
Goo
dlet
tsvi
lle
Her
mit
age
Old
Hic
kory
Race/Color 20 1 1 1 1 3 National Origin 7 5 1 Familial status 7 1 2 Disability 18 2 1 2 1 Sex (Gender) 8 1 1 Religion 1 1 Harassment

MDHA Analysis of Impediments to Fair Housing
Page 42
Developers
The Fair Housing Act also requires newly constructed multifamily dwellings with four or more
units to include certain basic design features of accessibility intended to make the units usable by
a person who is or becomes disabled. In 2009, a complaint was filed against a local developer on
the basis of discrimination by failing to design and construct seven multi-family apartment
complexes in or around Nashville to be accessible to persons with disabilities in compliance with
the Fair Housing Act. The developments include Meadowcreek Apartments, Miller Town
Apartments, 17th Street Apartments, Forest View Apartments, Swiss Ridge Apartments,
Lakeside Apartments and Stonebridge Apartments.
Lenders and Lending Services
In the past, lenders would routinely refuse loans to sections of a community in a practice known
as redlining. Several federal initiatives, such as the Community Reinvestment Act, have curtailed
redlining and made credit more readily available to these communities. In addition,
advancements in computerized underwriting practices have removed some of the subjectivity of
local loan officers, and the potential for illegal discrimination, in the determination of
creditworthiness. As a result, discrimination in today’s financial services market is not as blatant
and is more difficult to detect. Financing is more available to borrowers, but the terms in which
the financing is offered can be discriminatory.
Subprime loans, taken on their own, are not predatory. They are necessary in order to provide
credit for borrowers who pose a higher credit risk for the lender because of poor credit histories,
high loan-to-home-value ratios, or other credit risk characteristics that would disqualify the
borrower from lower cost, prime-rate loans.
It is a violation of the Fair Housing Act to impose different terms or conditions on a loan, such as
different interest rates, points or fees based a person’s race, color, national origin, religion, sex,
familial status or disability. A recent study by the Urban Institute found that African-American
and Hispanic homebuyers received disparate treatment in terms of financing options.3 In
addition, Freddie Mac indicates that a third to a half of borrowers who qualify for low cost loans
receive subprime loans instead.

MDHA Analysis of Impediments to Fair Housing
Page 43
Minority consumers often have unequal access to loans at the best price and on the best terms
based on credit history, income, and other risk factors. High cost loans can be defined as first
mortgages with interest rates 3 percentage points higher than a benchmark rate and second
mortgages with interest rates 5 percentage points or higher than a benchmark rate. According to a
recent Woodstock Institute study, sixty percent of mortgages obtained by African American
households and 46 percent obtained by Hispanic families were high-cost loans.
This disparate treatment was not limited to lower income households. In fact, there was a higher
level of discrepancy when analyzing upper income households. A low-income African American
borrower was three times more likely to receive a high-cost loan than a low-income White
borrower. An African American earning more than $135,000 annually was five times more likely
to receive a high-cost loan than a White borrower at the same income level.
An investigation undertaken by the National Community Reinvestment Committee from 2004 to
2006 revealed disparate treatment by mortgage brokerages based on race and national origin in
46 percent of cases. The results of the investigation showed that White testers were offered better
pricing than African American or Hispanic testers.
As part of the analysis, MDHA analyzed data reported by lending institutions per the Home
Mortgage Disclosure Act (HMDA) for 2008 (Table 3.7) Additional data is provided in
ATTACHMENT 3. While HMDA data cannot be used to "prove" discrimination by banks and
other lending institutions, data can be used to determine whether discrimination may be
occurring. The data revealed that African Americans (38%) and Hispanics (32%) were more
likely to receive a high-cost loan than White borrowers (16%). MDHA also calculated the ratio
of denials to the number of loan originations for each race and ethnic group. The data shows that
while White borrowers received 1.5 denials for every ten originations, Hispanics and African
Americans received 4 and 3 denials for every ten originations, respectively. It is important to
note that this analysis does not account for differences in credit risk of the borrower.
HMDA data defines high cost loans as first mortgages with interest rates 3 percentage points
higher than a benchmark rate and second mortgages with interest rates 5 percentage points or
higher than a benchmark rate. 4

MDHA Analysis of Impediments to Fair Housing
Page 44
TABLE 3.7: 2008 Loan Originations, High Cost Loans, and Denials by Race and Ethnicity
High Cost Loans DenialsRace/Ethnicity Originations # % # RatioAmerican Indian 51 13 25% 16 31%Asian 511 91 18% 93 18%African American 3,025 1,161 38% 1,223 40%Pacific Islander 65 13 20% 19 29%White 13,673 2,211 16% 2,042 15%Not Provided 2,126 406 19% 643 30%Total 19,451 3,895 20% 4,036 21%Hispanic 1,043 335 32% 325 31%
source: 2008 HMDA
Real Estate Services
The services of real estate professionals are critical in the provision of fair housing choice.
Homebuyers rely heavily on the professional’s expertise of the local market. The National Fair
Housing Alliance (NFHA) has focused recent studies on the role of real estate agents and the
prevalence of discrimination within the profession. The results of the study reveal discriminatory
steering practices and disparate treatment. Racial steering is the practice of limiting a buyer’s
choice, through comments or actions, to specific neighborhoods based on race or national origin.
MDHA convened a focus group on local fair housing issues during the development of this
analysis. A real estate agent in attendance stated that steering exists in the community, but buyers
affected by the steering do not feel filing a complaint is worth the trouble. The agent also had
encountered cases where sellers had discriminated against Arab purchasers.
The NFHA study showed that African-American and Latino buyers were refused appointments
or offered very limited service by real estate agents one out of every five times. The limited
service was described as the buyer never receiving a return call from the agent after several
messages and scheduling appointments that the agent never kept. In paired testing, agents
showed white buyers an average of eight homes, while African-American and Latino testers saw
an average of five homes.
Per state licensing requirements, Tennessee realtors must meet educational requirements that
include a fair housing component. The educational requirements include initial work before
receiving a license and continuing education as well.
MDHA Analysis of Impediments to Fair Housing
Page 45
Public and Private Sector
Fair Housing Enforcement
Effective fair housing enforcement lies at the heart of a comprehensive program to affirmatively
further fair housing. Testing has proven to be one of the most effective ways to combat
discrimination and enforce fair housing choice.5 In most communities, this role is undertaken by
fair housing advocacy organizations whose sole mission is to promote fair housing choice.
Davidson County is served by the Tennessee Fair Housing Council (TFHC) and the Tennessee
Human Rights Commission (THRC). Both TFHC and THRC receive funds directly from HUD
to conduct fair housing activities.
The Tennessee Human Rights Commission is an independent state agency charged with
preventing and eradicating discrimination in employment, public accommodations, and housing.
The Commission has cooperative agreements with the U.S. Department of Housing and Urban
Development (HUD) and the Equal Employment Opportunity Commission (EEOC). These
agreements allow the federal and state agencies to coordinate their investigations and avoid
duplication of efforts in seeking to end discrimination. The Commission has its central office in
Nashville.
The Tennessee Fair Housing Council is a private, non-profit advocacy organization whose
mission is to eliminate housing discrimination throughout Tennessee. The Council undertakes
outreach, education and enforcement actions. Enforcement includes the receipt of complaints,
investigation, counseling, and administrative actions or lawsuits. Their enforcement program is
based in Nashville and concentrates on Davidson, Cheatham, Dickson, Rutherford, Sumner,
Williamson and Wilson counties.
Informational Programs
A 2002 HUD study found that only seventeen percent of individuals who believed they had
experienced housing discrimination took some action in response. Of those who took action,
only one percent said they reported the discrimination to a government agency. Recent studies
have shown that discrimination based on national origin is largely underreported, specifically by
Latinos, Asian-Americans, and Native Americans. These studies suggest several reasons for the
underreporting of housing discrimination:

MDHA Analysis of Impediments to Fair Housing
Page 46
Housing discrimination is often not readily identifiable by consumers
Language barriers and other cultural issues, including immigration status, hesitancy to
challenge authority, and a general lack of faith in the justice system
Low expectations of a good result. Two-thirds of those who expected that filing a
complaint would bring about a good outcome said they would be very likely to file one if
they were discriminated against, compared to less than one-fourth of those who did not
anticipate good results.
Aggressive informational programs have shown to be effective in encouraging persons who
suffer from discrimination to report it. The five counties across the country with the highest rate
of complaints reported 51 to 96 housing discrimination complaints per 100,000 households.6 All
five counties cited informational and outreach programs as effective tools.
There is also a need for greater financial literacy in general. A recent study by the FDIC revealed
that a substantial proportion of minority households did not have a banking relationship with a
formal financial institution. These households are considered “unbanked” and often turn to high-
cost financial services such as pay-day loan stores. An earlier study by the Chicago Federal
Reserve showed that language and culture play an important role for Hispanic consumers
seeking financial services. The County can take an active role in bridging the language/cultural
gap by organizing English language and financial literacy programs, potentially in tandem with
financial institutions.7 A study commissioned by the Mortgage Bankers Association of America
(MBAA) documented a widespread view among minority renters that they would fare poorly
when obtaining a mortgage. Among those who had never applied for a mortgage, 32 percent of
African-Americans and 24 percent of Hispanics believed they would encounter discrimination
because of their race or ethnic background.8
Persons who do not speak English as their primary language and who have a limited ability to
read, write, speak, or understand English are defined as Limited English Proficient (LEP) and
may be entitled to language assistance with respect to participating in federally-funded programs.
Language for LEP persons can be a barrier to accessing important benefits or services,
understanding and exercising important rights, complying with applicable responsibilities, or
understanding other information provided by federally-funded programs and activities. Per
Section 601 of Title VI of the Civil Rights Act of 1964, recipients of federal financial assistance
MDHA Analysis of Impediments to Fair Housing
Page 47
have an obligation to reduce language barriers that can preclude meaningful access by LEP
persons to important government programs, services, and activities.

MDHA Analysis of Impediments to Fair Housing
Page 48
Summary of Impediments to Fair Housing Choice
Impediment #1: Lack of Public Awareness: There is evidence that a substantial
number of persons who suffer from discrimination do not report it. A HUD study found
that of the people who suspect housing discrimination, only 1% reported the case to a
government agency.9 Among the reasons for a lack of reporting include the inability to
identify the discrimination and the belief that nothing will result from the report. In some
cases, limited English proficiency plays a role as well. The largest impediment to fair
housing choice is a lack of consumer education regarding fair housing rights. There is a
need for a multi-faceted approach that can effectively reach all effected parties, including
housing consumers, housing professionals and landlords, government officials, and
public advocacy groups.
Impediment #2: Need for Greater Coordination: Greater coordination is needed
among housing providers, housing professionals, government agencies, and advocacy
groups. Coordination can be increased in both quality and quantity. The agencies already
involved in fair housing efforts can collaborate more to maximize effectiveness. In
addition, there is a need to include a greater number of organizations to the process in a
more consistent manner. These agencies include other departments of Metro government,
outside agencies, and federally-funded subrecipients.
Impediment #3: Disparate Treatment in the Rental Market: The statistics reported by
local fair housing agencies and the U.S. Department of Housing and Urban Development
indicate discrimination based on race, disability and familial status, especially in the
rental market. Disparate treatment in the provision of rental housing is a clear
impediment to fair housing choice.
Impediment #4: Disparate Treatment in Subprime Lending: Analysis of lending data
required by the Home Mortgage Disclosure Act (HMDA) revealed that minority
households were more likely to receive a high-cost loan than White households.
Disparate treatment in mortgage lending is a clear impediment to fair housing choice.
Impediment #5: Lack of Awareness Among Metro Boards and Staff: The Tennessee
Fair Housing Council reports that some Metro boards such as Fire and Building Codes
have failed to grant reasonable accommodations to persons with disabilities and Metro
MDHA Analysis of Impediments to Fair Housing
Page 49
Codes has approved occupancy for multi-family buildings that do not comply with the
Fair Housing Act.
Proposed Actions to Affirmatively Further Fair Housing As a recipient of the Community Development Block Grant (CDBG), MDHA must take
appropriate actions to overcome the effects of the impediments identified within this plan and
maintain records reflecting that analysis and actions in this regard. MDHA proposes to undertake
the following actions to affirmatively further fair housing choice within its jurisdiction.
Public Awareness
MDHA will utilize multiple avenues to outreach to the public to communicate their right to fair
housing choice and how to identify and report potential discrimination. Efforts will include:
1.6 Material Distribution: MDHA will distribute fair housing marketing materials aimed at
educating County residents of their right to fair housing, how to identify discrimination,
and how to report it. The goal of the material is to reach people who experience
discrimination but do not report it. MDHA will research strategies for increasing
awareness in “low minority” areas and collaboration opportunities with other agencies,
institutions of higher education, churches, and schools.
1.7 Fair Housing Website and Hotline: MDHA will maintain a dedicated fair housing page
on its website. The webpage will act as an information clearinghouse for residents,
housing professionals working in Davidson County, and all Metro employees. The
website will also include periodic updates related to fair housing. For those without
internet access, MDHA will continue to sponsor the Fair Housing Hotline, a recorded
message system that provides information on how to file a complaint and referral
information to local fair housing agencies.
1.8 Media Advertising and Press Releases: MDHA will use display ads in minority papers
to advertise local fair housing resources, including its web page. MDHA will issue
periodic press releases to highlight current issues, publication of reports, the Fair Housing
Conference and other newsworthy events.
1.9 Coordination with Non-Profits and Other Government Agencies: MDHA will work
closely with fair housing agencies, non-profit housing professionals, and other local

MDHA Analysis of Impediments to Fair Housing
Page 50
government agencies to ensure fair housing efforts are coordinated amongst agencies.
MDHA will serve as an information resource to other Metro departments for fair
housing-related issues.
1.10 Fair Housing Conference: MDHA will continue to sponsor an annual fair housing
conference to highlight local fair housing issues, solutions, and to raise awareness. The
conference will serve as an educational forum for the general public and local housing
professionals. The conference will be held in April to coincide with the national
celebration of Fair Housing Month.
Metro Nashville and Davidson County Compliance and Procedure
2.14 FHA Compliance Officer: The Metro Planning Department will continue to support an
FHA compliance officer to respond to complaints regarding land use discrimination. This
action is required as part of the consent decree between the Department of Justice and the
Metro government.
2.15 Staff Training: New Metro staff and elected officials involved with land use and zoning
decisions will receive training on fair housing and the Fair Housing Act. This includes
Metropolitan Council, Director of Council Staff, Special Counsel advising on zoning and
land use, Metro Planning Commission (MPC), Advisors to the MPC, Zoning
Administrator, and the Board of Zoning Appeals.
MDHA Compliance and Procedure
2.16 Subrecipient Monitoring Compliance and Capacity Building: MDHA will
continually monitor all of its subrecipient organizations and contractors for compliance
with federal rules and regulations. Before participating in MDHA’s programs, the
subrecipient must agree to:
comply all federal, state and local laws relating to fair housing and equal opportunity,
operate their facilities and services and conduct their outreach on a nondiscriminatory
basis, and
MDHA Analysis of Impediments to Fair Housing
Page 51
adopt policies to ensure effective communication with applicants, beneficiaries, and
members of the public who have hearing, vision, or speech impairments regarding the
availability of accessible services, activities and facilities.
Where necessary, MDHA will sponsor capacity building sessions to ensure all
subrecipients are well-trained to administer their programs in a manner that affirmatively
furthers fair housing.
2.17 Neighborhood Improvement: MDHA’s Neighborhood Improvement Program will fund
infrastructure and community development projects in low-income areas. The goal of the
program is to provide opportunities for collaboration and expand existing resources for
investments that are critical to neighborhood infrastructure and that support neighborhood
enhancement. MDHA will give additional consideration to areas with high minority
concentration. Over the course of the five-year plan, it is expected that this program will
receive approximately 30% of CDBG allocations.
2.18 Site and Neighborhood Standards: New rental housing assisted with HOME funds
must meet site and neighborhood standards per the HOME regulations. One purpose of
these standards is to ensure that rental housing is not concentrated in minority
neighborhoods. MDHA will review each proposal to determine its potential effect on the
racial makeup of the neighborhood and all viable alternatives. The goal of this standard is
to produce a reasonable distribution and balance of housing choices within and outside
areas of minority concentration.
2.19 Affirmative Marketing Plans: MDHA will require each HOME-funded project
containing 5 or more HOME-assisted housing units to develop an Affirmative Marketing
Plan. Affirmative marketing differs from general marketing activities as it specifically
targets potential tenants and homebuyers who are least likely to apply for the housing, in
order to make them aware of available affordable housing opportunities.
Each project will summarize what segment of the populations it is targeting and specific
actions it will take to market to those populations. Specific actions include use of
commercial media, neighborhood outreach, and marketing through local organizations
such as community organizations, places of worship, employment centers, fair housing
groups, and housing counseling agencies. In addition, each covered project will:

MDHA Analysis of Impediments to Fair Housing
Page 52
Distribute information to potential owners and tenants about Federal fair housing
laws and MDHA’s affirmative marketing policy.
Use the Equal Housing Opportunity logo on all advertising for the property and on all
tenant applications.
Visibly display a fair housing poster in the office where tenants pick up applications.
Maintain records that describe actions taken by the property to affirmatively market
units and records to assess the results of these actions.
MDHA will review its affirmative marketing performance and that of HOME-assisted
properties as part of the monitoring process and on an annual basis as part of the CAPER
report. The review will include an analysis of deficiencies and will recommend corrective
actions where necessary.
2.20 Visitability: Visitability is a design concept that enables persons with disabilities to
visit relatives, friends, and neighbors in their homes within a community. Visitability also
expands the availability of housing options for individuals who may not require full
accessibility. Applicants to MDHA’s Affordable Housing Program and Rental
Rehabilitation Program will receive additional consideration for incorporating visitability
elements into their properties. A visitable unit is defined as a unit where at least one
entrance at grade (with no step), is approached by an accessible route, such as a sidewalk,
and the entrance door and all interior doors on the first floor are at least 34 inches wide,
offering 32 inches of clear passage space.
2.21 Accessibility and Section 504 Compliance: MDHA will ensure compliance with
Section 504 of the Rehabilitation Act of 1973 for all of its CDBG and HOME-funded
projects. This includes accessibility for all new non-housing facilities, feasible alterations
to existing non-housing facilities, and operation of its existing non-housing facilities.
MDHA will periodically update its self-assessment and transition plan to ensure all
facilities are in compliance.
Applicants to MDHA’s Affordable Housing Program and Rental Rehabilitation Program
will receive additional consideration for providing more than the required number of
accessible units. In addition, MDHA will encourage its partners to distribute accessible

MDHA Analysis of Impediments to Fair Housing
Page 53
units throughout its funded properties and make them available in a sufficient range of
sizes and amenities so as not to limit choice. All funded properties will be required to
adopt policies that reasonable accommodation/ modification and outreach regarding the
availability of accessible units.
2.22 Limited English Proficiency: MDHA will conduct a four factor analysis to ensure that
persons with Limited English Proficiency have meaningful access to programs funded by
the Consolidated Plan. MDHA will develop a Language Assistance Plan (LAP) to
provide a framework for the provision of timely and reasonable language assistance.
2.23 Homeowner Rehabilitation: MDHA’s Homeowner Rehabilitation Program will provide
deferred loans to disabled homeowners to make needed home repairs and accessibility
modifications.
2.24 Homebuyer Outreach and Education: MDHA will affirmatively market its
Downpayment Assistance Program to minority populations. In addition, the program will
incorporate fair housing and fair lending education into its required counseling
component. The goal of the program is to increase the affordability of homeownership for
households earning less than 80% of the area median income.
2.25 Referral and Enforcement: MDHA will continue to partner with the Tennessee Human
Rights Commission (THRC) and the Tennessee Fair Housing Council, and the Metro
Human Relations Commission to respond to and investigate fair housing complaints. Fair
housing agencies will be encouraged to apply to the CDBG Community Services
Program for funding of testing and enforcement efforts. Potential projects would include
in-depth audit testing of housing practices within the rental and sales markets focused on
identifying any patterns and practices, such as neighborhood steering, or other forms of
housing choice denials that could be potential violations of fair housing laws.
2.26 Fair Housing Initiatives Program (FHIP): MDHA will explore the possibility of
participating in the FHIP program. Through FHIP, MDHA can participate in the
Education and Outreach Initiative (EOI) to offer a comprehensive range of fair housing
activities that explain to the general public and housing providers what equal opportunity
in housing means and what housing providers need to do to comply with the Fair
Housing Act. Activities may include developing education materials, analyzing local

MDHA Analysis of Impediments to Fair Housing
Page 54
impediments to housing choice, providing housing counseling and classes, convening
meetings that bring together the housing industry with fair housing groups, developing
technical materials on accessibility, and mounting public information campaigns.
Recordkeeping MDHA will maintain the following records regarding fair housing and equal opportunity:
Documentation of the analysis of impediments and the actions the recipient has carried
out with its housing and community development and other resources to remedy or
ameliorate any impediments to fair housing choice in the recipient's community.
Data on the extent to which each racial and ethnic group and single-headed households
(by gender of household head) have applied for, participated in, or benefited from, any
program or activity funded in whole or in part with CDBG funds. Such information shall
be used only as a basis for further investigation as to compliance with nondiscrimination
requirements.
Data on employment in the categories prescribed on the Equal Employment Opportunity
Commission's EEO-4 form; and documentation of any actions undertaken to assure equal
employment opportunities to all persons regardless of race, color, national origin, sex or
handicap.
Data indicating the race and ethnicity of households (and gender of single heads of
households) displaced as a result of CDBG funded activities, together with the address
and census tract of the housing units to which each displaced household relocated. Such
information shall be used only as a basis for further investigation as to compliance with
nondiscrimination requirements.
Documentation of actions undertaken to meet the requirements of Sec. 570.607(b) which
implements section 3 of the Housing Development Act of 1968, as amended (12 U.S.C.
1701U) relative to the hiring and training of low and moderate income persons and the
use of local businesses.
Data indicating the racial/ethnic character of each business entity receiving a contract or
subcontract of $25,000 or more paid, or to be paid, with CDBG funds. This information

MDHA Analysis of Impediments to Fair Housing
Page 55
will include the amount of the contract or subcontract, and documentation of recipient's
affirmative steps to assure that minority business and women's business enterprises have
an equal opportunity to obtain or compete for contracts and subcontracts as sources of
supplies, equipment, construction and services.
If applicable, documentation of the affirmative action measures the recipient has taken to
overcome prior discrimination, where the courts or HUD have found that the recipient
has previously discriminated against persons on the ground of race, color, national origin
or sex in administering a program or activity funded in whole or in part with CDBG
funds.

MDHA Analysis of Impediments to Fair Housing
Page 56
Appendix A: Meeting Notes from Public Forum on Housing Discrimination

Analysis of Impediments to Fair Housing Choice Meeting September 16, 2009 Randee Rogers Training Center 1419 Rosa L. Parks Blvd. The Metropolitan Development and Housing Agency (MDHA) sponsored the Fair Housing Plan Update Meeting (2009 Update to the Analysis of Impediments to Fair Housing Choice), September 16, 2009, Randee Rogers Training Center, 1419 Rosa L. Parks Blvd. to review and analyze the existing Analysis of Impediments (AI) 2004, and share ideas and concerns regarding the current environment. Representatives from the Council on Aging, Tennessee Human Rights Commission (THRC), Realtors, financial institutions, Metro Human Relations, Metro Legal, Metro Planning, and Metropolitan Development and Housing Agency (MDHA) attended the meeting. The following is a summary of the issues presented at the meeting. Things [family structure, housing, population groups] have changed since the AI was prepared in 2004. Families have changed. There are Grand Families today. [Grand Families is a term which refers to grandparents and other relatives who provide full-time care for relative children.] Grand Families live in restrictive housing, a small place, but need a larger place to live. There are cultural changes. A younger, unmarried brother may live with another brother. Housing for the elderly and disabled may need design modification. The older residents die and a greater percentage of the residents are under the age of 60. As the population ages, there are accommodation and modification issues. People become disabled as they get older, becoming newly-disabled people. They may not be aware they can ask the landlord for accommodations and modifications. There is a large international population in the county. Many of these families are large and need large dwelling units. There are many differences in languages and cultures. (There are between 71-78 different languages in the public schools.) Some of the immigrant population is bi-lingual. The most discrimination complaints received by THRC pertain to familial status needs and disability. Most of the complaints are about rental property and landlords. (Example: a landlord removes a ramp. Sometimes it is a fight, particularly if a homeowner association is involved, to have a ramp put in because of esthetic reasons.) For many years it has been difficult to provide incentives for constructing affordable housing and diversity of housing. There is a lot of “not in my backyard” (NIMBY)—a

lot of push back. Predevelopment costs, land and other front-end costs are much higher today. The margins of profit are low. Fair housing testing is done today. Realtors know that testing is not just theory. It is necessary. THRC does not do their testing. THRC does not have the resources to do testing. Specific qualifications are required. THRC contracts for testing services. THRC does test calling to real estate agencies. Some testing is based on familial status. It is not random, but based on advertisements in newspapers. THRC will call to verify if the ad is true. Occasionally, THRC will get a tip. Some people may not be aware they have been discriminated against. The person who has been discriminated against, even if he/she is aware of the discrimination, may not be up to the fight. Sometimes discrimination is not reported because of lack of knowledge about the discrimination reporting process. (The process for reporting discrimination is online in lay language.) Discrimination occurs when potential buyers and/or potential renters (Section 8, low barriers and standards) are disadvantaged or on fixed income. Sellers think the buyer will not qualify and the transaction will fall through. Sellers discriminate by not wanting to sell to a particular ethnic group for the same reason. The seller does not want low-income to buy the home. MDHA reports annually to HUD about what has been done to affirmatively further fair housing choice. MDHA is committed to affirmatively further fair housing choice. Brochures would not be effective in getting the word out about fair housing choice to senior citizens. They will not use brochures. They want immediate information (like a phone number) when they want information. (A brochure might be too complicated. In the past, publications had to be written at eighth grade reading level; now the level may be at sixth grade reading level.) Fair housing choice can be affirmatively furthered by: 1) fair housing professionals conversing with each other throughout the year about fair housing issues 2) by harnessing the power of the many non-profits in Nashville; 3) communicating information online; 4) contacting specific agencies; 5) reporting to the city on what has been accomplished, thus, getting feedback from citizens; and 6) the annual fair housing conference which is for whoever is interested.

Attachment 1: Licensed Care Homes

#Y
#Y #Y
#Y#Y
#Y#Y
#Y
#Y#Y
#Y
#Y#Y
#Y#Y
#Y#Y
#Y
#Y
#Y
#Y #Y
#Y
#Y
#Y
#Y
#Y
#Y
#Y
#Y
#Y#Y
#Y
#Y#Y #Y
#Y
#Y
#Y#Y
#Y#Y
#Y#Y
#Y
#Y#Y
#Y
#Y
#Y
#Y
#Y
#Y#Y
#Y
#Y#Y
#Y
#Y#Y
#Y#Y#Y
#Y
#Y
#Y
#Y#Y
#Y
#Y#Y#Y
#Y#Y
#Y
#Y
#Y
Mental Health Related#Y
Alcohol/Drug Related#Y
MRDD Related#Y
Licensed Care Homes in Davidson County Low and Moderate Income Areas
Non-Low and Moderate Income Area
Low and Moderate Income Area

Attachment 2:
MDHA Public Housing Properties
Other Subsidized Housing Properties
MDHA HOME Properties
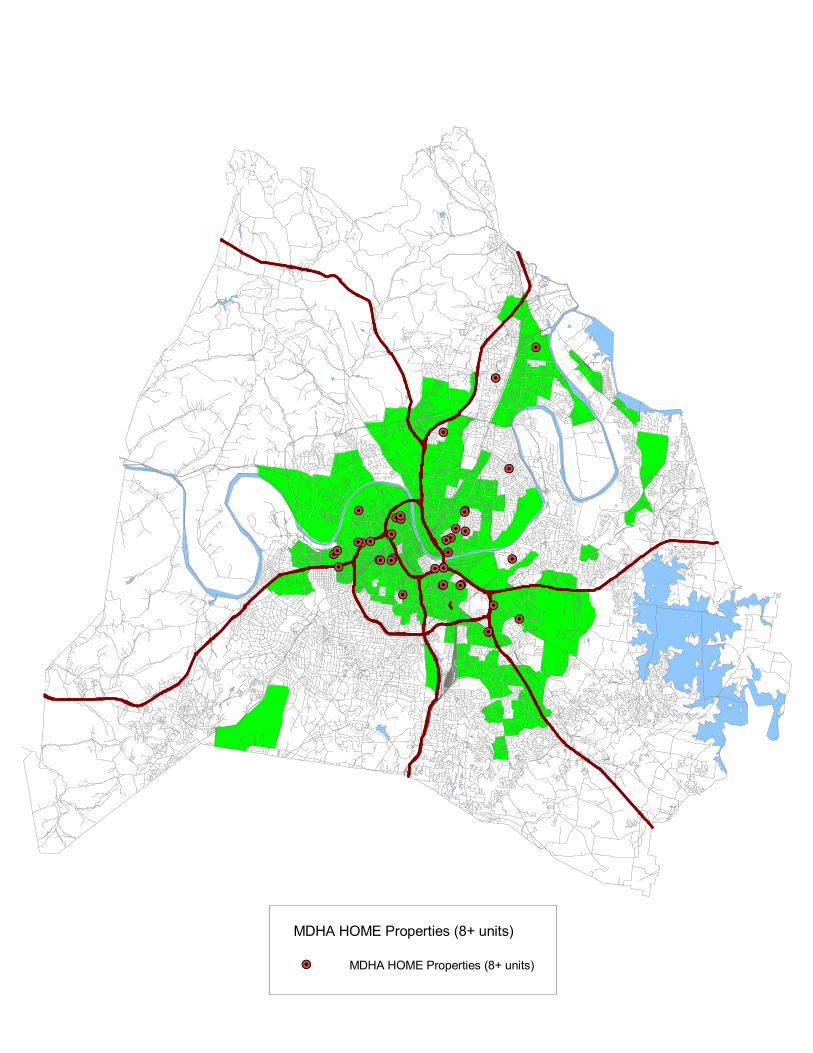
#Y
#Y
#Y
#Y#Y#Y
#Y
#Y
#Y
#Y
#Y
#Y
#Y
#Y#Y
#Y
#Y
#Y
#Y
#Y
#Y
#Y
#Y
#Y
#Y
#Y#Y
#Y
#Y#Y
#Y
#Y
#Y
#Y
#Y
#Y
#Y
#Y
#Y
MDHA HOME Properties (8+ units)#Y
MDHA HOME Properties (8+ units)

#Y
#Y
#Y
#Y
#Y #Y
#Y
#Y
#Y
#Y
#Y
#Y
#Y
#Y#Y
#Y#Y
#Y#Y
MDHA Family Properties#Y MDHA Elderly/Disabled Properties#Y
MDHA Public Housing Properties

#Y
#Y#Y
#Y
#Y#Y
#Y#Y
#Y
#Y
#Y
#Y
#Y
#Y
#Y
#Y#Y
#Y
#Y
#Y
#Y
#Y #Y
#Y
#Y
#Y
#Y
#Y
#Y#Y
#Y#Y
#Y
#Y
#Y#Y
#Y
#Y
#Y
#Y
#Y
#Y
#Y
#Y
#Y#Y
#Y
#Y
#Y#Y
#Y
#Y
#Y
#Y
#Y
#Y
#Y
Low Income Housing Tax Credit Properties#Y HUD Subsidized Properties#Y
Other Subsidized Housing Properties

Attachment 3A:
Loan Actions By Race

HMDA 2006: Loan Actions by Largest Originators
Loan Actions by Race
12 Highest Volume Originators - Total
Originated
Approved Not
Accepted Denied Withdrawn Incomplete Pre Denied
American Indian 80 15 15 14 1 0
Asian 722 111 152 86 16
African American 2511 301 753 349 41
Pacific Islander 59 12 15 3 1
White 25762 2433 3338 3082 394 6
Not Provided 3513 429 630 660 29
Not Applicable 59 8 9
Total 32706 3309 4912 4194 482 6
Originated
Approved Not
Accepted Denied Withdrawn Incomplete Pre Denied
American Indian 64% 12% 12% 11% 1% 0%
Asian 66% 10% 14% 8% 1% 0%
African American 63% 8% 19% 9% 1% 0%
Pacific Islander 66% 13% 17% 3% 1% 0%
White 74% 7% 10% 9% 1% 0%
Not Provided 67% 8% 12% 13% 1% 0%
Not Applicable 78% 11% 12% 0% 0% 0%Total 72% 7% 11% 9% 1% 0%
National City Bank (OH)
Originated
Approved Not
Accepted Denied Withdrawn Incomplete Pre Denied
American Indian 7 3 1
Asian 43 8 4 1
African American 354 63 53 5 1
Pacific Islander 2 1
White 1598 295 193 14 4 6
Not Provided 203 77 53 1
Not Applicable 22
Total 2205 448 304 22 27 6
Originated
Approved Not
Accepted Denied Withdrawn Incomplete Pre Denied
American Indian 64% 27% 0% 9% 0% 0%
Asian 77% 14% 7% 2% 0% 0%
African American 74% 13% 11% 1% 0% 0%
Pacific Islander 0% 67% 33% 0% 0% 0%
White 76% 14% 9% 1% 0% 0%
Not Provided 61% 23% 16% 0% 0% 0%
Not Applicable 0% 0% 0% 0% 100% 0%Total 73% 15% 10% 1% 1% 0%
Page 1 of 7

HMDA 2006: Loan Actions by Largest Originators
Loan Actions by Race
Wells Fargo
Originated
Approved Not
Accepted Denied Withdrawn Incomplete Pre Denied
American Indian 8 4 2
Asian 67 21 10 7 1
African American 139 45 83 12 1
Pacific Islander 4 3 1
White 2036 455 366 102 9
Not Provided 274 76 96 28 1
Not Applicable 3
Total 2531 604 558 149 12 0
Originated
Approved Not
Accepted Denied Withdrawn Incomplete Pre Denied
American Indian 57% 29% 14% 0% 0% 0%
Asian 63% 20% 9% 7% 1% 0%
African American 50% 16% 30% 4% 0% 0%
Pacific Islander 50% 38% 13% 0% 0% 0%
White 69% 15% 12% 3% 0% 0%
Not Provided 58% 16% 20% 6% 0% 0%
Not Applicable 100% 0% 0% 0% 0% 0%Total 66% 16% 14% 4% 0% 0%
Bank of America
Originated
Approved Not
Accepted Denied Withdrawn Incomplete Pre Denied
American Indian 9 4 4
Asian 138 47 35 1
African American 157 49 101
Pacific Islander 6 3 2
White 2033 453 395 4 9
Not Provided 278 83 75 1 2
Not Applicable 1
Total 2622 639 612 6 11 0
Originated
Approved Not
Accepted Denied Withdrawn Incomplete Pre Denied
American Indian 53% 24% 24% 0% 0% 0%
Asian 62% 21% 16% 0% 0% 0%
African American 51% 16% 33% 0% 0% 0%
Pacific Islander 55% 27% 18% 0% 0% 0%
White 70% 16% 14% 0% 0% 0%
Not Provided 63% 19% 17% 0% 0% 0%
Not Applicable 100% 0% 0% 0% 0% 0%Total 67% 16% 16% 0% 0% 0%
Page 2 of 7

HMDA 2006: Loan Actions by Largest Originators
Loan Actions by Race
Countrywide Home Loans (CA)
Originated
Approved Not
Accepted Denied Withdrawn Incomplete Pre Denied
American Indian 24 1 3 9 1
Asian 195 6 19 30 1
African American 624 38 223 146 14
Pacific Islander 9
White 6976 209 886 1170 72
Not Provided 1246 34 211 332 9
Not Applicable
Total 9074 288 1342 1687 97 0
Originated
Approved Not
Accepted Denied Withdrawn Incomplete Pre Denied
American Indian 63% 3% 8% 24% 3% 0%
Asian 78% 2% 8% 12% 0% 0%
African American 60% 4% 21% 14% 1% 0%
Pacific Islander 100% 0% 0% 0% 0% 0%
White 75% 2% 10% 13% 1% 0%
Not Provided 68% 2% 12% 18% 0% 0%
Not ApplicableTotal 73% 2% 11% 14% 1% 0%
Countrywide Bank, NA (VA)
Originated
Approved Not
Accepted Denied Withdrawn Incomplete Pre Denied
American Indian 3 2 3 2
Asian 22 6 8 14
African American 85 25 29 39
Pacific Islander 3 2
White 1052 389 418 731
Not Provided 171 63 72 110
Not Applicable
Total 1336 485 532 896 0 0
Originated
Approved Not
Accepted Denied Withdrawn Incomplete Pre Denied
American Indian 30% 20% 30% 20% 0% 0%
Asian 44% 12% 16% 28% 0% 0%
African American 48% 14% 16% 22% 0% 0%
Pacific Islander 60% 0% 40% 0% 0% 0%
White 41% 15% 16% 28% 0% 0%
Not Provided 41% 15% 17% 26% 0% 0%
Not ApplicableTotal 41% 15% 16% 28% 0% 0%
Page 3 of 7

HMDA 2006: Loan Actions by Largest Originators
Loan Actions by Race
Suntrust Mortgage (VA)
Originated
Approved Not
Accepted Denied Withdrawn Incomplete Pre Denied
American Indian 7
Asian 109 9 5 24 1
African American 389 48 37 59 8
Pacific Islander 12 4 1
White 4059 318 149 537 23
Not Provided 861 62 31 127 7
Not Applicable
Total 5437 441 222 748 39 0
Originated
Approved Not
Accepted Denied Withdrawn Incomplete Pre Denied
American Indian 100% 0% 0% 0% 0% 0%
Asian 74% 6% 3% 16% 1% 0%
African American 72% 9% 7% 11% 1% 0%
Pacific Islander 71% 24% 0% 6% 0% 0%
White 80% 6% 3% 11% 0% 0%
Not Provided 79% 6% 3% 12% 1% 0%
Not ApplicableTotal 79% 6% 3% 11% 1% 0%
First Horizon Home Loan (TX)
Originated
Approved Not
Accepted Denied Withdrawn Incomplete Pre Denied
American Indian 5
Asian 45 22 1
African American 196 2 118 6
Pacific Islander 9 3
White 2402 4 409 107
Not Provided 183 3 36 4
Not Applicable
Total 2840 9 588 118 0 0
Originated
Approved Not
Accepted Denied Withdrawn Incomplete Pre Denied
American Indian 100% 0% 0% 0% 0% 0%
Asian 66% 0% 32% 1% 0% 0%
African American 61% 1% 37% 2% 0% 0%
Pacific Islander 75% 0% 25% 0% 0% 0%
White 82% 0% 14% 4% 0% 0%
Not Provided 81% 1% 16% 2% 0% 0%
Not ApplicableTotal 80% 0% 17% 3% 0% 0%
Page 4 of 7

HMDA 2006: Loan Actions by Largest Originators
Loan Actions by Race
Am South Bank (AL)1 2 3 4 5 7
Originated
Approved Not
Accepted Denied Withdrawn Incomplete Pre Denied
American Indian 3 1 3
Asian 41 7 47 13
African American 86 15 65 1 16
Pacific Islander 3 4 1
White 1375 153 331 5 267
Not Provided 43 7 23 6
Not Applicable 12 8 9
Total 1563 191 482 6 303 0
Originated
Approved Not
Accepted Denied Withdrawn Incomplete Pre Denied
American Indian 43% 14% 43% 0% 0% 0%
Asian 38% 6% 44% 0% 12% 0%
African American 47% 8% 36% 1% 9% 0%
Pacific Islander 38% 0% 50% 0% 13% 0%
White 65% 7% 16% 0% 13% 0%
Not Provided 54% 9% 29% 0% 8% 0%
Not ApplicableTotal 61% 8% 19% 0% 12% 0%
American Home Mortgage Corp (NY)1 2 3 4 5 7
Originated
Approved Not
Accepted Denied Withdrawn Incomplete Pre Denied
American Indian 7
Asian 17 5 4
African American 100 8 10 34
Pacific Islander 9 1 1
White 1145 108 38 185
Not Provided 110 23 4 17 2
Not Applicable
Total 1388 144 53 241 2 0
Originated
Approved Not
Accepted Denied Withdrawn Incomplete Pre Denied
American Indian 100% 0% 0% 0% 0% 0%
Asian 65% 19% 0% 15% 0% 0%
African American 66% 5% 7% 22% 0% 0%
Pacific Islander 82% 0% 9% 9% 0% 0%
White 78% 7% 3% 13% 0% 0%
Not Provided 71% 15% 3% 11% 1% 0%
Not ApplicableTotal 76% 8% 3% 13% 0% 0%
Page 5 of 7

HMDA 2006: Loan Actions by Largest Originators
Loan Actions by Race
Franklin American Mortgage CO LLC (TX)1 2 3 4 5 7
Originated
Approved Not
Accepted Denied Withdrawn Incomplete Pre Denied
1 American Indian 4 1
2 Asian 22 1 1
3 African American 100 2 18 8
4 Pacific Islander 0 0 0 0
5 White 1152 7 55 75 2
6 Not Provided 27 1 17 13
7 Not Applicable
Total 1305 11 91 97 2 0
Originated
Approved Not
Accepted Denied Withdrawn Incomplete Pre Denied
American Indian 80% 0% 0% 20% 0% 0%
Asian 92% 4% 4% 0% 0% 0%
African American 78% 2% 14% 6% 0% 0%
Pacific Islander
White 89% 1% 4% 6% 0% 0%
Not Provided 47% 2% 29% 22% 0% 0%
Not ApplicableTotal 87% 1% 6% 6% 0% 0%
CTX Mortgage Co, LLC (TX)1 2 3 4 5 7
Originated
Approved Not
Accepted Denied Withdrawn Incomplete Pre Denied
1 American Indian 3 1
2 Asian 22 1 1 4
3 African American 254 6 11 37 1
4 Pacific Islander 4 1 1
5 White 847 25 37 98 8
6 Not Provided 108 7 25 2
7 Not Applicable
Total 1238 32 57 166 11 0
Originated
Approved Not
Accepted Denied Withdrawn Incomplete Pre Denied
American Indian 75% 0% 0% 25% 0% 0%
Asian 79% 4% 4% 14% 0% 0%
African American 82% 2% 4% 12% 0% 0%
Pacific Islander 67% 0% 17% 17% 0% 0%
White 83% 2% 4% 10% 1% 0%
Not Provided 76% 0% 5% 18% 1% 0%
Not ApplicableTotal 82% 2% 4% 11% 1% 0%
Page 6 of 7

HMDA 2006: Loan Actions by Largest Originators
Loan Actions by Race
Wilson Bank & Trust (TN)1 2 3 4 5 7
Originated
Approved Not
Accepted Denied Withdrawn Incomplete Pre Denied
1 American Indian
2 Asian 1
3 African American 27 5 2
4 Pacific Islander
5 White 1087 17 61 54
6 Not Provided 9 5 2
7 Not Applicable 43
Total 1167 17 71 58 0 0
Originated
Approved Not
Accepted Denied Withdrawn Incomplete Pre Denied
American Indian
Asian 100% 0% 0% 0% 0% 0%
African American 79% 0% 15% 6% 0% 0%
Pacific Islander
White 89% 1% 5% 4% 0% 0%
Not Provided 56% 0% 31% 13% 0% 0%
Not Applicable 98% 0% 0% 0% 0% 0%Total 89% 1% 5% 4% 0% 0%
Page 7 of 7

Attachment 3B:
Loan Actions By Ethnicity

2006 HMDA: Loan Actions by Largest Originators by Ethnicity
Loan Actions by Ethnicity
12 Highest Volume Originators - Total
Originated
Apprvd/Not
Accptd Denied Withdrawn Incomplete Total
Hispanic 963 136 257 160 31 1547
Not Hispanic 28141 2671 4012 3395 423 38648
Not Provided 3531 490 634 639 27 5321
Not Applicable 71 12 9 1 93
Total 32706 3309 4912 4194 482 45609
Originated
Apprvd/Not
Accptd Denied Withdrawn Incomplete Total
Hispanic 62% 9% 17% 10% 2% 100%
Not Hispanic 73% 7% 10% 9% 1% 100%
Not Provided 66% 9% 12% 12% 1% 100%
Not Applicable 76% 13% 10% 0% 1% 100%
Total 72% 7% 11% 9% 1% 100%
Countrywide Home Loans (CA)
Originated
Apprvd/Not
Accptd Denied Withdrawn Incomplete Total
Hispanic 297 8 79 64 11 459
Not Hispanic 7534 242 1065 1308 78 10227
Not Provided 1232 38 198 315 8 1791
Not Applicable 11 11
Total 9074 288 1342 1687 97 12488
Originated
Apprvd/Not
Accptd Denied Withdrawn Incomplete Total
Hispanic 65% 2% 17% 14% 2% 100%
Not Hispanic 74% 2% 10% 13% 1% 100%
Not Provided 69% 2% 11% 18% 0% 100%
Not Applicable 100% 0% 0% 0% 0% 100%
Total 73% 2% 11% 14% 1% 100%
Suntrust Mortgage (VA)
Originated
Apprvd/Not
Accptd Denied Withdrawn Incomplete Total
Hispanic 96 15 14 28 153
Not Hispanic 4468 362 177 590 32 5629
Not Provided 873 64 31 130 7 1105
Not Applicable 0
Total 5437 441 222 748 39 6887
Originated
Apprvd/Not
Accptd Denied Withdrawn Incomplete Total
Hispanic 63% 10% 9% 18% 0% 100%
Not Hispanic 79% 6% 3% 10% 1% 100%
Not Provided 79% 6% 3% 12% 1% 100%
Not Applicable
Total 79% 6% 3% 11% 1% 100%
Page 1 of 5

2006 HMDA: Loan Actions by Largest Originators by Ethnicity
Loan Actions by Ethnicity
First Horizon Home Loan (TX)
Originated
Apprvd/Not
Accptd Denied Withdrawn Incomplete Total
Hispanic 79 19 5 103
Not Hispanic 2571 6 514 109 3200
Not Provided 190 3 55 4 252
Not Applicable 0
Total 2840 9 588 118 3555
Originated
Apprvd/Not
Accptd Denied Withdrawn Incomplete Total
Hispanic 77% 0% 18% 5% 0% 100%
Not Hispanic 80% 0% 16% 3% 0% 100%
Not Provided 75% 1% 22% 2% 0% 100%
Not Applicable
Total 80% 0% 17% 3% 0% 100%
Bank of America
Originated
Apprvd/Not
Accptd Denied Withdrawn Incomplete Total
Hispanic 99 36 47 182
Not Hispanic 2201 518 490 5 9 3223
Not Provided 321 85 75 1 2 484
Not Applicable 1 1
Total 2622 639 612 6 11 3890
Originated
Apprvd/Not
Accptd Denied Withdrawn Incomplete Total
Hispanic 54% 20% 26% 0% 0% 100%
Not Hispanic 68% 16% 15% 0% 0% 100%
Not Provided 66% 18% 15% 0% 0% 100%
Not Applicable 100% 0% 0% 0% 0% 100%
Total 67% 16% 16% 0% 0% 100%
Wells Fargo
Originated
Apprvd/Not
Accptd Denied Withdrawn Incomplete Total
Hispanic 62 28 24 4 118
Not Hispanic 2202 502 444 115 10 3273
Not Provided 264 73 90 30 2 459
Not Applicable 3 1 4
Total 2531 604 558 149 12 3854
Originated
Apprvd/Not
Accptd Denied Withdrawn Incomplete Total
Hispanic 53% 24% 20% 3% 0% 100%
Not Hispanic 67% 15% 14% 4% 0% 100%
Not Provided 58% 16% 20% 7% 0% 100%
Not Applicable 75% 25% 0% 0% 0% 100%
Total 66% 16% 14% 4% 0% 100%
Page 2 of 5

2006 HMDA: Loan Actions by Largest Originators by Ethnicity
Loan Actions by Ethnicity
National City Bank
Originated
Apprvd/Not
Accptd Denied Withdrawn Incomplete Total
Hispanic 78 15 15 3 111
Not Hispanic 1910 297 222 17 3 2455
Not Provided 217 136 67 2 2 424
Not Applicable 0
Total 2205 448 304 22 5 2990
Originated
Apprvd/Not
Accptd Denied Withdrawn Incomplete Total
Hispanic 70% 14% 14% 3% 0% 100%
Not Hispanic 78% 12% 9% 1% 0% 100%
Not Provided 51% 32% 16% 0% 0% 100%
Not Applicable
Total 74% 15% 10% 1% 0% 100%
Am South Bank
Originated
Apprvd/Not
Accptd Denied Withdrawn Incomplete Total
Hispanic 59 3 24 1 18 105
Not Hispanic 1450 172 429 5 279 2335
Not Provided 41 7 20 5 73
Not Applicable 13 9 9 1 32
Total 1563 191 482 6 303 2545
Originated
Apprvd/Not
Accptd Denied Withdrawn Incomplete Total
Hispanic 56% 3% 23% 1% 17% 100%
Not Hispanic 62% 7% 18% 0% 12% 100%
Not Provided 56% 10% 27% 0% 7% 100%
Not Applicable 41% 28% 28% 0% 3% 100%
Total 61% 8% 19% 0% 12% 100%
American Home Mortgage Corp (NY)
Originated
Apprvd/Not
Accptd Denied Withdrawn Incomplete Total
Hispanic 79 12 7 15 113
Not Hispanic 1204 110 41 211 1 1567
Not Provided 105 22 5 15 1 148
Not Applicable 0
Total 1388 144 53 241 2 1828
Originated
Apprvd/Not
Accptd Denied Withdrawn Incomplete Total
Hispanic 70% 11% 6% 13% 0% 100%
Not Hispanic 77% 7% 3% 13% 0% 100%
Not Provided 71% 15% 3% 10% 1% 100%
Not Applicable
Total 76% 8% 3% 13% 0% 100%
Page 3 of 5

2006 HMDA: Loan Actions by Largest Originators by Ethnicity
Loan Actions by Ethnicity
Countrywide Bank, NA (VA)
Originated
Apprvd/Not
Accptd Denied Withdrawn Incomplete Total
Hispanic 32 14 16 19 81
Not Hispanic 1123 409 443 766 2741
Not Provided 181 62 73 111 427
Not Applicable 0
Total 1336 485 532 896 3249
Originated
Apprvd/Not
Accptd Denied Withdrawn Incomplete Total
Hispanic 40% 17% 20% 23% 0% 100%
Not Hispanic 41% 15% 16% 28% 0% 100%
Not Provided 42% 15% 17% 26% 0% 100%
Not Applicable
Total 41% 15% 16% 28% 0% 100%
Franklin American Mortgage Co. (TN)
Originated
Apprvd/Not
Accptd Denied Withdrawn Incomplete Total
Hispanic 17 1 5 5 28
Not Hispanic 1250 8 73 84 2 1417
Not Provided 38 13 8 59
Not Applicable 2 2
Total 1305 11 91 97 2 1506
Originated
Apprvd/Not
Accptd Denied Withdrawn Incomplete Total
Hispanic 61% 4% 18% 18% 0% 100%
Not Hispanic 88% 1% 5% 6% 0% 100%
Not Provided 64% 0% 22% 14% 0% 100%
Not Applicable 0% 100% 0% 0% 0% 100%
Total 87% 1% 6% 6% 0% 100%
CTX Mortgage Company, LLC (TX)
Originated
Apprvd/Not
Accptd Denied Withdrawn Incomplete Total
Hispanic 58 4 7 14 2 85
Not Hispanic 1118 28 48 130 9 1333
Not Provided 62 2 22 86
Not Applicable 0
Total 1238 32 57 166 11 1504
Originated
Apprvd/Not
Accptd Denied Withdrawn Incomplete Total
Hispanic 68% 5% 8% 16% 2% 100%
Not Hispanic 84% 2% 4% 10% 1% 100%
Not Provided 72% 0% 2% 26% 0% 100%
Not Applicable
Total 82% 2% 4% 11% 1% 100%
Page 4 of 5

2006 HMDA: Loan Actions by Largest Originators by Ethnicity
Loan Actions by Ethnicity
Wilson Bank & Trust (TN)
Originated
Apprvd/Not
Accptd Denied Withdrawn Incomplete Total
Hispanic 7 2 9
Not Hispanic 1110 17 66 55 1248
Not Provided 7 5 1 13
Not Applicable 43 43
Total 1167 17 71 58 1313
Originated
Apprvd/Not
Accptd Denied Withdrawn Incomplete Total
Hispanic 78% 0% 0% 22% 0% 100%
Not Hispanic 89% 1% 5% 4% 0% 100%
Not Provided 54% 0% 38% 8% 0% 100%
Not Applicable 100% 0% 0% 0% 0% 100%
Total 89% 1% 5% 4% 0% 100%
Page 5 of 5

Attachment 3C:
Loan Actions By Quartile

2006 HMDA: Loan Actions by Minority and Income Quartile
MINORITY INCOME Total
First Quartile less than 67% 220 63% 16 5% 63 18% 30 9% 19 5% 348
Less than 13.8% 67 to 91% 4,024 65% 367 6% 1,120 18% 498 8% 199 3% 6,208
91 to 108% 7,696 68% 780 7% 1,692 15% 855 8% 327 3% 11,350
more than 108% 17,401 72% 1,739 7% 2,460 10% 2,121 9% 501 2% 24,222
Total 29,341 70% 2,902 7% 5,335 13% 3,504 8% 1,046 2% 42,128
Second Quartile less than 67% 191 57% 23 7% 81 24% 26 8% 14 4% 335
13.8 to 27.5% 67 to 91% 1,341 65% 147 7% 335 16% 164 8% 69 3% 2,056
91 to 108% 4,708 67% 471 7% 1,066 15% 554 8% 181 3% 6,980
more than 108% 2,883 72% 291 7% 408 10% 337 8% 97 2% 4,016
Total 9,123 68% 932 7% 1,890 14% 1,081 8% 361 3% 13,387
Third Quartile less than 67% 283 62% 18 4% 86 19% 51 11% 16 4% 454
27.5 to 52% 67 to 91% 2,667 64% 313 8% 701 17% 361 9% 111 3% 4,153
91 to 108% 2,047 64% 239 8% 557 18% 241 8% 92 3% 3,176
more than 108% 681 59% 90 8% 239 21% 103 9% 38 3% 1,151
Total 5,678 64% 660 7% 1,583 18% 756 8% 257 3% 8,934
Fourth Quartile less than 67% 2,199 57% 310 8% 890 23% 324 8% 140 4% 3,863
More than 52% 67 to 91% 766 54% 122 9% 337 24% 130 9% 56 4% 1,411
91 to 108% 80 72% 6 5% 19 17% 4 4% 2 2% 111
more than 108% 0% 0% 0% 0% 0%
Total 3,045 57% 438 8% 1,246 23% 458 9% 198 4% 5,385
Grand Total 47,188 68% 4,932 7% 10,055 14% 5,799 8% 1,862 3% 69,836
IncompleteOrigination Approved, Not Accepted Denied Withdrawn
Page 1 of 1

Attachment 3D:
High Interest Loan by Race

2006 HMDA
Lenders with more than 100 High Interest Loans by Race
Lender Name
Loans with
Spreads Avg Spread Am Ind Asian Black Pac Is White NonWhite
Higher
Than
Average
Minority
Higher
Than
Average
Spread
Fremont Investment & Loan (CA) 225 6.78 0.0% 2.2% 41.8% 0.0% 47.6% 52.4% y y
The CIT Group/Conumer Finance (NJ) 112 6.36 0.0% 2.7% 36.6% 0.0% 60.7% 39.3% y y
Novastar Mortgage, Inc (MO) 124 6.19 0.8% 0.0% 33.9% 0.0% 55.6% 44.4% y y
WMC Mortgage Co (CA) 198 6.26 1.5% 2.5% 32.8% 0.5% 45.5% 54.5% y y
New Century Mortgage Corporation (CA) 387 5.96 0.3% 0.8% 30.5% 0.8% 65.9% 34.1% y y
Accredited Home Lenders, Inc (CA) 135 5.77 0.0% 0.7% 28.9% 0.0% 60.0% 40.0% y y
Southstar Funding LLC (GA) 228 5.79 0.0% 0.4% 28.5% 0.9% 54.4% 45.6% y y
Long Beach Mortgage Company (NY) 127 5.76 1.6% 0.0% 22.0% 0.0% 72.4% 27.6% y
First Magnus Financial Corporation (AZ) 134 5.25 0.0% 0.7% 21.6% 0.0% 70.1% 29.9%
FMF Capital LLC (MI) 240 5.82 0.4% 2.1% 21.3% 0.4% 53.8% 46.3% y y
Decision One Mortgage (IL) 185 6.56 0.0% 1.6% 21.1% 0.5% 68.1% 31.9% y
Suntrust Mortgage, Inc (VA) 471 6.87 0.2% 3.6% 20.6% 0.8% 65.8% 34.2% y y
Chase Manhattan Bank USA, NA (DE) 139 5.59 0.0% 5.0% 19.4% 0.0% 67.6% 32.4%
CTX Mortgage Co, LLC (TX) 140 5.75 0.0% 1.4% 18.6% 0.7% 71.4% 28.6% y
Realty Mortgage (MS) 138 5.13 3.6% 0.7% 18.1% 0.0% 72.5% 27.5%
National City Bank (OH) 796 5.34 0.4% 2.6% 17.5% 0.0% 71.4% 28.6%
Countrywide Home Loans (CA) 783 6.07 0.0% 2.6% 16.9% 0.1% 66.9% 33.1% y y
Market Street Mortgage Corporation (FL) 109 5.98 0.0% 2.8% 16.5% 0.0% 78.9% 21.1% y
First Horizon Home Loan Corp (TX) 255 5.85 0.0% 1.6% 16.1% 0.4% 75.3% 24.7% y
Equifirst Corporation (NC) 148 5.65 0.7% 0.0% 15.5% 0.0% 74.3% 25.7%
Wells Fargo 161 4.94 0.6% 1.9% 15.5% 0.0% 65.2% 34.8% y
Homecoming Financial Network (MN) 269 5.30 0.4% 1.1% 15.2% 0.4% 65.1% 34.9% y
Option One Mortgage Corporation (CA) 156 6.18 0.0% 0.0% 12.8% 1.3% 78.2% 21.8% y
American Home Mortgage Corp (NY) 226 4.83 2.2% 1.8% 6.6% 1.8% 76.5% 23.5%
Cumberland Bank (TN) 135 4.77 0.7% 0.0% 5.2% 0.0% 63.0% 37.0% y
Wilson Bank and Trust (TN) 100 3.90 0.0% 0.0% 0.0% 0.0% 98.0% 2.0%
Page 1 of 1

MDHA Analysis of Impediments to Fair Housing
Page 57
Endnotes
1 Abravanel, Martin D. and Cunningham, Mary K. How Much Do We Know. US. Department of Housing and Urban Development. April, 2002.
2 Rodriguez, Clara. Changing Race: Latinos, the Census, and the History of Ethnicity in the United States. New York University Press. 2000.
3 Turner, Margery Austin et al. All Other Things Being Equal: A Paired Testing Study of Mortgage Lending Institutions. The Urban Institute. April 2002.
4 Income is No Shield Against Racial Differences in Lending: A Comparison of High-Cost Lending in America’s Metropolitan Areas. National Community Reinvestment Coalition. July, 2007.
5 Fix, Michael E., and Turner, Margery Austin. A National Report Card on Discrimination in America: The Role of Testing. Urban Institute. March 01, 1998.
6 Berry, Deborah Barfield and Benincasa, Robert. Aggressive outreach, disability cases help explain high complaint rates. Gannett News Service. September 27, 2007.
7 Sherrie L.W. Rhine and Maude Toussaint-Comeau. The Homeownership And Financing Experience In Two Chicago Minority Neighborhoods. Chicago Federal Reserve. October 2000.
8 Study on Barriers to Homeownership and Perceptions of Discrimination in Mortgage Lending. Mortgage Bankers of America. March 22, 1994.
9 Abravanel, Martin D. and Cunningham, Mary K. How Much Do We Know. US. Department of Housing and Urban Development. April, 2002.