analysis of income inequalities among dalit woman …
TRANSCRIPT

Indian Journal of Applied Business and Economic ResearchVol. 1, No. 1, 2020 : 27-48© ARF India. All Right ReservedURL : www.arfjournals.com
ARF INDIAAcademic Open Access Publishingwww. arfjournals. com
To cite this article:
Dharampal, Gian Singh, Veerpal Kaur, Jyoti and Gurinder Kaur. Analysis of IncomeInequalities among Dalit Woman Labour Households in Rural Punjab. Indian Journal ofApplied Business and Economic Research, Vol. 1, No. 1, 2020, pp. 27-48.
ANALYSIS OF INCOME INEQUALITIES AMONG DALIT WOMANLABOUR HOUSEHOLDS IN RURAL PUNJAB
Dharampal1, Gian Singh2, Veerpal Kaur3, Jyoti1 and Gurinder Kaur4
1Assistant Professor, Department of Economics, GGDSD College, KheriGurna (Banur)E-mail: [email protected] Professor, Department of Economics, Punjabi University, Patiala, E-mail: [email protected] Professor, Department of Economics, University College, Ghudda (Bathinda)E-mail: [email protected], Department of Geography, Punjabi University, Patiala, E-mail: [email protected]
Received : 6 July 2020; Revised : 14 July 2020; Accepted : 13 Aug. 2020; Published : 14 Sept. 2020
Abstract: The present study reveals that the Dalit woman labour households, onan average, earn Rs. 75682.14 annually in the rural areas of Punjab. This income isfound to be the highest, i.e., Rs. 80113.53 in Doaba; and the lowest, i.e., Rs. 72919.62in Majha. It is Rs. 75116.21 in Malwa. The annual per capita income of thesehouseholds comes to Rs. 16445.70 in Punjab. It is Rs. 17843.81, 16543.45, and15315.56 in Doaba, Malwa, and Majha respectively. However, when we work outper capita, per day income it comes to be Rs. 48.49, 45.32, and 41.96 in these regionsrespectively. It is too low to meet their basic needs. There are more disparities inthe distribution of per capita income in comparison to that of household incomeamong these Dalit woman labourers in all the three regions of Punjab.
Keywords: Dalit, woman labourers, rural Punjab, MGNREGA, informal sector,Lorenz curves.
The most important task of planned development in India is to raise theliving standard of people through increased employment and income (Kaurand Singh, 2013). Even our national leaders and the successive governmentshave brought about a number of reforms with the specific objective ofalleviating poverty among the downtrodden masses especially in thebackward communities. Despite all these efforts, even now they continueto remain marginalized from enjoying the fruits of development (Mathew,2003). Due tothe ignorance, illiteracy, poverty, and official apathy theseadvantages are not fully made use of by Dalitsespecially theDalitwomen.The lives of Dalit women are largely circumscribed by their poverty and

28 Dharampal, Gian Singh, Veerpal Kaur, Jyoti and Gurinder Kaur
lack of access to productive resources like land, financial resources, oreducational qualifications. As a result of this, in all the states, anoverwhelming majority oftheDalit women work outside their homes, mostoften as agricultural labourers (Rao, 2011). Even in a state like Punjab whichhas a unique development experience with social indicators like literacy,birth rate, death rate, and health status, theDalit woman labour class,especially those living in the rural areas is still experiencing levels of livingmuch below that of the general population. The rural labour householdsare characterized by a declinein their earning, low income, low consumption,and high debt (Mahapatra, 2007).
During the last three decades, especially since the early 1990s as a partof the neo-liberal wave of globalization, there has been a general increasingtendency in the numberof labour households. This has resulted because ofthe stagnation or slow growth and continuously increased use of machineryor herbicides in the agricultural sector and jobless growth in the non-agricultural sector. The income level of the labour class continues to berelatively low because of casual nature of employment. Income of the Dalitmale labourers is not enough to meet the basic needs of their families. As aresult, the Dalit woman labourers have to supplement the income of theirhusbands. A general pattern is that work participation rate has a decliningtrend with rising economic status of rural women, clearly reflecting theeconomic distress that compels poor women to work (Srivastava andSrivastava, 2010;Kelkar, 2011).
A number of studies (Jain, 2016; Dar, 2014; Kavita and Kumar, 2013;GoI,2008; Rajasekhar et al., 2007; Balakrishnan, 2005; Sandhu, 2002; Tuteja, 2000;Padma, 1999; Rani et al., 1990) indicate that almost all the woman labourersare Dalit, illiterate, unskilled, and economically weak. Because of theeconomic compulsion, the Dalit women are employed in the unorganizedsector, where they work as labourers in agriculture, construction work,factory work, and other household and marginal works as daily wageworkers (Jain et al., 1997). Women from poor families accept any economicwork to assist their family even under very inferior working conditions.They are mainly supplementary earners, and their stay in labour force is oftemporary nature which declines with the improvement in the economicconditions of the family (Goswami, 2013). They have a few opportunitiesto seek employment in the non-agricultural sector. They can findemployment only in occupations which need skill of very low level. Someof them are exploited economically as well as physically.
Being an agrarian state, agriculture has played a pivotal role in theeconomic development of the state of Punjab. Through the Green Revolution

Analysis of Income Inequalities among Dalit Woman Labour Households in Rural Punjab 29
since the mid-sixties, the state has achieved a top most place for its highereconomic growth. But this success could not achieve sustainable economicgrowth as the state has lagged much behind since 1991-92 on various fronts.No doubt, the mechanisation, modernisation and technological changeshave boosted employment,but these havealso created huge unemploymentamong the labourers, especially woman workers (Kaur and Kaur,2017).Employment in agriculture is casual and uncertain. Because of this,the Dalit woman labourers have to remain under low levels of living.
OBJECTIVES
In the present study, an endeavourhas been made to analyse the inequalitiesin the levels, patterns and distribution of income among the Dalit womanlabour households in the rural areas of Punjab. More specifically, theaimsare:
1) to estimate per household and per capita income of the Dalit womanlabourers;
2) to analyse the patterns of income earned from various sourcesbythe Dalit woman labour households; and
3) to examine the inequalities in the distribution of household andper capita incomeprevailing among the Dalit woman labourhouseholds.
DATA AND METHODOLOGY
The present study based on multi-stage systematic random samplingtechnique is related to the year 2016-17. For the purpose of present study,four districts have been selected from the three geographical regions ofPunjab, viz. Majha, Doaba and Malwa. Majha and Doaba comprise fourdistricts each whereas Malwa forms a major part of the Punjab state andconsists fourteen districts. Amritsar district has been selected from the Majharegion; Jalandhar district from the Doaba region; whereas two districts,viz. Mansa and Fatehgarh Sahib, have been selected from the Malwa region.The map of the study area is depicted in Figure 1.
At the next stage, one village from each development block of theselected districts has been chosen on the basis of random samplingtechnique. From these villages, 927Dalit woman labour households havebeen randomly selected and investigated by taking 20 per cent householdsfrom the total number of Dalit woman labour households. Out of these 927respondent households, 340 households belong to Malwa region, 243 toDoaba region and 314 to Majha region. The required primary data havebeen collected from the sampled households through the well prepared

30 Dharampal, Gian Singh, Veerpal Kaur, Jyoti and Gurinder Kaur
questionnaire. Since the majority of the Dalit woman labourers wereilliterate, it was decided to fill questionnaires-cum-schedules through theinterview method. The results have been analysed by using the mean valuesand percentages. Gini coefficients and Lorenz curves have also been usedto support the findings of the study.
RESULTS AND DISCUSSION
Levels of Household Income
The economic status of the labour families is mainly ascertained from theirvarious sources of income, such as income from hiring out labour inagriculture and other sources of income including hiring out labour inconstruction work, brick-kiln work, domestic work, dairying, piggery andpoultry, livestock and so on. Majority of the rural population, especiallythe labour class people do not have handsome sources of income whichcompel them to lead a miserable life (Singh et al., 2019a).
The mean values of income earned from various sources by the Dalitwoman labour households are given in Table 1. The table reveals that anaverage Dalit woman labour household earns Rs. 75682.14 annually in rural
Figure 1: Map of the Study Area

Analysis of Income Inequalities among Dalit Woman Labour Households in Rural Punjab 31
Punjab. The Dalitwoman labour households, on an average, earn Rs.18987.97 by hiring out labour on contractual and casual basis in agriculture.It has been observed during the field survey that not even a single Dalitwoman in the sample is employed in agriculture as a contractual labourer.This is because of the reason that women have to look after their children,and attend all their domestic choresat home also. It has also been observedthat hiring out woman labour on contractual basis is not considered goodon the ground that such workers are supposed to stay at farm even duringthe nights. Therefore, the income from hiring out contractual labour inagriculture is solely earned by the male labourers. However, the incomefrom hiring out casual labour in agriculture is earned by both male andfemale labourers.
One of the important findings of the study is that the all Dalit womanlabour households have reported that they have no ownership of land. Theyare all landless households. For these Dalit households, the main source ofearning is labour force of the earning members. For a landless worker, it issolely his/her body that earns a living (Ledesm, 1982). Their landlessnessand lack of assets add to their woes as they do not have other alternativesources of earnings except hiring out their labour (Uppal et al., 2018).
It is deplorable that income from hiring out labour on contractual andcasual basis in agriculture, i.e., Rs.18987.97 is too low to meet the basicneeds of the Dalit woman labour households. This is the reason that theearning members of these households also struggle to supplement theirincome from other sources. Income earned from other sources comes to Rs.53935.29 which is contributed by male as well as female labourers. Amongthe other sources, income from hiring out labour in construction work is asignificant source, explaining the existing level of household income of theDalit woman labourers in rural Punjab. This is followed by income fromsalaries, hiring out labour under MGNREGA, self-employment, hiring outlabour as domestic servants, white-washing work, autorickshaw/rickshawpulling, hiring out labour in brick-kiln work, working as drivers, livestock,labour in grain market, dairying, vending vegetables/fruits, and tailoring.
It is pertinent to note that the Dalit woman labour households earn Rs.5710.04 annually by hiring out labour under MGNREGA in rural Punjab.This small amount of income exposes the claim of the government that 100days of employment in a year will be provided to every household livingBelow the Poverty Line under MGNREGA (Pal and Singh, 2015). Thiscorroborates the findings of another study (Singh et al., 2019b) thatMGNREGA failed to generate employment as per its provisions. The schemecould not significantly contribute towards the income of beneficiary

32 Dharampal, Gian Singh, Veerpal Kaur, Jyoti and Gurinder Kaur
households in rural Punjab. the factors such as less awareness aboutentitlement of benefits, irregularities in the issue of job cards, lack of funds,and non-payment or irregular payment of wages have contributed to theexit of Dalit households from the MGNREGA programme (Manjula andRajasekhar, 2015).
An average Dalit woman labour household receives Rs. 2758.88 astransfer income. Transfer income includes the income from pensions,scholarships, and help from relatives/friends. Under this source, pensionsare relatively more important, and an average Dalit woman labourhousehold receives Rs. 2101.40 in the form of pensions. On the other hand,income from the help extended by relatives/friends is a paltry sum of Rs.43.32 which indirectly indicates towards the poor economic condition ofeven relatives and friends.
Table 1Levels of Income of Dalit Woman Labour Households
(Mean Values in Rs., Per Annum)
S. No. Source Malwa Doaba Majha Punjab
1. Income from hiring out labour in agriculture A. On contractual basis
(a) Cash 2994.59 493.83 2137.58 2048.76(b) Kind 0.00
(i) Agricultural produce 181.08 32.92 121.02 121.90(ii) Meals 208.92 24.69 152.87 141.64(iii) Tea and milk 144.86 16.46 85.99 91.26(iv) Clothes and other things 56.76 8.23 35.03 36.68
B. On casual basis (a) Cash 16902.97 15893.21 16067.36 16355.23(b) Kind 0.00
(i) Agricultural produce 140.27 115.43 66.88 108.90(ii) Meals 0.00 0.00 19.11 6.47(iii) Tea and milk 35.14 74.07 44.59 48.54(iv) Clothes and other things 29.73 16.46 36.62 28.59
Sub-total (1) 20694.32 16675.31 18767.04 18987.97
2. Income from other sources (a) Hiring out labour in construction work 13711.49 19719.34 17525.48 16578.26(b) Hiring out labour in brick-kiln work 1640.54 1391.36 2611.46 1904.10(c) Hiring out labour as domestic servants
(i) Cash 2927.03 3584.36 4110.83 3500.32(ii) Kind 1166.67 982.30 1014.33 1066.74
(d) Hiring out labour under MGNREGA 8058.68 4806.57 3641.72 5710.04
contd. table 1

Analysis of Income Inequalities among Dalit Woman Labour Households in Rural Punjab 33
(e) Self-employment 4525.68 6046.91 5073.25 5109.92(f) Dairying 1290.59 1668.72 603.82 1157.09(g) Piggery and poultry 35.46 51.85 17.20 33.57(h) Livestock 1570.27 1948.15 1821.66 1754.48(i) Salaries 7457.30 6597.12 5348.41 6517.48(j) Working as drivers 1575.68 2374.49 1896.82 1893.85(k) Vending vegetables/fruits 1362.16 1834.57 0.00 1024.60(l) White-washing work 2348.65 3960.91 1682.17 2545.52(m) Remittances 0.00 345.68 0.00 90.61(n) Mid-day meal worker/asha worker/
anganwari worker 0.00 744.03 291.72 293.85(o) Tailoring 389.19 1477.37 695.54 778.21(p) Autorickshaw/rickshaw pulling 243.45 2404.94 4335.03 2195.98(q) Labour in grain market 1359.46 1590.53 673.36 1187.63(r) Others* 1107.68 575.69 0.00 593.03Sub-total (2) 50769.97 62104.89 51342.79 53935.29
3. Transfer Income (a) Income from pensions 2589.19 1209.88 2216.56 2101.40(b) Scholarships 981.65 123.46 560.87 614.16(c) Help from relatives/friends 81.08 0.00 32.36 43.32Sub-total (3) 3651.92 1333.33 2809.79 2758.88Total (1+2+3) 75116.21 80113.53 72919.62 75682.14
Source: Field Survey, 2016-17*Others include income from tree cutting, cooking in functions,catering, ritual ceremonies, tuition work etc.
The table further depicts that average annual income of the Dalitwomanlabour households is the highest, i.e., Rs. 80113.53 in Doaba; and the lowest,i.e., Rs. 72919.62 in Majha. It is Rs. 75116.21 in Malwa. The reason for thehighest average annual household income in Doaba is that income fromthe other sources such as hiring out labour in construction work, self-employment, white-washing work, working as drivers, dairying, tailoring,mid-day meal worker/ashaworker/anganwari worker, and remittances ishigher as compared to the other two regions. The table further shows thatthe Dalitwoman labour households, on an average, earn only Rs. 20694.32in Malwa and Rs. 18767.04 in Majha from hiring out labour (both oncontractual as well as casual basis) in agriculture. However, in Doaba, theannual household income is Rs. 16675.31 from this source of income. It hasbeen observed during the field survey that in Malwa relatively more malemembers of the Dalitwoman labour households are working as contractuallabourers in the agricultural sector as compared to the other tworegions.That is the reason for the highest household income from hiring
S. No. Source Malwa Doaba Majha Punjab

34 Dharampal, Gian Singh, Veerpal Kaur, Jyoti and Gurinder Kaur
out labour (both on contractual as well as casual basis) in agriculture inMalwa as compared to the other two regions.
It has been further observed during the field survey, that the earningmembers of respondent households get only seasonal work in agriculture.Most of the time, theyhave to remain unemployed or search for other sourcesof income in all the three regions. Due to the lack of permanent sources ofincome and more dependence on casual wages, theDalit labour householdsoften face the problem of low income and high incidence of poverty (Jain,2016). Another research study (Kaur and Mavi, 2015) has also shown thesimilar phenomenon that usually the male members of the agriculturallabour households migrate to other places for better paid work, but theDalitwoman labourers are forced to accept the low-paid work in the villageitself as they cannot migrate as easily as men. The table shows that incomeearned from other sources is the highest of Rs. 62104.89 in Doaba; and thelowest, i.e., 50769.97 in Malwa. It is Rs. 51342.79 in Majha.
Among the other sources, hiring out labour in construction work is themajor source of income in all the three regions. Income from this source isthe highest, i.e., Rs. 19719.34 in Doaba; and the lowest, i.e., Rs. 13711.49 inMalwa. It is Rs. 17525.48 in Majha. The next main source of income of theDalitwoman labour households is income from salaries, followed by hiringout labour under MGNREGA, self-employment, domestic servants, white-washing work, autorickshaw/rickshaw pulling, hiring out labour in brick-kiln work, and working as drivers in all the three regions. An averageDalitwoman labour household earns a very small amount of income frompiggery and poultry, remittances, mid-day meal worker/asha worker/anganwari worker, and others in all the three regions. An averageDalitwoman labour household receives Rs. 3651.92, 2809.79, and 1333.33as transfer income in Malwa, Majha, and Doabarespectively. Under thissource, pensions are relatively more important in all the three regions ofthe state.
Patterns of Income
The relative shares of income of the Dalit woman labour households fromthe different sources are exhibited in Table2. The factors such asmechanization of agricultural operations, use of herbicides, and increasingnumber of small and marginal farm-size categories have reduced theopportunity of working for the rural labour class in the agricultural sector.The data shown in the table reveals that the Dalit woman labour householdsearn only 25.09 per cent of their total household income from hiring outlabour (contractual as well as casual) in agriculture. This supports the fact

Analysis of Income Inequalities among Dalit Woman Labour Households in Rural Punjab 35
that the stagnation of agriculture has also adversely affected the incomepattern of rural labour class. It is worth mentioning that the income fromhiring out contractual labour in agriculture consists of 3.23 per cent of thetotal household income which is solely earned by male labourers. However,the income from hiring out casual labour in agriculture (21.86 per cent) isearned by both male and female labourers. The higher proportion of casuallabour in comparison to contractual labour also reveals that seasonalemployment prevails in the agricultural sector. During the slack agriculturalseason, the Dalit woman labourers depend on rural non-farm activities asthe secondary source of income. This corroborates the Vaidyanathan’s (1986)assertion that the labour absorption capacity of the agriculture is limited,and the rural labourers are migrating from farm to non-farm activities.
Table 2Patterns of Income of Dalit Woman Labour Households (Percentage of Total Income)
S. No. Source Malwa Doaba Majha Punjab
1. Income from hiring out labour in agricultureA. On contractual basis(a) Cash 3.99 0.62 2.93 2.71(b) Kind
(i) Agricultural produce 0.24 0.04 0.17 0.16(ii) Meals 0.28 0.03 0.21 0.19(iii) Tea and milk 0.19 0.02 0.12 0.12(iv) Clothes and other things 0.08 0.01 0.05 0.05
B. On casual basis(a) Cash 22.50 19.84 22.03 21.61(b) Kind
(i) Agricultural produce 0.19 0.14 0.09 0.14(ii) Meals 0.00 0.00 0.03 0.01(iii) Tea and milk 0.05 0.09 0.06 0.06(iv) Clothes and other things 0.04 0.02 0.05 0.04
Sub-total (1) 27.55 20.81 25.74 25.092. Income from other sources
(a) Hiring out labour in construction work 18.25 24.61 24.03 21.91(b) Hiring out labour in brick-kiln work 2.18 1.74 3.58 2.52(c) Hiring out labour as domestic servants
(i) Cash 3.90 4.47 5.64 4.63(ii) Kind 1.55 1.23 1.39 1.41
(d) Hiring out labour under MGNREGA 10.73 6.00 4.99 7.54(e) Self-employment 6.02 7.55 6.96 6.75(f) Dairying 1.72 2.08 0.83 1.53(g) Piggery and poultry 0.05 0.06 0.02 0.04
contd. table 2

36 Dharampal, Gian Singh, Veerpal Kaur, Jyoti and Gurinder Kaur
(h) Livestock 2.09 2.43 2.50 2.32(i) Salaries 9.93 8.23 7.33 8.61(j) Working as drivers 2.10 2.96 2.60 2.50(k) Vending vegetables/fruits 1.81 2.29 0.00 1.35(l) White-washing work 3.13 4.94 2.31 3.36(m) Remittances 0.00 0.43 0.00 0.12(n) Mid-day meal worker/asha worker/
anganwariworker 0.00 0.93 0.40 0.39(o) Tailoring 0.52 1.84 0.95 1.03(p) Autorickshaw/rickshaw pulling 0.32 3.00 5.94 2.90(q) Labour in grain market 1.81 1.99 0.92 1.57(r) Others 1.47 0.72 0.00 0.78Sub-total (2) 67.59 77.52 70.41 71.27
3. Transfer Income(a) Income from pensions 3.45 1.51 3.04 2.78(b) Scholarships 1.31 0.16 0.77 0.80(c) Help from relatives/friends 0.10 0.00 0.04 0.06Sub-total (3) 4.86 1.67 3.85 3.64Total (1+2+3) 100.00 100.00 100.00 100.00
Source: Computed from Table 1
The Dalit woman labour households earn 71.27 per cent of the totalhousehold income from other sources in the rural areas of Punjab. Amongthe other sources, a major proportion, i.e., 21.91 per cent of the totalhousehold income is earned from hiring out labour in construction work.The next important source of income for an average Dalit woman labourhousehold is income from salaries; and its relative share is 8.61 per cent.Income from hiring out labour under MGNREGA (7.54 per cent) ranks nextin the order of importance. During the field survey, it has been observedthat the participation of female labourers is comparatively more than malelabourers in the work under MGNREGA. This is because of the fact thatwork under MGNREGA is, generally, available within the native village;and its nature suits the woman labourers. Moreover, woman labourers getequal wages to men for their work under this scheme, unlike almost allother forms of work in the rural areas (Chandrasekhar and Ghosh, 2011).
The next important source of income is self-employment; and its relativeshare is 6.75 per cent. Income from hiring out labour as domestic servants(6.04 per cent) ranks next in order for an average Dalit woman labourhousehold. But domestic woman labourers geta paltry sum for theunpleasant work they perform (Tripathy, 1996; Abhishek et al., 2014). Asthere is no minimum wage fixed for the domestic workers under the
S. No. Source Malwa Doaba Majha Punjab

Analysis of Income Inequalities among Dalit Woman Labour Households in Rural Punjab 37
Minimum Wages Act, the employers are free to pay what they want,irrespective of quantum and hours of work (Mahadevan, 1989).This isfollowed by income from white-washing work (3.36 per cent),autorickshaw/rickshaw pulling (2.90 per cent), hiring out labour in brick-kiln work (2.52 per cent), working as drivers (2.50 per cent), livestock (2.32per cent), labour in grain market (1.57 per cent), dairying (1.53 per cent),vending vegetables/fruits (1.35 per cent), and tailoring (1.03 per cent).Besides this, a very small proportion of the total household income (lessthan one per cent) is earned by the Dalitwoman labour households frompiggery and poultry, remittances, mid-day meal worker/asha worker/anganwari worker, and others.
The table further shows that the Dalitwoman labour households receive3.64 per cent of the total income as transfer income. Under this source,pensions are more important; and an average Dalit woman labourhousehold receives 2.78 per cent of the total income in the form of pensions.The next important source of income is scholarships; and its relative shareis 0.80 per cent. On the other hand, the share of income from relatives/friends in the form of help is only 0.06 per cent which is least important.Itclearly reflects the overall economic position of the relatives and friends,and also weakening of the social relations due to materialistic andindividualistic approach of the people in the present time.
The region-wise analysis shows that a major proportion of the totalincome of the Dalitwoman labour households comes from hiring out bothcontractual and casual labour in agriculture in Malwa and Majha. However,this pattern is not noticed in Doaba. In Doaba, the major part of the totalincome comes from hiring out labour in construction work. Theproportionate share of annual income from hiring out labour (bothcontractual as well as casual) in agriculture is the highest in Malwa (27.55per cent), followed by Majha (25.74 per cent) and Doaba (20.81 per cent).This is because of the fact that income from hiring out contractual labour inagriculture is comparatively more prevalent in Malwa as compared to theother two regions. This turns out to be a regular source of income for theDalit woman labour households in this region. Further, less than 30 percent of annual income from agriculture in all the three regions brings outthe fact that income from agriculture is not enough to meet the basic needsof the Dalit woman households. As a result, the earning members of Dalitwoman labour households have to search for other sources of income.
The table further shows that the Dalit woman labour households earn77.52, 70.41, and 67.59 per cent of the total household income from othersources in Doaba, Majha, and Malwa respectively. In the case of other

38 Dharampal, Gian Singh, Veerpal Kaur, Jyoti and Gurinder Kaur
sources, major proportion of the total income of the Dalit woman labourhouseholds is earned from hiring out labour in construction work. Therelative share of income from this source is the highest in Doaba (24.61 percent), followed by Majha (24.03 per cent), and Malwa (18.25 per cent). Thesecond important source of income for an average Dalit woman labourhousehold in Malwa is the income from hiring out labour underMGNREGA. The share of income from this source is 10.73 per cent in Malwa.The corresponding percentages in Doaba, and Majha are 6.00 and 4.99respectively. The next important source is the income from salaries in allthe three regions. The share of income from this source is as high as 9.93per cent in Malwa, followed by 8.23 per cent in Doaba, and 7.33 per cent inMajha. This is followed by income from self-employment, hiring out labouras domestic servants, white-washing work, autorickshaw/rickshaw pulling,hiring out labour in brick-kiln work, working as drivers, livestock,piggeryand poultry, remittances and mid-day meal worker/asha worker/anganwariworker in all the three regions. Besides this, the Dalit woman labourhouseholds, on an average, receive 4.86, 3.85 and 1.67 per cent of the totalincome as transfer income in Malwa, Majha, and Doabarespectively. Underthis source, the share of income in the form of pensions is more importantin all the three regions; and the share of income from relatives/friends as ahelp is meagre.
Per Capita Income
In the above discussion, we have analysed the levels and patterns ofhousehold income of the Dalit woman labourers in rural Punjab. Since thefamily size across the Dalit woman labour households varies, therefore, itbecomes relevant to look into the per capita income levels. The data givenin Table 3 exhibits that the average per capita income of the Dalit womanlabour households is Rs. 16445.70 per annum.The per capita income fromhiring out contractual and casual labour in agriculture accounted for Rs.530.26 and 3595.81 respectively.
Among the other sources, annual per capita income from hiring outlabour in construction work is an important source.The Dalit woman labourhouseholds earn on an average Rs. 3602.45 from this source in rural Punjab.This is followed by the per capita income from salaries, hiring out labourunder MGNREGA, self-employment, hiring out labour as domesticservants, white-washing work, autorickshaw/rickshaw pulling, hiring outlabour in brick-kiln work, working as drivers, livestock, labour in grainmarket, dairying, and vending vegetables/fruits amounting Rs. 1416.24,1240.79, 1110.38, 992.42, 553.14, 477.19, 413.76, 411.53, 381.25, 258.07, 251.43and 222.64 respectively. A very small amount of average annual per capita

Analysis of Income Inequalities among Dalit Woman Labour Households in Rural Punjab 39
income (i.e., less than Rs. 200) is earned from other sources such as incomefrom piggery and poultry, remittances, mid-day meal worker/asha worker/anganwari worker, tailoring,and others. Further, an average Dalitwomanlabour household receives Rs. 599.50 annually in the form of transfer income.Annual per capita income from pensions (Rs. 456.63) is an important sourceof the transfer income, followed by scholarships (Rs. 133.46).
Table 3Per Capita Income of Dalit Woman Labour Households (In Rs., Per Annum)
S. No. Source Malwa Doaba Majha Punjab
1. Income from hiring out labour in agricultureA. On contractual basis
(a) Cash 659.52 109.99 448.96 445.19(b) Kind 0.00 0.00 0.00 0.00
(i) Agricultural produce 39.88 7.33 25.42 26.49(ii) Meals 46.01 5.50 32.11 30.78(iii) Tea and milk 31.90 3.67 18.06 19.83(iv) Clothes and other things 12.50 1.83 7.36 7.97
B. On casual basis (a) Cash 3722.68 3539.92 3374.68 3553.98(b) Kind 0.00 0.00 0.00 0.00
(i) Agricultural produce 30.89 25.71 14.05 23.66(ii) Meals 0.00 0.00 4.01 1.41(iii) Tea and milk 7.74 16.50 9.36 10.55(iv) Clothes and other things 6.55 3.67 7.69 6.21
Sub-total (1) 4557.68 3714.12 3941.71 4126.082. Income from other sources
(a) Hiring out labour in construction work 3019.79 4392.12 3680.94 3602.45(b) Hiring out labour in brick-kiln work 361.31 309.90 548.49 413.76(c) Hiring out labour as domestic servants 0.00 0.00 0.00 0.00
(i) Cash 644.64 798.35 863.41 760.62(ii) Kind 256.94 218.79 213.04 231.80
(d) Hiring out labour under MGNREGA 1774.83 1070.57 764.88 1240.79(e) Self-employment 996.73 1346.84 1065.55 1110.38(f) Dairying 284.24 371.68 126.82 251.43(g) Piggery and poultry 7.81 11.55 3.61 7.29(h) Livestock 345.83 433.91 382.61 381.25(i) Salaries 1642.38 1469.39 1123.34 1416.24(j) Working as drivers 347.02 528.87 398.39 411.53(k) Vending vegetables/fruits 300.00 408.62 0.00 222.64(l) White-washing work 517.26 882.22 353.31 553.14(m) Remittances 0.00 76.99 0.00 19.69(n) Mid-day meal worker/asha worker/
anganwari worker 0.00 165.72 61.27 63.85
contd. table 3

40 Dharampal, Gian Singh, Veerpal Kaur, Jyoti and Gurinder Kaur
(o) Tailoring 85.71 329.06 146.09 169.10(p) Autorickshaw/rickshaw pulling 53.62 535.66 910.50 477.19(q) Labour in grain market 299.40 354.26 141.43 258.07(r) Others 243.95 128.22 0.00 128.86Sub-total (2) 11181.48 13832.71 10783.70 11720.12
3. Transfer Income (a) Income from pensions 570.24 269.48 465.55 456.63(b) Scholarships 216.20 27.50 117.80 133.46(c) Help from relatives/friends 17.86 0.00 6.80 9.41Sub-total (3) 804.29 296.98 590.15 599.50Total (1+2+3) 16543.45 17843.81 15315.56 16445.70
Source: Computed from Table 1
The average family size is the largest, i.e., 4.76 in Majha and the smallest,i.e., 4.49 in Doaba. It is 4.54 in Malwa. Since the family size varies fromregion to region, it becomes relevant to compare the per capita income levelsof the Dalit woman labour households across these regions. Table 3 displaysthat there are considerable variations in the levels of per capita incomeacross the regions. For example, the annual per capita income is the highest,i.e., Rs. 17843.81 in Doaba, and the lowest, i.e., Rs. 15315.56 in Majha. ForMalwa, it is Rs. 16543.45. This is because of the fact that the average familysize is the smallest in Doaba, and the largest in Majha. Therefore, a negativerelationship exists between per capita income and family size. Larger thefamily size, lesser would be the per capita income. The level of householdincome for an average Dalit woman labour household is also higher inDoaba, followed by Malwa, and Majha.
The table further shows that an average Dalit woman labour householdearns a major part of its annual per capita income, i.e., Rs. 4557.68 and3941.71 by hiring out labour (both contractual as well as casual) inagriculture in Malwa and Majha respectively. However, in Doaba, theannual per capita income of Rs. 3714.12 from this source appears at thesecond rank. In this region, per capita income (Rs. 4392.12) from hiring outlabour in construction work gets the first rank. In Malwa and Majha, thesecond major source of per capita income of the Dalit woman labourhouseholds is income from hiring out labour in construction workamounting to Rs. 3019.79 and 3680.94 respectively. Besides this, theremaining income ofDalit woman labour households comes from salaries,hiring out labour under MGNREGA, self-employment, hiring out labouras domestic servants, white-washing work, autorickshaw/rickshaw pulling,hiring out labour in brick-kiln work, working as drivers, vending
S. No. Source Malwa Doaba Majha Punjab

Analysis of Income Inequalities among Dalit Woman Labour Households in Rural Punjab 41
vegetables/fruits, dairying, labour in grain market, tailoring, piggery andpoultry, remittances, mid-day meal worker/asha worker/anganwari worker,and others in all the three regions.The table further shows that the Dalitwoman labour households, on an average, receive Rs. 804.29, 590.15, and296.98 as transfer income in Malwa, Majha, and Doaba respectively. Underthis source, pensions are relatively more important in all the three regionsof the state.
DISTRIBUTION OF HOUSEHOLD INCOME
The data pertaining to distribution of income among the Dalitwoman labourhouseholds is exhibited in Table 4. It is evident from the table thatinequalities exist in the distribution of household income among theDalitwoman labour households in rural Punjab. For example, the bottom10 per cent households share only 4.47 per cent, whereas the top 10 percent households share 18.69 per cent of the total income. This is more thanfour times the income of the bottom 10 per cent households. Similarly, thetop 20 per cent households claim almost the same amount of householdincome (33.82 per cent) to that of the bottom 50 per cent households (33.85per cent). The value of Gini coefficient for the Dalitwoman labourhouseholds in rural Punjab is found to be 0.2284.
Table 4Distribution of Annual Income among Dalit Woman Labour Households
Cumulative percentage Cumulative percentage of householdincomeof households
Malwa Doaba Majha Punjab
10 3.82 4.37 5.21 4.4720 8.39 9.61 10.93 9.6430 14.71 16.85 18.74 16.7840 22.77 25.31 26.97 25.0850 31.48 34.13 35.95 33.8560 41.67 44.08 46.29 44.0170 51.82 54.76 56.83 54.4780 63.48 66.27 68.79 66.1890 79.04 81.32 83.57 81.31100 100.00 100.00 100.00 100.00Gini coefficient 0.2656 0.2266 0.1934 0.2284
Source: Field Survey, 2016-17
The region-wise distribution of household income among the Dalitwoman labourers depicts that the bottom 50 per cent of the households
42 Dharampal, Gian Singh, Veerpal Kaur, Jyoti and Gurinder Kaur
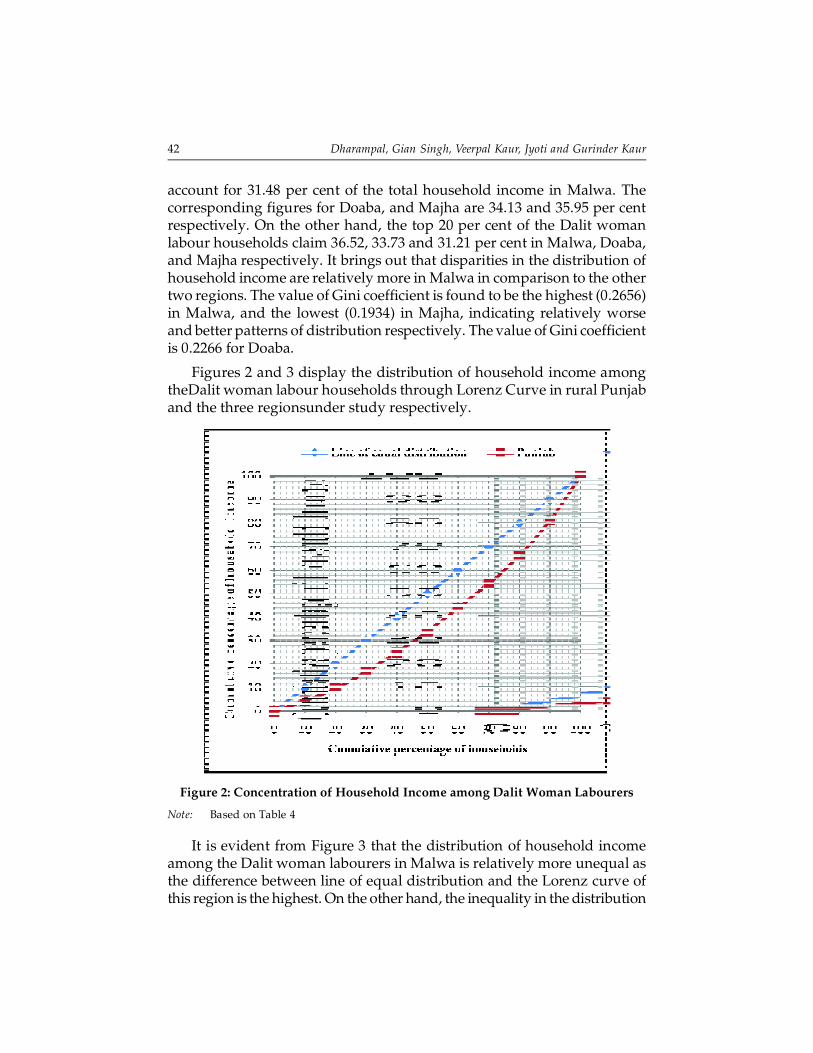
account for 31.48 per cent of the total household income in Malwa. Thecorresponding figures for Doaba, and Majha are 34.13 and 35.95 per centrespectively. On the other hand, the top 20 per cent of the Dalit womanlabour households claim 36.52, 33.73 and 31.21 per cent in Malwa, Doaba,and Majha respectively. It brings out that disparities in the distribution ofhousehold income are relatively more in Malwa in comparison to the othertwo regions. The value of Gini coefficient is found to be the highest (0.2656)in Malwa, and the lowest (0.1934) in Majha, indicating relatively worseand better patterns of distribution respectively. The value of Gini coefficientis 0.2266 for Doaba.
Figures 2 and 3 display the distribution of household income amongtheDalit woman labour households through Lorenz Curve in rural Punjaband the three regionsunder study respectively.
Figure 2: Concentration of Household Income among Dalit Woman Labourers
Note: Based on Table 4
It is evident from Figure 3 that the distribution of household incomeamong the Dalit woman labourers in Malwa is relatively more unequal asthe difference between line of equal distribution and the Lorenz curve ofthis region is the highest. On the other hand, the inequality in the distribution

Analysis of Income Inequalities among Dalit Woman Labour Households in Rural Punjab 43
of household income among the Dalit woman labourers in Majha is thelowest, having the least difference between the line of equal distributionand the Lorenz curve of this region.
DISTRIBUTION OF PER CAPITA INCOME
The distribution of per capita income among the Dalitwoman labourhouseholds is exhibited in Table 5. The table reveals that there are moredisparities in the distribution of per capita income in comparison to thehousehold income among the Dalitwoman labourers in rural Punjab.For example, the bottom 10 per cent persons account for only 3.15per cent of the total per capita income, whereas the top 10 per centpersons account for 21.24 per cent. It is more than 6 times the share ofbottom 10 per cent. This very high magnitude of inequality in thedistribution is also supported by the value of Gini coefficient that comesto 0.2723.
Figure 3: Region-wise Concentration of Household Income amongDalit Woman Labourers
Note: Based on Table 4

44 Dharampal, Gian Singh, Veerpal Kaur, Jyoti and Gurinder Kaur
Table 5Distribution of Per Capita Income among Dalit Woman Labour Households
Cumulative percentage Cumulative percentage of per capita incomeof persons
Malwa Doaba Majha Punjab
10 2.38 3.17 3.89 3.1520 6.81 8.16 9.27 8.0830 12.45 14.26 15.94 14.2240 20.42 22.66 24.53 22.5450 29.42 31.21 33.61 31.4160 39.17 40.74 42.67 40.8670 49.58 51.38 53.81 51.5980 60.86 63.07 65.77 63.2390 76.43 79.07 80.78 78.76100 100.00 100.00 100.00 100.00Gini coefficient 0.3049 0.2726 0.2395 0.2723
Source: Field Survey, 2016-17
The region-wisedistribution of per capita income among theDalitwoman labour households reveals that there are relatively moredisparities in the distribution of per capita income in comparison to thehousehold income of the Dalitwoman labourers in all the three regions ofPunjab. The table shows that the bottom 40 per cent persons claim only20.42, 22.66, and 24.53 per cent of total per capita income in Malwa, Doaba,and Majha respectively; while the top 10 per cent appropriate 23.57, 20.93,and 19.22 per cent of the total per capita income in Malwa, Doaba, andMajha respectively. The value of Gini coefficient is found to be the highest(0.3049) in Malwa, and the lowest (0.2395) in Majha revealing relativelyworse and better patterns of distribution of the per capita incomerespectively. The value of Gini coefficient is 0.2726 in Doaba.
The gaps between line of equal distribution and cumulative percentageof per capita incomeas reflected in Figures 4 and 5 clearly highlight theinequalities in the distribution of per capita income of theDalit womanlabourers in rural Punjab and among the three regions respectively.
A glance at Figure 5 provides that the distribution of per capita incomeamong the Dalit woman labour households in Malwa is relatively moreunequal, whereas it is relatively fair in Majha.
The figuresgiven above clearly reflect that there is relatively moredifference of per capita income curve from line of equal distribution thanthat of household income distribution curve. It indicates that there are moredisparities in the distribution of per capita income in comparison to that of

Analysis of Income Inequalities among Dalit Woman Labour Households in Rural Punjab 45
Figure 4: Concentration of Per Capita Income among Dalit Woman Labourers
Note: Based on Table 5
Figure 5: Region-wise Concentration of Per Capita Income amongDalit Woman Labourers
Note: Based on Table 5

46 Dharampal, Gian Singh, Veerpal Kaur, Jyoti and Gurinder Kaur
household income among the Dalit woman labourers in all the three regionsof Punjab.
CONCLUSIONS AND POLICY IMPLICATIONS
The foregoing analysis has clearly brought out that the Dalit woman labourhouseholds, on an average, earn a very meagre amount to meet their basicneeds. The per capita, per day income is found to be Rs. 48.49, 45.32, and41.96 in Doaba, Malwa, and Majha respectively. This amount is not sufficientto take even a balanced diet. Therefore, there is urgent need toeffectivelyimplement the policies for improving the economic condition of the Dalitwoman labour households in the rural areas of Punjab. For it, the agro-based small-scale industries should be established in the rural areas onpriority basis. To reduce the seasonal unemployment, the governmentshould effectively implement employment-oriented programmes, especiallyduring the off-season.There is an urgent need to create awareness amongthe Dalitwoman labourers about the various employment programmesmeant for them. The government should provide loans to the Dalitwomanlabour households at a very low rate of interest for the establishment ofvarious income generating ventures. Quality education should be providedto the children of the Dalitwoman labourers so that they may get jobs in thenon-agricultural sector also which may ultimately lead to improve theeconomic condition of their families.
The study shows that the levels of household income and per capitaincome are higher in Doaba. This is because of fact that income from the non-agricultural sector is relatively higher in Doaba as compared to the other tworegions. Therefore, the government should develop and establish such typesof activities in the other two regions also.Income from hiring out labour underMGNREGA is the highest in Malwa (Rs. 8058.68), followed by Doaba (Rs.4806.57) and Majha (Rs. 3641.72). So, there is need to implement these type ofprogrammes in the other two regions on a large scale. The properimplementation of MGNREGA would definitely improve the socio-economicconditions of the Dalit woman labour households in Punjab.
The last, but the most important implication of the present study isbased on the fact that all the Dalit woman labourers under study are landless.In the rural areas,the main production resource is land. But the Dalit womanlabour households are deprived of this productive resource. Therefore, thestudy highlights the need for land reforms in favour of the Dalits whichhave had been neglected since the ages.Land reforms in favour of the Dalitscan really change their life. The practical example can be seen in BaladKalanvillage of Sangrur district. In this village, under the aegis of

Analysis of Income Inequalities among Dalit Woman Labour Households in Rural Punjab 47
ZameenPraptiSangharshCommittee, the success of Dalit households’protestsis to take control of common land despite having many opposingforces. Because the Dalit households have succeeded in leasing in commonland, they are practicing co-operative farming and have acquired a feelingof self-respect. Now the Dalit women have not to go in the fields of largefarmers to collect the fodder for their milch animals, and vegetables andfoodgrains for self consumption. This successful struggle by the Dalithouseholds has resulted in eliminated many types of exploitation of theDalit woman labourers in rural Punjab.
References
Abhishek, Tiwari, P., and Mishra, A. (2014). A study of women labour in unorganisedsector: An Indian perspective. International Journal of Multidisciplinary Studies, 1(12), 179-186.
Balakrishnan, A. (2005). Rural Landless Women Labourers: Problems and Prospects. KalpazPublications, New Delhi.
Chandrasekhar, C.P. andGhosh, J. (2011).Public works and wages in rural India.Retrieved from http://www.macroscan.com/fet/jan11/print/prnt110111public works.htm
Dar, J.A. (2014). Socio-economic conditions of female domestic workers in Punjab: Acase study of Sangrurdistrict. Research Journal of Humanities and Social Sciences,5(1), 120-128.
Goswami, C. (2013). Female agricultural workers in Assam: A case study of Darrangdistrict. International Journal of Scientific and Research Publications, 3 (2), 1-5.
Government of India. (2008). Socio-economic Conditions of Women Workers in SelectedFood Processing Industries Including Sea Food and Marine Products.Ministry of Labour& Employment Labour Bureau, Shimla/Chandigarh.
Jain, P.C., Jain, S. and Bhatnagar, S. (1997).Scheduled Caste Women, Rawat Publication,Jaipur.
Jain, N. (2016). Levels of Living of Scheduled Caste Households in Rural Punjab, (Doctoraldissertation), Department of Economics, Punjabi University, Patiala.Punjab.
Kaur, G. and Kaur, H. (2017). Female employment in Punjab: An inter-district analysis.International Journal of Engineering Technology, Management and Applied Sciences,5(6), 412-423.
Kaur, P. and Mavi, H.K. (2015). Female agricultural labourers in rural Punjab: Presentstatus and problems. Indian Research Journal of Extension Education. 15 (4), 114-117.
Kaur, R. and Singh, G. (2013). Levels and pattern of consumption expenditure of farmersin rural Punjab: Inter-regional analysis. Asian Profile, 41(4), 385-403.
Kavita and Kumar, S. (2013). The socio-economic conditions of agricultural womenlabourers in Uttar Pradesh: A case study of Muzaffarnagar and Baghpat districts.International Journal of Social and Economic Research, 3(1), 30-48.
Kelkar, G. (2011). Gender and productive assets: Implications for women’s economicsecurity and productivity. Economic and Political Weekly, XLVI (23), 59-68.
Ledesm, A.J. (1982). Landless Workers and Rice Farmers: Peasant Subclasses under AgrarianReform in Two Philippine Villages. International Rice Research Institute.

48 Dharampal, Gian Singh, Veerpal Kaur, Jyoti and Gurinder Kaur
Mahadevan, U. (1989). Plight of women domestic workers.in R.K. Sapru (ed.),Womenand Development, Ashish Publication House, New Delhi, 127-134.
Mahapatra, S. (2007). Livelihood pattern of agricultural labour households in ruralIndia: Evidence from Orissa. South Asia Research, 27(1),79-103.
Manjula, R. and Rajasekhar, D. (2015). Participation of scheduled caste households inMGNREGS: Evidence from Karnataka, Working Paper 339, The Institute for Socialand Economic Change, Bangalore, 1-19.
Mathew, C. (2003). Consumption Expenditure Pattern of Scheduled Caste Households ofKerala: A Study of Idukki Region (Doctoral dissertation). Cochin University of Scienceand Technology, Cochin, Kerala.
Padma, K. (1999). Changing cropping pattern and employment conditions of womenworkers: A case study.The Indian Journal of Labour Economics. 42 (4), 687-698.
Pal, D. and Singh, G. (2015). Occupation structure of woman labourers in rural Punjab(India): District-wise analysis, Asia Profile, 43(6), 587-599.
Rajasekhar, D., Suchitra, J.Y. andManjula, R. (2007). Women workers in urban informalemployment: The status of agarbathi and garment workers in Karnataka. The IndianJournal of Labour Economics, 50 (4), 835-846.
Rani, P.S., Raju, V.T., Ram, P.R., and Naidu, G.M. (1990). Wage differentials and factorsgoverning employment of women in agriculture. Agriculture Situation in India.XLV (4), 240-252.
Rao, G.S.S. (2011). Status of Dalit Women in Andhra Pradesh: A Case Study in GunturDistrict. (Doctoral dissertation), Department of Sociology & Social Work,AcharyaNagarjuna University, Guntur, Andhra Pradesh.
Sandhu, P. (2002). Female labour force in Punjab: Socio-economic profile, participationrate and problems faced. The Indian Journal of Social Work. 63 (4), 552-565.
Singh, G., Pal, D., Kaur, V.,Kaur, G. and Jyoti.(2019a). Levels, pattern and distributionof income of women labour households in rural Punjab. Indian Journal of Economicsand Development. 15(1), 77-83.
Singh, G., Singh, B. and Singh, S. (2019b). Empirical analysis of implementation ofMGNREGS across different social groups in Punjab.Indian Journal of Economicsand Development. 15(2), 233-241.
Srivastava, N. and Srivastava, R. (2010). Women, work, and employment outcomes inrural India. Economic and Political Weekly, XLV (28), 49-63.
Tripathy, S. N. (1996). Unorganised Women Labour in India. Discovery Publishing House,New Delhi.
Tuteja, U. (2000). Female employment in agriculture: A district-wise analysis ofHaryana. The Indian Journal of Labour Economics. 43 (2), 339-347.
Uppal, A.; Kaur.R., and Singh, G. (2018). Globalisation and exclusion of landless rurallabour in India with special reference to Punjab.Presented at 35th IARIW GeneralConference Copenhagen, Denmark. Retrieved from http://www.iariw.org/copenhagen/uppal.pdf
Vaidyanathan, A. (1986). Labour use in rural India: A case study of spatial and temporalvariations.Economic and Political Weekly.21 (52).