analysis of individual terrestrial gamma-ray flashes with
TRANSCRIPT

HAL Id: insu-02263534https://hal-insu.archives-ouvertes.fr/insu-02263534
Submitted on 6 Sep 2019
HAL is a multi-disciplinary open accessarchive for the deposit and dissemination of sci-entific research documents, whether they are pub-lished or not. The documents may come fromteaching and research institutions in France orabroad, or from public or private research centers.
L’archive ouverte pluridisciplinaire HAL, estdestinée au dépôt et à la diffusion de documentsscientifiques de niveau recherche, publiés ou non,émanant des établissements d’enseignement et derecherche français ou étrangers, des laboratoirespublics ou privés.
Analysis of individual terrestrial gamma-ray flashes withlightning leader models and Fermi Gamma-ray Burst
Monitor dataB. G. Mailyan, Wei Xu, Sébastien Celestin, M.S. Briggs, J. R. Dwyer, E. S.
Cramer, O. J. Roberts, M. Stanbro
To cite this version:B. G. Mailyan, Wei Xu, Sébastien Celestin, M.S. Briggs, J. R. Dwyer, et al.. Analysis of individualterrestrial gamma-ray flashes with lightning leader models and Fermi Gamma-ray Burst Monitor data.Journal of Geophysical Research Space Physics, American Geophysical Union/Wiley, 2019, 124 (8),pp.7170-7183. �10.1029/2019JA026912�. �insu-02263534�

Analysis of Individual Terrestrial Gamma-Ray FlashesWith Lightning Leader Models and FermiGamma-Ray Burst Monitor Data
B. G. Mailyan1 , W. Xu2 , S. Celestin3 , M. S. Briggs1,4, J. R. Dwyer5 , E. S. Cramer1 ,O. J. Roberts6 , and M. Stanbro4
1Center for Space Plasma and Aeronomic Research, The University of Alabama in Huntsville, Huntsville, AL, USA,2Department of Aerospace Engineering Sciences, University of Colorado Boulder, Boulder, CO, USA, 3LPC2E,University of Orleans, CNRS, Orleans, France, 4Department of Space Science, The University of Alabama in Huntsville,Huntsville, AL, USA, 5Department of Physics and Space Science Center (EOS), University of New Hampshire, Durham,NH, USA, 6Science and Technology Institute, Universities Space Research Association, Huntsville, AL, USA
Abstract The Gamma-ray Burst Monitor (GBM) onboard the Fermi spacecraft has observed many tensof sufficiently bright events, which are suitable for individual analysis. In our previous study, we fitindividual, bright terrestrial gamma-ray flashes (TGFs) with Relativistic Runaway Electron Avalanche(RREA) models for the first time. For relativistic-feedback-based models, the TGF-producing electrons,which are seeded internally by a positive feedback effect, are usually accelerated in a large-scale field withfully developed RREAs. Alternatively, lightning leader models may apply to either a large-scalethunderstorm fields with fully developed RREAs or to inhomogeneous fields in front of lightning leaderswhere RREAs only develop partially. The predictions of the latter, inhomogeneous models for theTGF-beaming geometry show some differences from estimations of the relativistic feedback models inhomogeneous fields. In this work, we analyze a large sample of 66 bright Fermi GBM TGFs in theframework of lightning leader models, making comparisons with previous results from thehomogeneous-field RREA models. In most cases, the spectral analysis does not strongly favor onemechanism over the other, with 59% of the TGF events being best fit with the fully developed RREAmechanism, which corresponds to high-potential leader models. The majority of the GBM-measured TGFscan be best fit if the source altitude is below 15 km and 70% of events best fit by leader models cannot besatisfactorily modeled unless a tilted photon beam is used. For several spectrally soft TGFs, the tilted beamlow-potential leader model can best fit the data.
1. IntroductionTerrestrial gamma-ray flashes (TGFs) are submillisecond bursts of photons observed by various space mis-sions at altitudes of 500–600 km (Briggs et al., 2010; Fishman et al., 1994; Marisaldi et al., 2010; Smith et al.,2005). TGF photon energy spectra can reach tens of megaelectron volts. Despite the high rates of incidentphotons occurring over a submillisecond timescale, each individual TGF has a relatively small number ofcounts. This makes the analysis of individual TGFs challenging as typically the statistics are not good enoughto constrain the TGF production models based on individual events. That is why traditionally cumulativespectra of TGFs are studied by adding counts from different events to have sufficient data to constrain themodels (Dwyer & Smith, 2005; Tavani et al., 2011).
Extensive analysis of cumulative TGF energy spectra focused on quantifying the typical characteristics ofTGF sources (including the spectral hardness and production altitude), have been previously studied. How-ever, the variation of individual TGF events remains insufficiently investigated, which represents a majorgoal of this study. Gjesteland et al. (2015) analyzed three bright TGFs observed by the Reuven Ramaty HighEnergy Solar Spectroscopic Imager above the Mediterranean Sea region. For their brightest event, it was notpossible to get constraints on the source altitude of the TGF within 6- to 14-km region using a 𝜒2 method.More recently, Mailyan et al. (2016) have done a spectral analysis of more than 40 events observed by theGamma-ray Burst Monitor (GBM) on-board the Fermi spacecraft (Meegan et al., 2009). The likelihood anal-ysis showed that the individual spectra are diverse and that different TGF events are best fit by various
RESEARCH ARTICLE10.1029/2019JA026912
Key Points:• Fermi GBM individual TGF spectra
are analyzed using lightningleader models of various leaderpotentials, beaming tilts, andsource altitudes
• Lightning leader models withpotentials of 200 MV and tiltedbeams often best fit the data
• A few, exceptionally soft TGFs canbe well explained using 60-MVlightning leaders with tilted beams
Correspondence to:B. G. Mailyan and W. Xu,[email protected];[email protected]
Citation:Mailyan, B. G., Xu, W., Celestin, S.,Briggs, M. S., Dwyer, J. R.,Cramer, E. S., et al. (2019). Analysisof individual terrestrial gamma-rayflashes with lightning leader modelsand Fermi Gamma-ray Burst Monitordata. Journal of Geophysical Research:Space Physics, 124. https://doi.org/10.1029/2019JA026912
Received 1 MAY 2019Accepted 16 JUL 2019Accepted article online 1 AUG 2019
©2019. American Geophysical Union.All Rights Reserved.
MAILYAN ET AL. LIGTHNING MODEL GBM TGF ANALYSIS 1

Journal of Geophysical Research: Space Physics 10.1029/2019JA026912
altitude and photon beam geometry models. Analysis of cumulative TGF spectra is potentially problematic,as the cumulative spectrum will merge spectra of different shapes from TGFs with different characteristics.
Currently, two classes of models are proposed to explain the observations of TGFs. In one of the mod-els, today known as relativistic feedback model, electrons accelerate in large-scale electric fields withinthunderclouds followed by bremsstrahlung emission of photons (Dwyer, 2003). The other model consid-ers the thermal runaway electrons produced at the tips of lightning leaders and accelerated in either theleader-produced field or the large-scale thunderstorm field (Celestin & Pasko, 2011; Dwyer, 2008; Mosset al., 2006). Both models make use of relativistic runaway electron avalanches (RREAs) to involve electronmultiplication.
While analyzing the TGF data, care should be taken to account for spectral distortions caused by the pulsepileup, as those instrumental effects play an important role for TGFs with high photon rates. Not accountingfor these effects may lead to erroneous interpretation of the data (see discussion in Mailyan et al., 2016, andreferences therein).
Mailyan et al. (2016) found that several events were best fit by wide geometry beams, while some other eventswere best fit by narrow beams. The best fit with narrow beams, where wider beams are excluded, wouldseem to reject lightning leader scenario. This is because the source photon beam produced by lightning lead-ers is naturally broad (Xu et al., 2012) since the angular distribution of source photons is determined bythe configuration of electric field produced by lightning leaders in the tip region. However, lightning leadermodels were not actually used in our previous work, and that conclusion would be premature. In this workwe expand the set of models used in Mailyan et al. (2016) to also include lightning leader models in inho-mogeneous fields. Tilted beams were also included (only for the lightning leader models) as recent radiomeasurements have revealed that the beam of source bremsstrahlung photons is likely tilted (Lyu et al.,2016). There were some indications of TGF producing beams being tilted from satellite TGF measurementsas well (Fitzpatrick et al., 2014; Mailyan et al., 2016). Variable photon rates are also considered at the space-craft altitude to account for the pulse pileup effects. Primarily focusing on the lightning leader model ofthe TGF production, we study the beaming geometry issues discussed in Mailyan et al. (2016) and spectravariability effects discussed in Celestin et al. (2015) using the Fermi GBM TGF data.
2. Methodology2.1. Data SourcesThe GBM instrument is made up of 12 thallium-doped sodium iodide (NaI(Tl)) and two bismuth germanate(BGO) detectors (Meegan et al., 2009). In this paper, we analyze the TGF spectra using the data from the BGOdetectors, which have a broad spectral response (0.2–40 MeV) and large effective area (∼160 cm2; Tierneyet al., 2013). The BGOs are positioned on opposite sides of the spacecraft. The photon counts are assignedto spectral channels according to 128 pseudo-logarithmically spaced energy channels, and time-tagged withrelative timing resolution of 2 μs. The relative timing resolution of 2 μs is critical for studying submillisecondbursts like TGFs. The nominal dead time is 2.6 μs. However, if a count is registered in the overflow channel(>40 MeV for the BGO detectors), the dead time is 10.4 μs. We focus on bright TGFs which have very lowfrequency (VLF) radio associations, as described in Mailyan et al. (2016) and Roberts et al. (2018). TGFswithout a VLF association may occur anywhere within about 800 km of the subspacecraft position. For TGFswith a VLF association, the VLF geolocation provides a position accuracy of∼10 km, which makes it possibleto precisely calculate the detector response and is mandatory in interpreting the gamma-ray spectra.
The TGF detection rate significantly increased after new data collection modes and analysis methods wereintroduced in 2012. These include an updated onboard triggering algorithm and off-line search algorithmsof the high time resolution data (Briggs et al., 2013; Roberts et al., 2018). At the same time, the efficiency ofthe radio associations was significantly increased due to the upgrades of the World Wide Lightning LocationNetwork (Hutchins et al., 2012). Having these improvements, we are able to study an unprecedentedly largeset of 66 bright TGFs having more than 20 counts in either of BGO detectors. By TGF brightness, we mean thenumber of photon counts observed by the GBM and not the intrinsic brightness at the source. Also, it is worthstating that especially short-duration intrinsically bright TGFs may have a small number of observed photoncounts due to instrumental effects. For the sake of comparison, all the TGF events analyzed in Mailyan et al.(2016) have been reinvestigated in the context of the lightning leader models in the present work.
MAILYAN ET AL. LIGTHNING MODEL GBM TGF ANALYSIS 2

Journal of Geophysical Research: Space Physics 10.1029/2019JA026912
2.2. Lightning Leader ModelsIn this paper, the analysis of individual TGF events measured by Fermi GBM is primarily based on a suiteof Monte Carlo models describing the TGF production by lightning leaders, for both electrons (Celestin &Pasko, 2011) and photons (Xu et al., 2012). The modeling procedure is similar to that used in, for example,Celestin et al. (2012) and Xu et al. (2015), specifically in three steps. First, we calculate the electric field pro-duced near the tip region of the negative end of lightning leaders using the method of moments. Second,using the Monte Carlo model for electrons, we simulate the acceleration of thermal runaway electrons in thisleader field and the production of bremsstrahlung photons. We emphasize that the maximum electric fieldof 50 kV/cm (at ground level) is used in order to avoid the acceleration of runaway electrons in the extremelystrong electric field obtained by the static vacuum solution (method of moments) at locations close to theleader tip (see discussion in Celestin & Pasko, 2011; Celestin et al., 2015). This assumption underestimatesthe true potential drop (Skeltved et al., 2017). In this study, the parameter that impacts the energy of elec-trons the most is the potential drop in the leader tip region that is available for the acceleration of runawayelectrons. Mallios et al. (2013) have shown that downward positive leaders propagating before the start ofthe propagation of negative leaders in a bidirectional intracloud discharge could lead to potential drops ashigh as 300 MV. Skeltved et al. (2017; Figure 5) have also found that potential drops similar to those usedin the present study can be obtained by taking the horizontal development of positive and negative leadersinto account. Simulating the full dynamics of the electric field and potential drop in the leader steamer zonesystem during the negative corona flash would improve the description of the physical relation between theleader and the electron acceleration processes at the cost of increasing complexity. The leader potential dropsused in the present and previous studies should be seen as an underestimation of true potential drops in theconsidered leaders geometries. Finally, the energy and position of those bremsstrahlung photons obtainedin the second step are directly input into the Monte Carlo model for photons, collecting photons that escapethe Earth's atmosphere at 565 km altitude, that is, the mean altitude of Fermi's orbit. In the following, weintroduce the initial parameters and numerical models used in the present study.
The potential difference between the tip of the lightning leader and the ambient potential (named “potentialdrop” hereafter for simplicity) is a critical parameter in this work because it directly controls the avalancheprocesses of thermal runaway electrons (see discussion in Celestin et al., 2015). In this study, we mainlyfocus on lightning leaders with three potential drops: 60, 100, and 200 MV. These values are chosen becausethe bremsstrahlung gamma rays originating from these leaders have similar total energies as typical satellitemeasurements (e.g., Celestin et al., 2015; Xu et al., 2012). This range of leader-accelerated potential dropsis plausible (Mallios et al., 2013). Higher potential drops would lead to photon spectra close to the classicalRREA spectrum obtained in a homogeneous field configuration (Celestin et al., 2015), which was alreadystudied in Mailyan et al. (2016). This means that the spectral analysis solely is insufficient to distinguish theRREA mechanism from very high potential (>200 MV) lightning leader models. For each potential drop,we calculate the electric field near the leader tip region by assuming that the lightning leader is a perfectlyconducting cylinder and is aligned with the large-scale thunderstorm electric field. With this assumption,we then use the method of moments (Balanis, 1989, p. 670) to convert the electric potential integral equationinto a set of matrix equations and thereby solve the electric charge distribution induced on the lightningchannel. The electric field produced in the vicinity of lightning leader tip is further reconstructed using thecharge distribution obtained. It should be noted that the conductivity of the streamer zone is not taken intoaccount and hence the dynamics of the electric field is not modeled. For this reason, the time dynamics ofthe TGF is not obtained with this model. That is justified by the fact that negative corona flashes initiateprior to the formation of a large streamer zone.
The potential drop in the leader tip region Ul can be approximated by Ul = E0l/2 (Bazelyan & Raizer, 2000,p. 54), where E0 is the ambient large-scale thunderstorm electric field and l is the length of the unbranchedleader channel. For the three potential drops, we choose the following typical values for E0 and l: Ul = 60 MV,E0 = 2 kV/cm, l = 0.6 km; Ul = 100 MV, E0 = 0.5 kV/cm, l = 4 km; Ul = 200 MV, E0 = 1 kV/cm, l = 4 km. Inall cases, the radius of the leader channel is assumed to be 1 cm (Rakov & Uman, 2003, Section 4.4.6, p. 134).Of note, the specific choices of E0 and l are not critical as long as the resultant potential drop is the same.
We use the Monte Carlo model developed by Celestin and Pasko (2011) in order to simulate the propaga-tion and collisions of electrons in air. This model explicitly solves for the equation of electron motion inthree-dimensional (3-D) velocity space and 3-D configuration space; it is relativistic and simulates electronsin the energy regime from subelectron volt to gigaelectron volt; the ionization collision, which is of crucial
MAILYAN ET AL. LIGTHNING MODEL GBM TGF ANALYSIS 3

Journal of Geophysical Research: Space Physics 10.1029/2019JA026912
Figure 1. Illustration of the geometry used for simulating tilted beams of source bremsstrahlung photons. Tilted beamopposite to the spacecraft is illustrated. GBM = Gamma-ray Burst Monitor.
importance for modeling runaway processes, is simulated using the singly differential cross sections cal-culated via the relativistic binary-encounter-Bethe model (e.g., Celestin & Pasko, 2010). In theory, thermalrunaway electrons resulting from streamer discharges may have an energy close to ∼65 keV (Celestin &Pasko, 2011). Thus, this energy is assigned to the initial group of thermal runaway electrons used in MonteCarlo simulations. These electrons are initially placed at a location where the corresponding electric field is50 kV/cm, as reasonable for the field magnitude at the leader tip (Bazelyan & Raizer, 2000, pp. 67–68).
The Monte Carlo model employed to simulate photon transport in the Earth's atmosphere is similar to thatdescribed in Østgaard et al. (2008). This model takes into account three main collision types for photons withenergies between 10 keV and 100 MeV: photoelectric absorption, Compton scattering, and electron-positronpair production. We emphasize that this set of Monte Carlo models has been utilized to study RREA proper-ties (e.g., Celestin et al., 2012), the acceleration of electrons in inhomogeneous fields produced by lightningleaders (e.g., Celestin et al., 2012; Xu et al., 2015), and optical emissions produced by TGFs (Xu et al.,2017); modeling results show good agreements with previously published results (also, see the review anddiscussion in Dwyer et al., 2012).
Lyu et al. (2016) have recently pointed out that the majority of the initial leader steps, as well as their asso-ciated electric fields and bremsstrahlung production processes, are tilted away from the vertical directionand this tilted leader stepping could affect TGF observation from space. Motivated by this finding, in thepresent study, we simulate TGF production by both vertical and tilted lightning leaders. Because the energydistribution of thermal runaway electrons is predominantly controlled by the potential drop of lightningleaders, the simulation results of electron acceleration (the first two steps as described above) are the samein these two scenarios. As for the third step of photon simulation, to mimic the tilted leader channel, theensemble of bremsstrahlung photons obtained from electron simulations is rotated from the vertical direc-tion using two angles: 𝜃 and 𝜙, similar to those defined in the spherical coordinate system. Figure 1 showsthe geometry used in the simulation of tilted lightning leaders. xyz directions in the simulation are arbitrary.Specifically, 𝜃 is the angle between the axis of the photon beam and +z direction, and 𝜙 is the angle between+x direction and the orthogonal projection of beam axis on the xy plane. Lyu et al. (2016) have revealed thatinitial stepping leaders typically have a tilting angle between 6◦ and 38◦. The angle 𝜃 is chosen to be either
MAILYAN ET AL. LIGTHNING MODEL GBM TGF ANALYSIS 4
Journal of Geophysical Research: Space Physics 10.1029/2019JA026912
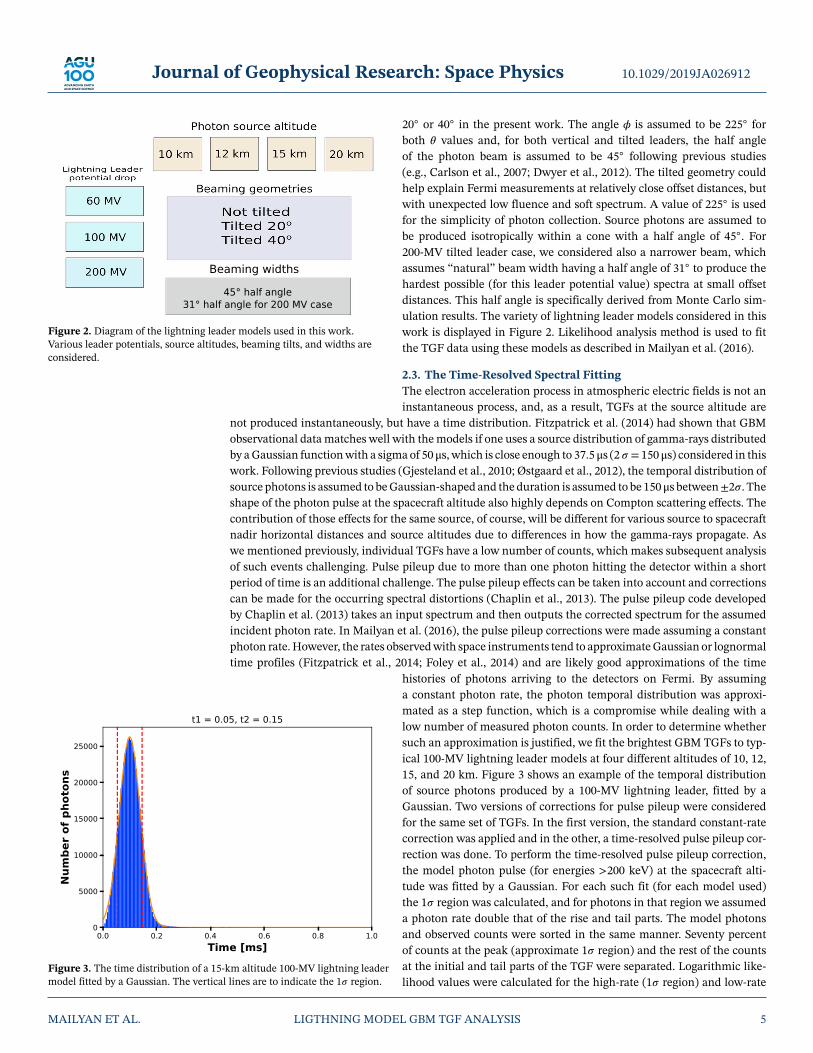
Figure 2. Diagram of the lightning leader models used in this work.Various leader potentials, source altitudes, beaming tilts, and widths areconsidered.
20◦ or 40◦ in the present work. The angle 𝜙 is assumed to be 225◦ forboth 𝜃 values and, for both vertical and tilted leaders, the half angleof the photon beam is assumed to be 45◦ following previous studies(e.g., Carlson et al., 2007; Dwyer et al., 2012). The tilted geometry couldhelp explain Fermi measurements at relatively close offset distances, butwith unexpected low fluence and soft spectrum. A value of 225◦ is usedfor the simplicity of photon collection. Source photons are assumed tobe produced isotropically within a cone with a half angle of 45◦. For200-MV tilted leader case, we considered also a narrower beam, whichassumes “natural” beam width having a half angle of 31◦ to produce thehardest possible (for this leader potential value) spectra at small offsetdistances. This half angle is specifically derived from Monte Carlo sim-ulation results. The variety of lightning leader models considered in thiswork is displayed in Figure 2. Likelihood analysis method is used to fitthe TGF data using these models as described in Mailyan et al. (2016).
2.3. The Time-Resolved Spectral FittingThe electron acceleration process in atmospheric electric fields is not aninstantaneous process, and, as a result, TGFs at the source altitude are
not produced instantaneously, but have a time distribution. Fitzpatrick et al. (2014) had shown that GBMobservational data matches well with the models if one uses a source distribution of gamma-rays distributedby a Gaussian function with a sigma of 50 μs, which is close enough to 37.5 μs (2 𝜎 = 150 μs) considered in thiswork. Following previous studies (Gjesteland et al., 2010; Østgaard et al., 2012), the temporal distribution ofsource photons is assumed to be Gaussian-shaped and the duration is assumed to be 150 μs between±2𝜎. Theshape of the photon pulse at the spacecraft altitude also highly depends on Compton scattering effects. Thecontribution of those effects for the same source, of course, will be different for various source to spacecraftnadir horizontal distances and source altitudes due to differences in how the gamma-rays propagate. Aswe mentioned previously, individual TGFs have a low number of counts, which makes subsequent analysisof such events challenging. Pulse pileup due to more than one photon hitting the detector within a shortperiod of time is an additional challenge. The pulse pileup effects can be taken into account and correctionscan be made for the occurring spectral distortions (Chaplin et al., 2013). The pulse pileup code developedby Chaplin et al. (2013) takes an input spectrum and then outputs the corrected spectrum for the assumedincident photon rate. In Mailyan et al. (2016), the pulse pileup corrections were made assuming a constantphoton rate. However, the rates observed with space instruments tend to approximate Gaussian or lognormaltime profiles (Fitzpatrick et al., 2014; Foley et al., 2014) and are likely good approximations of the time
Figure 3. The time distribution of a 15-km altitude 100-MV lightning leadermodel fitted by a Gaussian. The vertical lines are to indicate the 1𝜎 region.
histories of photons arriving to the detectors on Fermi. By assuminga constant photon rate, the photon temporal distribution was approxi-mated as a step function, which is a compromise while dealing with alow number of measured photon counts. In order to determine whethersuch an approximation is justified, we fit the brightest GBM TGFs to typ-ical 100-MV lightning leader models at four different altitudes of 10, 12,15, and 20 km. Figure 3 shows an example of the temporal distributionof source photons produced by a 100-MV lightning leader, fitted by aGaussian. Two versions of corrections for pulse pileup were consideredfor the same set of TGFs. In the first version, the standard constant-ratecorrection was applied and in the other, a time-resolved pulse pileup cor-rection was done. To perform the time-resolved pulse pileup correction,the model photon pulse (for energies >200 keV) at the spacecraft alti-tude was fitted by a Gaussian. For each such fit (for each model used)the 1𝜎 region was calculated, and for photons in that region we assumeda photon rate double that of the rise and tail parts. The model photonsand observed counts were sorted in the same manner. Seventy percentof counts at the peak (approximate 1𝜎 region) and the rest of the countsat the initial and tail parts of the TGF were separated. Logarithmic like-lihood values were calculated for the high-rate (1𝜎 region) and low-rate
MAILYAN ET AL. LIGTHNING MODEL GBM TGF ANALYSIS 5
Journal of Geophysical Research: Space Physics 10.1029/2019JA026912
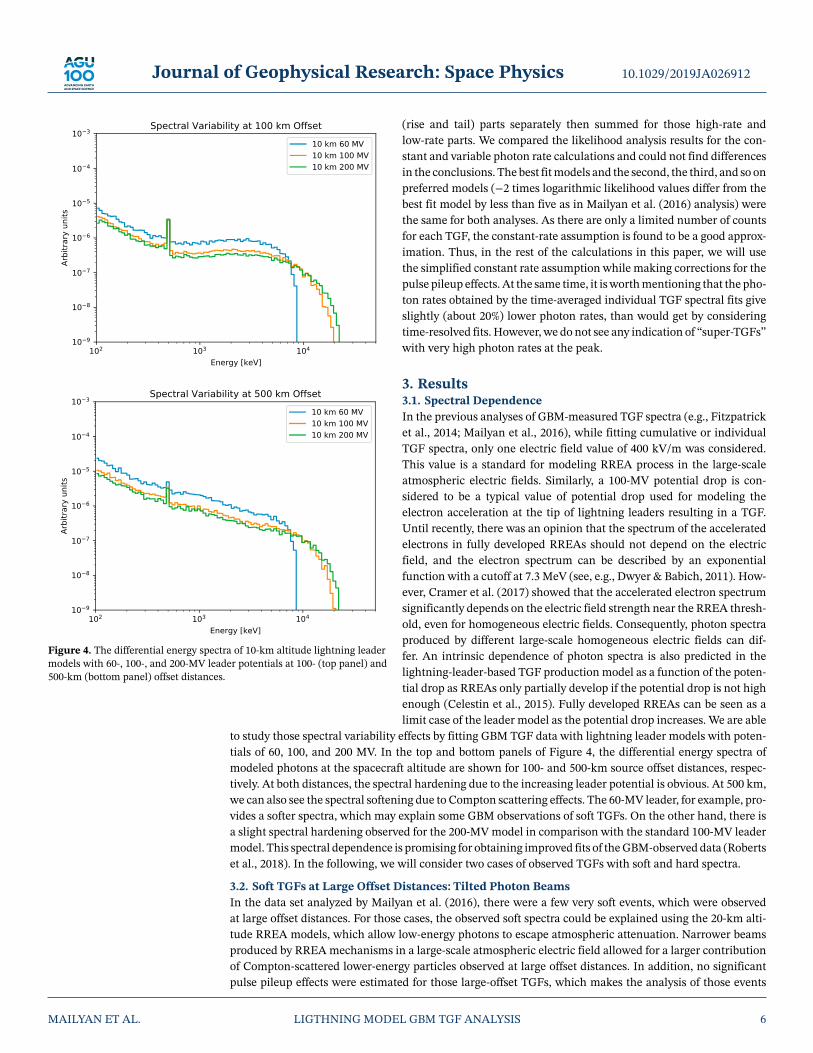
Figure 4. The differential energy spectra of 10-km altitude lightning leadermodels with 60-, 100-, and 200-MV leader potentials at 100- (top panel) and500-km (bottom panel) offset distances.
(rise and tail) parts separately then summed for those high-rate andlow-rate parts. We compared the likelihood analysis results for the con-stant and variable photon rate calculations and could not find differencesin the conclusions. The best fit models and the second, the third, and so onpreferred models (−2 times logarithmic likelihood values differ from thebest fit model by less than five as in Mailyan et al. (2016) analysis) werethe same for both analyses. As there are only a limited number of countsfor each TGF, the constant-rate assumption is found to be a good approx-imation. Thus, in the rest of the calculations in this paper, we will usethe simplified constant rate assumption while making corrections for thepulse pileup effects. At the same time, it is worth mentioning that the pho-ton rates obtained by the time-averaged individual TGF spectral fits giveslightly (about 20%) lower photon rates, than would get by consideringtime-resolved fits. However, we do not see any indication of “super-TGFs”with very high photon rates at the peak.
3. Results3.1. Spectral DependenceIn the previous analyses of GBM-measured TGF spectra (e.g., Fitzpatricket al., 2014; Mailyan et al., 2016), while fitting cumulative or individualTGF spectra, only one electric field value of 400 kV/m was considered.This value is a standard for modeling RREA process in the large-scaleatmospheric electric fields. Similarly, a 100-MV potential drop is con-sidered to be a typical value of potential drop used for modeling theelectron acceleration at the tip of lightning leaders resulting in a TGF.Until recently, there was an opinion that the spectrum of the acceleratedelectrons in fully developed RREAs should not depend on the electricfield, and the electron spectrum can be described by an exponentialfunction with a cutoff at 7.3 MeV (see, e.g., Dwyer & Babich, 2011). How-ever, Cramer et al. (2017) showed that the accelerated electron spectrumsignificantly depends on the electric field strength near the RREA thresh-old, even for homogeneous electric fields. Consequently, photon spectraproduced by different large-scale homogeneous electric fields can dif-fer. An intrinsic dependence of photon spectra is also predicted in thelightning-leader-based TGF production model as a function of the poten-tial drop as RREAs only partially develop if the potential drop is not highenough (Celestin et al., 2015). Fully developed RREAs can be seen as alimit case of the leader model as the potential drop increases. We are able
to study those spectral variability effects by fitting GBM TGF data with lightning leader models with poten-tials of 60, 100, and 200 MV. In the top and bottom panels of Figure 4, the differential energy spectra ofmodeled photons at the spacecraft altitude are shown for 100- and 500-km source offset distances, respec-tively. At both distances, the spectral hardening due to the increasing leader potential is obvious. At 500 km,we can also see the spectral softening due to Compton scattering effects. The 60-MV leader, for example, pro-vides a softer spectra, which may explain some GBM observations of soft TGFs. On the other hand, there isa slight spectral hardening observed for the 200-MV model in comparison with the standard 100-MV leadermodel. This spectral dependence is promising for obtaining improved fits of the GBM-observed data (Robertset al., 2018). In the following, we will consider two cases of observed TGFs with soft and hard spectra.
3.2. Soft TGFs at Large Offset Distances: Tilted Photon BeamsIn the data set analyzed by Mailyan et al. (2016), there were a few very soft events, which were observedat large offset distances. For those cases, the observed soft spectra could be explained using the 20-km alti-tude RREA models, which allow low-energy photons to escape atmospheric attenuation. Narrower beamsproduced by RREA mechanisms in a large-scale atmospheric electric field allowed for a larger contributionof Compton-scattered lower-energy particles observed at large offset distances. In addition, no significantpulse pileup effects were estimated for those large-offset TGFs, which makes the analysis of those events
MAILYAN ET AL. LIGTHNING MODEL GBM TGF ANALYSIS 6

Journal of Geophysical Research: Space Physics 10.1029/2019JA026912
Figure 5. The modeled energy spectra of TGF120120412 at 475-km offsetdistance. RREA narrow 20-km model along with 20-km 60-MV lightningleader and 15-km 60-MV models with 20◦ tilt. TGF = terrestrial gamma-rayflash; RREA = Relativistic Runaway Electron Avalanche.
simpler as we do not have to apply the pulse pilup corrections. Based onthese few events, which were best fit by narrow beam models, Mailyanet al. (2016) concluded that for those cases, large-scale RREA modelworks better since wider beams (supposedly produced by lightning leadermodel) could be rejected with a high level of confidence. At the same time,it was mentioned that a wider beam tilted opposite to the spacecraft direc-tion would provide more Compton scattered photons and consequentlysofter spectra at larger offset distances from the source.
In Figure 5, the differential energy spectra of the photons at 475-km offsetdistance corresponding to the soft event TGF120120412 are shown. Aswe can see, the tilted beam of 20◦ from a 60-MV leader already is softerthan the large-scale RREA spectrum. The 60-MV model with a 40◦ tilt canmake even softer spectra, which is too soft to match the data. As a result,lower-altitude tilted beam models can provide better fits to the data, bymaking the spectra a bit harder due to the atmospheric attenuation of thelow-energy gamma rays. For this particular TGF, 15-km 60-MV modelwith a tilt of 20◦ appears to be the best fit. Figure 5 presents the 20-kmaltitude with 20◦ tilt 60-MV leader model (which was too soft to fit) andthe best fit 15-km altitude 60-MV leader 20◦ tilted beam model.
Figure 6 shows the energy spectra of the TGF120120412 along with the best fit lightning leader model (top)and the best fit RREA model (bottom). Upper limits corresponding to 2𝜎 are calculated from the model andindicated by arrows, when no photon counts were observed in a particular histogram bin. As we can see, theenergy spectrum of TGF120120412 can be perfectly fitted using the lightning leader model with a tilt angleof 20◦, a leader potential of 60 MV, and a source altitude of 15 km. It is worth mentioning that the best fitRREA model is not tilted and electric field variability of the RREA spectrum is not considered in this work,nor in Mailyan et al. (2016).
Figure 6. The modeled and measured energy spectra of TGF120120412 at 475-km offset distance. RREA narrow 20-kmmodel (bottom plot) and 15-km 60-MV lightning leader models with a 20◦ tilt opposite to the spacecraft (top plot).TGF = terrestrial gamma-ray flash; RREA = Relativistic Runaway Electron Avalanche.
MAILYAN ET AL. LIGTHNING MODEL GBM TGF ANALYSIS 7
Journal of Geophysical Research: Space Physics 10.1029/2019JA026912
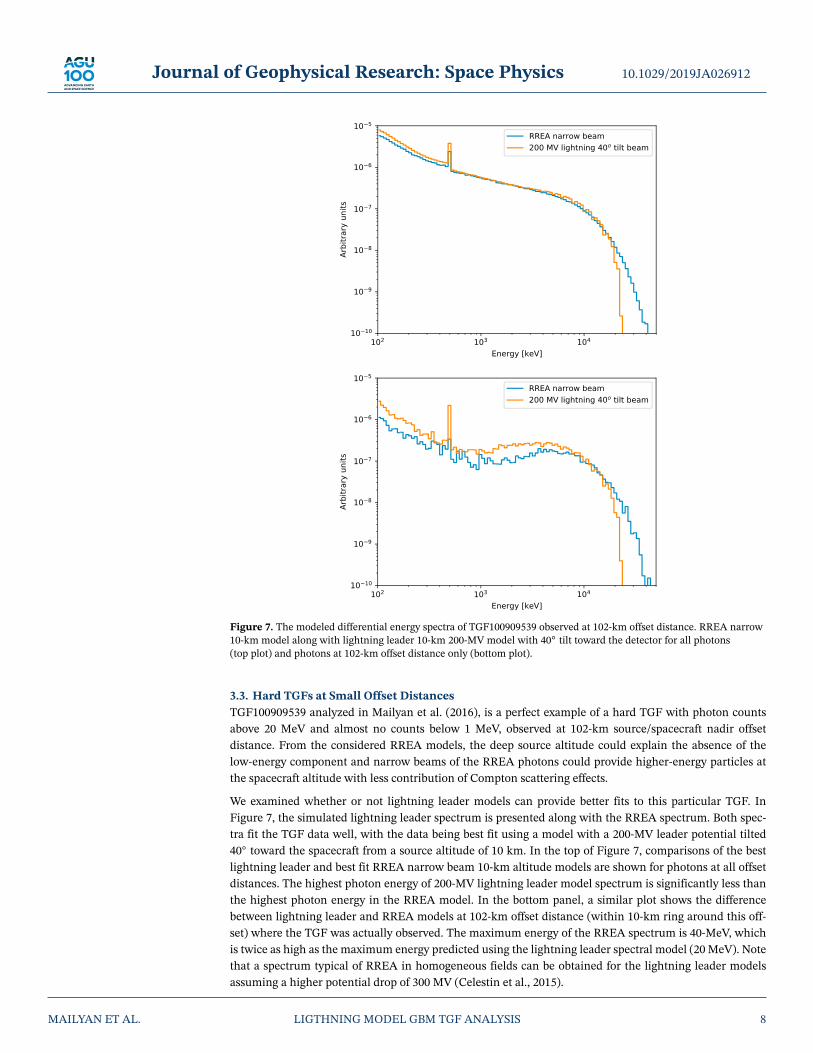
Figure 7. The modeled differential energy spectra of TGF100909539 observed at 102-km offset distance. RREA narrow10-km model along with lightning leader 10-km 200-MV model with 40◦ tilt toward the detector for all photons(top plot) and photons at 102-km offset distance only (bottom plot).
3.3. Hard TGFs at Small Offset DistancesTGF100909539 analyzed in Mailyan et al. (2016), is a perfect example of a hard TGF with photon countsabove 20 MeV and almost no counts below 1 MeV, observed at 102-km source/spacecraft nadir offsetdistance. From the considered RREA models, the deep source altitude could explain the absence of thelow-energy component and narrow beams of the RREA photons could provide higher-energy particles atthe spacecraft altitude with less contribution of Compton scattering effects.
We examined whether or not lightning leader models can provide better fits to this particular TGF. InFigure 7, the simulated lightning leader spectrum is presented along with the RREA spectrum. Both spec-tra fit the TGF data well, with the data being best fit using a model with a 200-MV leader potential tilted40◦ toward the spacecraft from a source altitude of 10 km. In the top of Figure 7, comparisons of the bestlightning leader and best fit RREA narrow beam 10-km altitude models are shown for photons at all offsetdistances. The highest photon energy of 200-MV lightning leader model spectrum is significantly less thanthe highest photon energy in the RREA model. In the bottom panel, a similar plot shows the differencebetween lightning leader and RREA models at 102-km offset distance (within 10-km ring around this off-set) where the TGF was actually observed. The maximum energy of the RREA spectrum is 40-MeV, whichis twice as high as the maximum energy predicted using the lightning leader spectral model (20 MeV). Notethat a spectrum typical of RREA in homogeneous fields can be obtained for the lightning leader modelsassuming a higher potential drop of 300 MV (Celestin et al., 2015).
MAILYAN ET AL. LIGTHNING MODEL GBM TGF ANALYSIS 8
Journal of Geophysical Research: Space Physics 10.1029/2019JA026912
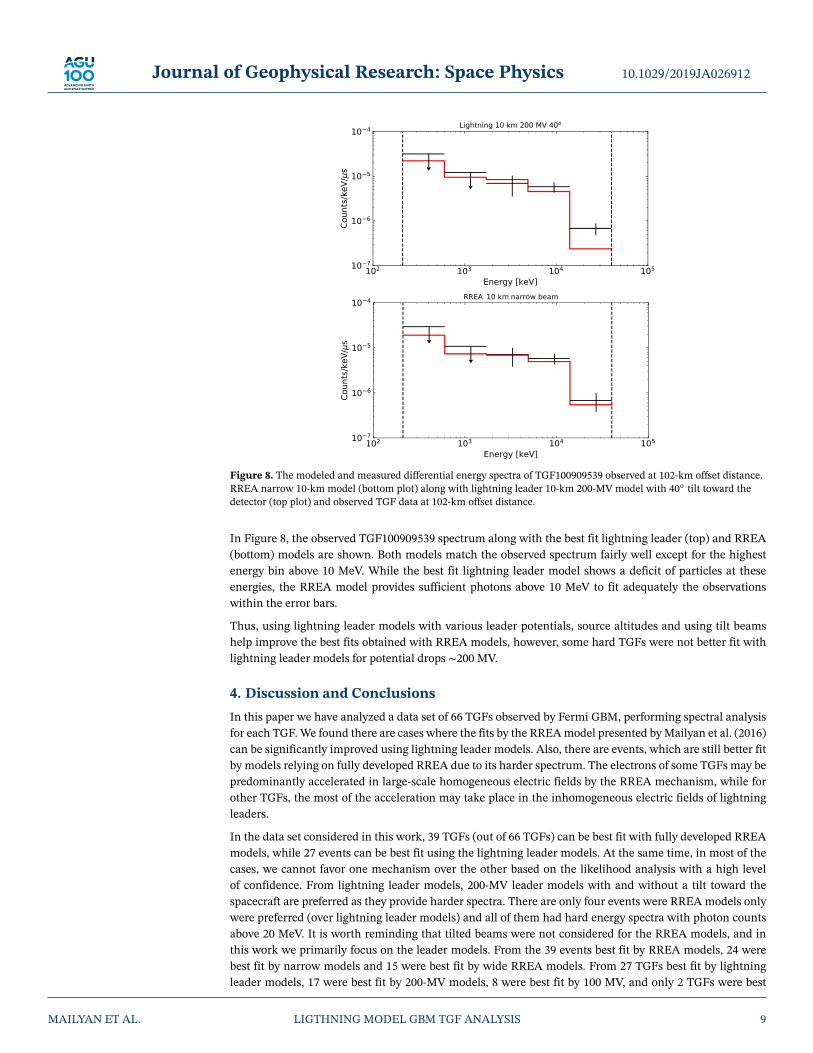
Figure 8. The modeled and measured differential energy spectra of TGF100909539 observed at 102-km offset distance.RREA narrow 10-km model (bottom plot) along with lightning leader 10-km 200-MV model with 40◦ tilt toward thedetector (top plot) and observed TGF data at 102-km offset distance.
In Figure 8, the observed TGF100909539 spectrum along with the best fit lightning leader (top) and RREA(bottom) models are shown. Both models match the observed spectrum fairly well except for the highestenergy bin above 10 MeV. While the best fit lightning leader model shows a deficit of particles at theseenergies, the RREA model provides sufficient photons above 10 MeV to fit adequately the observationswithin the error bars.
Thus, using lightning leader models with various leader potentials, source altitudes and using tilt beamshelp improve the best fits obtained with RREA models, however, some hard TGFs were not better fit withlightning leader models for potential drops ∼200 MV.
4. Discussion and ConclusionsIn this paper we have analyzed a data set of 66 TGFs observed by Fermi GBM, performing spectral analysisfor each TGF. We found there are cases where the fits by the RREA model presented by Mailyan et al. (2016)can be significantly improved using lightning leader models. Also, there are events, which are still better fitby models relying on fully developed RREA due to its harder spectrum. The electrons of some TGFs may bepredominantly accelerated in large-scale homogeneous electric fields by the RREA mechanism, while forother TGFs, the most of the acceleration may take place in the inhomogeneous electric fields of lightningleaders.
In the data set considered in this work, 39 TGFs (out of 66 TGFs) can be best fit with fully developed RREAmodels, while 27 events can be best fit using the lightning leader models. At the same time, in most of thecases, we cannot favor one mechanism over the other based on the likelihood analysis with a high levelof confidence. From lightning leader models, 200-MV leader models with and without a tilt toward thespacecraft are preferred as they provide harder spectra. There are only four events were RREA models onlywere preferred (over lightning leader models) and all of them had hard energy spectra with photon countsabove 20 MeV. It is worth reminding that tilted beams were not considered for the RREA models, and inthis work we primarily focus on the leader models. From the 39 events best fit by RREA models, 24 werebest fit by narrow models and 15 were best fit by wide RREA models. From 27 TGFs best fit by lightningleader models, 17 were best fit by 200-MV models, 8 were best fit by 100 MV, and only 2 TGFs were best
MAILYAN ET AL. LIGTHNING MODEL GBM TGF ANALYSIS 9

Journal of Geophysical Research: Space Physics 10.1029/2019JA026912Ta
ble
1Th
eRes
ults
ofth
eInd
ivid
ualT
GF
Spec
tra
Ana
lysis
Alo
ngW
ithSo
meP
aram
eter
sofT
GFs
—D
urat
ion,
Offs
etof
theS
ourc
eRel
ativ
eto
theF
erm
iSpa
ceTe
lesc
ope,
Det
ecto
rUse
d
Dur
atio
nO
ffset
Det
ecto
rRe
sults
TGF
IDC
ount
s(μ
s)(k
m)
used
Rate
(ph.
/μs)
Best
Pref
erre
dRe
ject
edm
odel
sTG
F090
8281
4753
412
132
B00.
3512
kmn.
RREA
10–1
5km
n.w
.RRE
Aor
200M
V20
kmal
l,10
0MV,
60M
VTG
F091
1302
1921
126
226
B10.
3410
km20
0M
Vt4
0o3
110
–12
kmw
.RRE
Aor
200
MV
15–2
0km
all,
100
MV,
60M
VTG
F091
2138
7625
169
115
B10.
3412
kmn.
RREA
10–1
5km
n.w
.RRE
Aor
200
MV
20km
all,
100
MV,
60M
VTG
F091
2275
4026
268
90B0
0.47
10km
n.RR
EA10
–15
kmn.
or10
kmw
.RRE
A20
kmal
l,al
llea
ders
TGF1
0020
7843
3424
022
7B0
0.35
10km
w.R
REA
10–1
2km
w.
all2
0km
,RRE
Ana
rrow
,lea
ders
TGF1
0030
4842
2917
029
3B1
0.34
10km
w.R
REA
10–1
5km
w.R
REA
,200
MV
n.RR
EA,2
0km
,100
MV,
60M
VTG
F100
6169
0029
240
152
B10.
2510
km20
0M
Vt2
010
–15
kmn.
w.R
REA
,100
MV,
200
MV
20km
all,
60M
VTG
F100
7056
6346
246
55B1
0.34
12km
w.R
REA
10–1
5km
w.1
5-20
n.RR
EA,1
00M
Vor
200
MV
60M
VTG
F100
7130
9525
329
234
B10.
1510
km20
0M
Vt2
010
–15
kmn.
w.R
REA
,100
MV
or20
0M
V20
kmal
l,60
MV
TGF1
0081
7620
3122
115
3B1
0.28
15km
w.R
REA
10–2
0km
n.w
.RRE
Aor
200
MV
100
MV,
60M
VTG
F100
9095
3926
226
102
B10.
4410
kmn.
RREA
10–1
2km
n.RR
EA15
–20
kmal
l,al
llea
ders
TGF1
0092
5319
2925
812
8B1
0.25
10km
n.RR
EA10
–15
kmn.
w.R
REA
or20
0M
V20
kmal
l,10
0M
V,60
MV
TGF1
0100
3735
2620
415
0B0
0.37
12km
n.RR
EA10
–15
kmn.
w.R
REA
,100
MV,
200
MV
20km
all,
60M
VTG
F101
0278
7526
340
290
B10.
1420
kmw
.RRE
A10
–20
kmn.
w.R
REA
,100
MV,
200
MV
60M
VTG
F101
1182
4923
145
102
B10.
2810
kmn.
RREA
10–1
5km
n.w
.RRE
A20
kmal
l,al
llea
ders
TGF1
0112
3225
2929
012
3B1
0.47
12km
n.RR
EA10
–15
kmn.
w.R
REA
or20
0M
V20
kmal
l,10
0M
V,60
MV
TGF1
0112
4661
2134
015
0B0
0.59
10km
200
MV
10–2
0km
n.w
.RRE
A,1
00M
V,20
0M
V60
MV
TGF1
0120
5250
2241
066
6B1
0.61
10km
200
MV
t20
10–2
0km
w.R
REA
,t10
0M
V,t2
00M
Vn.
RREA
,60
MV
TGF1
0120
8234
4946
018
1B1
0.40
12km
n.RR
EA10
–15
kmn.
w.R
REA
,100
MV,
200
MV
20km
all,
60M
VTG
F110
1124
1644
495
194
B10.
1610
km10
0M
Vt4
010
–15
n.RR
EA,1
00M
V,20
0M
Vw
.RRE
A,2
0km
,60
MV
TGF1
1012
5162
3031
020
7B1
0.43
15km
w.R
REA
10–2
0km
n.w
.RRE
A,1
00M
V,20
0M
V60
MV
TGF1
1052
2841
3330
082
B00.
410
km10
0M
V10
–20
kmn.
w.R
REA
,100
MV,
200
MV
60M
VTG
F110
7221
7150
500
147
B00.
4010
kmn.
RREA
10–1
5km
n.w
.RRE
Aor
200
MV
20km
,100
MV,
60M
VTG
F110
7252
9835
230
100
B00.
3512
-km
n.RR
EA10
–15
kmn.
w.R
REA
or20
0M
V20
km,1
00M
V,60
MV
TGF1
1072
6289
2325
733
9B1
0.20
15km
200
MV
10–2
0km
n.w
.RRE
A,1
00M
V,20
0M
V60
MV
TGF1
1092
4798
3141
947
B10.
5512
km20
0M
V10
–20
kmn.
w.R
REA
,100
MV,
200
MV
60M
VTG
F120
1204
1223
221
475
B10.
2015
km60
MV
t20
10–2
0km
60M
V,10
0M
V,20
0M
V,n.
RREA
w.R
REA
TGF1
2022
9546
2222
239
2B1
0.19
15km
100
MV
t20
10–2
0km
60M
V,10
0M
V,20
0M
V,n.
RREA
w.R
REA
TGF1
2072
8461
3018
912
2B0
0.35
10km
100
MV
t40
10–1
5km
n.w
.RRE
A,1
00M
V,20
0M
V20
km,6
0M
VTG
F120
8272
8235
210
234
B10.
3220
kmn.
RREA
12–1
0km
n.w
.RRE
A,1
00M
V,20
0M
V10
km,6
0M
VTG
F120
9027
0321
140
136
B10.
3410
km20
0M
Vt4
0o3
110
–15
n.w
.RRE
A,1
00M
V,20
0M
V20
kmal
l,60
MV
TGF1
2101
2241
3426
011
6B1
0.35
10km
n.RR
EA10
–12
kmn.
or20
0M
Vt4
0o3
115
–20
km,w
.,60
MV,
100
MV
TGF1
2101
8710
2524
722
0B0
0.47
10km
200
MV
t40
o31
10–1
2km
n.w
.RRE
Aor
100
MV,
200
MV
15–2
0km
,60
MV
TGF1
2110
4065
2920
071
B10.
3410
km10
0M
Vt4
010
–20
kmn.
w.R
REA
,100
MV,
200
MV
60M
VTG
F121
1062
8325
260
251
B00.
4610
km20
0M
Vt2
0o3
110
–15
kmn.
w.R
REA
,100
MV,
200
MV
20km
,60
MV
TGF1
2120
7917
4664
511
9B0
0.56
10km
n.RR
EA10
–12
kmn.
w.
15–2
0km
,all
lead
ers
MAILYAN ET AL. LIGTHNING MODEL GBM TGF ANALYSIS 10

Journal of Geophysical Research: Space Physics 10.1029/2019JA026912
Tabl
e1
Cont
inue
d
Dur
atio
nO
ffset
Det
ecto
rRe
sults
TGF
IDC
ount
s(μ
s)(k
m)
used
Rate
(ph.
/μs)
Best
Pref
erre
dRe
ject
edm
odel
sTG
F130
3272
8836
420
359
B00.
4615
km10
0M
V10
–20
kmn.
w.R
REA
,100
MV,
200
MV
60M
VTG
F130
3275
1825
229
318
B10.
3815
km20
0M
Vt4
010
–20
kmn.
w.R
REA
,100
MV,
200
MV
60M
VTG
F130
4154
2728
229
146
B10.
3510
kmw
.RRE
A10
–15
kmn.
w.R
REA
,100
MV,
200
MV
20km
,60
MV
TGF1
3050
3434
2623
018
1B0
0.28
15km
w.R
REA
10–2
0km
n.w
.RRE
A,1
00M
V,20
0M
V60
MV
TGF1
3060
6592
2327
312
0B1
0.17
10km
n.RR
EA10
–15
kmn.
w.R
REA
,200
MV
20km
,60
MV,
100
MV
TGF1
3060
7586
4249
318
5B1
0.17
20km
w.R
REA
10–2
0km
n.w
.RRE
Aal
llea
ders
TGF1
3072
8569
3432
917
5B1
0.20
10km
200
MV
10–2
0km
n.w
.RRE
A,1
00M
V,20
0M
V60
MV
TGF1
3093
0128
3334
574
B00.
2610
km10
0M
Vt2
010
–20
kmn.
w.R
REA
,100
MV,
200
MV
60M
VTG
F131
1032
7325
283
130
B00.
1910
km10
0M
Vt4
010
–20
kmn.
w.R
REA
,100
MV,
200
MV
60M
VTG
F131
1307
0323
195
290
B00.
3412
kmw
.RRE
A10
–20
kmn.
w.R
REA
,200
MV
60M
V,10
0M
VTG
F140
2267
9434
327
99B0
0.32
12km
n.RR
EA10
–20
kmn.
w.R
REA
,200
MV
60M
V,10
0M
VTG
F140
3166
2522
761
59B0
0.53
10km
200
MV
10–2
0km
n.w
.RRE
A,2
00M
V,10
0M
V60
MV
TGF1
4073
0385
2440
229
4B0
0.14
10km
200
MV
10–2
0km
n.w
.RRE
A,2
00M
V,10
0M
V60
MV
TGF1
4080
4347
3333
413
0B0
0.34
10km
n.RR
EA10
–12
kmn.
w.R
REA
15–2
0km
,lea
ders
TGF1
4092
4150
2418
060
B00.
3210
km20
0M
Vt2
0o3
110
–20
kmn.
w.R
REA
,200
MV,
100
MV
60M
VTG
F141
0050
0122
226
124
B00.
3212
kmn.
RREA
10–1
5km
n.w
.RRE
A,2
00M
V20
km,6
0M
V,10
0M
VTG
F141
2150
1125
224
153
B00.
5210
km20
0M
Vt2
0o3
110
–15
kmn.
w.R
REA
,200
MV,
100
MV
20km
,60
MV
TGF1
4121
8514
4177
013
B00.
3115
kmn.
RREA
10–2
0km
n.w
.RRE
Ale
ader
sTG
F150
1273
5823
228
47B1
0.26
10km
n.RR
EA10
–15
kmn.
RREA
w.R
REA
,lea
ders
TGF1
5021
3634
3249
332
8B1
0.32
20km
w.R
REA
10–2
0km
n.w
.RRE
Ale
ader
sTG
F150
4016
3727
323
154
B10.
3215
kmw
.RRE
A10
–20
kmn.
w.R
REA
,100
MV,
200
MV
60M
VTG
F150
5058
1628
214
224
B00.
4910
kmw
.RRE
A10
–15
kmw
.RRE
A,2
00M
Vn.
RREA
,20
km,1
00M
V,60
MV
TGF1
5061
3479
2126
940
B10.
3110
kmn.
RREA
10–1
5km
n.w
.RRE
A20
km,l
eade
rsTG
F150
6212
7525
252
201
B00.
3410
kmn.
RREA
10–1
5km
n.w
.RRE
A,2
00M
V20
km,6
0M
V,10
0M
VTG
F150
9068
0535
468
52B1
0.32
10km
n.RR
EA10
–12
kmn.
RREA
w.R
REA
,15–
20km
,lea
ders
TGF1
5100
8198
3747
412
6B0
0.37
15km
n.RR
EA10
–15
kmn.
w.R
REA
,200
MV
20km
,60
MV,
100
MV
TGF1
5102
0736
2223
319
5B1
0.38
12km
w.R
REA
10–1
5km
n.w
.RRE
A,1
00M
V,20
0M
V20
km,6
0M
VTG
F151
1155
6930
279
300
B00.
3212
kmw
.RRE
A10
–15
kmw
.RRE
A,2
00M
Vn.
RREA
,20
km,1
00M
V,60
MV
TGF1
6032
4294
2325
231
0B1
0.32
20km
60M
Vtil
ted
light
ning
n.w
.RRE
ATG
F160
6252
7321
410
169
B00.
1712
km20
0M
V10
–20
kmn.
w.R
REA
,100
MV,
200
MV
60M
V
Not
e.Ei
ther
BGO
-0or
BGO
-1de
tect
orw
asus
edde
pend
ing
onth
eTG
Fso
urce
loca
tion
rela
tive
toth
esp
acec
raft.
Baye
sian
bloc
kdu
ratio
nes
timat
ew
asfir
stus
ed,t
hen
the
resu
ltw
asex
amin
edby
eye
and
the
dura
tion
mod
ified
toin
clud
eco
unts
that
are
asso
ciat
edw
ithth
eTG
F,bu
tmis
sed
byth
eal
gorit
hmas
desc
ribed
inM
aily
anet
al.(
2016
).Th
epr
esen
ted
phot
onra
teco
rres
pond
sto
the
best
fitm
odel
.TG
Fs,w
hich
are
best
fitby
light
ning
lead
erm
odel
sare
high
light
edus
ing
gree
nco
lor.
Nar
row
,wid
e,an
dtil
ted
beam
sare
note
dby
lette
rsn,
w,a
ndt,
resp
ectiv
ely.
The
200-
MV
lead
erm
odel
swith
narr
ower
beam
swith
half
angl
eof
31◦
are
indi
cate
das
31◦
.TG
Fs=
terr
estr
ialg
amm
a-ra
yfla
shes
.
MAILYAN ET AL. LIGTHNING MODEL GBM TGF ANALYSIS 11

Journal of Geophysical Research: Space Physics 10.1029/2019JA026912
Figure 9. Total number of seed electrons with energies greater than 10 keVversus subsatellite offset distance of different TGF events measured byFermi GBM. The results are obtained using the best fit lightning models.The production altitude of TGF source is indicated by different colors. Mostof the best fit models are tilted. TGF = terrestrial gamma-ray flash;GBM = Gamma-ray Burst Monitor.
fit by a 60-MV model. In general, low-altitude models were preferred forboth lightning leader and RREA models. Out of 66 TGFs, 36 could bebest fit by a 10-km altitude model, 14 events were best fit by a 12-kmmodel, and 11 events by a 15-km model. Only five5 events were bestfit by a 20-km model. Most of the time all 20-km models and 60-MVlightning leader models can be rejected with a high level of confidenceas the GBM-observed spectra tend to be hard. However, due to thespectral diversity of the data set analyzed in this paper (events occur-ring in 2013–2016), there are exceptions. For example, high-altitude,low leader potential models can also best fit some observed TGF data.TGF160324294 is the only event for which RREA models considered inthis work could be rejected. This is a very soft TGF with only one countabove 1 MeV and can be best fit by a tilted 60-MV leader, 20-km sourcealtitude model. All the events analyzed in this paper are presented inTable 1, along with their best, preferred, and rejected models.
A critical parameter in TGF studies is the source brightness, that is, totalnumber of seed electrons and/or photons, a parameter directly related tothe production mechanism and subsequent avalanche processes. In thepresent paper, using satellite-measured photon fluence and correspond-ing best fit leader model, we have estimated this number in three steps.First, we derive the true fluxes of gamma-rays incident on Fermi detec-tors by taking the instrumental effects into account, for example, pulse
pileup, dead time, and effective detection area. Second, we calculate the number of source bremsstrahlungphotons that is required at the production altitude in order to reproduce the gamma-ray flux obtained inthe first step. Finally, this number of source photons is converted into seed electrons using a conversion fac-tor. Specifically, this factor describes the total number of bremsstrahlung photons (>10 keV) produced perelectron injected in Monte Carlo simulations and is calculated explicitly following the procedure describedin Celestin et al. (2015). In the lightning leader model, it is mostly controlled by the potential drop formedin the leader tip region, being almost invariant of production altitude. The factor is approximately 3.4, 6.3,and 59.7 for leader potentials of 60, 100, and 200 MV, respectively, increasing almost exponentially in thepotential range above 60 MV.
Figure 9 shows the total number of seed electrons with energies greater than 10 keV versus subsatellite offsetdistance of different TGF events measured by Fermi GBM. The results are obtained using the correspondingbest fit lightning leader parameters. A minimum energy of 10 keV is used as that is the lowest energy con-sistently used in the present Monte Carlo simulations of electrons and photons. Counting the total numberof electrons that are truly runaway in inhomogeneous electric fields is complicated since it requires com-paring the energy of each electron with the electric field at the position of this electron. The total number ofsource electrons (with energies greater than 10 keV) is found to be roughly in the range between 6× 10¹⁵ and9 × 1018, with a majority between 1 × 10¹⁶ and 1 × 10¹⁷. If we take the avalanche multiplication into account,most estimated numbers of seeds are consistent with previously reported estimations using measurementsof radio signals and gamma-ray fluxes (e.g., Cummer et al., 2015; Dwyer et al., 2017). Note that this num-ber is generally higher than the theoretical value suggested by Celestin et al. (2015), which is derived usingground-based measurements of X-ray bursts (Schaal et al., 2012) by approximately 1 order of magnitude.This is possibly due to the fact that the subset of TGFs used in this study, that is, TGFs for which individualspectra can be estimated, corresponds to the highest part of the fluence distribution. We have checked in aseparate test that, if the screening effects are not considered (Lehtinen, 2000), or if the Seltzer-Berger crosssection (Seltzer & Berger, 1986) is instead used, the conversion factor (number of photons with energiesgreater than 10 keV produced per electron injected) could change, but by less than 1 order of magnitude. Itis, thus, important to note that different cross sections of bremsstrahlung radiation may somewhat changethis estimation, that is, by less than 1 order of magnitude. It can be seen from Figure 9 that most of thebest fit source altitudes are below 15 km, in good agreement with recent radio measurements that TGFs arecorrelated with initial leader steps during the initial development stages of intracloud discharges (Marshallet al., 2013). Interestingly, most of the deep TGF sources, for example, at 10 and 12 km, can best explain GBMmeasurements at nadir-offset distances less than 300 km. This is because source bremsstrahlung photons
MAILYAN ET AL. LIGTHNING MODEL GBM TGF ANALYSIS 12

Journal of Geophysical Research: Space Physics 10.1029/2019JA026912
originating from lower altitudes would experience more attenuation in the atmosphere, and thus less likelyto be registered as a bright event by Fermi GBM at offset distances larger than 300 km. The 20-km source(red point in Figure 9) is related to a low leader potential of 60 MV and tilted source beam. Also, at the sameoffset distance with the same production altitude of 10 km (blue points in Figure 9), the number of seedscan change by two orders of magnitude, which indicates the variation of the leader potential and the factthat the source photon beam is tilted.
In summary, it is difficult in most cases to convincingly prove or reject either the lightning leader or fullydeveloped RREA models. Multipoint measurements of TGFs would allow to put more strict constrainson the photon beaming geometry by having measurements available at various offset distances from thesource. However, it should be pointed out that both processes may occur in thundercloud electric fields.Leader-accelerated electrons can also runaway into uniform, large-scale thunderstorm fields, resulting innarrower beams. Thus, beaming only cannot automatically be used to constrain the TGF production mech-anisms. Additional broadband radio, optical and radar measurements would be helpful for future TGFanalyses.
References
Balanis, C. A. (1989). Advanced engineering electromagnetics. New York: John Wiley.Bazelyan, E. M., & Raizer, Y. P. (2000). Lightning physics and lightning protection. Bristol, PA: Instit. of Phys.Briggs, M., Fishman, G., Connaughton, V., Bhat, P. N., Paciesas, W., Preece, R., et al. (2010). First results on terrestrial gamma ray flashes
from the Fermi gamma-ray burst monitor. Journal of Geophysical Research, 115, A07323. https://doi.org/10.1029/2009JA015242Briggs, M. S., Xiong, S., Connaughton, V., Tierney, D., Fitzpatrick, G., Foley, S., et al. (2013). Terrestrial gamma-ray flashes in the Fermi era:
Improved observations and analysis methods. Journal of Geophysical Research: Space Physics, 118, 3805–3830. https://doi.org/10.1002/jgra.50205
Carlson, B., Lehtinen, N. G., & Inan, U. S. (2007). Constraints on terrestrial gamma ray flash production from satellite observation.Geophysical Research Letters, 34, L08809. https://doi.org/10.1029/2006GL029229
Celestin, S., & Pasko, V. P. (2010). Soft collisions in relativistic runaway electron avalanches. Journal of Physics D: Applied Physics, 43,315206. https://doi.org/10.1088/0022-3727/43/31/315206
Celestin, S., & Pasko, V. P. (2011). Energy and fluxes of thermal runaway electrons produced by exponential growth of streamers during thestepping of lightning leaders and in transient luminous events. Journal of Geophysical Research, 116, A03315. https://doi.org/10.1029/2010JA016260
Celestin, S., Xu, W., & Pasko, V. P. (2012). Terrestrial gamma ray flashes with energies up to 100 MeV produced by nonequilibriumacceleration of electrons in lightning. Journal of Geophysical Research, 117, A05315. https://doi.org/10.1029/2012JA017535
Celestin, S., Xu, W., & Pasko, V. P. (2015). Variability in fluence and spectrum of high-energy photon bursts produced by lightning leaders.Journal of Geophysical Research: Space Physics, 120, 10,712–10,723. https://doi.org/10.1002/2015JA021410
Chaplin, V., Bhat, N. P., Briggs, M. S., & Connaughton, V. (2013). Analytical modeling of pulse-pileup distortion using the true pulse shape:Applications to Fermi-GBM. Nuclear Instruments and Methods in Physics Research Section A: Accelerators, Spectrometers, Detectors andAssociated Equipment, 717, 21–36.
Cramer, E. S., Mailyan, B. G., Célestin, S., & Dwyer, J. R. (2017). A simulation study on the electric field spectral dependence of thunder-storm ground enhancements and gamma ray glows. Journal of Geophysical Research: Atmospheres, 122, 4763–4772. https://doi.org/10.1002/2016JD026422
Cummer, S. A., Lyu, F., Briggs, M. S., Fitzpatrick, G., Roberts, O. J., & Dwyer, J. R. (2015). Lightning leader altitude progression in terrestrialgamma-ray flashes. Geophysical Research Letters, 42, 7792–7798. https://doi.org/10.1002/2015GL065228
Dwyer, J. (2003). A fundamental limit on electric fields in air. Geophysical Research Letters, 30(20), 2055. https://doi.org/10.1029/2003GL017781
Dwyer, J. R. (2008). Source mechanisms of terrestrial gamma-ray flashes. Journal of Geophysical Research, 113, D10103. https://doi.org/10.1029/2007JD009248
Dwyer, J. R., & Babich, L. P. (2011). Low-energy electron production by relativistic runaway electron avalanches in air. Journal ofGeophysical Research, 116, A09301. https://doi.org/10.1029/2011JA016494
Dwyer, J. R., Liu, N., Grove, J. E., Rassoul, H., & Smith, D. M. (2017). Characterizing the source properties of terrestrial gamma ray flashes.Journal of Geophysical Research: Space Physics, 122, 8915–8932. https://doi.org/10.1002/2017JA024141
Dwyer, J., & Smith, D. (2005). A comparison between Monte Carlo simulations of runaway breakdown and terrestrial gamma-ray flashobservations. Geophysical Research Letters, 32, L22804. https://doi.org/10.1029/2005GL023848
Dwyer, J. R., Smith, D. M., & Cummer, S. A. (2012). High-energy atmospheric physics: Terrestrial gamma-ray flashes and relatedphenomena. Space Science Review, 173, 133–196. https://doi.org/10.1007/s11214-012-9894-0
Fishman, G. J., Bhat, P. N., Mallozzi, R., Horack, J. M., Koshut, T., Kouveliotou, C., et al. (1994). Discovery of intense gamma-ray flashes ofatmospheric origin. Science, 59, 1313–1316.
Fitzpatrick, G., Cramer, E., McBreen, S., Briggs, M. S., Foley, S., Tierney, D., et al. (2014). Compton scattering in terrestrial gamma-rayflashes detected with the Fermi gamma-ray burst monitor. Physical Review D, 90(4), 43008.
Foley, S., Fitzpatrick, G., Briggs, M. S., Connaughton, V., Tierney, D., McBreen, S., et al. (2014). Pulse properties of terrestrial gamma-rayflashes detected by the Fermi gamma-ray burst monitor. Journal of Geophysical Research: Space Physics, 119, 5931–5942. https://doi.org/10.1002/2014JA019805
Gjesteland, T., Østgaard, N., Connell, P., Stadsnes, J., & Fishman, G. (2010). Effects of dead time losses on terrestrial gamma ray flashmeasurements with the burst and transient source experiment. Journal of Geophysical Research, 115, A00E21. https://doi.org/10.1029/2009JA014578
AcknowledgmentsThe Fermi GBM Collaborationacknowledges the support of NASA inthe United States and DRL inGermany. We thank NASA for supportfrom Fermi Guest Investigation Grant80NSSC17K0514. Sebastien Celestin'swork was supported by the Frenchspace agency (CNES) in theframework of the satellite projectTARANIS. Joesph Dwyeracknowledges the support from AirForce Office of Scientific Researchunder Award FA9550-16-1-0396. Theauthors wish to thank the World WideLightning Location Network (http://wwlln.net), a collaboration amongover 50 universities and institutions,for providing the lightning locationdata used in this paper. We alsoacknowledge Earth Networks forproviding the ENTLN data examinedin this study. We also acknowledgeEarth Networks for providing theEarth Networks Total LightningNetwork (ENTLN) (https://www.earthnetworks.com/why-us/networks/lightning/) data used in this study.Researchers may [email protected] toarrange access to ENTLN data. Theauthors are grateful to Melissa Gibbyfor her help during the preparation ofthis paper. All GBM data used in thispaper are available at http://fermi.gsfc.nasa.gov/ssc/data/access/gbm/. DRMsfor the TGFs analyzed in this paper areavailable at http://gammaray.nsstc.nasa.gov/gbm/publications/mailyan_rspfiles/rsp_desc.html. Requests forthe simulations code can be made tothe corresponding author. A catalogdescribing TGF parameters is availableat http://fermi.gsfc.nasa.gov/ssc/data/access/gbm/tgf/. The data used infigures and results of this paper areavailable at https://github.com/bagratmailyan/tgfspectra.
MAILYAN ET AL. LIGTHNING MODEL GBM TGF ANALYSIS 13

Journal of Geophysical Research: Space Physics 10.1029/2019JA026912
Gjesteland, T., Østgaard, N., Laviola, S., Miglietta, M., Arnone, E., Marisaldi, M., et al. (2015). Observation of intrinsically bright terrestrialgamma ray flashes from the Mediterranean basin. Journal of Geophysical Research: Atmospheres, 120, 12,143–12,156. https://doi.org/10.1002/2015jd023704
Hutchins, M., Holzworth, R., Brundell, J., & Rodger, C. (2012). Relative detection efficiency of the world wide lightning location network.Radio Science, 47, RS6005. https://doi.org/10.1029/2012RS005049
Lehtinen, N. G (2000). Relativistic runaway electrons above thunderstorms (Ph.D. thesis), stanford university Ph. D. dissertation.Lyu, F. c., Cummer, S. A., Lu, G. p., Zhou, X., & Weinert, J. (2016). Imaging lightning intracloud initial stepped leaders by low-frequency
interferometric lightning mapping array. Geophysical Research Letters, 43, 5516–5523. https://doi.org/10.1002/2016GL069267Mailyan, B. G., Briggs, M. S., Cramer, E. S., Fitzpatrick, G., Roberts, O. J., Stanbro, M., et al. (2016). The spectroscopy of individual terrestrial
gamma-ray flashes: Constraining the source properties. Journal of Geophysical Research: Space Physics, 121, 11,346–11,363. https://doi.org/10.1002/2016JA022702
Mallios, S. A., Celestin, S., & Pasko, V. P. (2013). Production of very high potential differences by intracloud lightning discharges in con-nection with terrestrial gamma ray flashes. Journal of Geophysical Research: Space Physics, 118, 912–918. https://doi.org/10.1002/jgra.50109
Marisaldi, M., Fuschino, F., Labanti, C., Galli, M., Longo, F., Del Monte, E., et al. (2010). Detection of terrestrial gamma ray flashes up to40 MeV by the AGILE satellite. Journal of Geophysical Research, 115, A00E13. https://doi.org/10.1029/2009JA014502
Marshall, T., Stolzenburg, M., Karunarathne, S., Cummer, S., Lu, G., Betz, H.-D., et al. (2013). Initial breakdown pulses in intracloudlightning flashes and their relation to terrestrial gamma ray flashes. Journal of Geophysical Research: Atmospheres, 118, 10,907–10,925.https://doi.org/10.1002/jgrd.50866
Meegan, C., Lichti, G., Bhat, P. N., Bissaldi, E., Briggs, M. S., Connaughton, V., et al. (2009). The Fermi gamma-ray burst monitor. TheAstrophysical Journal, 702(1), 791.
Moss, G. D., Pasko, V. P., Liu, N., & Veronis, G. (2006). Monte Carlo model for analysis of thermal runaway electrons in streamer tips intransient luminous events and streamer zones of lightning leaders. Journal of Geophysical Research, 111, A02307. https://doi.org/10.1029/2005JA011350
Østgaard, N., Gjesteland, T., Hansen, R., Collier, A., & Carlson, B. (2012). The true fluence distribution of terrestrial gamma flashes atsatellite altitude. Journal of Geophysical Research, 117, A03327. https://doi.org/10.1029/2011JA017365
Østgaard, N., Gjesteland, T., Stadsnes, J., Connell, P. H., & Carlson, B. (2008). Production altitude and time delays of the terrestrial gammaflashes: Revisiting the Burst and Transient Source Experiment spectra. Journal of Geophysical Research, 113, A02307. https://doi.org/10.1029/2007JA012618
Rakov, V. A., & Uman, M. A. (2003). Lightning: Physics and effects. Cambridge, U. K: Cambridge Univ. Press.Roberts, O., Fitzpatrick, G., Stanbro, M., McBreen, S., Briggs, M., Holzworth, R., et al. (2018). The first Fermi-GBM terrestrial gamma ray
flash catalog. Journal of Geophysical Research: Space Physics, 123, 4381–4401. https://doi.org/10.1029/2017JA024837Schaal, M. M., Dwyer, J. R., Saleh, Z. H., Rassoul, H. K., Hill, J. D., Jordan, D. M., & Uman, M. A. (2012). Spatial and energy distributions
of X-ray emissions from leaders in natural and rocket triggered lightning. Journal of Geophysical Research, 117, D15201. https://doi.org/10.1029/2012JD017897
Seltzer, S. M., & Berger, M. J. (1986). Bremsstrahlung energy spectra from electrons with kinetic energy 1 keV–10 GeV incident on screenednuclei and orbital electrons of neutral atoms with z= 1–100. Atomic data and nuclear data tables, 35(3), 345–418.
Skeltved, A. B., Østgaard, N., Mezentsev, A., Lehtinen, N., & Carlson, B. (2017). Constraints to do realistic modeling of the electricfield ahead of the tip of a lightning leader. Journal of Geophysical Research: Atmospheres, 122, 8120–8134. https://doi.org/10.1002/2016JD026206
Smith, D. M., Lopez, L. I., Lin, R. P., & Barrington-Leigh, C. P. (2005). Terrestrial gamma-ray flashes observed up to 20 MeV. Science, 307,1085–1088.
Tavani, M., Marisaldi, M., Labanti, C., Fuschino, F., Argan, A., Trois, A., et al. (2011). Terrestrial gamma-ray flashes as powerful particleaccelerators. Physical review letters, 106(1).
Tierney, D., Briggs, M., Fitzpatrick, G., Chaplin, V., Foley, S., McBreen, S., et al. (2013). Fluence distribution of terrestrial gamma ray flashesobserved by the Fermi gamma-ray burst monitor. Journal of Geophysical Research: Space Physics, 118, 6644–6650. https://doi.org/10.1002/jgra.50580
Xu, W., Celestin, S., & Pasko, V. P. (2012). Source altitudes of terrestrial gamma-ray flashes produced by lightning leaders. GeophysicalResearch Letters, 39, L08801. https://doi.org/10.1029/2012GL051351
Xu, W., Celestin, S., & Pasko, V. P. (2015). Optical emissions associated with terrestrial gamma ray flashes. Journal of Geophysical Research:Space Physics, 120, 1355–1370. https://doi.org/10.1002/2014JA020425
Xu, W., Celestin, S., Pasko, V. P., & Marshall, R. A. (2017). A novel type of transient luminous event produced by terrestrial gamma-rayflashes. Geophysical Research Letters, 44, 2571–2578. https://doi.org/10.1002/2016GL072400
MAILYAN ET AL. LIGTHNING MODEL GBM TGF ANALYSIS 14