analysis of levies and financial instruments in relation
TRANSCRIPT

This report has been prepared by consultants for Zero Waste SA, and the views expressed do not necessarily reflect those of Zero Waste SA.
This report has been peer reviewed by an independent consultant for Zero Waste SA
Zero Waste SA cannot guarantee the accuracy of the report,
and does not accept liability for any loss or damage incurred as a result of relying on its accuracy.
Analysis of Levies and Financial Instruments in relation to Waste
Management

The South Australian Government established Zero Waste SA to promote waste
management practices that, as far as possible: eliminate waste or its consignment to landfill; advance the development of resource recovery and recycling; and, are based
on an integrated strategy for the State.
To achieve these objectives, Zero Waste SA needs local government, industry, and the State Government working and communicating together.
Final Report to
Zero Waste SA
Analysis of levies and financial instruments in relation to waste management
25 October 2004
BDA Group Economics and Environment
BDA MELBOURNE BDA CANBERRA PO Box 6009 PO Box 4022 Hawthorn West, VIC 3122 Manuka ACT 2603 Ph 041 268 7712 Ph (02) 6282 1443 Fax (03) 9852 8969 Fax (02) 6161 931
e c o n s e a r c h
Analysis of financial instruments for waste management in South Australia 25 October 2004
BDA Group and EconSearch 2
Executive Summary
The establishment of Zero Waste SA is part of a new legislative framework to drive an integrated strategy for waste reduction, waste minimisation, recycling and waste disposal. Work on a new State Waste Strategy has already begun, based on the principles of the waste management hierarchy and with a clear vision of progressing towards zero waste.
Zero Waste SA is seeking to investigate the potential for market instruments to influence waste generation and disposal patterns in SA. In this report, the range of market instruments employed for waste management internationally is reviewed, along with the performance of financial charges and levies for this purpose in Australia. The potential for changes in the SA Waste Depot Levy to promote the State’s waste management objectives is specifically investigated.
Community surveys in SA and elsewhere in Australia indicates that the community places significant importance of reducing waste disposal volumes. Householders are keen to participate in waste minimisation and recycling, subject to the provision of suitable kerbside services.
However despite this community support and an increase in recycling volumes, targets for the level of waste diverted from landfills have generally not been achieved - solid waste volumes to landfills in SA over the past decade have remained largely unchanged.
Financial instruments are defined in this study as polluter-pays charges and fees that provide direct monetary incentives to reduce waste or increase the level of recycling. Market instruments include these instruments as well as subsidies and property right approaches. The review of experiences with market instruments confirms that they are being increasingly applied to the management of wastes internationally and in Australia.
Among the financial instruments, advance disposal fees and deposit-refund schemes have been used with some success to increase recovery rates of problematic wastes. Performance bonds have also been successfully used to manage post-closure environmental impacts associated with landfills. The use of these instruments in Australia has however been more limited, with mixed enthusiasm.
The use of variable price municipal waste collection charges has been widely trialled both internationally and domestically. Successes have been highly qualified and are likely to be contingent on complimentary changes in kerbside collection services, community recycling infrastructure and education programs.
Landfill levies are perhaps the most prominent market instrument being used for waste management. Objectives for the use of landfill levies internationally and in Australia have variously comprised;
Analysis of financial instruments for waste management in South Australia 25 October 2004
BDA Group and EconSearch 3
1. Revenue generation;
2. Reduction in downstream environmental impacts associated with waste disposal;
3. Promoting volumetric recycling and disposal targets, as a surrogate for reducing upstream environmental impacts associated with resource exploitation and materials processing.
In practice, levies have rarely been differentiated to account for their environmental impacts in either landfilling or associated with upstream production and consumption activities. Rather landfill levies have been revenue focussed or used as financial penalties where predetermined recycling or disposal targets have not been met.
In this respect levies have been wholly successful in generating revenues, usually hypothecated to support waste programs and the administration of public waste management agencies. But success in driving volumetric reductions in waste disposal to landfill has been more modest. In those jurisdictions where levy rates have been significant, some reductions in disposal rates is evident, particularly for high volume wastes such as construction and demolition and green wastes which can readily be reused or recycled.
The SA Waste Depot Levy could be increased further and successfully drive increased recycling as well as providing a larger revenue base for waste programs. An assessment of potential impacts from increases in the Levy over a broad fee range has been investigated. For illustrative purposes, a doubling of the current levy rate (to $21/t), could promote a 19% reduction in landfill disposal volumes and increase total levy revenue by 55% or $6.1m.
It was estimated that such a doubling of the levy would impose an additional $3.8m annual economic cost on the community in waste management costs, averaging around $16/t diverted from landfill. A review of potential benefits from volumetric reductions in waste disposed to landfill casts some doubt on potential offsetting environmental benefits. Reduced environmental damage costs at landfill are likely to be less than $10/t and probably closer to $4/t, and hence net benefits from such a levy increase will be dependent on realising upstream benefits.
Upstream benefits will vary significantly by waste stream and material, and the unique combinations of production, trade and consumption patterns in a region, state or country. Further work is needed to better understand the nature of potential upstream benefits in the SA context.
Also, the timing of any fee increase needs to be considered. There is likely to be a lag in responses to the July 2003 increase in the Waste Depot Levy and market conditions following the closure of the Wingfield landfill at the end of 2004. These factors are likely to result in increases in landfill gate fees and reductions in waste disposal volumes. It would seem prudent to observe these responses prior to consideration of any further levy increases.
It should also be noted that estimated changes in disposal volumes were estimated assuming that ‘all other things are held constant’, such as population growth rates, economic activity, and so on.
Analysis of financial instruments for waste management in South Australia 25 October 2004
BDA Group and EconSearch 4
Like experiences elsewhere, disposal volumes could continue to increase in SA if these factors outweighed the impact of any levy increases.
While this study has focussed primarily on financial instruments, some stakeholders have expressed interest in the potential use of tradeable landfill quotas, analogous to the recently introduced UK Landfill Allowance Trading Scheme.
Acceptance of a tradeable quota scheme depends in part on the potential cost of meeting landfill targets. Although a tradeable quota scheme will increase the likelihood of achieving a target, this could come at a high cost to the community. Enforcing soft penalties to prevent compliance costs exceeding the benefits to the community may therefore be deemed essential. If this were the case, the instrument would essentially become a price instrument equivalent to the current Waste Depot Levy.
For modest reductions in landfill disposal volumes, the Waste Depot Levy is considered superiour to the introduction of a tradeable quota scheme. Both instruments could in theory deliver similar changes throughout the waste sector and at similar cost, but greater effort in scheme development, implementation and enforcement is likely with the quota instrument.
In summary, we believe financial instruments can play a role in assisting the South Australian Government realise its waste management objectives.
In the short-term, the State Government could assist local councils in adopting smaller bins for general waste in conjunction with new recycling bin & collection systems. This in itself could lead to significant reductions in municipal waste disposal volumes, as well as provide the necessary infrastructure to support a move to variable waste collection charges at the household level over time.
In the medium-term, a modest increase in the Waste Depot Levy could provide a larger revenue base to support waste reduction programs and provide a greater incentive for waste diversion from landfill. To minimise costs imposed on waste generators, landfill operators and government, no differentiation in levy rates is recommended at this time.
However investigation of the nature, extent and significance of upstream benefits, in the SA context, associated with the diversion of alternative wastes from landfill should be a priority to validate current policy settings and guide longer-term instrument design – such as providing a robust basis for differentiating levies or for developing instruments to target specific wastes.
Support for the development of instruments at the national level to handle product specific wastes of high environmental impact when disposed would be cost-effective, given potential difficulties and costs for State-based schemes. A range of advance disposal fees, take-back schemes, deposit-refund schemes and tradeable certificate schemes are currently being investigated across a range of products including electrical goods, computers, mobile phones and tyres.

Analysis of financial instruments for waste management in South Australia 25 October 2004
BDA Group and EconSearch 5
In the longer-term, and subject to confirmation of a zero waste strategy, tradeable landfill quota schemes could be investigated, and potentially applied to discrete waste streams or across all wastes. Extensive and well developed recycling industries, and a comprehensive enforcement regime, would be prerequisites. Even in these circumstances however, such instruments would remain a poor surrogate for efficient resources and industry policies in the first instance.

Analysis of financial instruments for waste management in South Australia 25 October 2004
BDA Group and EconSearch 6
Table of contents Executive Summary................................................................................................................................... 2 1 Introduction ............................................................................................................................................ 7 2 Background ............................................................................................................................................ 8
2.1 Waste generation, recycling and disposal .................................................................................... 8 2.2 Community attitudes................................................................................................................... 12 2.3 SA Waste policy ......................................................................................................................... 15 2.4 Market instruments for waste management ............................................................................... 16
3 Environmental impacts and waste ..................................................................................................... 20 4 International experience with market instruments for waste management.................................... 26
4.1 OECD......................................................................................................................................... 26 4.2 United States.............................................................................................................................. 28 4.3 The European Union .................................................................................................................. 32
5 Australian experience with financial instruments for waste management ..................................... 39 5.1 Advance disposal fees ............................................................................................................... 39 5.2 Deposit-refund schemes ............................................................................................................ 40 5.3 Performance bonds for landfills.................................................................................................. 41 5.4 Variable user collection fees ...................................................................................................... 41 5.5 Landfill levies.............................................................................................................................. 45
6 The SA Waste Depot Levy................................................................................................................... 58 6.1 Operation of the levy to date ...................................................................................................... 58 6.2 Estimated impacts from a higher levy......................................................................................... 61 6.3 The case for a differentiated levy ............................................................................................... 69
7 Aligning instruments with waste policy goals................................................................................... 73 7.1 Economic theory and instrument choice..................................................................................... 73 7.2 Lessons from Australian and international experience............................................................... 76 7.3 Appropriate instruments for SA .................................................................................................. 77 7.4 Recommendations ..................................................................................................................... 80
Appendix A: External costs of landfills.......................................................................................... 81 Appendix B: Methodology for assessing a higher landfill levy ................................................... 87 Appendix C: List of consultations.................................................................................................. 95 Disclaimer : All surveys, forecasts, projections and recommendations made in reports or studies associated with the consultancy are made in good faith on the basis of information available to the consultants at the time; and achievement of objectives, projections or forecasts set out in such reports or studies will depend among other things on the actions of the SA Government and their agents, over which the consultants have no control. Notwithstanding anything contained therein, neither the consulting organisations nor its servants or agents will, except as the law may require, be liable for any loss or other consequences (whether or not due to the negligence of the consultants, their servants or agents) arising out of the services rendered by the consultants.
Analysis of financial instruments for waste management in South Australia 25 October 2004
BDA Group and EconSearch 7
1 Introduction
Waste policy continues to evolve from a focus on minimising harm to the environment through improper disposal of wastes to diverting waste from landfills to be recycled or reused. As part of this, two principles have now been adopted by most State and Territory Governments, namely:
• The adoption of a ‘hierarchy of waste’ ideology - where reducing consumption is preferable to waste re-use and recycling which in turn is preferable to waste disposal.
• The setting of targets for the amount of waste going to landfills, with a broader vision of moving towards zero waste to landfill.
A range of landfill levies, recycling and product stewardship programs have been adopted to reduce waste. Despite this, the amount of waste going to landfills has generally not fallen. More recently, several State and Territory Governments have announced new waste reduction targets and overhauled waste management strategies. In SA, the government has introduced legislation to establish Zero Waste SA to drive a new strategy for waste reduction, minimisation, recycling and disposal.
Zero Waste SA is seeking to investigate the potential for financial instruments, and market instruments more broadly, to influence waste generation and disposal patterns. Financial instruments are defined as polluter-pays charges and fees that provide direct monetary incentives to reduce waste or increase the level of recycling. Market instruments include subsidies and property right approaches.
Zero Waste SA has commissioned BDA Group (BDA), with assistance from EconSearch, to investigate the range of market instruments employed for waste management internationally, to review the performance of financial instruments used to date in Australia, and to explore the potential for changes in the SA Waste Depot Levy to promote the State’s waste management objectives.
The study has involved a wide ranging review of international and domestic literature, consultations with key stakeholders and the development of a model of the SA waste management sector. Based on our investigations, we have made recommendations on the overall suitability of market instruments to assist the Government’s policy objectives.

Analysis of financial instruments for waste management in South Australia 25 October 2004
BDA Group and EconSearch 8
2 Background
This section provides a brief introduction to the waste management sector in SA, community attitudes to waste, policy responses by the SA Government and the range of market instruments available to governments to assist waste management.
2.1 Waste generation, recycling and disposal Solid wastes are generally classified under three subcategories, namely municipal (M), commercial and industrial (C & I), and construction and demolition (C & D). The composition of urban solid wastes can vary significantly, but across the major capital cities waste composition averages 40% municipal, 23% C & I and 37% C & D .
By international standards, waste generation in Australia is significant. In 1996-97, some 21.2 million tonnes of solid wastes were disposed at landfills nationwide. This equates to a per capita solid waste disposal of 1.1 tonnes/year - with domestic waste disposal rates second only to the USA among OECD countries (SoE 2001).
SA performs well against the other Australian states, but the level of waste disposed to landfills remains high (see Figure 1).
Figure 1: Solid waste disposal rates (t per person per year).
The definition of solid waste disposal for Victoria changed between 1996-97 and 1997-98 and this accounts for the apparent increase.Source: Australia State of the Environment 2001, Independent Report to the Commonwealth Minister for the Environment and Heritage

Analysis of financial instruments for waste management in South Australia 25 October 2004
BDA Group and EconSearch 9
Waste management in Australia is primarily the responsibility of local and state governments, who have pursued varied and disparate programs. Up to the 1990s, these programs had focussed primarily on the improved management of hazardous wastes and landfill practices to reduce off-site contamination from leachate. Total waste volumes steadily increased with economic and population growth.
As a catalyst for improved performance, a national per capita waste reduction target of 50% by the year 2000 was adopted by ANZECC in 1992, and formalised in the National Waste Minimisation Act (1992). Since this time, a number of state-level waste minimisation initiatives have been introduced. The guiding principle for all current waste management strategies is to begin with waste avoidance in the first place, followed by minimisation, recycling, and finally disposal as a last option.
However, targets for the level of waste diverted from landfills have generally not been achieved. In SA, despite a range of activities that have successfully promoted waste minimisation and led to an increase in recycling volumes, solid waste volumes to landfills in SA over the past decade have remained largely unchanged, as shown in Figure 2.
Figure 2: Solid waste to landfill in SA (‘000 tonnes)1
0
400
800
1200
93/94
95/95
95/96
96/97
97/98
98/99
99/00
00/01
01/02
Much of these waste streams are suitable for reuse or recycling, with national recycling performance by category shown in Figure 3. The complexity and cost of recycling is strongly linked to the extent to which recyclables are mixed with other waste or to the extent that recyclables are contaminated due to poor separation at source. In addition, the economics of reuse or recycling will be influenced by the price of virgin materials, the quality of recycled product and the extent to which externalities associated with waste generation and management are sheeted home to producers.
1 Data from SA EPA

Analysis of financial instruments for waste management in South Australia 25 October 2004
BDA Group and EconSearch 10
Nationally, around 36% of solid waste generated is diverted to a range of recycling and reuse activities. Most of the gains in waste reduction to date have been attributed to increases in recycling rates, particularly with kerbside recycling and the reuse of materials from demolished buildings.
Figure 3: Volume of waste material to Australian Landfills by source (‘000 tonnes)
0
1000
2000
3000
Paper
Plastic
Glass
Ferro
us
Garden
Food
Timbe
r
Soil/R
ubble
Concrete
Other
MSW C&I B&D
While nationally around 36% of solid waste generated is diverted to recycling and reuse activities, in South Australia, over 50% of wastes are currently being diverted. The estimated distribution of
Analysis of financial instruments for waste management in South Australia 25 October 2004
BDA Group and EconSearch 11
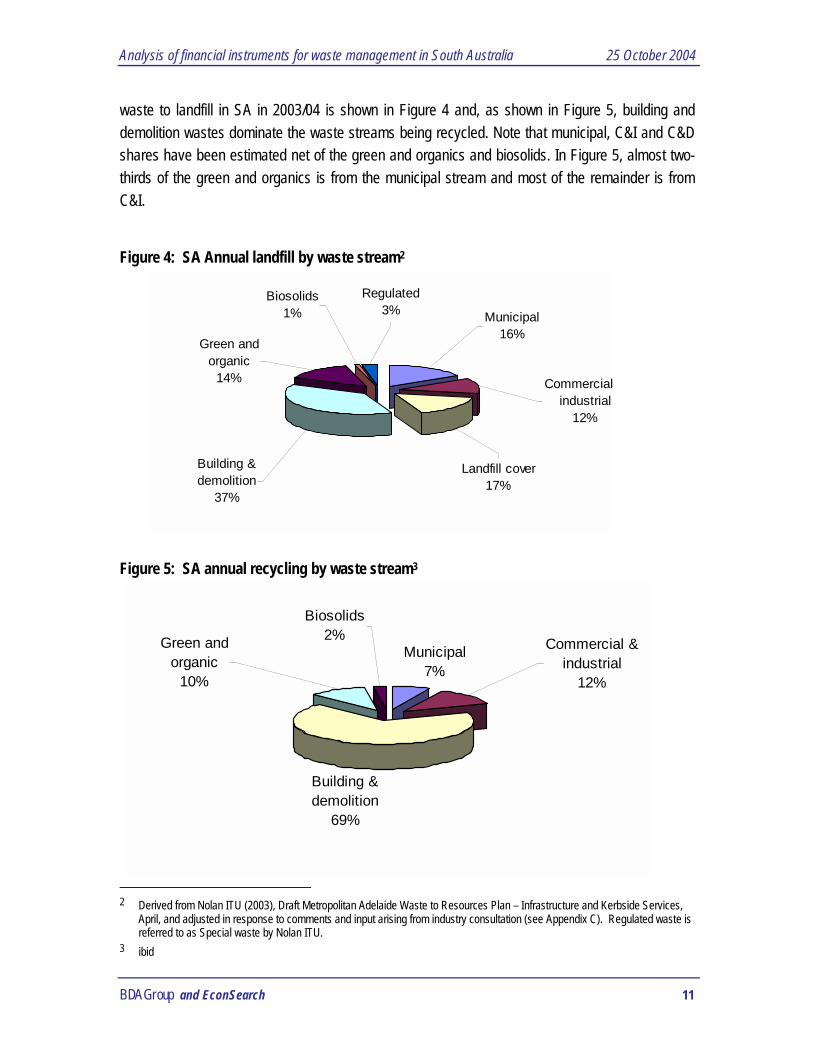
waste to landfill in SA in 2003/04 is shown in Figure 4 and, as shown in Figure 5, building and demolition wastes dominate the waste streams being recycled. Note that municipal, C&I and C&D shares have been estimated net of the green and organics and biosolids. In Figure 5, almost two-thirds of the green and organics is from the municipal stream and most of the remainder is from C&I.
Figure 4: SA Annual landfill by waste stream2 Figure 5: SA annual recycling by waste stream3
2 Derived from Nolan ITU (2003), Draft Metropolitan Adelaide Waste to Resources Plan – Infrastructure and Kerbside Services,
April, and adjusted in response to comments and input arising from industry consultation (see Appendix C). Regulated waste is referred to as Special waste by Nolan ITU.
3 ibid
Municipal 7%
Building & demolition
69%
Green and organic
10%
Biosolids2% Commercial &
industrial 12%
Building & demolition
37%
Green and organic
14% Commercial industrial
12%
Regulated3%
Biosolids1%
Landfill cover17%
Municipal 16%

Analysis of financial instruments for waste management in South Australia 25 October 2004
BDA Group and EconSearch 12
2.2 Community attitudes Each Australian household generates about 400 kilograms of waste per year, placing Australia amongst the top 10 generators of household waste in the OECD. Nevertheless, community surveys consistently indicate concern over high disposal rates, the management of landfills and failure to recover the resource value of waste materials – and in response communities have embraced the call by governments to recycle waste. In March 2003 around 95% of Australian households recycled waste and around 83% re-used wastes. Household surveys by the ABS show high levels of recycling and re-use in all states and territories, with the levels of recycling and re-use increasing over time4.
Very few households (2%) do not recycle or re-use some wastes. More than 80% of Australian households recycled or re-used glass, plastic bags, plastic bottles, old clothing, paper and cardboard. Paper and cardboard was the waste most likely to be recycled, with 88% of Australian households recycling paper or cardboard. Materials recycled by households are shown in Figure 65.
Figure 6: Households recycling by material, Australia 2003
A kerbside collection of recyclables is the predominant method of recycling and is used by 87% of households. Recycling method by material type is shown in Figure 7.
Community attitudes in NSW are routinely surveyed by the NSW EPA. In 20036, they found that 9% of people see waste management as the most important environmental issue in the State,
4 ABS (2003), Environmental Issues: People's Views and Practices (Cat # 4602.0) 5 ibid 6 NSW Department of Environment and Conservation (2003), Who Cares about the Environment in 2003, a survey of NSW
people’s environmental knowledge, attitudes and behaviour.

Analysis of financial instruments for waste management in South Australia 25 October 2004
BDA Group and EconSearch 13
while 19% saw it as one of the top two issues. Interestingly, views were dominated by concern over littering, with only 3 of the 19 percentage points directed at household recycling and waste minimization.
The majority of people surveyed believed that the handling of household rubbish has improved (72%, up from 69% in both the 1994 and 2000 surveys). In addition, half the people surveyed feel improvements are still being made in minimising private waste. Personal behaviour changes during the past five years for environmental reasons included in relation to recycling (48%), avoiding littering (9%), reducing plastic bag use (6%) and using environmentally friendly products (9%).
Figure 7: Households recycling method7
Note: Totals will not add to 100% as households that recycled may have used more than one method of recycling. (a) Refers only to households that recycled the surveyed material in each case. (b) Includes composting or mulching and re-use within the household. Source: ABS 1996 (Cat. no. 4602.0), Environmental Issues, People's Views and Practices, Australia,
Reasons given by householders who did not participate in recycling are shown in Figure 8, and relate to either the unavailability of appropriate services or due to the small quantity of recyclate generated by the household.
7 ABS (2003) Environmental Issues: People's Views and Practices, Cat No 4602.0

Analysis of financial instruments for waste management in South Australia 25 October 2004
BDA Group and EconSearch 14
Figure 8: Reasons given for not recycling8
Surveys conducted in SA show similar attitudes prevail9. Key findings include;
• The way that South Australians collect and dispose of waste was felt to be important by 96% of respondents.
• 98% of respondents thought it was important to cut down on the amount of waste that goes into rubbish tips, with the following reasons given;
o Rubbish tips and landfill use up too much space (59%),
o Pollution reduction (48%)
o Need to conserve, recycle and reuse our resources (33%).
• When asked what they could do to try and cut down on the amount of household waste or garbage produced, 23% of respondents stated they could recycle more. Selecting goods with less packaging and composting were the other main suggestions made by respondents (21% and 17% respectively).
• Large, 240 litre wheelie garbage bins were used by 55% of respondents. The major regional councils had significantly higher levels of large wheelie bin use:
• Types of kerbside recycling containers used included:
o Crate 46%
8 ibid 9 McGregor Tan Research, Community attitudes to waste management and recycling in South Australia. Based on surveys
conducted in November and December 2000. The sample was made up of 600 Metropolitan Adelaide residents and 400 residents from regional South Australia.

Analysis of financial instruments for waste management in South Australia 25 October 2004
BDA Group and EconSearch 15
o Wheelie bin (not split – dedicated to recyclables) 23%
o Split wheelie bin (internal divider) 17%
o No kerbside recycling service 14%
o Bag 5%
• Most interviewees thought that council rates should continue to be used to help provide recycling services (89%)
• The majority of respondents were against the concept of a scheme whereby households are charged according to the amount of waste collected or the frequency of waste collection (47%).
2.3 SA Waste policy Following a review of the waste industry in South Australia the State Government announced, in January 2003, a package of measures to more effectively coordinate and implement waste reduction targets.
The measures comprised five initiatives:
• Create a statutory waste entity (Zero Waste SA) to drive more sustainable outcomes for waste management by waste avoidance, reduction, re-use, recycling and material and/or energy recovery.
• Establish Local Government Waste Management Groups to improve coordination of waste service activities and achieve economies of scale.
• Establish new transparent financial arrangements and increase the waste disposal levy to fund reforms.
• Implement relevant additional legislative changes.
• Develop and implement a State Waste Strategy.
The establishment of Zero Waste SA is part of fulfilling the election commitment for a new legislative framework under which the Government can work with Local Government and industry to drive a new and integrated strategy for waste reduction, waste minimisation, recycling and waste disposal. Work on a new State Waste Strategy has already begun, based on the principles of the waste management hierarchy and with a clear vision of progressing towards zero waste10.
This will include the possible production of a new Environment Protection Policy for waste. At this point it is unclear what measures may be proposed through these measures, but it may include
10 www.environment.sa.gov.au/zerowaste/

Analysis of financial instruments for waste management in South Australia 25 October 2004
BDA Group and EconSearch 16
mandatory waste management plans, kerbside service performance targets, landfill bans for some materials, and a range of other waste minimisation initiatives11.
The SA Government has indicated that the primary objective of ZWSA is to promote waste management practices that, as far as possible:
• eliminate waste or its consignment to landfill
• advance the development of resource recovery and recycling
• are based on an integrated strategy for the State.
In the exercise of its functions, ZWSA is to be guided by the waste management hierarchy, principles of ecologically sustainable development and best practice methods and standards in waste management12.
2.4 Market instruments for waste management Market instruments generally operate as either a price or quantity based instrument. Price based instruments assign a price to environmental impacts within existing markets through the imposition of charges, taxes or subsidies. Firms then respond to the modified market signals and adopt the resource use or management practice that offers them the greatest benefit and, if the policy is effective, leads to a better environmental outcome.
Quantity based instruments create a market in the rights to engage in an activity (that may be associated with environmental damage) by restricting the total level of activity and allocating rights to participate in that activity. An efficient allocation of rights is then determined through a market mechanism.
Where the marginal benefits and costs of using the resource are well-understood, similar outcomes and efficiency of resource use can be achieved using either a price or a quantity instrument. In these circumstances the administration, monitoring and enforcement costs of each alternative will be important factors to consider when choosing between price and quantity instruments.
Beyond the broad classification of market instruments as either price or quantity (property right) based, several taxonomies of instruments have been developed. For current purposes the following classes of market instruments are useful and applications for waste management are provide.
Charges and taxes are ‘price’ instruments linked to the environmental damage caused by different activities. While such charges have often been used for revenue purposes, true ‘Pigovian’ taxes
11 Nolan ITU (2003), Draft Metropolitan Adelaide Waste to Resources Plan – Infrastructure and Kerbside Services, April 12 Zero Waste SA (2004), Business plan 2003-04 and directions for 2004-2006; and as provided in the agency’s enabling
legislation
Analysis of financial instruments for waste management in South Australia 25 October 2004
BDA Group and EconSearch 17
seek to internalise the externality costs of the activity. That is, the tax provides an incentive to introduce new technologies, products or processes to minimise impacts and hence avoid the tax. The effectiveness of taxes will therefore depend upon the responsiveness or ‘price elasticity of supply’ of the regulated emission, activity or product. As the cost of realising environmental gains falls on those creating the externalities, these charges are often termed ‘polluter-pays’. These instruments are sometimes simply referred to as financial instruments, and represent a key focus of this study. The range of such instruments is shown in Box 1.
Subsidies and tax concessions - are also price instruments, but rather than imposing a liability the instruments operate by providing a financial incentive to encourage desirable activities. In this respect they are often termed ‘beneficiary pays’ incentives. Subsidies are often used when it is difficult to identify, monitor or enforce tax approaches (say where impacts are from diffuse sources), where tax imposts may lead to spillover costs (such as illegal dumping of wastes) or for equity reasons. Subsidies used in the waste sector include a wide range of assistance instruments such as bounties, tax concessions and direct grants, to for example, assist the development and running of waste collection and recycling systems or encourage waste minimisation practices or the development of products that generate less waste, are less toxic or are easier to recycle.
Financial enforcement incentives – represent penalties for non-compliance with environmental regulations. They are only a market instrument if the incentives are linked to the progressive environmental damage as performance exceeds non-compliance. Waste sector examples include:
• Landfill performance bonds – are payments made before the landfill commence, with payment levels linked to potential environmental damages.
• Non-compliance fees – are penalties levied where performance exceeds regulated targets. For example, non-punitive penalties may be used with landfill quota schemes. The use of these fees recognises that landfills may face significant uncertainty over disposal levels and significant environmental and economic costs could be arise if a landfill had to close on short notice due to non-compliance.
Property rights or market creation – these quantity based instruments operate by creating tradeable rights or altering existing rights to environmental resources or to the degradation of such resources. For example, rights may be created for the disposal of waste to landfill, with landfill operators allowed to trade these rights. Tradeable landfill quota schemes are based on such a property rights framework (see for example Box 1, Section 4.3 which describes the UK Landfill Allowance Trading Scheme). Unlike the price approaches, cost imposts on the waste sector will not be limited but there will be greater certainty of realising environmental goals, subject to controlling non-compliance and illegal disposal.
Analysis of financial instruments for waste management in South Australia 25 October 2004
BDA Group and EconSearch 18
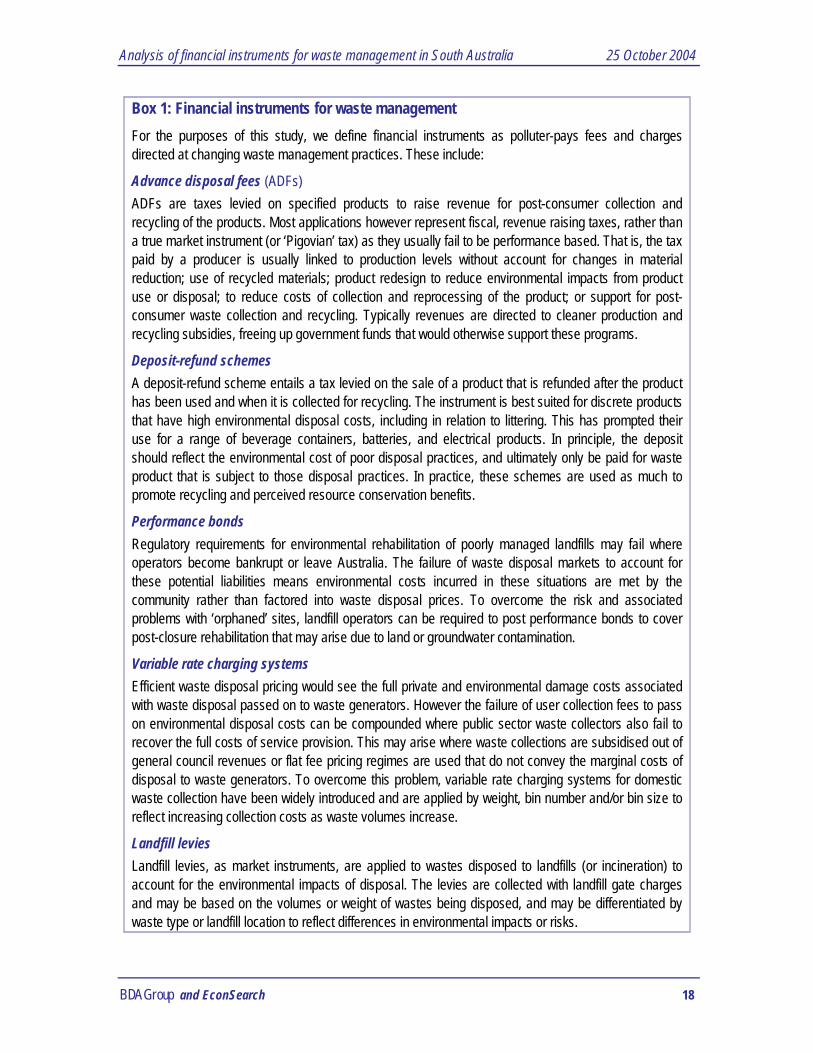
Box 1: Financial instruments for waste management For the purposes of this study, we define financial instruments as polluter-pays fees and charges directed at changing waste management practices. These include:
Advance disposal fees (ADFs) ADFs are taxes levied on specified products to raise revenue for post-consumer collection and recycling of the products. Most applications however represent fiscal, revenue raising taxes, rather than a true market instrument (or ‘Pigovian’ tax) as they usually fail to be performance based. That is, the tax paid by a producer is usually linked to production levels without account for changes in material reduction; use of recycled materials; product redesign to reduce environmental impacts from product use or disposal; to reduce costs of collection and reprocessing of the product; or support for post-consumer waste collection and recycling. Typically revenues are directed to cleaner production and recycling subsidies, freeing up government funds that would otherwise support these programs.
Deposit-refund schemes A deposit-refund scheme entails a tax levied on the sale of a product that is refunded after the product has been used and when it is collected for recycling. The instrument is best suited for discrete products that have high environmental disposal costs, including in relation to littering. This has prompted their use for a range of beverage containers, batteries, and electrical products. In principle, the deposit should reflect the environmental cost of poor disposal practices, and ultimately only be paid for waste product that is subject to those disposal practices. In practice, these schemes are used as much to promote recycling and perceived resource conservation benefits.
Performance bonds Regulatory requirements for environmental rehabilitation of poorly managed landfills may fail where operators become bankrupt or leave Australia. The failure of waste disposal markets to account for these potential liabilities means environmental costs incurred in these situations are met by the community rather than factored into waste disposal prices. To overcome the risk and associated problems with ‘orphaned’ sites, landfill operators can be required to post performance bonds to cover post-closure rehabilitation that may arise due to land or groundwater contamination.
Variable rate charging systems Efficient waste disposal pricing would see the full private and environmental damage costs associated with waste disposal passed on to waste generators. However the failure of user collection fees to pass on environmental disposal costs can be compounded where public sector waste collectors also fail to recover the full costs of service provision. This may arise where waste collections are subsidised out of general council revenues or flat fee pricing regimes are used that do not convey the marginal costs of disposal to waste generators. To overcome this problem, variable rate charging systems for domestic waste collection have been widely introduced and are applied by weight, bin number and/or bin size to reflect increasing collection costs as waste volumes increase.
Landfill levies Landfill levies, as market instruments, are applied to wastes disposed to landfills (or incineration) to account for the environmental impacts of disposal. The levies are collected with landfill gate charges and may be based on the volumes or weight of wastes being disposed, and may be differentiated by waste type or landfill location to reflect differences in environmental impacts or risks.

Analysis of financial instruments for waste management in South Australia 25 October 2004
BDA Group and EconSearch 19
A range of other policy approaches are often mistaken as market instruments. For example, Extended Producer Responsibility (EPR) is often cited as a potential market instrument to manage impacts associated with particular waste streams. However EPR is not a market instrument but rather a cost-sharing principle akin to polluter-pays; rather than inferring responsibility for environmental impacts rest with the person(s) causing the environmental damage (say through littering) it infers responsibility should be imposed on the product manufacturer (say of beverage containers). Manufactures, or governments on behalf of manufacturers, would then need to craft specific instruments or commercial arrangements to better manage the post-consumer waste impacts.

Analysis of financial instruments for waste management in South Australia 25 October 2004
BDA Group and EconSearch 20
3 Environmental impacts and waste
There are a range of environmental impacts that waste policies by governments seek to address. These include upstream impacts such as minimising the depletion of resources, pollution from the processing of virgin or recycled materials and externalities associated with consumption. There are also downstream disposal impacts such as externalities from disposal at landfills as well as illegal disposal externalities.
Environmental impacts associated with the disposal of waste to landfills were investigated by the NSW EPA13 in 1996. Their findings, updated for changes in landfill management practices and environmental damage valuations are described in detail in Appendix A. Based on this assessment, landfill externality costs for NSW landfills are reported in Table 2.
Table 2: Landfill externalities in NSW ($/tonne of waste landfilled)
Environmental Metropolitan Landfills Rural Landfills
Impact Low estimate High estimate Low estimate High estimate
Greenhouse $0 $7.7 $0 $14.6
Local amenity $0 $3.7 - -
Transport corridor $2.3 $2.9 $1.2 $1.5
Other emissions $0.01 $0.01 $0.01 $0.01
Total $2.3 $14.3 $1.2 $16.1
The main external cost associated with landfills is greenhouse gas emissions. The low greenhouse estimates take into account the effects of carbon sequestration. Of the high estimates, the figure for the rural landfills reflects the assumption that there is poorer landfill gas management.
Estimates of greenhouse gases from landfills were also calculated using the latest methods provided by the Australian Greenhouse Office14 and a value of the external costs of CO2
equivalents at $15 per tonne. The results are comparable to the estimates shown in Table 2.
The most recent international investigation of landfill impacts was undertaken by the European Commission15 in 2000. The study was largely based on municipal waste generation and management practices in Europe, but drawing on environmental impact values estimated in the US
13 NSW EPA (1996), Proposed Waste Minimisation and Management Regulation 1996: Regulatory Impact Statement 14 Australian Greenhouse Office Factors and Methods Workbook, March 2003 15 European Commission (2000), A study on the economic valuation of environemental externalities from landfill disposal and
incineration of waste.
Analysis of financial instruments for waste management in South Australia 25 October 2004
BDA Group and EconSearch 21
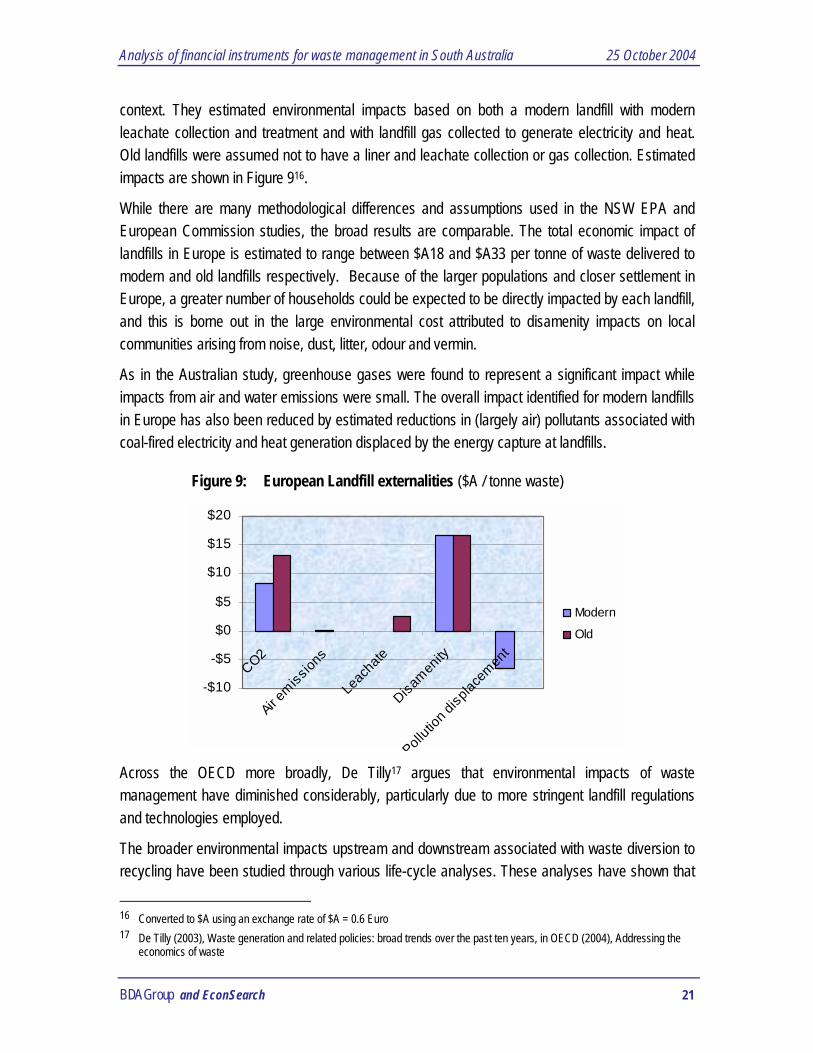
context. They estimated environmental impacts based on both a modern landfill with modern leachate collection and treatment and with landfill gas collected to generate electricity and heat. Old landfills were assumed not to have a liner and leachate collection or gas collection. Estimated impacts are shown in Figure 916.
While there are many methodological differences and assumptions used in the NSW EPA and European Commission studies, the broad results are comparable. The total economic impact of landfills in Europe is estimated to range between $A18 and $A33 per tonne of waste delivered to modern and old landfills respectively. Because of the larger populations and closer settlement in Europe, a greater number of households could be expected to be directly impacted by each landfill, and this is borne out in the large environmental cost attributed to disamenity impacts on local communities arising from noise, dust, litter, odour and vermin.
As in the Australian study, greenhouse gases were found to represent a significant impact while impacts from air and water emissions were small. The overall impact identified for modern landfills in Europe has also been reduced by estimated reductions in (largely air) pollutants associated with coal-fired electricity and heat generation displaced by the energy capture at landfills.
Figure 9: European Landfill externalities ($A / tonne waste)
-$10
-$5
$0
$5
$10
$15
$20
CO2
Air em
ission
s
Leach
ate
Disamen
ity
Pollutio
n displa
cemen
t
Modern
Old
Across the OECD more broadly, De Tilly17 argues that environmental impacts of waste management have diminished considerably, particularly due to more stringent landfill regulations and technologies employed.
The broader environmental impacts upstream and downstream associated with waste diversion to recycling have been studied through various life-cycle analyses. These analyses have shown that
16 Converted to $A using an exchange rate of $A = 0.6 Euro 17 De Tilly (2003), Waste generation and related policies: broad trends over the past ten years, in OECD (2004), Addressing the
economics of waste

Analysis of financial instruments for waste management in South Australia 25 October 2004
BDA Group and EconSearch 22
environmental impacts are very dependent on the waste material. For example, a subset of materials have a high impact at landfill (eg; batteries and possibly organic materials); recycling of certain materials results in significant upstream benefits (eg; aluminium, steel and beverage container plastics); there are other problematic waste streams that can have high impacts when illegally disposed (such as tyres, vehicles, batteries and electrical products).
Nolan-ITU (2001)18 estimated that kerbside recycling from the municipal waste stream delivered an environmental benefit of around $400 per tonne of recycled material, based on an average 170kg per household per year. This estimate included the (negative net) impacts associated with the kerbside collection system and the (positive net) impacts associated with the recycling system, compared against landfilling and greater recourse to goods manufactured from virgin materials. The relative impacts are shown in Figure 10.
Around 75 percent of environmental benefits (around $300/t) were estimated to come from reductions in air and water pollution arising from the avoided product manufacturing using virgin materials. The natural resource benefit of recycling represented some 21 percent of the benefits (or about $24/t and $60/t split between forest and mineral resource impacts respectively). Global warming or greenhouse gas benefits were estimated to be some 4 percent of benefits ($16/t of waste). Landfill savings were estimated to represent only 1.6 percent of benefits ($6.50/t net of recycling residuals to landfill) while traffic impacts were a net environmental cost to the system of around 2 percent ($8/t).
18 Nolan ITU and SKM (2001), Independent assessment of kerbside recycling in Australia, report to the National Packaging
Covenant Council
Figure 10: Environmental benefits of kerbside recycling $/t recyclate (Nolan-ITU 2001)
$0
$100
$200
$300 Traffic
Landfill
Greenhouse
Water emissions
Resources
Air emissions
Analysis of financial instruments for waste management in South Australia 25 October 2004
BDA Group and EconSearch 23
The ACT Government also commissioned a study19 into waste disposal costs when preparing its 2002 Waste strategy. The estimated downstream environmental costs associated with landfilling comprised greenhouse gases (estimated at $11.10 per tonne of organic waste or $6 / tonne mixed waste) and amenity impacts associated with dust, odour, noise, etc (estimated at $3.80 / tonne). The greenhouse estimate was based on a value of CO2 emissions of $5/t, while the amenity impact was based on the cost of buffer zones to avoid these impacts, and nominally costed at 5% of the economic costs of landfilling. Air and leachate management costs to prevent associated impacts were included as economic rather than environmental costs.
The ACT Government study also considered upstream impacts. They noted the Nolan-ITU life-cycle study, but instead chose to impute a ‘conservative’ value for lost resources, based on potential commodity revenues foregone by burying recyclable materials. The estimated resource value was $16.50 per tonne, significantly less than the resource value estimated by Nolan-ITU.
Studies of container recycling20,21 show that recycling of aluminium, glass and steel results in benefits that significantly outweigh costs. This may also be the case for newsprint and possibly other paper products, although the source of the wood fibre (native forests versus plantations) would need to be taken into account. While Australian studies suggest significant benefits of recycling PET, HDPE and PVC, this is based on assumptions that the material is all locally produced with closed loop recycling. Neither of these are necessarily the case and the assumptions need further debate.
For organics there is little evidence available to demonstrate that large-scale kerbside collection and composting of green or food wastes has a positive externalities reduction benefit which exceeds the costs of collection and processing, or indeed that the net benefits of central composting exceed those of landfilling with methane recovery.
Several studies have demonstrated the energy benefits of re-use of construction materials, however the results are less clear for recycling, especially concrete. Large quantities of waste B&D materials are generated and either reused or recycled in Australia. Apart from energy usage, little has been studied about the life cycle environmental impacts of the reuse or recycling of B&D materials. Nevertheless, it appears reasonable to assume that such re-use is likely to have beneficial outcomes unless the energy usage or emissions related to disassembly and transport are high. Life cycle studies suggest that there are also likely to be substantial energy benefits from the recycling of steel and aluminium products. There may also be environmental benefits from
19 Resources Policy and Management (2001), The actual cost of waste disposal in the ACT 20 Institute for Sustainable Futures, UTS (2001), Independent review of Container Deposit legislation in NSW. 21 Ecotec Research and Consulting Limited, ‘Beyond the bin, the economics of waste management options’, report to Friends of
the Earth, UK.
Analysis of financial instruments for waste management in South Australia 25 October 2004
BDA Group and EconSearch 24
recycling of timber – although the end-uses and possible contamination from timber treatment must be considered.
An analysis of environmental benefits across all waste streams has been conducted as part of a series of reports prepared for EcoRecycle Victoria. SKM (2003)22 developed a range of options to reduce landfill disposal volumes by 15% in Victoria. The options considered all municipal waste and solid waste from the C&D and C&I waste streams. The options were largely technology driven, but included greater adoption of cleaner production systems. Nolan ITU and RMIT (2003)23 then undertook a LCA of the material flows associated with each option, accounting for the broad range of upstream and downstream impacts. Once physical estimates of net changes in emissions, resource use, etc had been prepared, they were valued using the environmental damage costs developed in the Nolan ITU (2001) kerbside recycling study.
Based on those values, it was estimated that for each tonne of waste diverted from landfill, an environmental benefit of $182 was realised (or $106 under a low impact scenario), comprising;
• Air emission $80 (or $50 under the low impact scenario)
• Water emission $20 (or $10 under the low impact scenario)
• Resource conservation $50 (or $30 under the low impact scenario)
• Greenhouse gas $32 (or $16 under the low impact scenario)
Greenhouse gas reductions were valued separately from general air emissions and valued at $40/t CO2e emissions avoided.
As with most life-cycle assessments and non-market valuation exercises, the efficacy of assumptions and data used can be challenged. In particular, the original Nolan ITU methodology is believed to have led to a systematic overestimation of likely impact costs.
For example, the Nolan ITU valuation of air and water emission damage costs is based on work undertaken by the NSW EPA in developing its pollution fee regime. However the resulting per unit air and water emission damage costs estimated by Nolan ITU are orders-of-magnitude greater than the pollution fee levels adopted in NSW.
Further, the greenhouse gas environmental damage costs are based on a value of $40/t CO2e emissions avoided, which is significantly greater than values elsewhere in the literature. The most recent modelling analysis commissioned by the Commonwealth Government indicates an international carbon price (if global emissions trading developed in response to a ratified Kyoto Protocol) of between $7 – 13 per tonne CO2e. It was also estimated that if Australia did not
22 SKM (2003), An examination of the economic, environemntal and social costs and benefits of strategic waste management
options 23 Nolan ITU and RMIT (2003)Life cycle assessment of waste and resource recovery options
Analysis of financial instruments for waste management in South Australia 25 October 2004
BDA Group and EconSearch 25
participate in such an international scheme, the domestic carbon price would be similar24. These estimates provide a realistic shadow price for reducing greenhouse emissions, and represent about a quarter of that assumed in the LCA studies above.
Finally, the LCA estimates do not incorporate any disbenefits that may arise through an increase in illegal dumping of waste and associated environmental impacts. All financial incentive approaches to promote higher diversion rates impose higher financial costs on waste generators, and either increased dumping or enforcement costs could be expected.
On balance, available LCA valuations appear to have provided overly generous valuations of potential environmental benefits from landfill waste diversion.
24 Beck and Gray (2003), Designing and implementing a national emissions trading scheme, Australian Emissions Trading Forum,
Feb /March

Analysis of financial instruments for waste management in South Australia 25 October 2004
BDA Group and EconSearch 26
4 International experience with market instruments for waste management
In this section, the emergence and use of market instruments for waste management within the OECD broadly, and United States and European Union specifically, is canvassed.
4.1 OECD In most OECD countries, the key waste management consideration for government has historically been disposal. Government has primarily provided waste collection and disposal, with costs met through broader revenue collections. In addition, landfills often had poor environmental controls that resulted in a range of harmful impacts. The combination of budgetary pressures and harmful impacts at landfills led to a policy focus on reducing volumes disposed to landfill.
Reforms of landfill regulation, technology and management practices have significantly reduced harmful impacts associated with landfilling25. These improvements and cost-economies have also seen a dramatic reduction in the number of landfills, reducing local amenity impacts. By increasing the size of new landfills, the available capacity has in many instances increased despite the fall in landfill numbers26. This has allayed fears of a scarcity of landfill space in some instances which proponents had postulated to support the case for continued reductions in waste disposal volumes. Governments have also acted to improve budget positions through either the privatisation of major parts of the waste collection and disposal system or through the introduction of full cost pricing.
While these reforms have lessened the urgency of reigning back waste disposal volumes, communities have continued to express their desire for further improvements. Communities are embracing broader sustainability practices, and waste reduction is seen as a material way this can be done with opportunities for everyone to contribute. This has prompted governments to broaden the rationale behind waste policy goals to include upstream life-cycle impacts associated with waste materials. Most waste policy objectives now include goals such as conserving resources, reducing the environmental impacts arising from the use of virgin materials and reducing the toxicity of products.
However the policies adopted still generally focus on reducing the volume of waste disposed to landfills, rather than seeking to directly reduce environmental impacts during extraction, production and consumption. As shown in Section 3, the bulk of the social benefits from reduced waste disposal occur upstream of waste generation, principally as a large proportion by volume of the waste stream comprises inert or non harmful materials. Market instruments chosen to promote
25 De Tilly (2003), Waste generation and related policies: broad trends over the past ten years, in OECD (2004), Addressing the
economics of waste 26 Kinnaman and Fullerton (1999), The economics of residential solid waste management, National Bureau of Economic Research
Working Paper No W7326

Analysis of financial instruments for waste management in South Australia 25 October 2004
BDA Group and EconSearch 27
volumetric reductions in waste disposal volumes have included variable waste collection charges, landfill levies and landfill quota schemes.
Despite the ongoing focus on disposal volumes, across the OECD municipal waste generation is estimated to have increased by 10% between 1995 and 2000. The growth in landfilling of this waste has been kept to only 2% as recycling volumes have increased markedly27. There is however also a broad and growing trend towards the incineration of municipal waste with energy recovery and the composting of organic waste. Landfilling remains the dominant form of disposal in countries such as the US (68%) where available land is plentiful, while in more densely populated countries such as Japan, Denmark and the Netherlands, a majority of waste disposal is via incineration.
Figure 11: Municipal waste management in OECD countries
Landfilling 58%
Recycling 16%
Composting 6%
Incineration with energy
recovery 11%
Incineration 9%
As well as the drive to ratchet down overall disposal levels, there are increasing efforts to improve the management of specific wastes that lead to significant environmental impacts when disposed, particularly if illegally dumped outside of regulated disposal centres or as a nuisance via littering. Many of these problematic wastes are discrete products, such as batteries, tyres and electronic goods.
To promote better post-consumer management of these products, there has been widespread adoption of extended producer responsibility and product stewardship approaches. Under these approaches, a number of market instruments have been employed, including product taxes, advance disposal fees and deposit-refund schemes, as well as a vast array of subsidy programs and growing interest in recycling certificate approaches. Some examples of these instruments outside of those in the US and EU described in following sections include:
• In Japan there is a levy on disposal of recyclable materials. The levy is calculated using a scaling factor for the particular industry involved and a unit cost for the type of recyclable.
27 De Tilly (2003), Waste generation and related policies: broad trends over the past ten years, in OECD (2004), Addressing the
economics of waste

Analysis of financial instruments for waste management in South Australia 25 October 2004
BDA Group and EconSearch 28
• Canadian charges include an ADF for paint sold in British Columbia (50 cents per gallon), and a $4 charge for tyres in Alberta, a recycling levy on beverages sold in Manitoba (2 cents) and deposits on beverage containers in Quebec, Nova Scotia, Newfoundland and New Brunswick.
• Korea has deposit refund schemes for beverage containers, batteries, tyres, televisions, washing machines and lubricating oils.
• Taiwan has a deposit refund scheme for PET bottles.
• In New Zealand, as many as 25 percent of communities by 1997 employed volume-based charges for municipal solid waste collection (New Zealand Ministry for the Environment 199728).
Despite the increasing use of market instruments across the OECD, De Tilly29 argues that economic efficiency has taken second place to environmental effectiveness as the principle concern when framing waste policy. He argues that under pressure from public opinion, governments introduce expensive recovery policies not necessarily rational from an economic viewpoint. He cites studies indicating the poor viability of some schemes, even when environmental impacts are taken into account.
He goes on to argue that few studies have been undertaken of the real costs of alternative waste management policies, that account for the full benefits and costs across product life-cycles. Rather recycling is seen as ‘greener’ than landfilling or incineration and governments take it on faith that lowering disposal volumes is in the community’s interest. He argues that the arbitrary definition of a hierarchy of waste management methods and the arbitrary and uniform definition of recycling quotas (such as across the EU) is failed from the outset as it takes no account of the huge variation in physical, demographic, cultural and economic circumstances between countries and even regions.
The experience in the US and EU with market instruments in promoting either targeted recovery of specific wastes or broader volumetric reductions in waste disposal, is briefly described below.
4.2 United States The US solid waste industry has undergone significant change over the last two decades with a shift to fewer, larger landfills with greater environmental regulation and a significant reduction in landfill externalities. US programs have been characterised by ambitious waste reduction goals and supply side recycling support policies, such as kerbside recycling impositions & grants, leading to a glut of recycled materials. This has prompted demand side market development subsidies, such as
28 as cited in Stavins (2001), Experience with market based environmental policy instruments, RFF Discussion paper 01-58 29 ibid

Analysis of financial instruments for waste management in South Australia 25 October 2004
BDA Group and EconSearch 29
tax credits, low-interest loans, and government purchasing policies30. A number of market instruments have been employed, including landfill levies, variable pricing programs, deposit-refund schemes and subsidies.
Levies on waste delivered to landfills have been imposed in over 20 states31. The objectives behind the levies are varied, and include financing landfill closure and contingencies, to provide funds for waste management programs and to promote waste minimisation. In relation to the latter objective, the US EPA32 argues that it is unclear whether these landfill taxes have produced a significant incentive effect, and cites examples where levies have merely redirected wastes to alternative disposal options.
Landfill levies will only provide an incentive effect if waste disposal operators can pass on the fees to waste generators. This is generally not the case with domestic waste as variable pricing for household wastes is not widely used, although this is changing. The US experience with variable pricing programs for domestic waste is described in Box 2. The reported success of these instruments seems incongruous with empirical studies of the effect of variable pricing. Various US studies argue that demand for garbage collection services is inelastic For example, Kinnaman and Fullerton33 cite 11 US studies that all identified waste disposal volumes as being relatively unresponsive to variable pricing regimes. The paradox may lie in the role of other complementary policies, such as the provision of recycling bins, education programs, and the like that have accompanied the introduction of variable pricing regimes.
While the US EPA and many commentators34 offer qualified support for variable pricing programs, Kinnaman and Fullerton conclude that the extent to which these programs produce net benefits is unresolved in the economics literature. Interestingly, these authors in an earlier study35 where the actual weight and volume of household garbage was measured following the introduction of a ‘price-per-bag’ scheme, found a modest reduction in volume (elasticity of -0.23), yet a very small change in weight (elasticity of -0.076). As collectors and landfills compact anyway, the volume measure significantly overstates the response of householders and likely environmental gains to variable pricing schemes based on waste volumes.
30 Kinnaman and Fullerton (1999), The economics of residential solid waste management, National Bureau of Economic Research
Working Paper No W7326 31 Miller, Edgar M. National Recycling Coalition. Undated. Economic Policy Options to Achieve Sustainable Resource Utilization
and Environmental Quality Goals Relative to Resource Management and Waste Reduction. Report submitted to Economic Policy Cluster, Eco-Efficiency Task Force, President’s Council on Sustainable Development.
32 National Center for Environmental Economics (2001), The United States experience with economic incentives for protecting the environment, US EPA, Washington
33 Kinnaman and Fullerton (1999), The economics of residential solid waste management, NBER Working Paper 7326, Canbridge 34 For example, Stavins (2001), Experience with market based environmental policy instruments, RFF Discussion paper 01-58,
cites some 11 separate studies demonstrating that unit charges have successfully reduced household waste volumes 35 Fullerton and Kinnaman (1996), Household responses to pricing garbage by the bag, American Economic Review 86 (4)
September pp 971-984
Analysis of financial instruments for waste management in South Australia 25 October 2004
BDA Group and EconSearch 30
Box 2: The US experience with variable household waste pricing programs36
Communities throughout the United States have traditionally levied fixed collection fees for household waste, or they have included collection and disposal costs in property taxes.
However, a growing number of communities are now charging for solid waste collection based on the volume generated by the household. Such variable rate (or “pay-as-you-throw”) programs have been implemented in more than 4,100 communities in 42 states, reaching an estimated 10% of the U.S. population.
Variable rate programs can take several forms. Prepaid garbage bags or stickers that affix to bags can be required for collection, or collection fees can be based on the number of cans, the size of cans, or both of these characteristics. A small number of communities have weight-based systems. More common are mixed programs that combine a fixed rate....which in some programs entitles households to collect a pre-specified amount of waste....and incremental rates for amounts in excess of the maximum covered by the flat rate. Such mixed programs are growing in popularity, perhaps because they are relatively easy and inexpensive to implement, they provide a stable source of revenue for collection services, they have the potential to reduce illegal dumping, and they offer a pre-specified level of service at a fixed cost to many customers. However, according to one source, collection systems that require periodic billing of customers are likely to be more expensive to administer than bag or sticker systems. On the other hand, one disadvantage of using bags is that they can tear, especially if handled improperly or opened by animals.
Many communities with variable rates implement public education, curbside recycling, yard waste, white goods (e.g., refrigerators), and holiday greenery collection programs as well. Education has been found to be an important element in the success of variable rate programs. The collection frequency, fees, materials collected, and participation requirements for these programs, with the exception of public education, vary across communities. These complementary activities can have an important impact on the success of variable rate programs.
The variable rate systems described thus far base prices on waste volumes. Another, less common price basis is weight. Communities that have implemented weight-based pricing include Seattle, Milwaukee, Minneapolis, Durham, Columbia and Farmington. Such systems could have a stronger incentive effect by charging for every additional unit of weight and thereby eliminating the incentive given by volume-based systems to compact trash into containers. Seattle’s weight-based scheme lowered the weight of garbage collected by 15%. One disadvantage of weight-based systems is that they tend to be technologically much more complicated, requiring that collection trucks carry specialized equipment and increasing the time haulers take to collect waste.
In most areas where variable rate programs have been introduced, the amounts of waste collected have decreased significantly, a result of either increased recycling or decreased waste generation.
Despite the evidence cited, variable rate programs have some unresolved problems. Data on decreases in collection can be misleading if the programs result in significant illegal disposal of waste or the diversion of waste to cheaper disposal services.
36 Selected extracts from National Center for Environmental Economics (2001), The United States experience with economic
incentives for protecting the environment, pp 41-46, US EPA, Washington
Analysis of financial instruments for waste management in South Australia 25 October 2004
BDA Group and EconSearch 31
Other problems need to be addressed in designing and managing variable rate programs. They can be difficult to implement in multi-family housing such as apartments, and they can have a regressive effect on large families. In addition, variable rate programs can lead to significant decreases in revenue for municipal waste collectors because households reduce the amount of solid waste that they generate.
Variable rate programs may not be appropriate for all communities. Analysts37 assert that variable rate pricing is unlikely to be successful in communities having the following characteristics: (1) those with affordable and environmentally acceptable landfills; (2) those with few or no nearby recycling facilities; (3) those with open spaces located nearby, which makes that land vulnerable to illegal dumping; and (4) those with consumers who oppose paying variable rates.
Deposit-refund schemes are widespread in the US for beverage containers, but have also been used for lead batteries, tyres and pesticide containers and are now being expanded to include office products like photocopier machine toner cartridges.
Beverage containers have been subject to both voluntary and mandatory deposit schemes. In the past, the beverage industry made extensive use of voluntary schemes to recover refillable bottles. However, this practice nearly disappeared following the introduction of cheaper “disposable” containers. 10 states have passed “bottle bills” that mandate beverage container deposits ranging from 2.5¢ to 15¢ per container, the most common amount being 5¢ per container. In most states, deposit requirements apply to the full range of container types, including glass, plastic, aluminium, and steel.
The US EPA believe that beverage container deposit laws have significantly reduced litter in several states, resulted in higher recovery rates of used products and less contamination of recyclables than curbside recycling programs. A related phenomenon is the relatively high market share for refillable containers in states with deposit schemes. However, deposit schemes are also believed to cost more to administer than curbside programs. The US EPA concludes that lack of information makes it difficult to thoroughly evaluate beverage container deposit systems.
Lead-acid batteries are subject to mandatory deposit systems in 11 states and voluntary deposit systems in most other areas. Deposit amounts are typically $5 to $10 per battery. Consumers can obtain refunds by returning a used battery and proof of the deposit to the same retailer, typically within 7 to 30 days after the purchase of a new battery. The percentage of battery lead that has been recycled nationwide has exceeded 90% since 1988.
Other deposit-refund schemes include a $5 deposit on all types of replacement vehicle tyres in Rhode Island, while in the state of Maine, a deposit system for pesticide containers applies to all restricted-use pesticides - consisting mainly of conventional agricultural and forestry pesticides.
37 Hoerner, J. Andrew. 1998. Harnessing the Tax Code for Environmental Protection: A Survey of State Initiatives. World
Resources Institute.

Analysis of financial instruments for waste management in South Australia 25 October 2004
BDA Group and EconSearch 32
A one cent advance disposal fee (ADF) for containers was used in Florida between 1993 and 1995. The fee was performance based in that packaging materials that reached a recycling rate of 50% were exempt. Since then, ADFs have been used widely in the US for tyres and beverage containers. Advance recovery/disposal fees have been proposed for televisions and computers in Nebraska and South Carolina. ADFs have generally been successful in raising funds for the cleanup of illegal dumps and in assisting product specific recycling initiatives.
Various types of subsidies, including grants, loans, payments, and tax incentives, have been used extensively in the US for waste management. Most measures have been implemented at state and local levels, particularly grant and loan programs that promote the recycling industry. These range from grants to municipalities and counties to fund various recycling activities, payments to businesses based on the quantity of recycled material used or grants or soft loans for the installation of systems to process recyclate and various tax incentives for businesses that recycle used products.
4.3 The European Union In recent years there has been a reduction in the percentage of waste being disposed of, linked with an increase in recycling rates. However, landfill remains the prevailing option in many EU countries. The EU Landfill Directive (1999/31/EC) promotes the reduction of landfilled waste by making provisions that the quantity of biodegradable material to be landfilled should be reduced to 35 % of 1995 levels by 2016. Biodegradable waste counts for approximately two thirds of total municipal waste quantities. Only a few EU Member States have reached this target38.
Market based instruments employed for waste management in the EU include user charges for domestic waste collection, landfill levies, advance disposal fees, product charges, tax credits, deposit refund schemes, tradeable recycling certificate schemes and tradeable landfill quota schemes.
Disposal charges for wastes to landfill or incineration are common and are now typically weight-based taxes, sometimes differentiated by waste streams and disposal practices employed. However, charges levied directly on the externalities of landfilling or incineration is less common, with the French fees on emissions from incinerators a notable exception. In 2001, seventeen countries applied taxes on waste disposal and/or incineration39. Two prominent examples of landfill levies are;
• The UK introduced a landfill tax in 1996 based on estimated environmental costs. Although subsequent reviews have confirmed the veracity of the environmental cost estimates, the tax is
38 European Environment Agency (2002), Environmental signals 2002, Chapter 12 Waste and aterials flows 39 Professor Jacqueline McGlade, Executive Director, European Environment Agency (2004), European packaging waste trends
and the role of economic instruments, European Voice conference PACKAGING OUR FUTURES Brussels, 1-2 March

Analysis of financial instruments for waste management in South Australia 25 October 2004
BDA Group and EconSearch 33
being progressively increased to promote the viability of recycling to assist the UK meet the EU Landfill Directive Targets for municipal waste. The tax will rise from its current £13 per tonne to £35 per tonne. The tax is applied to all waste streams, although a lower rate applies to inert waste. There is also a landfill tax credit scheme that allows landfill operators to allocate up to 20% of their tax liability to approved environmental projects. A review of the performance of the tax indicates that while ‘active’ waste volumes landfilled have remained constant, volumes of inert waste (principally C&D) have fallen by 56% over 5 years40.
• In Denmark there has been a tax on landfill and incineration since 1987. The rates are £50 per tonne for landfill and £44 for incineration. The taxes are reported to have had a dramatic effect on building and construction waste disposal volumes. An evaluation of the Danish landfill tax by the European Environment Agency is provided in Box 3.
Box 3: Evaluation of the Danish Landfill Tax41 The Danish landfill tax, which served to double the cost of disposing solid non-hazardous waste to landfill, has been successful in reducing waste disposal volumes. Between 1987 and 1998, waste disposal to landfill is estimated to have fallen by 26%, mainly through increased recycling. This has been achieved by reductions across waste streams of 16% household, 64% construction waste and 22% mixed waste. Manufacturing waste has however increased by 8%.
Interviews with a number of large waste producers indicated that the key drivers for this change were a desire to reduce waste management costs, such as by receiving income for recyclate. Only a small minority indicated that the landfill tax had been a key factor in decision making. The waste tax was found to play a more significant role in the decision by municipal waste authorities to expand recycling capacity, especially for the heavier types of waste including garden and construction wastes.
Domestic waste collection charges are applied across most EU countries. Typically, households face a fixed fee (and so do not face an incentive to reduce waste) while commercial waste charges are generally volumetric. However, some municipalities such as Denmark, Germany and the Netherlands are moving to variable pricing or ‘pay as you throw’ domestic pricing systems linked to the volume or weight of waste collected42.
Eunomia Research & Consulting43 provide an overview of the performance of a number of European variable pricing programs, specifically;
• Belgian: pay-per-bag scheme
40 Davies and Dable (2004), The development and implementation of a landfill tax in the UK, in OECD (2004), Addressing the
economics of waste 41 European Environment Agency (2000), Environmental taxes: recent developments in tools for integration, Environmental Issues
Series No 18 42 ibid 43 Eunomia Research & Consulting (undated), Financing and Incentive Schemes for Municipal Waste Management Case Studies,
Report to Directorate General Environment, European Commission

Analysis of financial instruments for waste management in South Australia 25 October 2004
BDA Group and EconSearch 34
• Denmark: weight-based schemes
• Germany: weight- and volume-based schemes at apartment blocks
• Italy: tagged bag schemes
• Italy: pay-per-bag scheme
• Luxembourg: combined weight and volume based scheme
• Sweden: weight-based scheme
The pay-per-bag schemes were observed to drive both a reduction in waste generation as well as the diversion of more waste into recycling streams. However as in the US, it was thought that much of the reduction in waste generation was likely to arise from diversion to other disposal avenues, including illegal dumping. A number of hybrid schemes have also been used which combine a fixed quota and variable components or integrate weight and volume components.
Observations on the weight-based schemes are instructive. In relation to the Danish scheme, Eunomia noted;
• Recycling amounts are significantly higher in municipalities with weight-based waste collection, and more households with a weight-based scheme practise home composting (59%) than with a traditional scheme (21%).
• Weight-based collection requires that recycling schemes are operating successfully. Otherwise, illegal dumping or burning of waste may be significant.
• The collection scheme is heavy in administration and may therefore have higher costs compared to a traditional collection scheme.
• The weight-based fee system is easier to implement in areas with single-family houses than in areas with multi-storey houses. In Denmark there are no examples of weight-based schemes implemented in predominantly urban municipalities.
This latter problem was not observed in the Swedish case-study. Some 15 municipalities in Sweden are using a weight-based fee system, where a part of the collection fee is based on the amount of waste collected. For the municipality of Bjuv it was found that;
• the weight-based scheme was implemented for all households, including apartment blocks. The implementation in apartment blocks proved to be no more difficult than for detached housing areas. However, as Bjuv is a relatively small municipality, the implementation in a major urban settlement may lead to a different result.
• The weight-based collection fee, in combination with kerbside collection of recycling fractions, has led to dramatically increased recycling rates and a dramatic reduction in overall waste amounts.
Analysis of financial instruments for waste management in South Australia 25 October 2004
BDA Group and EconSearch 35
• The system has proved to be quite expensive at almost twice that of the previous collection system, and more expensive than either flat-rate systems, or systems based on container size / tagging / bag purchases since it needs weighing equipment and more administration. As the recycling rates increased far more than was expected, the collected fees do not now cover the costs for the municipality.
There has also been a clear trend in the EU towards ‘extended producer responsibility’, where industries are being held more accountable for post-consumer waste recovery. To this end, advance disposal fees collected via product taxes have become more common. They are typically applied to packaging and products that pose special risks in the waste stream, such as razors, batteries, plastic bags, vehicles and chemicals. Deposit refund schemes are also common, usually applied to waste streams that pose a significant littering problem.
In 2001, at least fifteen countries in the EU applied a tax or charge on packaging items, while thirteen countries had deposit-refund systems in place44. These tax approaches have reduced disposal rates, but the decrease is only modest45.
Examples of product taxes, ADFs and deposit-refund schemes employed in the EU for waste management are provided below.
Product taxes and advance disposal fees
• In Switzerland there is a fee on mobile phones of 16 cents to cover recycling and a recycling fee for televisions of US$20. There are also advance disposal fees on aluminium cans, PET bottles, glass bottles and batteries.
• In Sweden there are recycling fees on scrapped vehicles, batteries, tyres and packaging (plastic, paper and metal).
• In Germany and Austria there are advance disposal fees for refrigerators.
• In the Netherlands there is a levy on electric and electronic appliances and on new car sales to finance recycling.
• four EU member states (Belgium, Denmark, Italy, and Sweden) tax batteries.
• In Denmark there are recycling fees for tyres and Ni Cad batteries and product charges on packaging correlated to environmental impact based on life cycle assessments. Glass has an index of 1 and aluminium has the highest index of 18.
44 Professor Jacqueline McGlade, Executive Director, European Environment Agency (2004), op cit 45 European Environment Agency (2002), Environmental signals 2002, Chapter 12 Waste and aterials flows.

Analysis of financial instruments for waste management in South Australia 25 October 2004
BDA Group and EconSearch 36
• In Belgium there is an eco-tax on PVC to limit its use, and taxes on batteries, disposable cameras, packaging, industrial products and beverage containers. For beverage containers companies either pay the tax or achieve a specified recycling rate.
• In the Republic of Ireland shoppers are charged a UK15c levy on each plastic bag used. The use of plastic bags has fallen dramatically by more than 90% since the levy was introduced in March 2002.
Deposit refund schemes
• In Denmark, there are deposit refund schemes for beer and soft drink containers and aluminium cans.
• In Switzerland there are deposit refund schemes for small consumer batteries.
• In Sweden there are deposit refund schemes covering beer and soft drink containers, glass and PET bottles, aluminium cans and small consumer batteries.
• Germany has used a deposit refund scheme for detergent and paint containers.
• Austria has deposit refund schemes for fluorescent lights and tyres.
Tradeable rights approaches are receiving increasing attention, and have been widely used to control air and water emission, manage natural resources such as fisheries, forests and water and to promote the uptake of renewable energy. Their application to waste management to date has been limited to the UK, and include;
• The UK government introduced packaging regulations, obligating producers and users of packaging materials to meet minimum recycling targets. This resulted in an active market for trading packaging waste recovery notes (PRNs), although it was not originally envisaged as a trading scheme when the regulation was introduced.
• The UK government has recently announced the introduction of a trading scheme for landfill permits from 2005. The scheme is designed to reduce the amount of biodegradable municipal waste sent to landfill to 35% of 1995 levels by the year 2020 (in line with the EU Landfill Directive. Municipalities will have an incentive to reduce generation of biodegradable wastes to stay within the permit limits (see box 4).
An assessment of the performance of the PRN system, which works as part of a policy mix including legal requirements for municipalities and a landfill tax is provided by Professor McGlade, Executive Director, European Environment Agency. She notes that with the help of the PRN system, the recovery rate for packaging waste in the UK increased from 27% in 1997 to 48% in 2001. In addition, the direct costs of the system are relatively low. She sees the PRN system as an interesting and innovative approach, but argues its effectiveness needs further study before judging its potential for wider application alongside other EU or national initiatives.

Analysis of financial instruments for waste management in South Australia 25 October 2004
BDA Group and EconSearch 37
Box 4: UK Landfill Allowance Trading Scheme46
The Landfill Allowance Trading Scheme introduces significant changes in waste policy and practice for the diversion of biodegradable municipal waste from landfill. It is intended to provide a cost effective way of enabling England to meet its targets for reducing the landfilling of biodegradable municipal waste under Article 5(2) of the EC Landfill Directive.
The EC Landfill Directive requires the UK to reduce the amount of biodegradable municipal waste it sends to landfill, in order to prevent or reduce as far as possible the negative effects of landfilling waste on the environment and human health. Government consulted twice on how to meet this obligation and the option preferred by respondents was a tradable landfill permit scheme (now known as allowances. To that extent the Landfill Allowance Trading Scheme is a means to achieve the Directive targets rather than the instrument that imposes those targets.
The reduction targets set by the Landfill Directive are a reduction of the amount of biodegradable municipal waste going to landfill by 2006 to 75% of that produced in 1995, to 50% by 2009 and to 35% by 2016.
The Directive allows member states which landfilled over 80% of their municipal waste in 1995 to postpone the targets by up to four years. The Government intends to make use of this four year derogation and so the target years for the UK are 2010, 2013 and 2020.
Landfill Regulations came into force in July 2004 that divides the UK's Landfill Directive targets between the four constituent countries. The Waste and Emissions Trading Act (2003) provides the legal framework for the scheme and for the allocation of tradable landfill allowances to each waste disposal authority in England. These allowances will convey the right for a waste disposal authority to landfill a certain amount of biodegradable municipal waste in a specified scheme year. The scheme will be launched on 1 April 2005.
Each waste disposal authority will be able to determine how to use its allocation of allowances in the most effective way. It will be able to trade allowances with other authorities, save them for future years (bank) or use some of its future allowances in advance (borrow). This will allow individual waste disposal authorities to use their allowances in accordance with their investment strategy.
The advantage of a trading scheme is that it overcomes the fact that the diversion costs that each waste disposal authority faces will differ according to their particular circumstances. Waste disposal authority with low diversion costs will have an incentive to divert as much biodegradable municipal waste to landfill as possible, selling their surplus allowances to waste disposal authorities that face a higher cost of diversion. Trading will help local authorities find the most cost effective way of diverting from landfill to reflect their local circumstances.
46 Slightly edited extracts from: Department for Environment, Food and Rural Affairs, website Aug 2004
(www.defra.gov.uk/environment/waste)

Analysis of financial instruments for waste management in South Australia 25 October 2004
BDA Group and EconSearch 38
Government does not propose to restrict the price of allowances so there will be neither a price floor nor a price ceiling, although the Act does give the Secretary of State the power to control prices if it is deemed necessary.
The actual price of allowances will be determined by interaction of demand and supply for allowances. The demand and supply of allowances will be based on the cost to different waste disposal authorities of diverting waste from landfill. If the market operates efficiently, the price of allowances would be between the additional cost of diversion of selling and purchasing waste disposal authorities.
Subject to the restrictions governing the banking and borrowing of allowances, waste disposal authorities will be able to buy allowances and then bank them for use in later years. The borrowing of allowances is an important flexibility that will allow authorities to alter the shape of their reduction trajectory, by bringing forward allowances allocated to future years. 5% is felt to be an appropriate limit as this provides flexibility, whilst ensuring that reductions are made in the early years of the scheme. As the Government has agreed to a back-end loaded trajectory it does not wish to inhibit trading or further delay in investment in new facilities that might result from having a higher borrowing requirement.
Unlimited banking will be permitted within each interim target period. However, the Act prevents banked allowances being used in target years. Allowances banked before the first target year will have to be used by the end of the scheme year in 2009; then they will expire. The Act also prevents the banking of allowances across target years.
If the UK exceeds its target under the Landfill Directive, then the UK may be liable to fines from the European Court of Justice. To prevent this and provide equity across all waste disposal authorities, a strong penalty regime has been adopted. The penalty will be £200 per tonne of biodegradable municipal waste landfilled in excess of that permitted by allowances held. This is estimated to be around four times the current cost of landfill disposal.
More broadly, Professor McGlade notes that market instruments have been employed in the EU to get actors to comply with waste reduction and recycling targets, rather than to ‘internalise environmental costs’ per se (as evident from the experience with the UK landfill tax described above and objectives for the new Landfill Allowance Trading Scheme). If the targets are not met, she believes instruments should be strengthened, and the question of whether or not environmental costs are fully internalised is less relevant. Professor McGlade does however note that the question of whether or not the targets represent the optimum for society is still very relevant, although she is silent in offering an answer.
Analysis of financial instruments for waste management in South Australia 25 October 2004
BDA Group and EconSearch 39
5 Australian experience with financial instruments for waste management
A number of financial instruments have been applied to the waste sector in Australia. These include advance disposal fees, a deposit-refund scheme, performance bonds, user charges, and landfill levies.
5.1 Advance disposal fees There has been significant interest in greater use of advance disposal fees (ADFs) for products with high impacts when illegally disposed, and as indicated in the previous section, they have been used widely overseas for a range of products such as beverage containers, tyres, batteries and mobile phones. There has been limited experience to date in Australia, although nationally, an ‘advance disposal fee’ has been introduced to assist the management of waste oil, and the Commonwealth is investigating the potential for a tradeable certificates scheme for waste oil.
A form of advance disposal fees has been implemented in Australia within a broader Extended Producer Responsibility framework under the National Packaging Covenant. The covenant aims to minimise the environmental impacts of consumer packaging waste throughout the entire life cycle of the packaging product and develop economically viable and sustainable recycling collection systems. The covenant is supported by a National Environment Protection Measure requiring non-signatories to meet certain standards unless they can show they are achieving equivalent outcomes to those companies implementing the covenant. Participating companies provide an annual financial contribution towards funding a series of studies and programs to assist local government with kerbside recycling. Some $9m has been collected from signatories.
A recent review of the performance of the NPC indicated it had been effective from a ‘process’ perspective, engaging producers, promoting industry / government collaboration and providing a forum for canvassing reform options. However from an ‘outcomes’ perspective, success had been limited and variable47.
Of relevance to this study is that most ADFs have been used as fiscal revenue-raising instruments rather than as economic instruments which link fees paid with disposal or recycling volumes. In addition, the potential for the use of ADFs as economic instruments lies with clearly identifiable products that pose significant post-consumer disposal risks. Due to the significant importation and cross-border trade of products, national rather than state-based schemes are likely to be the most efficient.
For these reasons, further review of existing ADFs was judged a lower priority than for other instruments which we have accordingly focused our attention on. 47 Nolan ITU (2004), National Packaging Covenant Council: evaluation of the covenant.
Analysis of financial instruments for waste management in South Australia 25 October 2004
BDA Group and EconSearch 40
5.2 Deposit-refund schemes Deposit-refund systems have been widely used internationally for beverage containers as firstly these containers make up a large proportion of roadside litter, and secondly, to recover resources from the waste stream. South Australia has operated a deposit-refund scheme for beverage containers since 1975.
South Australia’s deposit refund scheme has been effective in recovering beverage containers for recycling. There is a high level of public participation with return rates for 1998 of 84% for aluminium cans, 84% for glass bottles and 74% for plastic bottles. These rates are high by international standards, with average container recovery rates in the US of around 75% for States with CDL compared to 25% for non-CDL States.
A review of South Australia’s container deposit legislation in 2000 found the total costs of the scheme to South Australia were $3.3 million per annum48. The review quantified benefits of $720,000 pa (replacement of virgin materials) and $150,000 in annual export income, leaving a net cost for the scheme of $2.43 million.
The major environmental benefits that were not quantified include:
• Substantial reduction of containers to the litter stream.
• Diversion of waste from landfill – CDL depots estimated to contribute 7% to a total domestic waste diversion rate of 17%.
• Pollution reduction – discharges from aluminium and PET production reduced in relevant communities in Australia through the use of recycled materials.
• Replacement of virgin materials - CDL estimated to replace 16,000 tonnes pa of sand, limestone and soda ash used for glass manufacture in SA (of a total of 40,000 tonnes pa replaced), contribute 3,000 tonnes pa of aluminium cans interstate for recycling and displace use of raw materials in PET production elsewhere in Australia.
The review concludes that given the SA community’s high acceptance of the deposit-refund system, the community is willing to pay the costs of the scheme to achieve litter reduction and improved environmental outcomes.
The report from the NSW Independent review of CDL49, reviews the literature on the impact of South Australia’s scheme on litter and argues that the results are inconclusive. Beverage containers are estimated to be less than 9% of the litter stream in South Australia, and potentially only around 3% in the metropolitan area.
48 Philip Hudson Consulting, Public Report on the Review of the Economic and Environmental Impacts of the Beverage Provisions
of the Environment Protection Act 1993 (Container Deposit Legislation) in South Australia, March 2000 49 Institute for Sustainable Futures, UTS (2001), Independent review of CDL in NSW, Vol 2

Analysis of financial instruments for waste management in South Australia 25 October 2004
BDA Group and EconSearch 41
5.3 Performance bonds for landfills Performance bonds are not widely used in Australia for landfill operations, but are for the rehabilitation of mine sites. In Victoria, financial assurances are used for landfills and premises handling certain industrial wastes since 1988. The Victorian EPA has found financial assurances an effective way to give community confidence that they will not need to meet the costs of site cleanup where the occupier of the premises fails to make and pay for the necessary measures. EPA has developed a system which is based on assessing potential costs for clean up, with provisions for discounting based on the quality of site engineering and management, providing site operators with an incentive to improve performance and risk management50.
Regulators have been reluctant to use bonds due to the upfront financial impost placed on landfill operators. However these imposts can be reduced with the use of bank guarantees or appropriate insurance products. The later are widely used overseas but are only just emerging in Australia.
Performance bonds would provide a strong incentive to minimize some environmental impacts associated with landfilling. It is likely that the associated costs would be incorporated into general gate fees and so would not differentiate between problematic wastes and hence not provide a targeted price signal up supply chains. While performance bond requirements could differ depending on the type of waste accepted at the landfill and / or the technology and management practices employed, they are likely to have a negligible impact on gate prices.
5.4 Variable user collection fees Most private operators collecting C&I and B&D waste already use variable pricing regimes. However the Industry Commission found that existing pricing practices for household waste disposal generally involved a set charge irrespective of the quantity or type of waste deposited. And as household waste disposal charges are commonly included in general rates, many householders do not even know that they are being charged for garbage disposal, let alone know the magnitude of the charge.
Variable rate charging systems for domestic waste collection are currently used by some councils in Australia. When considering the effectiveness of variable collection fees, it is important to keep in mind that they do not provide a certain outcome in terms of waste diverted from landfill. The outcome will depend on the fees rates, how significant the resulting waste disposal costs are to householders and the costs of alternatives. Also, where there is good uptake for kerbside collection of containers, paper and green waste already, user charges may not significantly promote further waste diversion.
50 Vic EPA (2003), response to Environment Australia commission report: Market Based Instruments for Waste
Management – Part 2 Report

Analysis of financial instruments for waste management in South Australia 25 October 2004
BDA Group and EconSearch 42
The NSW Government51 recently noted that a number of Councils in the Sydney area have had some success with variable pricing structures for their waste management services and more Councils could adopt these charging regimes for waste collection, by for example, reducing annual waste management fees where residents switched to smaller garbage bins (e.g., from 240-litre bins to 120-litre or 80-litre bins). They noted however that a major challenge to implementing variable pricing structures is the increasing numbers of multi unit dwellings in many Council areas’.
In 1999 Atech52 undertook an investigation and review of existing variable rate charging schemes to assist NSW councils and Regional Waste Boards in determining appropriate fee regimes for waste collection. Table 3 summarises the performance of Australian schemes where quantitative information was available.
They found user charges had been introduced for a range of reasons including:
• To reduce domestic waste going to landfill.
• To improve the equity of domestic waste charges.
• To provide financial signals in regard to the value of protecting the environment.
Atech state that user charges for domestic waste collection in Australia have been successful in the majority of cases, achieving waste reductions reportedly of up to 50% in some cases. Since the study was undertaken, a number of other councils have adopted variable pricing regimes, largely with the introduction of new recycling bin systems.
Wollongong Council is typical - residents can choose between three garbage bin sizes, 80, 120 or 240 litre. By choosing the 80 litre bin instead of the larger 240 litre bin, residents save $150 per year. The coarse marginal pricing signal and relatively small incentive belie the reduction in waste disposal volumes that has followed. As with experiences internationally, the provision of improved recycling services, education programs, and the like that have accompanied the introduction of variable pricing regimes are likely to have made a significant contribution.
51 NSW Department of Environment and Conservation (2004), Producing and consuming efficiently to conserve our resources 52 Atech, Variable rate charges for domestic waste collection, prepared for Hunter Waste Planning and Management Board on
behalf of the NSW regional waste boards, May 1999

Analysis of financial instruments for waste management in South Australia 25 October 2004
BDA Group and EconSearch 43
Table 3: Performance of Australian user charges for domestic waste disposal in 1999
Council Scheme description Effectiveness
North Sydney 4-bin scheme from 1993 Domestic waste collected fell 38% between 1991/92 to 1993/94.
Shellharbour Frequency based scheme from 1996
Waste diversion from landfill disposal to recycling increased by 15%. Over a two year period 45% reduction in waste going to landfill.
Camden 3-bin scheme from 1996/97
Recycling participating increased from 40% to virtually 100%. Recycling increased by 440%.
City of Sydney 5-bin system since 1994 Four-fold increased in quantity of recyclables.
Hawkesbury 2-bin scheme since 1997 Small reduction in waste and an increase in recyclables reported.
Manly Extra-bin scheme since 1995
Waste volumes reported to have dropped by 50%. Part of the drop is attributed to the introduction of a recycling service.
Warringah 2-bin scheme since 1997 Increase in waste and increase in recyclables. Differential in charges considered insufficient to provide and incentive for waste reduction.
Victoria 15 Victorian councils introduced variable rate pricing as part of a Kerbside Development Program.
Reduction in general waste from an annual average of 15kg/household/yr to 6-9kg /household/yr. For every additional 2kg of waste diverted to recycling there is an estimated 1kg decrease in total waste (avoided).
Source: Atech, Variable rate charges for domestic waste collection, Phase 1: Investigation and Review, Prepared for Hunter Waste Planning and Management Board on behalf of the NSW Regional Waste Boards, May 1999
As described earlier, community surveys show a high interest in recycling and high participation rates given an appropriate service is provided. As a result, a key determinant of volumes recycled per household is the type of kerbside service provided. Many jurisdictions have found that the diversion rate of kerbside recyclables generally improves as the available garbage bin capacity decreases and recycling system improves. The Victorian experience in this regard is described below drawing on investigations by Nolan ITU53.
During the early 1990’s a range of councils introduced crates or bins for recycling. This was accelerated in the late 1990’s with the introduction of funding assistance through the Kerbside Development Program by EcoRecycle Victoria. As a result, 74 of Victoria’s 78 councils now have a kerbside service for all or some of their residents. By 2000, Victoria’s municipalities operated 8
53 Nolan ITU (2000), Guide to Preferred Standards for Kerbside Recycling In Victoria, report to EcoRecycle Victoria
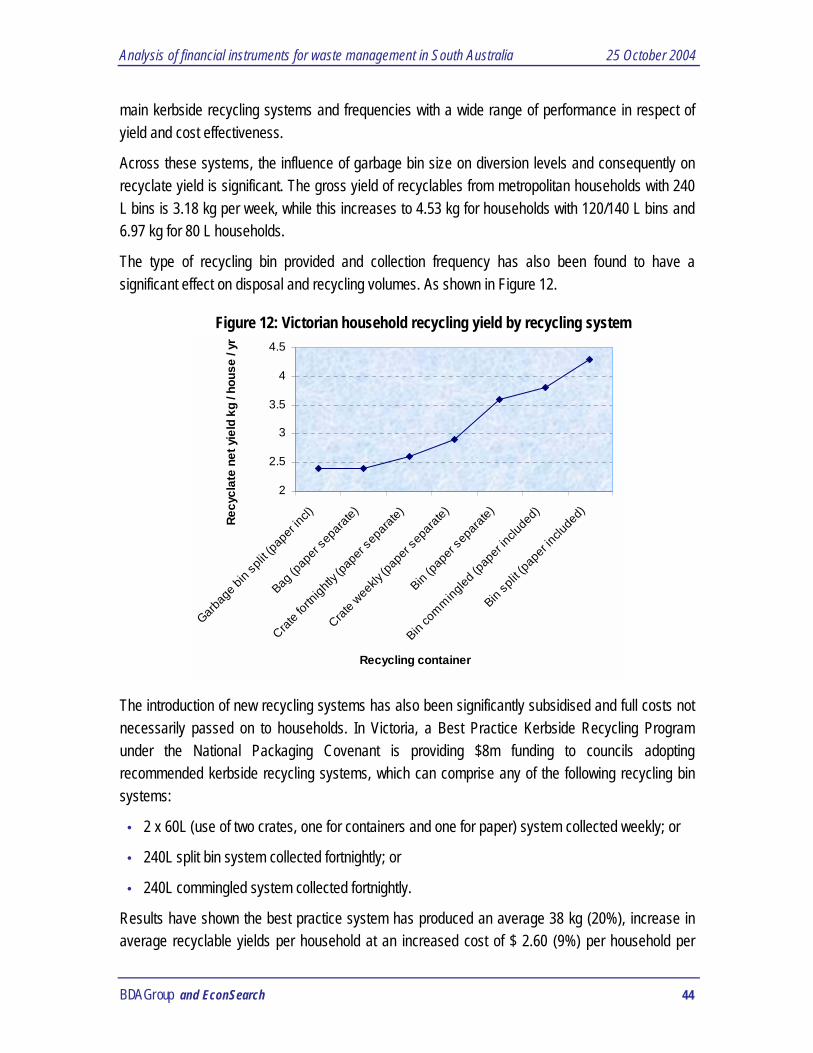
Analysis of financial instruments for waste management in South Australia 25 October 2004
BDA Group and EconSearch 44
main kerbside recycling systems and frequencies with a wide range of performance in respect of yield and cost effectiveness.
Across these systems, the influence of garbage bin size on diversion levels and consequently on recyclate yield is significant. The gross yield of recyclables from metropolitan households with 240 L bins is 3.18 kg per week, while this increases to 4.53 kg for households with 120/140 L bins and 6.97 kg for 80 L households.
The type of recycling bin provided and collection frequency has also been found to have a significant effect on disposal and recycling volumes. As shown in Figure 12.
Figure 12: Victorian household recycling yield by recycling system
2
2.5
3
3.5
4
4.5
Garbag
e bin
split
(pape
r incl)
Bag (p
aper
sepa
rate)
Crate f
ortnig
htly (
pape
r sep
arate)
Crate w
eekly
(pap
er se
parat
e)
Bin (pa
per s
epara
te)
Bin co
mmingled
(pap
er inc
luded
)
Bin sp
lit (pa
per in
clude
d)
Recycling container
Recy
clat
e ne
t yie
ld k
g / h
ouse
/ yr
The introduction of new recycling systems has also been significantly subsidised and full costs not necessarily passed on to households. In Victoria, a Best Practice Kerbside Recycling Program under the National Packaging Covenant is providing $8m funding to councils adopting recommended kerbside recycling systems, which can comprise any of the following recycling bin systems:
• 2 x 60L (use of two crates, one for containers and one for paper) system collected weekly; or
• 240L split bin system collected fortnightly; or
• 240L commingled system collected fortnightly.
Results have shown the best practice system has produced an average 38 kg (20%), increase in average recyclable yields per household at an increased cost of $ 2.60 (9%) per household per
Analysis of financial instruments for waste management in South Australia 25 October 2004
BDA Group and EconSearch 45
year. The increase in collected kerbside materials from the 10 implementing councils is estimated to be 15,000 tonne pa54.
In South Australia, five councils have introduced variable charges for green waste collection. In Councils where a fully user pays system has been introduced (i.e. the householder pays for the bin plus an annual fee for collection and processing) the participation rates have been very low (less than 10%). In other councils with a part user pay system, such as Gawler and Salisbury where the householder pays for the bin and the council pays for collection and processing, the uptake rates have been much higher (26-40%). The higher participation rates are advantageous because they reduce the cost of collection. However, having a user pays component means that those who do participate generally understand and use the system appropriately which provides for very clean green waste (low contamination) compared to councils that provide a green waste collection without any form of direct user charge.
A final consideration in relation to variable pricing regimes is that most councils report that the incidence of illegal disposal increased significantly when variable rate charges were introduced. Councils have used both enforcement and education programs to manage this. The Industry Commission has noted that cheating was said to be a concern with weight-based charging (eg residents dumping their waste in neighbours’ bins), as was the incidence of illegal dumping.
They also noted that variable charging generally involved greater administrative costs in recording and billing separately from general rates accounts. The administrative costs alone of implementing some US user pays charging programs are thought to have exceeded the benefits55.
5.5 Landfill levies All mainland States except Queensland have introduced landfill levies. Most use flat fee landfill levies, although Western Australia has a higher rate for general waste than inert waste. In Victoria, there are different rates for municipal, industrial and prescribed industrial waste. A range of exemptions and rebates provides a coarse differentiation in some other States. Levy rates by State are shown in Table 4.
Landfill levies in Western Australia are only collected in the Metropolitan area of Perth, while New South Wales, Victoria and South Australia collect a levy, applied at a lower rate, in selected regional areas. In Western Australia, New South Wales and South Australia waste originating in the metropolitan areas but disposed to landfill in regional areas attracts a levy at the metropolitan rate.
54 National Packaging Covenant Victorian Jurisdictional Recycling Group (2002), Best Practice Kerbside Recycling Program
Review 55 see for example, Fullerton and Kinnaman 1996

Analysis of financial instruments for waste management in South Australia 25 October 2004
BDA Group and EconSearch 46
Most States impose levies at the landfill gate. The levies are paid as part of landfill charges by the council or waste management contractor and are recovered from waste generators through rates and waste management charges.
States use part of the levy funds collected for waste reduction projects. In Victoria the levy funds EcoRecycle Victoria while in Western Australia levy revenue is hypothecated to a Waste Management Fund. In NSW, 55% of the funds are hypothecated to waste management programs, including the administrative costs of Resource NSW.
Table 4: Landfill levies by State as at July 2003 ($/tonne)
State Metropolitan Rural / Provincial
Municipal Other waste Municipal Other waste
NSW 19.80 19.80 11.40 11.40
Victoria 5 7 (industrial)
3 5 (industrial)
Queensland 0 0 0 0
Western Australia 3 1 (inert)
0 0
South Australia 10.10 10.10 5.05 5.05
Tasmania 0 0 0 0 Notes: NSW - levy rates in both metropolitan and extended areas will rise to $25/tonne by 2012. Victoria – levy rates vary by type of waste and location. By 2007 the levy will range
between $7 for regional municipal waste and $15 per tonne for metropolitan industrial wastes.
SA – levies increased from $5 per tonne for waste in the Adelaide metropolitan area and $2 per tonne in non-metropolitan areas from 1 July 2003.
Although the stated purpose of most landfill levies is to internalise the environmental impacts of waste disposal into disposal prices, levies on wastes have generally not been differentiated to account for their environmental impacts in either landfilling or associated with upstream production and consumption activities. Also, as the incidence of the levies is on parties disposing waste to landfill, they provide no incentive for landfill facility operators to improve management practices and hence reduce environmental impacts below regulated levels.
Despite most states introducing or increasing levy rates in the 1990s and the volume of recycled material increasing significantly, the volume of wastes disposed to landfill per capita has continued to rise. Figure 13 shows per capita waste disposal by State.

Analysis of financial instruments for waste management in South Australia 25 October 2004
BDA Group and EconSearch 47
It is difficult to assess how effective landfill levies in Australia have been given the range of other factors influencing waste disposal volumes to landfill. Available research indicates that the price responsiveness of waste disposal is very low, suggesting the modest success in waste diversion may be attributable to other factors. For many recycled materials, requirements for source separation and the availability of subsidised collection and processing may have had a greater impact than landfill levies. In addition, governments have pursued a range of education and industry specific waste reduction programs, often with legislative backing.
Figure 13: Solid waste disposal rates (t/person per year)
Source: Commonwealth of Australia (2001), State of the Environment Report The definition of solid waste disposal for Victoria changed between 1996-97 and 1997-98 and this accounts for the apparent increase.
Recycling subsidies have been provided in most States, particularly to support kerbside recycling. The level of expenditure for kerbside collection of recyclables across Australia financed through local rates was estimated by Nolan ITU in 2000 at $275 million per annum. Taking into account revenues from recycled materials, these collections operated at a net cost (estimated at around $125 million), underlining the necessity of government subsidies. Most States also provide grants for cleaner production and recyclate market development.
Material diverted in response to landfill fees will be those for which the cost of alternative management is lowest – this raises the problem of illegal dumping. By its nature, data on illegally disposed volumes is scant and it is therefore difficult to determine whether increased gate fees with the levies have led to increased dumping. It is notable however that some jurisdictions have

Analysis of financial instruments for waste management in South Australia 25 October 2004
BDA Group and EconSearch 48
significantly increased their policing of illegal dumping in association with the introduction of higher fees.
The nature and performance of landfill levies introduced in NSW, Victoria, and Western Australia are briefly reviewed below. The experience in the ACT where levies for environmental damages are incorporated directly in gate fees is also described. The South Australian experience with its landfill levy – the Waste Depot Levy – is examined in Section 6.
New South Wales
Waste disposal in the Sydney metropolitan region has been subject to a levy payable by waste facility operators since 1971. The NSW Environmental Protection Agency administers the levy which was increased in 1997 from $7.20 to $17 per tonne in the metropolitan region (ie; within 75km of the CBD) and $10 per tonne in an extended area lying between 75 to 200 km from Sydney. In 2001, the NSW Government introduced new waste legislation which created a new State government body, Resource NSW, which combined some of the waste management functions of the Environment Protection Agency and Waste Boards.
The NSW Government also committed at this time to raising the levies until they both reach $25 per tonne. Importantly, all classes of solid waste pay the same amount under the NSW levy. However a complex system of rebates and exemptions provides a coarse differentiation, by for example providing exemptions for clean fill used as landfill cover.
It is interesting to note that the policy goal behind the NSW waste levy appears to have changed in recent times. The levy was originally introduced to internalise the environmental impacts associated with disposal of waste to landfill56. However in a Statutory Review of the State’s waste legislation in 2001, the NSW EPA indicated that the levy no longer had a direct environmental purpose, rather it was directed at promoting the diversion of waste from disposal to other uses, and to generate funds for waste management programs57. The indirect rationale appears to be to promote upstream resource conservation. However the factors used in determining the levy rate do not address the nature, extent or price responsiveness of potential upstream benefits, rather they are revenue focussed and directed at industry support.58
Indeed the levy rate increase has been directly based on the estimated cost difference to reprocess rather than dispose of common waste types59. A $25/tonne levy in both the Sydney metropolitan area and the extended regulatory area is to be reached over phase-in periods of 2002-09 and
56 NSW EPA (1996), Proposed Waste Minimisation and Management Regulation1996, Regulatory Impact Statement 57 NSW EPA (2001), Review of the Waste Minimisation and Management Act (1995), page 10 58 ibid 59 ibid; which in turn was dirived from analysis by Wright (2000), Alternative Waste Management Technologies and Practices
Inquiry.
Analysis of financial instruments for waste management in South Australia 25 October 2004
BDA Group and EconSearch 49
2002-12 respectively, starting 1 July 2002. This will involve annual steps of $1 per tonne for the Sydney metropolitan area and $1.50 per tonne for the extended regulated area, as well as CPI adjustments.
Another subtle shift in policy philosophy is also apparent with the levy rate in the extended area being increased to align with the Metropolitan rate by 2013. When originally introduced in 1996, the levy rate was based on estimated environmental and social costs, with the extended area rates set less than the metropolitan rate to reflect the lower estimated environmental costs60. However in the review of the relevant Act and recommendations for an increase in the levy rate, the EPA sought to argue that ‘the Government set a lower rate for the waste levy in the extended regulated area in 1996 as a phase-in mechanism to apply to council areas that were previously not subject to the levy’. By breaking the link with any perceived differentials reflecting higher environmental externalities in the Sydney metropolitan area, the government can also direct levies in the extended area towards revenue generation and assistance to recycling industries.
Waste volumes disposed in NSW have continued to rise despite volumes recycled increasing significantly (see Figure 14). Available data shows that the rate of recycling of construction waste has grown from 300,000 tonnes in 1996 to 1.2 million tonnes in 1999, while kerbside recycling of household waste in the Sydney Metropolitan Area has grown threefold from about 99,000 tonnes in 1991 to 320,000 tonnes in 200161.
Turning to the performance of levies, it is clear that the revenue objective is being met, with the levy currently raising around $75 million per annum. The levy is also meeting the objective of promoting recycling industries. Firstly, the effect of the levy serves to promote the viability of recycling alternatives to disposal, and as shown below, this appears to have had a significant impact on some waste streams. Secondly, 55% of levy revenues are hypothecated to finance Resources NSW and its programs, with the remainder retained as general government revenue. The programs managed by Resources NSW have supported a range of activities and infrastructure development across all waste streams, and there is evidence on a program by program basis of increased recycling successes.
Overall however, the NSW Government has been unable to find suitable recycling investments to meet the significant revenues generated by the levy, with some $40m allocated to these initiatives recently redirected to consolidated revenue62.
In terms of the objective of reducing the overall volume of waste disposed, the NSW EPA argues that this is being achieved through the levy improving the viability of recycling materials, primarily
60 NSW EPA (1996), Proposed Waste Minimisation and Management Regulation1996, Regulatory Impact Statement 61 NSW Department of Environment and Conservation (2004), Producing and consuming efficiently to conserve our resources 62 Australian Financial Review (2003), Greens see red over waste levy diversion, 11 July
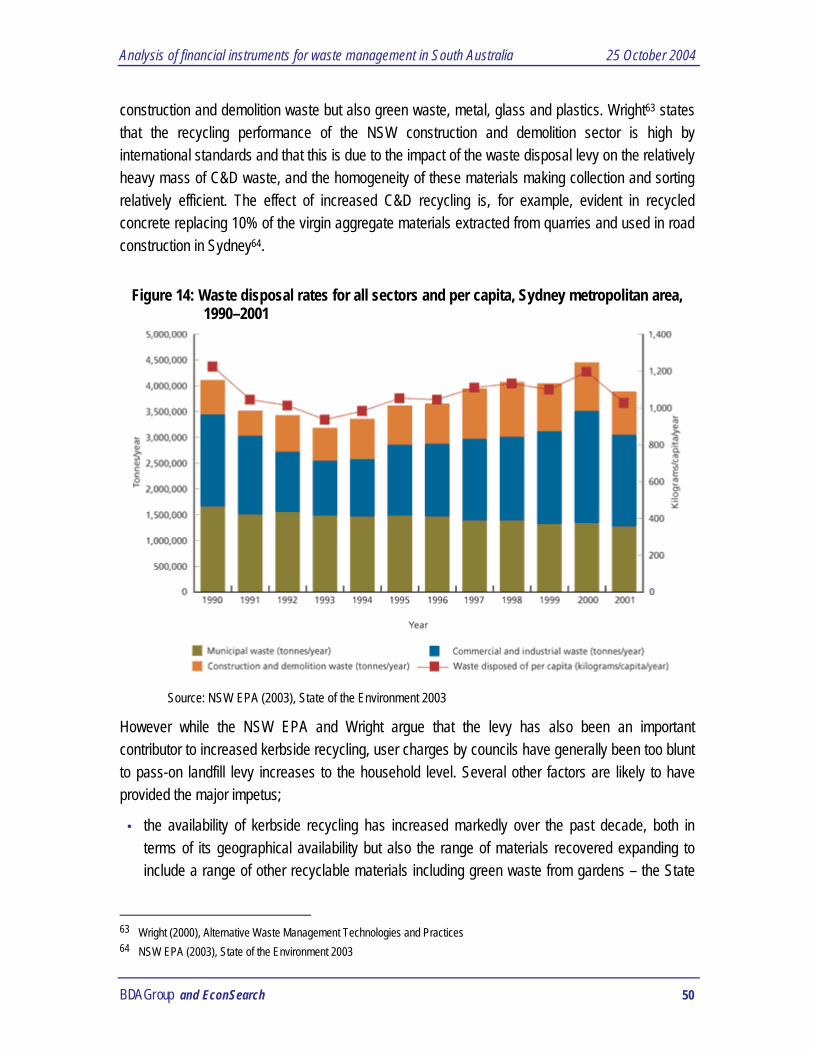
Analysis of financial instruments for waste management in South Australia 25 October 2004
BDA Group and EconSearch 50
construction and demolition waste but also green waste, metal, glass and plastics. Wright63 states that the recycling performance of the NSW construction and demolition sector is high by international standards and that this is due to the impact of the waste disposal levy on the relatively heavy mass of C&D waste, and the homogeneity of these materials making collection and sorting relatively efficient. The effect of increased C&D recycling is, for example, evident in recycled concrete replacing 10% of the virgin aggregate materials extracted from quarries and used in road construction in Sydney64.
Figure 14: Waste disposal rates for all sectors and per capita, Sydney metropolitan area, 1990–2001
Source: NSW EPA (2003), State of the Environment 2003
However while the NSW EPA and Wright argue that the levy has also been an important contributor to increased kerbside recycling, user charges by councils have generally been too blunt to pass-on landfill levy increases to the household level. Several other factors are likely to have provided the major impetus;
• the availability of kerbside recycling has increased markedly over the past decade, both in terms of its geographical availability but also the range of materials recovered expanding to include a range of other recyclable materials including green waste from gardens – the State
63 Wright (2000), Alternative Waste Management Technologies and Practices 64 NSW EPA (2003), State of the Environment 2003

Analysis of financial instruments for waste management in South Australia 25 October 2004
BDA Group and EconSearch 51
Government’s proposed ban on green waste to landfill, while not eventuating, is likely to have significantly encouraged councils to provide green waste collections;
• source separation has virtually been compelled through 2 bin systems where the size of the general waste bin has been significantly reduced;
• education programs;
• substantial subsidies to support collections and recycling activities – councils have generally subsidised kerbside collections, material sorting and recycling, as well as significant subsidies to support these activities from the State Government as well as funding from industry provided through other initiatives such as the National Packaging Covenant; and
• measures such as longer term contracts and Government-funded initiatives to develop markets and improve collection systems have helped overcome the price instability of some recovered kerbside materials between 1995 and 1998.
Rebates and exemptions from the levies have also been used to provide an incentive for reuse and recycling. However this has made administration and enforcement complex, with some diverted material being used for purposes akin to disposal. In addition, rebates for reuse / recycling have been provided for materials separated at landfills irrespective of whether the materials are ever used. Anecdotal evidence suggests some instances of stockpiling of materials that could be construed as above ground landfilling.
Victoria
A levy is charged for all solid waste disposed to licensed landfills in Victoria. The current levy was introduced in 1992 under the Environment Protection Act 1970
The levy that was in place from the 1992/93 to 1996/97 financial years was established at two levels. $2 was charged for every tonne of waste disposed of at landfill by, or on behalf of, a municipality and $3 was charged for every tonne of other waste disposed of at landfill. The levy was gathered at landfills within major metropolitan and provincial areas.
Revisions to the Environment Protection Act in late 1996 removed the difference between "municipal" and "other" waste. For the 1997/98 financial year the levy was charged at the flat rate of $3 per tonne of solid waste disposed of at landfills in metropolitan Melbourne, the Mornington Peninsula, Geelong, Ballarat and Bendigo - 80% of Victoria's population live in these areas. A flat rate of $2 per tonne of solid waste was applied at landfills located in other non-metropolitan areas. The levy increased by $1 per tonne in 1998/99 across Victoria.
In 2002, regulatory amendments introduced a progressive increase to the levy over five years and provided different rates for municipal and industrial waste. At July 2002, the levy was set at $4 per tonne for municipal and $5 per tonne for industrial waste disposed within major metropolitan and

Analysis of financial instruments for waste management in South Australia 25 October 2004
BDA Group and EconSearch
provincial areas. In rural areas the levy was $2 and $3 respectively per tonne of municipal and industrial waste.
From July 2003, landfill levies increased by $1 per tonne of municipal waste, and by $2 per tonne of industrial waste. By July 2007, levies within metropolitan areas for municipal and industrial waste disposed will rise to $9 and $15 per tonne respectively. In rural areas, the levy will be $7 per tonne and $13 per tonne for municipal and industrial waste respectively.
Landfill levy revenues are used exclusively for environment protection activities by Regional Waste Management Groups, EcoRecycle Victoria and the Environment Protection Authority Victoria. A proportion of the levy is also allocated to a sustainability fund, which is administered by an independent panel, the Minister for Environment and the Treasurer.
Waste generation in Victoria has increased in recent years, generally in line with economic activity. Since 1997-98, waste generation has increased 17% to 8.7 million tonnes in 2001-02. Over the past decade Victoria has successfully increased recycling, with the overall recovery rate increasing to 47% in 2001-02 from a rate of only 26% in 1993. This rapid growth in recycling has helped stabilise quantities of landfilled waste to below 4.6 million tonnes per year65.
Victoria’s performance in recycling and landfilling of solid industrial waste (SIW) and Municipal solid waste (MSW) is illustrated in figure 15 from EcoRecycle Victoria:
Waste generation per capihas served to constrain gro
65 From www.EcoRecycle.vic.
Figure 15
52
ta has continued to rise, however similar to NSW, increased recycling wth in disposal volumes.
gov.au

Analysis of financial instruments for waste management in South Australia 25 October 2004
BDA Group and EconSearch 53
The Victorian EPA66 confirm that increasing disposal fees does not by itself drive rapid or substantial reduction in volumes of waste generated. Rather, efforts to reduce waste volumes disposed to landfill are generally most effective when directed at waste generators rather than landfill operators. The EPA notes that the links between disposal costs (eg landfill fees) and the behaviour of waste generators are often weak: disposal costs often lack transparency (eg are an ‘overhead’ such as a fixed fee in municipal rates) and landfill operators have little if any influence over the activities that generate waste.
Indeed despite ongoing references by the Victorian Government to the levy being based on the polluter-pays principle67, the rationale for increasing the levy has, like NSW, been based on revenue objectives and perceived opportunities for increased recycling. For example, the imposition of a higher rate on industrial waste is not supported with evidence that industrial waste represents a higher environmental risk (and most B&D waste clearly does not), rather recycling opportunities are greater and more price sensitive – and so the higher rate will drive objectives for volumetric reductions in disposal volumes if not improved environmental outcomes per se. The lower rate for rural wastes reflects the opposite position.
Clarification of the State’s objectives underpinning the levy was recently sought during the National Competition Policy Review of the levy68. A recommendation from that review was that ‘The objectives of the landfill levy to reduce waste and provide funds for waste management and reduction processes should be made clearer in the Act. The economic justification for the metro/rural difference in fees, if any, should be made clear. The Victorian Government response to this was;
‘the landfill levy was introduced to raise funds for programs to divert wastes from landfill and develop suitable waste management systems as well as stimulating further efforts in waste reduction by sending a signal to invest in alternatives to landfill disposal.. A review of landfill levies under the Act demonstrated that levies needed to be increased to provide sufficient funding to agencies undertaking waste management programs. Subsequently, levies are being increased over a five year period following amendments to the Act in 2002. The changes also include a further differential in levies for industrial waste in recognition of the need for further stimulation to reduce industrial wastes. Metropolitan and rural rates vary because of the lack of alternative options available or viable in rural areas.
66 Vic EPA (2003), response to Environment Australia commission report: Market Based Instruments for Waste Management –
Part 2 Report 67 For example, the Vic EPA on their website state: The landfill levy structure reflects the difference in the magnitude of
environmental risk posed by the different waste streams, and also seeks to accommodate regional differentials. 68 Victorian Government’s response to the recommendations contained in the National Competition Policy (NCP) review of the
Environment Protection Act 1970
Analysis of financial instruments for waste management in South Australia 25 October 2004
BDA Group and EconSearch 54
In terms of these objectives, the landfill levy has been successful in generating revenue to help fund the State’s waste programs, it has improved the relative economic viability of recycling, and the higher rate on industrial waste is contributing to increased diversion of this waste from landfill. The signal to invest in alternatives to the disposal of municipal waste to landfill is however weak, for the reasons outlined by the Vic EPA above.
Western Australia
In 1998 the Government of Western Australia introduced a levy on waste disposed to landfill, in part to discourage the disposal of waste but primarily to create a pool of funds to support a rebate scheme and grants program69. The levy was set at $3 per tonne for any waste disposed to putrescible landfill, and $1 per tonne for inert waste accepted at inert landfills.
The landfill levy was not implemented in country areas because few landfill sites outside the metropolitan area were manned, and for fear that it would encourage an increase in illegal dumping. However, country landfills which receive metropolitan waste are obliged to pay the levy, and the levy is collected from one landfill site near Bunbury, which receives wastes from Perth.
The levy revenue is hypothecated to a Waste Management and Recycling Trust Fund, which is directed to assisting local government, industry and the community to reduce waste and recycle, and to reduce the impact of waste on the environment. The Fund receives approximately $5 million per year which is allocated to three areas;
• Approximately 50% is allocated to a rebate scheme to support local government recycling and resource recovery efforts.
• About 35% has been awarded as grants to individuals, companies or organisations to support projects directed at minimising waste.
• The remaining 15% is used to administer the collection of the landfill levy, the operation of the grant and rebate scheme, and the operations of the Waste Management Board.
The Waste Management Board (WMB), formed in 2002 to advise the Minister for the Environment on waste management issues, took over the role of managing the Waste Management and Recycling Fund and has overseen a review of the Grants program, levy and rebate scheme as input to a Statutory Review to be undertaken by the Minister for the Environment70. Pertinent conclusions by the WMB include:
• Waste disposal data shows that the implementation of the landfill levy and the operation of the rebate schemes and grant program have had little impact on reducing quantities of waste disposed to landfill.
69 Waste Management Board (2003) note that the size of the levy was originally based on a funding level target rather than an
evaluation of the impact it would have on actual waste disposal. 70 Waste Management Board (2003), WA Waste Management and Recycling Fund: Recommendations for the Statutory Review of
the Fund
Analysis of financial instruments for waste management in South Australia 25 October 2004
BDA Group and EconSearch 55
o Waste to putrescible landfill, which generally reflects household consumption, has remained largely static on a per capita basis. Waste disposed to inert landfill, generated by business and construction, has generally followed the economic cycle.
• The level of the landfill levy is currently too low (as a proportion of landfill disposal charges and total waste management costs) to provide either an economic incentive for waste diversion, or sufficient resources to drive a strategic policy direction.
• Levy and rebate systems can be effective when they act as a pump-priming mechanism to assist in creating a market for recycled products. The levy will improve the economics of recycling, encouraging more businesses to increase their capacity to recycle, reduce the cost of recycled products and grow the market for these products.
o In theory, as the levy reduces the market becomes viable and self-perpetuating. The achievement of systemic change depends on the particular characteristics of the market. In Perth, the market for recycled materials is small; there is ready access to most raw materials and relatively cheap landfill options. This makes it difficult to sustain a systemic change in the recycled product market.
The WMB noted the dual objectives of the levy were to encourage reductions in waste disposal and to provide revenue for waste programs – and concluded the latter was the primary objective. Accordingly they recommended that in order to fund the recently released Strategic Direction for Waste Management in Western Australia, the levy should increase to $6/tonne for putrescible waste and $3/cubic metre for inert waste.
However they also recommended that the rate of the levy be increased from time to time to pick up materials that are costlier to recycle, in line with the objective of ‘towards zero waste’. This appears to evolve from advice offered in consultancies commissioned by the WMB which noted that the levy, as a mechanism for changing behaviour, was a simplistic instrument. That is, a flat fee based on tonnage will provide greater incentive to recycle the least expensive and most marketable materials and therefore encourages the recycling of the cheapest materials to recycle or re-use and is unlikely to have any impact on more difficult wastes. The consultants had therefore recommended that the levy be raised in steps over time to encourage the ‘next class’ of waste products into recycling at each new levy level.
The adoption of levy regimes based on recycling costs (as is also the rationale in NSW, VIC and the ACT) shifts the policy rationale away from an environmental polluter-pays objective to one of industry development without any clear public benefit criteria. We note that the WMB
Analysis of financial instruments for waste management in South Australia 25 October 2004
BDA Group and EconSearch 56
recommendation was generally rejected in public consultation, in part because it ‘lacked clear intent’71.
Another key conclusion of the WMB pertinent to South Australia was that the landfill levy had already caused a rise in illegal dumping. They argued that the temptation for illegal dumping is very price sensitive, especially for small operators and given the large areas of bush, national park and forest surrounding Perth.
Australian Capital Territory
Since the introduction of landfill charges in the ACT in 1993, the volume of waste materials diverted away from landfill and either reused or recycled has significantly increased to around 60% (see Figure 16). However, the ACT Commissioner for the Environment (1999) concluded that further reductions in waste volumes to landfill would not be possible without price increases. A Waste Pricing Strategy consistent with the objectives of the government’s No Waste by 2010 Waste Management Strategy was subsequently developed.
As the ACT government undertakes the roles equivalent to State and local government in other jurisdictions, separation of a landfill levy from government operated landfill gate charges was not required. Accordingly, the ACT Government has focused on developing gate charges that are reflective of both operational costs and broader Territory objectives such as the incorporation of environmental damage costs.
The general charge for industrial, commercial and other garbage in the ACT in 2000 was $33 per tonne (including GST). In 2002 the ACT government estimated that to achieve full cost recovery of disposal, waste would need to be charged at $110 per tonne, comprising $34 per tonne for environmental costs and $76 per tonne for direct economic costs. To allow the community to become familiar with alternatives to landfill disposal, it was recommended that increased charges should be introduced during 2002 and then be gradually increased in line with progress made to reduce waste72.
71 WSB (2004), WA Waste Management and Recycling Fund: recommendations for the statutory review of the fund. Report on the
outcomes of the public consultation. 72 ACT Government (2002), Waste pricing strategy for the ACT

Analysis of financial instruments for waste management in South Australia 25 October 2004
BDA Group and EconSearch 57
Figure 16: ACT waste to landfill and recycling73
Progress in Waste ReductionHow are we going?
0
100000
200000
300000
400000
500000
1993/94 1994/95 1995/96 1996/97 1997/98 1998/99 1999/00 2000/01 2001/02 2002/03
Tonn
es
Waste to Landfill Recycling
That is, while pricing changes were initially based on assessed economic and environmental costs, it was proposed that subsequent price changes reflect performance in meeting volumetric targets rather than direct economic or environmental costs per se.
‘For example, if the No Waste by 2010 reduction targets aren’t met for a given year, budget processes would be used to increase charges in the following year to send a stronger recycling signal to the community. Similarly, where waste reduction targets are exceeded, a limited increase may be applied74.’
Revised waste disposal charges were introduced from July 2003. Municipal waste charges of $50/tonne apply to waste privately delivered to landfill while commercial waste disposal is charged $55/tonne. Separate charges for special wastes, such as tyres & asbestos, were also introduced.
The ACT Government has also noted that without the appropriate infrastructure and education programs to complement the new waste charges, an increase in illegal dumping and export of waste interstate will occur. Following the initial implementation of prices in 1993, an increased prevalence of illegal waste disposal was reported. Increased monitoring to prevent illegal dumping, infrastructure developed to receive recycled materials and information provided to waste producers of their recycling options has been introduced in conjunction with the new charges to alleviate this problem.
73 Source: www.nowaste.act.gov.au/styles/howarewegoingoverall.xls 74 ibid, page 5
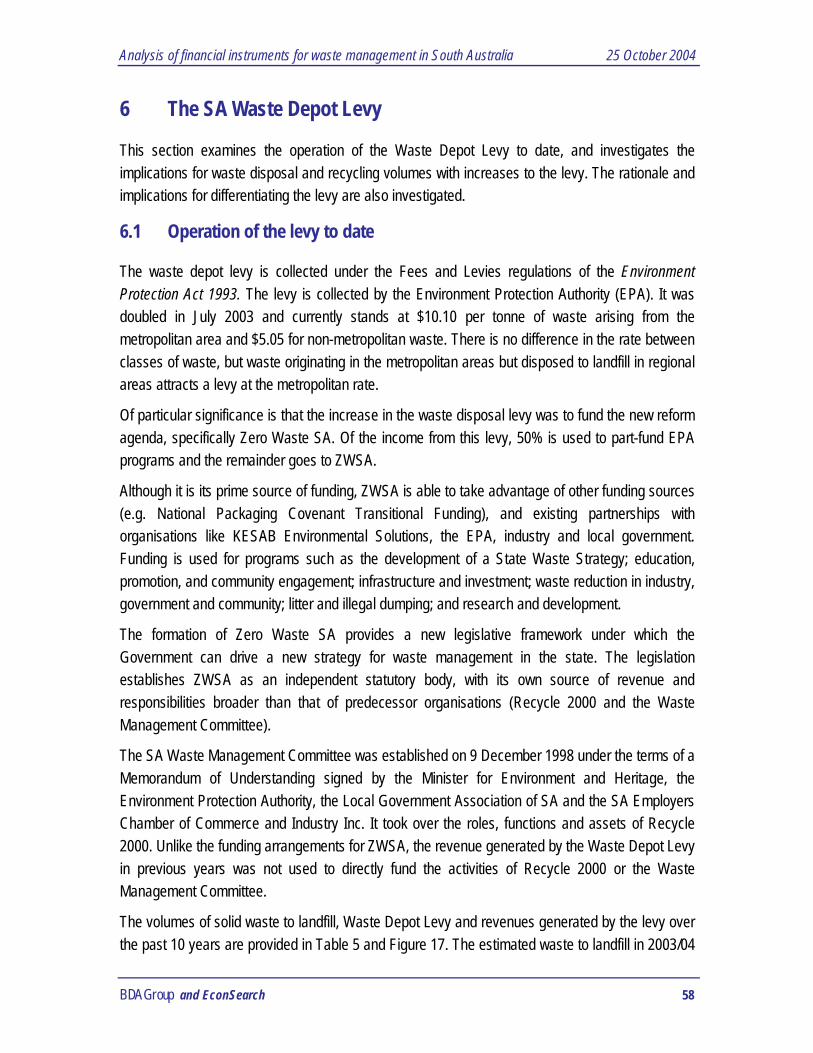
Analysis of financial instruments for waste management in South Australia 25 October 2004
BDA Group and EconSearch 58
6 The SA Waste Depot Levy
This section examines the operation of the Waste Depot Levy to date, and investigates the implications for waste disposal and recycling volumes with increases to the levy. The rationale and implications for differentiating the levy are also investigated.
6.1 Operation of the levy to date
The waste depot levy is collected under the Fees and Levies regulations of the Environment Protection Act 1993. The levy is collected by the Environment Protection Authority (EPA). It was doubled in July 2003 and currently stands at $10.10 per tonne of waste arising from the metropolitan area and $5.05 for non-metropolitan waste. There is no difference in the rate between classes of waste, but waste originating in the metropolitan areas but disposed to landfill in regional areas attracts a levy at the metropolitan rate.
Of particular significance is that the increase in the waste disposal levy was to fund the new reform agenda, specifically Zero Waste SA. Of the income from this levy, 50% is used to part-fund EPA programs and the remainder goes to ZWSA.
Although it is its prime source of funding, ZWSA is able to take advantage of other funding sources (e.g. National Packaging Covenant Transitional Funding), and existing partnerships with organisations like KESAB Environmental Solutions, the EPA, industry and local government. Funding is used for programs such as the development of a State Waste Strategy; education, promotion, and community engagement; infrastructure and investment; waste reduction in industry, government and community; litter and illegal dumping; and research and development.
The formation of Zero Waste SA provides a new legislative framework under which the Government can drive a new strategy for waste management in the state. The legislation establishes ZWSA as an independent statutory body, with its own source of revenue and responsibilities broader than that of predecessor organisations (Recycle 2000 and the Waste Management Committee).
The SA Waste Management Committee was established on 9 December 1998 under the terms of a Memorandum of Understanding signed by the Minister for Environment and Heritage, the Environment Protection Authority, the Local Government Association of SA and the SA Employers Chamber of Commerce and Industry Inc. It took over the roles, functions and assets of Recycle 2000. Unlike the funding arrangements for ZWSA, the revenue generated by the Waste Depot Levy in previous years was not used to directly fund the activities of Recycle 2000 or the Waste Management Committee.
The volumes of solid waste to landfill, Waste Depot Levy and revenues generated by the levy over the past 10 years are provided in Table 5 and Figure 17. The estimated waste to landfill in 2003/04
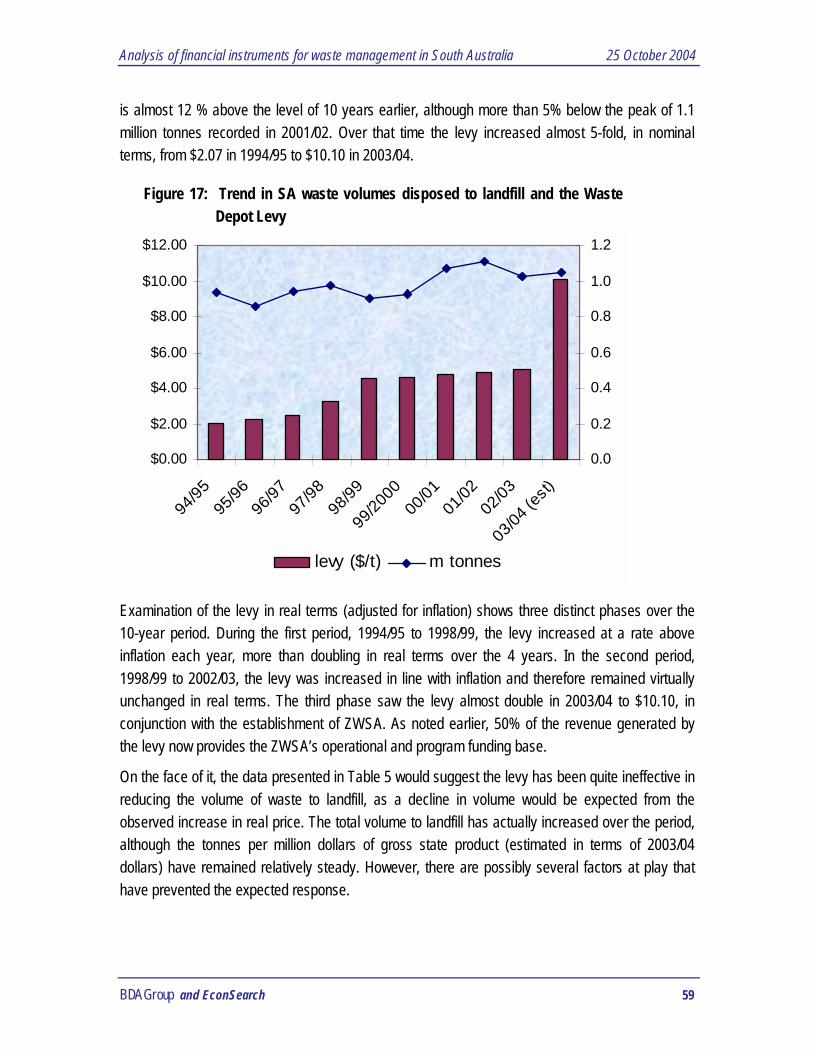
Analysis of financial instruments for waste management in South Australia 25 October 2004
BDA Group and EconSearch 59
is almost 12 % above the level of 10 years earlier, although more than 5% below the peak of 1.1 million tonnes recorded in 2001/02. Over that time the levy increased almost 5-fold, in nominal terms, from $2.07 in 1994/95 to $10.10 in 2003/04.
Figure 17: Trend in SA waste volumes disposed to landfill and the Waste Depot Levy
$0.00
$2.00
$4.00
$6.00
$8.00
$10.00
$12.00
94/95
95/96
96/97
97/98
98/99
99/20
0000
/01 01
/02 02
/03
03/04
(est)
0.0
0.2
0.4
0.6
0.8
1.0
1.2
levy ($/t) m tonnes
Examination of the levy in real terms (adjusted for inflation) shows three distinct phases over the 10-year period. During the first period, 1994/95 to 1998/99, the levy increased at a rate above inflation each year, more than doubling in real terms over the 4 years. In the second period, 1998/99 to 2002/03, the levy was increased in line with inflation and therefore remained virtually unchanged in real terms. The third phase saw the levy almost double in 2003/04 to $10.10, in conjunction with the establishment of ZWSA. As noted earlier, 50% of the revenue generated by the levy now provides the ZWSA’s operational and program funding base.
On the face of it, the data presented in Table 5 would suggest the levy has been quite ineffective in reducing the volume of waste to landfill, as a decline in volume would be expected from the observed increase in real price. The total volume to landfill has actually increased over the period, although the tonnes per million dollars of gross state product (estimated in terms of 2003/04 dollars) have remained relatively steady. However, there are possibly several factors at play that have prevented the expected response.

Analysis of financial instruments for waste management in South Australia 25 October 2004
BDA Group and EconSearch 60
Table 5: Metropolitan Solid Waste to Landfill
Waste (tonnes)
Levy (nominal)
($/t)
Levy (real)a
($/t) Gross
Revenue ($)
Waste / $m real GSP
(t/$m)
1994/95 939,358 $2.07 $2.58 1,959,235 22.7 1995/96 858,658 $2.27 $2.73 1,949,154 20.2 1996/97 943,015 $2.48 $2.95 2,624,065 21.8 1997/98 975,564 $3.22 $3.86 3,141,315 20.9 1998/99 907,235 $4.52 $5.35 4,100,702 19.4 1999/00 928,509 $4.64 $5.35 4,308,281 19.5 2000/01 1,070,146 $4.76 $5.19 5,093,895 22.2 2001/02 1,112,355 $4.88 $5.18 5,428,295 22.3 2002/03 1,024,649 $5.09 $5.20 5,215,462 20.3 2003/04b 1,051,063 $10.10 $10.10 10,615,734 20.2 2004/05 - $10.50 - - -
a Inflated to 2003/04 prices using Adelaide CPI. b Estimated based on July 2003 to March 2004 figures. c Tonnes per million dollars gross state product (ABS Cat No. 5220.0) inflated to 2003/04 prices using Adelaide CPI Source: SA EPA.
First, it is likely the volume of waste to landfill as a proportion of total waste has declined as the increase in total waste has been matched by an increase in waste directed to recycling. Other things being equal, as the real cost of disposal to landfill increases, waste generators will look to both reduce the total volumes of waste that need to be disposed of off-site and increase the volumes of waste directed to recycling activities. Although it is difficult to obtain comprehensive data on recycling volumes, the information that is available suggests that volumes have increased substantially in Metropolitan Adelaide over the past decade.
Nolan ITU (2000) reported substantial growth in paper recovery rates in the past 10 years in South Australia, although rates are significantly below those in other states. The organic waste sector has become well established over the past decade, experiencing considerable growth. Dry and wet recyclable organics grew by around 20% over the period 1999 to 2002 (Nolan ITU and Access Economics 2002). Of course, like other States, SA has pursued a range of complementary waste management reforms which would need to be considered in attributing any improvements in disposal volumes to the Waste Depot Levy.

Analysis of financial instruments for waste management in South Australia 25 October 2004
BDA Group and EconSearch 61
Second, the enactment of legislation in 2000 to close Wingfield by December 2004 has provided a significant distortion in the market. The legal requirement to close the landfill by that date has meant that the Wingfield operators have been active in the market to ensure they have sufficient material to fill and cap the landfill as required. Price discounting for waste disposal at Wingfield in 2004 is likely to have attracted potentially recyclable waste material that will become much more expensive to dispose of to landfill from January 2005.
Third, and related to the previous point, there is likely to be a lag in response to both the July 2003 increase in the levy and the change in market conditions that will flow from the closure of the Wingfield landfill. Both waste generating and waste management companies will be carefully watching the market and repositioning themselves as needed following substantial change in market conditions at the beginning of 2005.
6.2 Estimated impacts from a higher levy To investigate the effects from increasing the Waste Depot Levy, a model of the metropolitan waste management sector in SA was developed, and is described in Appendix B. The model has been used to estimate the impacts arising from a higher levy on:
• Change in landfill gate fees
• Change in volume of waste produced
• Change in volume to landfill
• Change in volume to recycling
• Economic cost
• Revenue from levy
• Revenue to landfill operators
• Revenue for recycling operators
It should be noted that a number of simplifying assumptions are embodied in the analysis. For example, changes in levy administration and enforcement costs are ignored, no illegal dumping is considered, and waste producers, recyclers and landfill operators are assumed to adjust instantaneously to the incentives provided. Experience in other states indicates that these assumptions may not necessarily hold. For example, any differentiation in the levy may significantly increase administration costs, significant increases in levy rates is likely to encourage greater illegal dumping and associated enforcements costs, and waste sector changes to levy increases may take several years to flow through, given changes in infrastructure and management practices needed.
In addition, it was assumed that ‘all other things are held constant’, such as population growth rates, economic activity, and so on. Therefore like experiences elsewhere, disposal volumes could continue to increase in SA if these factors outweighed the impact of any levy increases. Nevertheless, we believe the analysis provides a reasonable scoping of likely effects in order to judge the merits of potential changes in levy rates.

Analysis of financial instruments for waste management in South Australia 25 October 2004
BDA Group and EconSearch 62
With these considerations in mind, increases in the Waste Depot Levy were tested and are reported in the sections below. A description of impacts associated with a doubling of the levy is shown for illustrative purposes, followed by investigation of levy increases over the range $0-26 per tonne.
Doubling the Waste Depot Levy
An increase in the levy will drive up landfill gate fees. Based on representative fees for each waste stream, an estimated percentage increase in current (July 2004) landfill gate fees from a doubling of the existing levy is demonstrated in Figure 17. Because the modelled levy increase is a flat increase across all streams, the percentage increase will be greatest for those waste streams with relatively low gate fees, such as for municipal wastes. Because of the closure of the Wingfield facility in December 2004, average gate fees for municipal waste are expected to increase (as a result of increased handling and transport costs and the capital investment required at the alternative landfill sites) and so the percentage increase from an increase in the levy would not be as great as indicated in Figure 17.
Figure 17: Changes in landfill gate fees (inclusive of the levy) from doubling the levy
Based on the modelling approach outlined in Appendix B, a doubling of the levy to $21 per tonne would result in a reduction of waste to landfill of approximately 19% (240,000 tonnes). This would be achieved through a 4% reduction in waste generation (through either waste minimisation or on-site recycling / reuse measures) and through an 8% (130,000 tonne) increase in recycling volumes.
It was estimated that a doubling of the levy would lead to a reduction in all wastes disposed of off-site, particularly green & organic (6%), C&D (4%) and municipal (4%) (Figure 18). These wastes,
0%
10%
20%
30%
40%
Munici
pal
C & I
Land
fill co
ver
C & D
Green a
nd or
ganic
Biosoli
ds
Regula
ted

Analysis of financial instruments for waste management in South Australia 25 October 2004
BDA Group and EconSearch 63
together with C&I, would contribute the most to reductions in landfill volumes, with an estimated reduction of 130,000 tonnes of C&D waste, 40,000 tonnes of green organics, 30,000 tonnes of C&I wastes and 20,000 tonnes of municipal wastes. In percentage terms, the increase in the volumes of wastes entering recycling would be greatest in green organics (up 14%) and C&I (12%).
Figure 18: Impact of waste depot levy on waste generation, recycling and landfill disposal
-70%
-40%
-10%
20%
Generation -4% -2% 0% -4% -6% -4% -3%Landfill -11% -21% 0% -29% -25% -38% -3%Recycle 9% 12% 0% 7% 14% 9% 0%
Municipal C & I Landfill cover C & D Green and
organic Biosolids Regulated
As can be seen in Figure 19, the waste types diverted to recycling following a doubling of the levy, estimated in aggregate to be over 130,00 tonnes per annum, are dominated by C&D (55%), C&I (18%) and green organics (17%). With current gate fees, unless the increase in the levy is significantly higher, the volumes of municipal waste diverted to recycling will be relatively small.
Although large volumes of C&D waste material are already recycled, there is still considerable scope for further recycling. For example, the largest C&D recycler in SA, ResourceCo, has a new processing facility at Gilman that, when completed, will have the capacity to process more than 250,000 tonnes of material into alternative fuels. A similar situation exists in the paper, plastics and metal recycling sectors as well as in green organics. Discussions with industry representatives suggest that the capacity exists in each of these sectors to recycle the volume of material suggested under this doubling of the levy scenario.
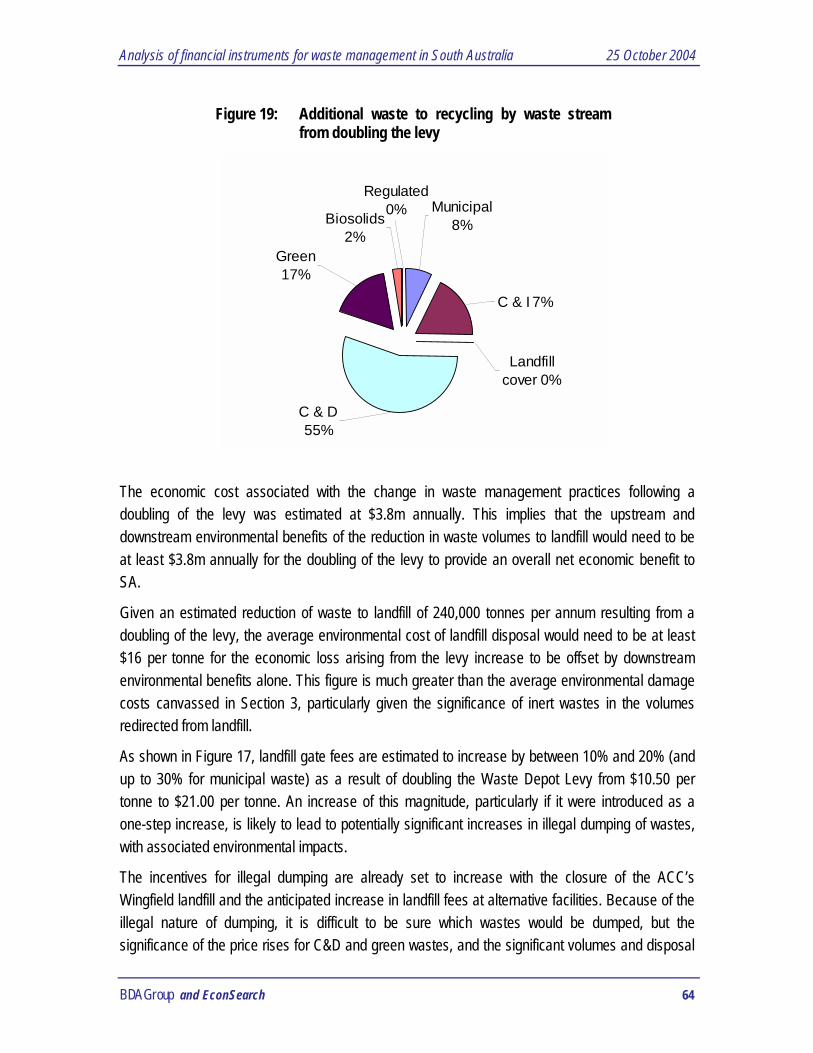
Analysis of financial instruments for waste management in South Australia 25 October 2004
BDA Group and EconSearch 64
Figure 19: Additional waste to recycling by waste stream from doubling the levy
The economic cost associated with the change in waste management practices following a doubling of the levy was estimated at $3.8m annually. This implies that the upstream and downstream environmental benefits of the reduction in waste volumes to landfill would need to be at least $3.8m annually for the doubling of the levy to provide an overall net economic benefit to SA.
Given an estimated reduction of waste to landfill of 240,000 tonnes per annum resulting from a doubling of the levy, the average environmental cost of landfill disposal would need to be at least $16 per tonne for the economic loss arising from the levy increase to be offset by downstream environmental benefits alone. This figure is much greater than the average environmental damage costs canvassed in Section 3, particularly given the significance of inert wastes in the volumes redirected from landfill.
As shown in Figure 17, landfill gate fees are estimated to increase by between 10% and 20% (and up to 30% for municipal waste) as a result of doubling the Waste Depot Levy from $10.50 per tonne to $21.00 per tonne. An increase of this magnitude, particularly if it were introduced as a one-step increase, is likely to lead to potentially significant increases in illegal dumping of wastes, with associated environmental impacts.
The incentives for illegal dumping are already set to increase with the closure of the ACC’s Wingfield landfill and the anticipated increase in landfill fees at alternative facilities. Because of the illegal nature of dumping, it is difficult to be sure which wastes would be dumped, but the significance of the price rises for C&D and green wastes, and the significant volumes and disposal
Biosolids 2%
Green 17%
C & D 55%
Regulated 0%
C & I 7%
Municipal 8%
Landfill cover 0%

Analysis of financial instruments for waste management in South Australia 25 October 2004
BDA Group and EconSearch 65
costs of these wastes from individual developments, suggest they would be likely candidates. The environmental impact from these wastes would not be as great as that posed by other waste types, but any illegal dumping would still prove a nuisance to communities and demand greater enforcement activities.
The financial impacts of a doubling of the levy will vary significantly and are shown in Table 6.
Table 6: Revenue impacts of a $10.50 landfill levy increase
Sector Revenue change
Government – levy revenue + $6.1m Landfills – change in gate revenue (net of levy) - $10.9m Waste generators – change in waste disposal costs - $14.3m Recyclers – change in revenue for receiving waste + $19.1m
The increase in the levy is estimated to generate an extra $6m (55%) in revenue for the South Australian Government. Since scheme administration and enforcement expenses are already accounted for by the existing levy, this represents a net increase in revenue.
Landfill operators are estimated to pass on 75% to 95% of the levy to waste generators via changes in gate fees for the various waste streams. Together with the estimated 19% reduction in volumes disposed to landfills, revenue received by landfill operators net of levy payments to government are estimated to fall by around $11m annually.
For waste generators, their annual bill for wastes disposed off-site is estimated to increase by some $14m. In addition, expenditures would be incurred in achieving the estimated 4% reduction in waste volumes going off-site, through either modifying inputs or processes to reduce waste volumes generated, or through greater on-site recycling and reuse.
Lastly, revenues received by recyclers would increase by an estimated $19m annually, as fees paid to them for receiving wastes increased in line with landfill gate fees.
Disposal and recycling patterns with progressive levy increases
Based on the modelling framework discussed earlier, it was possible to estimate, for increasing Waste Depot Levy rates, changes in the volume of waste generated, the amount going to landfill and the quantity recycled. These estimates are provided in Figure 20.
The estimates provided in Figure 20 have a straightforward interpretation. If, for example, the levy rate were to increase by $10 per tonne, the total volume of waste to landfill would reduce by around 230,000 tonnes, the volume of waste directed to recycling would increase by approximately

Analysis of financial instruments for waste management in South Australia 25 October 2004
BDA Group and EconSearch 66
130,000 tonnes and the difference (of around 100,000 tonnes) would represent the net reduction in total waste produced.
The estimated response illustrated in figure 20 shows a linear rate of change as the levy increases. In reality, of course, this is unlikely to be the case: thresholds in price differentials may need to be reached before significant diversions occur or diversions may occur up to a point where capacity constraints would prevent further recycling.
Figure 20: Estimated change on disposal and recycling patterns with alternative landfill levy rates
-800
-600
-400
-200
0
200
400
2 6 10 14 18 22 26
'000
tonn
es
Landfilled Recylcled Total Waste
Levy Rate Increase($/t)
As noted earlier, the C&D sector has considerable capacity to increase recycling with new investments that have been made in recent times and as new technologies and products using recycled material (e.g. Bitumate and Coldmix Asphalt) have increased acceptance in the market place. Further, the closure of ACC’s Wingfield landfill is likely to impact on the market in a way that reinforces the impact of a levy increase (i.e. landfill gate fees will increase from January 2005). Nevertheless, there are limits to the amount of waste material available and as the volume increases the more difficult and therefore more expensive it will become to extract saleable recyclate.
For the green and organics waste stream, recent investments by the major players within the industry mean that industry capacity is unlikely to be a constraint over the range of recyclate volumes implied in Figure 20. Even a levy increase of $26/t would have a modelled increase in recycling of green and organics of less than 60,000t per annum, which would result in an overall level of composting activity within currently licensed levels.

Analysis of financial instruments for waste management in South Australia 25 October 2004
BDA Group and EconSearch 67
With most other recycling sectors, metal, paper and plastics, there are not foreseeable capacity constraints given current levels of investment, or the investments that could be made. In some sectors however the cost of extracting more resource would increase significantly as the recycled proportion of the total resource increases. As an example, paper and cardboard volumes have increased significantly in recent years but extracting extra tonnages from the C&I sector is becoming increasingly difficult, as it requires securing small volumes from a large number of small to medium businesses. As the volume collected per pick-up decreases, the cost per tonne of paper fibre recovered from these sources increases, and can be substantially higher than collecting from high waste producing large companies.
As explained elsewhere, the situation is slightly different with municipal waste. It is likely that the kerbside proportion of the municipal waste stream, at least, will be slower to respond to small increases in the levy. When the levy increases are set at a higher level (e.g at $15 to $20 above the current level) it may induce some changes at the municipal level in the investments in infrastructure, education and additional services that would be required. With many Councils actively seeking means to reduce collection volumes and the cost of waste services, it is likely that many of these changes will come about anyway, with increases in the levy likely to accelerate the rate of change rather than the end point.
Based on the modelling framework discussed earlier, the economic costs associated with a range of levy increases were estimated, and are shown in Figure 21. As can be seen, the costs are relatively small at low levels of levy increase but increase sharply after the levy increase exceeds around $10.00 per tonne. As noted above, the economic loss from a levy increase of $10.50 is around $3.8m annually. An increase in the levy by around $20/t would result in an estimated economic cost of around $9.5m annually.
Figure 21: Estimated economic cost of increases to the Waste Depot Levy rates
-15
-12
-9
-6
-3
0
3
2 4 6 8 10 12 14 16 18 20 22 24 26
$m Levy Rate Increase ($/t)
The imposition or increasing of landfill levies in other countries has commonly been found to impose significant economic costs. By way of comparison, it has been estimated that the

Analysis of financial instruments for waste management in South Australia 25 October 2004
BDA Group and EconSearch 68
introduction of the UK landfill tax at its initial £7 lead to an economic loss (ie; additional cost to industry of changing waste disposal practices) of £366m, or around 0.1% GVP75.
Finally, it is notable that estimated revenue gains will also fall away with progressive levy increases. While a doubling of the levy to $21/t is estimated to increase levy revenue by 55%, a tripling of the levy to $31.50/t is only estimated to increase revenues by 64%.
75 Davies and Dable (2004), The development and implementation of a landfill tax in the UK, in OECD (2004), Addressing the
economics of waste

Analysis of financial instruments for waste management in South Australia 25 October 2004
BDA Group and EconSearch 69
6.3 The case for a differentiated levy The case for differential levies, and the nature of differentiation, will hinge on the policy objectives behind the levy. As outlined in Section 5.5, objectives for landfill levies in Australia have variously comprised;
• Revenue generation; or
• Reduction in downstream externalities; or
• Promoting volumetric recycling and disposal targets, as a surrogate for reducing upstream externalities.
It is also evident from the Australian experience that fee structures reflective of these alternative objectives will vary markedly. For example, the fee structure in NSW is strongly revenue orientated, and provides no direct differentiation between organic and inert wastes. Alternatively, in WA where the primary objective of the landfill levy is to internalise downstream externalities, the fee for inert waste is a third of that for general wastes. In Victoria, the levy rate has been differentiated to reflect perceived opportunities for recycling and so (inert) industrial wastes in that State attracts a higher rate than general wastes.
If revenue maximisation were the primary objective, then levy rates could be increased for wastes where disposal volumes are least price sensitive. Putting aside the issue of illegal dumping, this would tend to be wastes for which there are limited opportunities for reuse and recycling. The opposite strategy would apply where the primary objective was to promote recycling. That is, applying higher rates for wastes where recycling opportunities existed would promote greater waste diversion.
Opportunities for recycling are greatest across the C&D and organic waste streams, and hence the disposal of these wastes to landfill will be more responsive to levy increases. By way of illustration, the adoption of a levy regime differentiated to provide greater incentives for the diversion of these wastes76 but to provide the same revenue base as a flat fee levy of $21/tonne, could lead to an additional 45,000 tonne reduction in wastes disposed to landfill than under the flat fee regime. The net cost to waste generators under the differentiated levy would be some $1.8m greater than under the flat fee regime. With a greater volume of wastes being diverted with this differentiated levy, the economic cost was estimated at around $1m more annually than under the flat fee regime.
However while consistent with a volumetric objective, focussing on wastes where recycling costs are lowest is really a poor surrogate for likely and varied upstream impacts. It infers such impacts move in line with the availability and cost-effectiveness of recycling practices. This is unlikely.
76 A levy of $24/t of C&D and organic waste and $20/t for other wastes subject to the Waste Depot Levy

Analysis of financial instruments for waste management in South Australia 25 October 2004
BDA Group and EconSearch 70
Alternatively, to effectively set fees reflective of upstream benefits, there would need to be a sound understanding of which resources or industrial and manufacturing processes are imposing environmental damages – and the recycling of which wastes would influence the level of damages.
Most agricultural, forestry, mining, and energy resources extracted in Australia are exported, and changing the price signals faced by Australian consumers will have little impact on the management of our resource base. Key questions that would need to be considered include:
• which resources are we trying to conserve? Locally consumed resources like sand, gravel and clay could be candidates, but, how scarce are they?
• what detrimental impacts could be avoided? Should conservation of resources be afforded the same attention as exploitation practices that result in impacts on biodiversity, land degradation or water quality?
• would addressing one resource simply result in greater exploitation of other resources with perhaps worse environmental impacts?
The case for differentiated levies is arguably most convincing in relation to downstream disposal impacts. Where the objective is to be cost-reflective of the environmental impacts of waste disposal (ie; downstream externalities), the key differentiation for general wastes lies in their organic content, which in turn will determine the extent of greenhouse gases. Table 7 below shows the greenhouse gas damage costs estimated in the studies reported in Section 3.
Table 7: Greenhouse and total impacts from waste disposal to landfill ($/tonne mixed waste)
Study Greenhouse gas externality
Total externality
Revised NSW EPA (average of range metropolitan landfill)
4 8
ACT No Waste 6 10
European Commission (modern landfill)
8 18
The actual level of greenhouse gas emissions will depend on specific landfill management practices, particularly whether there is methane capture. It is also notable that the non-greenhouse cost components identified in these studies is dominated by local amenity impacts, including odour and vermin which will again directly be attributable to organic wastes.

Analysis of financial instruments for waste management in South Australia 25 October 2004
BDA Group and EconSearch 71
Accordingly, pricing structures for landfill levies that seek to be reflective of landfill externalities would employ a higher rate for organic waste streams (green waste, food wastes, paper, timber, etc) and much smaller rates for inert wastes such as soil, concrete, bricks and so on, that dominate the C&D waste stream77. Clean fill used at putrescible landfills as a daily cover provides a disposal benefit, and would attract an even lower rate or levy exemption (as is common in most states).
If the levy regime was differentiated to provide greater incentives for the diversion of organic wastes78 but again to provide the same revenue base as a flat fee levy of $21/tonne, this is estimated to lead to some 24,000 tonne less wastes being diverted from landfill than under the flat fee regime. The net cost to waste generators under this differentiated levy would be some $1m less than under the flat fee regime. With a smaller volume of wastes being diverted under this differentiated levy, the economic cost was estimated to be $0.75m less than under the flat fee regime.
Problematic and regulated wastes which have much greater environmental impacts (or management needs to prevent these impacts) would attract specific charges commensurate with their impacts. For this reason used tyres, whitegoods, asbestos, and other toxic materials typically face higher charges. However this practice is moderated where illegal dumping is likely, such as with waste oils.
Indeed, regardless of the objective for differentiating between waste types, there are a number of practical limitations. As noted by RPM79,
Any pricing system must be practical. Theoretically it would be possible to differentially price a large number of waste streams but such a scheme would be impractical to administer. The checking of mixed loads going into landfill sites requires additional human resources and redesign of physical arrangements to be effective. At some point the cost of checking and changing infrastructure outweighs any benefits.
Any increase in prices must take account of customer acceptance. If landfill charges or levies are seen as too burdensome then illegal dumping with its associated community and environmental costs will increase. The extent of this increase depends on individual circumstances including the proximity to rural land or bushland, customer experience with landfill charging, the degree of civic responsibility in the community, penalties and policing.
As well as potentially differentiating landfill levies by waste type, several jurisdictions have also differentiated by the location of waste disposal. All states currently imposing a landfill levy charge a lower rate for wastes disposed in rural areas, although this differentiation in NSW is being 77 It is notable that greenhouse gas emissions associated with some alternatives to landfilling (such as composting) may be of a
similar magnitude and hence the rationale for any externality charge may be tenuous if not also applied to the alternatives. 78 A levy of $22.50/t for all wastes except $18.00/t for C&D wastes (no levy applied to landfill cover) 79 Resources Policy and Management (2001), The actual cost of waste disposal in the ACT
Analysis of financial instruments for waste management in South Australia 25 October 2004
BDA Group and EconSearch 72
progressively removed. While some jurisdictions have argued that there will be lower environmental impacts in rural areas, this is difficult to substantiate.
Rural landfills generally have lower management oversight and less stringent environmental management practices. Therefore leachate pollution may pose a greater risk, while greenhouse gas emissions are rarely controlled via methane capture – and impacts from greenhouse gas emissions are not location dependent. Alternatively, local amenity impacts may be less of a concern as landfills are generally further from residential areas. Curiously, three States apply a higher metropolitan levy rate on wastes originating in metropolitan areas but disposed at rural landfills. As the source of the waste is unrelated to disposal impacts this contradicts the rationale for providing a lower rate in rural areas in the first place. Of course applying the higher rate to these wastes is consistent with revenue and recycling objectives, and social equity considerations.
In practice, lower levy rates (if any) in rural areas have generally been set because of the greater likelihood of illegal disposal and due to the lack of infrastructure and personnel at rural landfills to collect levies.

Analysis of financial instruments for waste management in South Australia 25 October 2004
BDA Group and EconSearch 73
7 Aligning instruments with waste policy goals
In this section, theoretical and practical experiences with financial instruments for waste management are reviewed ahead of consideration of appropriate instruments in the SA context.
7.1 Economic theory and instrument choice Many economic papers have investigated the efficiency of alternative waste management policies. Most focus on managing the downstream environmental impacts associated with post-consumer waste disposal, including impacts at landfills or incineration, or through littering or illegal dumping. A 2003 paper by Fullerton and Raub80 captures contemporary views and is broadly consistent with a review of the economic literature by Kinnaman and Fullerton81 in 1999.
They argue that a social optimum can be achieved by taxing garbage per unit generated at the marginal external damage cost it causes. This can be achieved via unit based pricing for garbage collected or at the point of disposal such as via a landfill levy. However for wastes where dumping is a problem, they argue that a deposit-refund scheme will be more efficient. The deposit (essentially an advance disposal fee) should be set at the marginal external dumping cost, and returned when the waste enters recycling. If recyclate is picked up from the kerbside, then households should receive a subsidy commensurate with volumes ‘returned’. Where these subsidy levels are similar to charge levels for residual waste to landfill, then one offsets the other and Fullerton and Raub argue that a ‘free’ municipal waste service, as widely practiced in the US, is therefore efficient.
However it is noted that the administrative costs of deposit-refund schemes could be high given the potential diversity of products to be targeted. They argue that to overcome this, policy makers could either simply target high volume / high impact products, or as suggested by Palmer and Wallis (1999), they could tax key inter-mediate goods and provide a subsidy to recyclers. These deposit-refund approaches are widely supported in the literature.
Citing a number of earlier studies, Fullerton and Raub also argue that virgin material taxes would be highly inefficient as an incentive to reduce waste disposal externalities. Nevertheless, Bruvoll82 notes that a material tax will reduce the demand for and production of products based on these virgin materials, and thus stimulates resource conservation. Moreover, the tax will provide an incentive for a greater use of returnable goods and recycling, as the prices of recyclable materials increase, which will make recycling less dependent on subsidies and regulations.
80 Fullerton and Raub (2003), Economic analysis of soild waste management policies, in OECD (2004), Addressing the economics
of waste 81 Kinnaman and Fullerton (1999), The economics of residential solid waste management, National Bureau of Economic Research
Working Paper No W7326. 82 Bruvoll (1998) Taxing virgin materials: an approach to waste problems Resources, Conservation and Recycling 22; 15-29

Analysis of financial instruments for waste management in South Australia 25 October 2004
BDA Group and EconSearch 74
Of perhaps greater interest to waste policy makers is the reverse - whether a tax on waste disposal can provide an efficient means to promote resource conservation.
Blackman and Harrington83 note that market instruments are most effective when focused at the point of incidence of externalities in supply chains. As instruments become more broadly applied across product supply chains, the link between behavioural responses sought by the instrument and environmental benefits becomes more tenuous, reducing the effectiveness of the instrument. Accordingly, downstream environmental impacts of waste disposal (such as pollution from landfill disposal) can be effectively handled at the waste disposal level. Upstream impacts (such as pollution from production) are best handled using upstream policies.
Several commentators have therefore argued that the volume of waste disposed to landfill is a poor proxy for the range of environmental impacts arising across supply chains. The relationships are too indirect to provide confidence that reducing waste volumes disposed will lead to demonstrable environmental benefits.
A range of studies of waste management policies supports the premise that applying market instruments needs to be focussed on their incidence in supply chains. It is ineffectual to use policy instruments at the waste disposal level to handle upstream as well as downstream externalities. Walls and Palmer (2000), in their Resources for the Future report Upstream Pollution, Downstream Waste Disposal, and the design of Comprehensive Environmental Policies, conclude that different policy instruments are needed to address both upstream externalities and downstream disposal - one instrument cannot fully internalise multiple externalities.
Further, these authors in an earlier empirical study (Palmer et al84) into the relative efficiency of alternative waste policy instruments (namely deposit-refund schemes, advance disposal fees and recycling subsidies) saliently argue the case;
‘… we consider the goal of these policies to be correction of the inefficiencies generated by a zero charge on disposal (i.e., reduction in the social costs of disposal only) rather than environmental costs at other stages in the product's life-cycle. Some analysts argue for a "life-cycle" approach that would consider upstream environmental costs, such as the pollution associated with production and transportation of goods, and factor these costs into a charge on waste disposal (Ackerman, 1993; U.S. Environmental Protection Agency/Office of Solid Waste and Emergency Response, 1995a).
However, many analysts suggest that life-cycle assessments are, for the most part superfluous: market prices, in combination with existing environmental regulations, already reflect the resource costs measured in life-cycle assessments (Arnold, 1993; Portney, 1993/94; Menell, 1993). To the
83 Blackman and Harrington (1999), The use of economic incentives in developing countries: lessons from international experience
with industrial air pollution, Resources for the Future Discussion Paper 99-39, Washington 84 Palmer, Sigman and Wallis(1996), The cost of reducing municipal solid waste, Discussion Paper 96-35 Resources for the
Future, Washington

Analysis of financial instruments for waste management in South Australia 25 October 2004
BDA Group and EconSearch 75
extent that some environmental externalities are not internalized, these authors and others (see Fullerton and Kinnaman, 1995; and Macauley and Walls, 1995) argue that policies that deal with environmental problems at their source -- for example, by setting taxes or standards on air or water emissions from a manufacturing process -- are likely to be more efficient than solid waste policies which are several steps removed.’
The key message from Palmer and other commentators is therefore that resource conservation policy is best pursued directly through natural resources programs, while pollution associated with production processes – whether using virgin materials or recycled materials – will be best pursued through programs directly targeting industry emissions rather than through waste policy.
There are a range of market-based policy instruments available to governments to target environmental impacts throughout production - consumption chains. At all stages of these supply chains alternative price and quantity instruments can be directly employed. So for example, at the point of raw material extraction, resource rent taxes or tradeable quota schemes can be used to promote the sustainable use of scarce resources, while pollution taxes and tradeable pollution schemes can be applied to internalise production externalities.
An important exception to the focus on direct instruments is to control illegal dumping externalities. As instruments cannot be directly applied to an illegal activity, incentives for actions that will mitigate these impacts must be considered. These can include subsidies for the design of non-toxic products or product changes to improve the ease with which products can be collected and recycled, or as canvassed above, the use of advance disposal fees and deposit-refund schemes.
The use of charges or levies as fiscal instruments to raise revenue has received little attention in the economics literature directed at waste policy. This is because such instruments do not have an economic basis – they are not designed to promote behavioural change and ‘internalise externalities’. Indeed taxation theory suggests that an efficient fiscal tax is one where behavioural changes are minimised, as this will impose less economic costs on the economy and ensure the revenue base is not undermined.
When using charges or levies on waste management practices to raise revenue for waste programs, the key economic question for government is whether or not established State fiscal instruments would be more efficient in raising revenue. From an equity perspective, the issues are whether waste program beneficiaries and/or agents disposing of wastes are broadly spread across the community. Conceptually, and from both economic and equity perspectives, it would seem that the grounds for taxing waste disposal for revenue generation purposes may not be strong.

Analysis of financial instruments for waste management in South Australia 25 October 2004
BDA Group and EconSearch 76
7.2 Lessons from Australian and international experience The review of experiences with economic instruments in Sections 4 and 5 confirms that these instruments are being increasingly applied to the management of wastes internationally and in Australia.
A range of instruments, including firstly advance disposal fees and deposit-refund schemes, and secondly performance bonds, have been used internationally with some success to respectively increase recovery rates of problematic wastes and to manage post-closure environmental impacts associated with landfills. The use of these instruments in Australia has been more limited, with mixed enthusiasm.
The use of variable price municipal waste collection charges have been widely trialled both internationally and domestically. Despite a number of problems being encountered with these instruments, they have generally been seen to be successful. The major qualification would seem to be the extent to which apparent waste reductions can be attributed to the price incentives offered or to complimentary changes in kerbside collection services, community recycling infrastructure and education programs.
The use of landfill levies has perhaps become the most prominent ‘economic’ instrument being used for waste management. However levies have rarely been applied as true economic instruments, reflective of environmental externalities and seeking behavioural change to align the marginal costs and benefits of waste disposal.
Levies have generally not been differentiated to account for their environmental impacts in either landfilling or associated with upstream production and consumption activities. Also, they have provided no incentive for landfill facility operators to improve management practices and hence reduce environmental impacts below regulated levels. Pollution fees applied at landfill or incineration have not been common. Where reductions in waste disposal volumes have been identified, it has generally been of inert wastes and complimentary policies have played a role.
Rather landfill levies have been revenue focussed or used as financial penalties where predetermined recycling or disposal targets have not been met. Commentators have generally attributed this to the lack of economic efficiency goals underpinning waste policies that have generally been crafted around technical gaols of waste minimisation.
Landfill levies have however been well accepted by communities and have provided funds for broader waste management strategies. Whether or not the collection of this revenue has been as efficient as general government revenue instruments, the hypothecation of revenues to waste management agencies is a common practice.
The increasingly common adoption of levy regimes reflective of recycling costs to promote predetermined volumetric recycling goals is perhaps of greater concern, as unlike environmental or

Analysis of financial instruments for waste management in South Australia 25 October 2004
BDA Group and EconSearch 77
even revenue based pricing regimes, these levy regimes cannot be transparently tied to public benefit criteria.
7.3 Appropriate instruments for SA The identification of appropriate financial instruments for waste management in SA will depend upon the Government’s waste management objectives. As identified in Section 2.3, ZWSA is currently developing a new State Waste Strategy with a clear vision of progressing towards zero waste. Waste minimisation at source, and further development of resource recovery and recycling, have been identified as central to this Strategy.
Minimising environmental impacts associated with waste generation, management or disposal has not been directly targeted, rather goals have been set in terms of volumetric disposal and diversion targets. Technical efficiency benchmarks such as espoused via the waste management hierarchy have been adopted rather than economic efficiency benchmarks.
The financial instruments best suited to these objectives, and widely employed internationally and in Australia, are variable waste collection or disposal charges. Variable waste collection charges are generally used by private sector operators collecting wastes from businesses. The key area of interest has been the municipal sector, as kerbside collection systems have typically been funded from general rates or a flat fee, and this is the current situation in SA.
Economic theory and practical experiences suggest that variable waste collection charges could play a role in driving down waste disposal volumes. However kerbside waste collections are provided by local rather than the State government, the adoption of these pricing systems may involve significant administrative costs and complementary changes in kerbside bin systems and recycling programs would be needed.
In particular, the use of smaller bins for general waste in conjunction with new recycling bin & collection systems may have a dramatic impact on municipal waste disposal. Alternatively, increases to the State’s waste disposal charge (the Waste Depot Levy) would provide an incentive to local governments to explore alternative waste management systems including variable collection charges and bin configurations.
Currently the price signal from the Waste Depot Levy to households is severely diminished by the inclusion of waste collection charges in general rates. Although some councils (e.g. Unley) specify on rates notices the proportion of general rates used for the provision of individual services (including waste management), it provides no opportunity for households to respond to these charges or to influence the level of service.
Under the Local Government Act (Section 146), councils do have the power to levy service rates and charges, in addition to general rates. Service rates and charges can be applied to a range of services including the collection, treatment or disposal (including by recycling) of waste (Section
Analysis of financial instruments for waste management in South Australia 25 October 2004
BDA Group and EconSearch 78
157). Unlike general rates, service rates and charges must relate only to the cost to the council of establishing, operating, maintaining, improving and replacing (including by future capital works) the service in its area. It appears that service charges for waste management could be differentiated between households depending on the type or level of service provided (eg for 240 litre, 140 litre or 80 litre bin for general rubbish). In this way a council’s rating system could be more attuned to waste management price signals and provide a better mechanism to influence the total volume of waste going to disposal and the volume diverted to recycling.
It seems these powers are not currently used by councils in South Australia, in the area of waste collection at least, and some further investigation in conjunction with the Local Government Association may be warranted.
Turning to the Waste Depot Levy and its potential to drive broader reductions in waste disposal, it is notable that increases in levy rates to date have been directed at revenue generation, rather than primarily to provide a disincentive for waste disposal. As discussed in Section 7.1, the economic case for using landfill levies to drive volumetric reductions in waste disposal is at best tenuous. However as described in Sections 4 and 5, governments worldwide have nevertheless employed levies for this purpose. Indeed levies are often being increased specifically to close the gap on disposal and recycling costs, sometimes differentiated to provide greater incentives where recycling opportunities are perceived greatest.
The SA Waste Depot Levy could be increased further and successfully drive increased recycling and provide a larger revenue base for waste programs. An assessment of potential impacts from increases in the Levy over a broad fee range was investigated in Section 6.2. For illustrative purposes, the analysis indicated that a doubling of the current levy rate could over time drive a 19% reduction in landfill disposal volumes and increase total levy revenue by 55% or $6.1m.
It was estimated that such a doubling of the levy would impose an additional $3.8m annual economic cost on the community in waste management costs, averaging around $16/t diverted from landfill. A review of potential benefits from volumetric reductions in waste disposed to landfill casts some doubt on potential offsetting environmental benefits. Reduced environmental damage costs at landfill are likely to be less than $10/t and probably closer to $4/t, and hence net benefits from such a levy increase will be dependent on realising upstream benefits.
It would also be possible to differentiate the levy to drive even greater reductions in waste disposal. However this is likely to impact greatest on inert C&D waste disposal, which generates little (downstream) environmental impact when landfilled – and so confidence in the realisation of upstream benefits would be necessary. It would also increase the economic burden relative to a flat fee regime and entail higher administration costs for government and landfill operators. The likelihood of even greater illegal dumping than under the flat fee regime would lead to further

Analysis of financial instruments for waste management in South Australia 25 October 2004
BDA Group and EconSearch 79
increases in illegal dumping, associated environmental impacts and increased enforcement and clean-up costs for government.
The timing of any fee increase also needs to be considered. As discussed earlier, there is likely to be a lag in responses to the July 2003 increase in the Waste Depot Levy and market conditions following the closure of the Wingfield landfill at the end of 2004. These factors are likely to result in increases in landfill gate fees and reductions in waste disposal volumes. It would seem prudent to observe these responses prior to consideration of further levy increases.
While this study has focussed primarily on financial instruments, some stakeholders have expressed interest in the potential use of tradeable landfill quotas, analogous to the recently introduced UK Landfill Allowance Trading Scheme. Such a scheme would impose a liability for holding quota entitlements on landfill operators. A quota entitlement would give the operator a right to landfill a certain quantity of waste in a year. Landfill operators would be able to buy and sell entitlements. Operators disposing more waste than their entitlements held would be forced to either purchase entitlements from other operators or pay a penalty
A tradeable quota scheme would work by encouraging landfill operators to set gate fees so that profits per tonne of waste received will at least be equivalent to the cost of buying entitlements or the profit made in selling spare entitlements to other operators.
Through increased landfill gate fees, a quota scheme would provide an incentive for recycling or reuse services. Recyclers would be competing to provide a cost-effective alternative than disposal to waste generators. It is expected that waste generators would divert waste to recycling or reuse activities where this represented a lower cost than gate fees. Through entitlement trading, waste disposal would shift to low cost landfills with wastes received being those for which alternative recycling or reuse posed the greatest costs. In aggregate, the combined costs of landfilling and recycling would be minimized.
Acceptance of a tradeable quota scheme depends in part on the potential cost of meeting landfill targets. Although a tradeable quota scheme will increase the likelihood of achieving a target, this could come at a high cost to the community. Enforcing a soft cap on penalties to prevent compliance costs exceeding the benefits to the community may therefore be deemed essential. If this were the case, the instrument would essentially become a price instrument equivalent to the current Waste Depot Levy.
For modest reductions in landfill disposal volumes, the Waste Depot Levy is considered superiour to the introduction of a tradeable quota scheme. Both instruments could in theory deliver similar changes throughout the waste sector and at similar cost, but greater effort in scheme development, implementation and enforcement is likely with the quota instrument.

Analysis of financial instruments for waste management in South Australia 25 October 2004
BDA Group and EconSearch 80
7.4 Recommendations We believe financial instruments can be used to assist the South Australian Government realise its waste management objectives. Specifically;
In the short-term, the State Government could assist local councils in adopting smaller bins for general waste in conjunction with new recycling bin & collection systems. This in itself could lead to significant reductions in municipal waste disposal volumes, as well as provide the necessary infrastructure to support a move to variable waste collection charges at the household level over time.
In the medium-term, a modest increase in the Waste Depot Levy could provide a larger revenue base to support waste reduction programs and provide a greater incentive for waste diversion from landfill. To minimise costs imposed on waste generators, landfill operators and government, no differentiation in levy rates is recommended at this time.
However investigation of the nature, extent and significance of upstream benefits, in the SA context, associated with the diversion of alternative wastes from landfill should be a priority to validate current policy settings and guide longer-term instrument design – such as providing a robust basis for differential levies or for instruments targeting specific wastes.
In the interim, support for the development of instruments at the national level to handle product specific waste streams of high environmental impact when disposed would seem prudent, given potential difficulties and costs for State-based schemes. A range of advance disposal fees, take-back schemes, deposit-refund schemes and tradeable certificate schemes are currently being investigated across a range of products including electrical goods, computers, mobile phones and tyres.
In the longer-term, and subject to confirmation of a zero waste strategy, tradeable landfill quota schemes could be investigated, potentially applied to discrete waste streams or across all streams. Extensive and well developed recycling industries, and a comprehensive enforcement regime, would be prerequisites. Even in these circumstances however, such instruments would remain a poor surrogate for efficient resources and industry policies in the first instance.
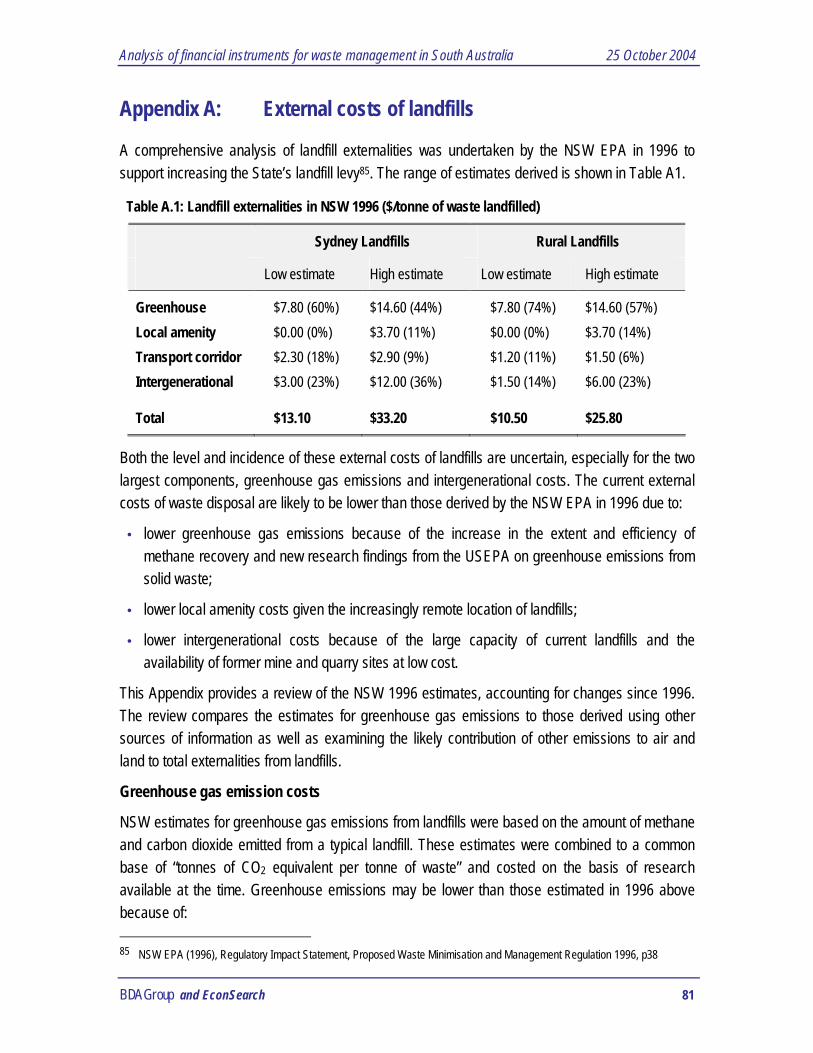
Analysis of financial instruments for waste management in South Australia 25 October 2004
BDA Group and EconSearch 81
Appendix A: External costs of landfills
A comprehensive analysis of landfill externalities was undertaken by the NSW EPA in 1996 to support increasing the State’s landfill levy85. The range of estimates derived is shown in Table A1.
Table A.1: Landfill externalities in NSW 1996 ($/tonne of waste landfilled)
Sydney Landfills Rural Landfills
Low estimate High estimate Low estimate High estimate
Greenhouse $7.80 (60%) $14.60 (44%) $7.80 (74%) $14.60 (57%) Local amenity $0.00 (0%) $3.70 (11%) $0.00 (0%) $3.70 (14%) Transport corridor $2.30 (18%) $2.90 (9%) $1.20 (11%) $1.50 (6%) Intergenerational $3.00 (23%) $12.00 (36%) $1.50 (14%) $6.00 (23%) Total $13.10 $33.20 $10.50 $25.80
Both the level and incidence of these external costs of landfills are uncertain, especially for the two largest components, greenhouse gas emissions and intergenerational costs. The current external costs of waste disposal are likely to be lower than those derived by the NSW EPA in 1996 due to:
• lower greenhouse gas emissions because of the increase in the extent and efficiency of methane recovery and new research findings from the USEPA on greenhouse emissions from solid waste;
• lower local amenity costs given the increasingly remote location of landfills;
• lower intergenerational costs because of the large capacity of current landfills and the availability of former mine and quarry sites at low cost.
This Appendix provides a review of the NSW 1996 estimates, accounting for changes since 1996. The review compares the estimates for greenhouse gas emissions to those derived using other sources of information as well as examining the likely contribution of other emissions to air and land to total externalities from landfills.
Greenhouse gas emission costs
NSW estimates for greenhouse gas emissions from landfills were based on the amount of methane and carbon dioxide emitted from a typical landfill. These estimates were combined to a common base of “tonnes of CO2 equivalent per tonne of waste” and costed on the basis of research available at the time. Greenhouse emissions may be lower than those estimated in 1996 above because of: 85 NSW EPA (1996), Regulatory Impact Statement, Proposed Waste Minimisation and Management Regulation 1996, p38

Analysis of financial instruments for waste management in South Australia 25 October 2004
BDA Group and EconSearch 82
• The extent and efficiency of methane recovery at landfills has increased and also act to displace fossil fuels when that methane is used as an energy source. Landfills act as carbon sinks where organic material (paper, green waste) does not fully decompose.
• New research findings from the USEPA on greenhouse emissions from solid waste86. The findings from this study are extrapolated to Australian circumstances below.
Based on “Mixed municipal solid waste (MSW)”, best practice landfill gas management was estimated to lead to a 92% reduction in emissions. These savings are much greater than the 50% estimated by EPA in 1996. The savings are based on the prevention of methane emission as well as the avoided CO2 emissions from the fossil-fuel generated power that is displaced. The saving would be greater in Australia because the fossil fuel displaced would have a higher proportion of coal than in the USA.
Landfill gas collection and either flaring or power generation is now required at all new landfill sites. There has been a significant increase in landfill gas generation over the past few years, due largely to the Australian Renewable Energy Certificate scheme. The Australian Ecogeneration Association’s register of cogeneration plants at 30 June 2001 listed over 90 MW of capacity fuelled by landfill gas, with more being constructed.
If landfill gas management in NSW was at a comparable level to that of the USA (54% of waste disposed of at landfills with gas recovery systems), using the 1996 estimates of CO2 equivalent impacts, this would suggest a revised estimate of $4.10 to $7.73 for greenhouse emissions from landfills per tonne of MSW87 compared to $7.80 - $14.60 estimated by EPA.. In rural towns landfill gas management may not be comparable and the original estimate of $7.80 - $14.60 is considered reasonable.
Estimates of greenhouse gases were also calculated using the latest methods provided by the Australian Greenhouse Office88 and a value of the external costs of CO2 equivalents at $15 per tonne. The results are comparable to the estimates discussed above with an externality estimate of around $11-$14 per tonne where there is no methane capture and $5-$7 where 50% of landfills have good gas controls.
If sequestration effects are taken into account, the rates are significantly lower – to the extent that, based on the USEPA estimates, landfills can be, to a small extent, a greenhouse gas sink. For mixed MSW, net emissions were estimated to be –0.08 tonnes of CO2 equivalent per tonne of waste. This is based on laboratory experiments where it was observed that a large proportion of
86 USA Environmental Protection Agency, 1998, Greenhouse Gas Emissions from Management of Selected Materials in Municipal
Solid Waste. 87 Estimated by replacing the 1996 estimate of 1 tonne of CO2 equivalent per tonne of waste with the weighted USA average of
0.53 tonne of CO2 equivalent. 88 Australian Greenhouse Office Factors and Methods Workbook, March 2003

Analysis of financial instruments for waste management in South Australia 25 October 2004
BDA Group and EconSearch 83
the paper, food and garden waste does not decompose. This suggests a greenhouse benefit from landfilling a tonne of mixed municipal solid waste of $0.62 to $1.10.
The sequestration issue should be approached cautiously because the Australian Greenhouse Gas Inventory methodology does not include any allowance for landfills as sinks. Considering landfills as a net greenhouse benefit is likely to be controversial. Therefore at best they should be considered neutral in terms of greenhouse gas emissions.
Diversion of food and/or garden waste from landfill to centralised or home composting was seen to deliver small reductions in emissions if the sequestration of materials in landfill is excluded. If the effects of sequestered materials in landfills are taken into account, there was little difference observed between composting and landfilling.
For the purposes of this analysis the external costs of greenhouse gas emissions are estimated at $0-$7.7 per tonne in metropolitan areas of NSW (Sydney, Wollongong and Newcastle) and $0-$14.6 per tonne in rural areas. The low estimate takes the effects of sequestration into account and the difference in the high estimates reflects the assumption that there is poorer landfill gas management in rural areas.
Local Amenity Costs
The methodology used in the 1996 NSW analysis regarding the number of affected residences is unlikely to be accurate given the increasingly remote nature of landfills. Similarly, while property values have generally increased, values for remote land will be less than those assumed based on residential land affected by older landfills.
For the purposes of this study the local amenity costs are estimated at $0-$3.7 for metropolitan areas (a similar level to the original estimates for Sydney) and they are assumed to be negligible for rural areas.
Transport corridor costs
The 1996 estimates of transport externalities were based on Bureau of Transport and Communication Economics estimates of the per kilometre effects of road transport of various types as well as characterising the waste profile for Sydney and non-Sydney landfills.
A trend towards greater concentration of facilities, and the location of new facilities in more remote areas would tend to increase the distance travelled by each tonne of waste. This suggests an increase in the estimated costs.
On the other hand, improvements on materials handling, greater use of transfer stations and waste compaction would have increased the average load per truck. This would have the effect of reducing the average impact per tonne of waste.

Analysis of financial instruments for waste management in South Australia 25 October 2004
BDA Group and EconSearch 84
There is also value in considering the marginal effect of waste to landfill. If waste is diverted from landfill to other waste management processes (e.g. recycling, composting), there will also be transport corridor effects. These effects may be greater because of:
• longer distances to reprocessing plants than to landfills/transfer stations;
• lower weight/volume ratios for separated recyclable materials (i.e. more trips per tonne of waste);
• multiple handling of recyclable materials from collection point to waste centre (often located at a landfill) to materials recover facility to reprocessor.
However, the same trends to concentration, remote location and efficiency in handling that exist in landfilling are present in other waste management techniques. It is therefore likely that the transport corridor costs between alternative techniques are converging. On balance, the 1996 estimates for transport corridor costs are considered reasonable for NSW.
For the purposes of this analysis the transport corridor impacts are estimated at $2.3-$2.9 for metropolitan areas and $1.2-$1.5 for rural areas.
Intergenerational Costs
Intergenerational costs reflect the costs to future users of consuming existing landfills. It has a number of components. These include:
• post-closure environmental effects;
• opportunity costs of sterilisation of land; and
• increased future costs as suitable sites for landfill become scarcer and more remote.
The 1996 analysis used estimates prepared for the waste service in 1992 for these costs. This study concluded that landfill was generally underpriced. However, as noted by IPART in its 1996 review of waste service charges89, the landfill charges by the NSW Waste Service have increased significantly in real terms since that time.
Changes in waste generation rates, technology, regulation and organisational structure since the 1992 report suggest that the estimation of intergenerational costs needs reassessment.
IPART concluded that there was no evidence that future capital and operating costs for landfills would be greater than for existing landfills that complied with environmental regulation. This would suggest that there is no need to make allowance for higher replacement costs in current waste charges.
89 Independent Pricing and Regulatory Tribunal (IPART), 1996, Pricing Policies of the Waste Recycling and Processing Service of
NSW.

Analysis of financial instruments for waste management in South Australia 25 October 2004
BDA Group and EconSearch 85
It has been noted that there are former mine and quarry sites available at low cost that would be suitable for landfills. It has also been noted that there are future uses available for end-of-life landfill sites, so the cost of land sterilisation is not as great as if the residual land is considered to have no value.
However, recent experience suggests that there is considerable local community opposition to the siting of new landfills. This could lead to higher establishment costs for new landfills or pressure to use alternative waste technologies that may be more expensive but less controversial to locate. In any case it is likely that future landfills will be located further from existing population centres, entailing higher transportation costs. It is therefore reasonable to assume that there will be some long term increase in the costs of landfills.
The question is then the extent to which those costs are external to the operations of landfill operators. If landfill operators have the responsibility to ensure that landfills are available into the future, then allowance for replacement of existing landfills should be incorporated in existing landfill charges. IPART concluded that the charges levied in the case of the NSW Waste Service were sufficient to cover those costs.
Alternatively, if landfill services are supplied in a competitive market, higher future costs will be reflected in increased charges as capacity becomes scarce. In either case, the cost of replacement is incorporated in charges – it is not an external cost. Similarly, many of the other perceived externality costs associated with future scarcity are borne directly by landfill operators. These include:
• the cost of future environmental damage (for example via post-closure guarantees);
• costs of finding sites that are acceptable to local communities (including EIS and legal costs);
• cost of sterilisation of land (this is reflected in the lands progressive loss of value over the life of the landfill).
It is therefore likely that there is little justification for inclusion of intergenerational costs in the calculation landfill externalities, as most intergenerational effects are unlikely to be external to the commercial operation of landfills.
For the purposes of this analysis, no intergenerational costs have been included in the estimates of landfill externalities.
Other emissions
Landfills also generate other emissions both to air and to land or water. The National Pollutant Inventory provides emissions estimation techniques for landfills and the NSW EPA’s load based licensing scheme provides a schedule of fees designed to reflect the external environmental impacts of different emissions.

Analysis of financial instruments for waste management in South Australia 25 October 2004
BDA Group and EconSearch 86
The external costs of emissions from landfills have been estimated for the following air pollutants: volatile organic compounds, nitrogen dioxide, sulphur dioxide, fine particles, benzene, hydrogen sulphide and mercury; and water pollutants: arsenic, cadmium, chromium, copper, lead, mercury, zinc and phenol.
The external costs of both solid and regulated wastes are estimated to be below $0.01 per tonne. While the fees used as proxies have been set well below full environmental costs even a hundred fold increase in the fee level would increase the external costs to only $0.40 per tonne.
For the purpose of this analysis the external costs of other emissions have not been included in the assessment of landfill externalities. While they may be significant in particular instances, overall their contribution to total externalities is likely to be negligible.
Analysis of financial instruments for waste management in South Australia 25 October 2004
BDA Group and EconSearch 87
Appendix B: Methodology for assessing a higher landfill levy
The provision of landfill disposal services can be considered as having the economic characteristics of supply and demand. These are shown graphically in Figure B1. The provision of landfill disposal (supply) will typically face increasing cost as the volume (Q) of landfill services supplied expands. The demand for landfill disposal will reflect the cost of alternative disposal options, which ignoring illegal disposal, will be via changing production processes, on-site reuse or through off-site recycling of materials. Generally as greater volumes are diverted from landfill to these activities, costs will progressively increase. Accordingly, demand for waste disposal is downward sloping indicating less will be disposed as disposal costs (P) increase.
Landfill gate fees are in effect the market price of landfill services, where at that price the level of demand is satisfied by the level of landfill services provided. In Figure B1 a landfill gate fee of P0 would lead to landfill waste volumes of Q0.
A market instrument, such as the waste depot levy, acts to change the cost of supplying landfill services relative to other options. The supply curve for landfill services, S0 in Figure B2, is derived from the cost functions of businesses providing landfill services. The levy acts as an increase in cost, which simply moves cost per unit of landfill up by the magnitude of the levy. Although the full extent of the levy increase will not necessarily be reflected in the gate fee, there will be an increase in the price of landfill, which will reduce demand and hence reduce waste disposal volumes.

Analysis of financial instruments for waste management in South Australia 25 October 2004
BDA Group and EconSearch 88
Figure B1: Demand and Supply of Landfill Services
However the supply and demand for landfill services cannot be considered in isolation from the total waste generation market. Figure B2 illustrates the market for landfill services (Figure B2b), the supply and demand for aggregate waste generation (Figure B2c) and the supply and demand for recycling (Figure B2a). An increase in the Waste Depot Levy will increase the price of landfill disposal and the overall level of prices faced by waste generators. In response, waste generators will look to reduce waste volumes that need to be disposed of off-site. The increase in the price of waste disposal at landfill will increase the price competitiveness of recycling options, leading to an expansion of waste volumes directed to these activities.
The extent to which waste disposal volumes will fall (Q0 – Q1 in Figure B2c) and economic costs that will be imposed on consumers and suppliers of landfill services (the area XYZ in Figure B2c), will depend on the responsiveness of demand for waste disposal and supply of landfill and recycling services to relative prices.
So - Supply of landfill services
Do - Demand for landfill
i
P0
Q0 Landfill Volume
Gate Fee or Price

Analysis of financial instruments for waste management in South Australia 22 June 2004
BDA Group and EconSearch 89
Po
P1
SR0
Figure B2a: Recycling Services
X
Z
QR1
Figure B2: Effect of a landfill levy on supply and demand for waste disposal
SLo
SL1
QLo
Figure B2b: Landfill
Do
S
QoQ1
Figure B2c: Waste generation & disposal
The demand for waste disposal (D0) is shown in figure B2c. Based on available options for waste minimisation and on-site recycling or reuse, it indicates the willingness of waste generators to pay for off-site disposal of waste, which ignoring illegal waste disposal is assumed to be either to landfill or to recycling / reuse activities. The availability and willingness of these activities to accept waste are shown in figures 6b and 6c respectively. The figures indicate an increasing willingness to accept waste as the price paid to them increases. The collective supply of waste disposal services from landfills and recyclers faced by waste generators is shown as (S0) in figure B2c. The quantity of waste generated and directed to off-site disposal (Q0) will be at the point where the marginal cost of reducing waste generation equals the marginal cost of off-site disposal (P0), which given competitive markets will be the same for both recycling and landfilling.
With an increase to the landfill levy equivalent to ‘a’ in figure B2b, shifts the landfill supply curve from SL0 to SL1, which flows through to the overall supply of waste disposal services faced by generators, shifting this function from S0 to S1. In response to the higher cost of off-site waste disposal now faced (P0), waste generators reduce waste generation volumes and / or increase on-site recycling, so that the total volume directed to off-site disposal falls to Q1.
As part of the levy is absorbed by landfill operators (ie; the gate price increase of P1 – P0 is less than the levy ‘a’) the effective return they receive falls and they are willing to accept less, and total volumes landfilled falls to QL1. With prices received by recyclers increasing, there is an expansion in recycling volumes from QR0 to QR1. The economic or ‘deadweight’ loss (shown as area XYZ in figure B2c) represents the extra cost to the economy of the additional waste minimisation and recycling, over and above what it would have cost previously to manage this waste.
Y
S1
a

Analysis of financial instruments for waste management in South Australia 22 June 2004
BDA Group and EconSearch 90
Empirical estimates of the price responsiveness (own-price elasticities) of demand and supply for waste disposal in South Australia were not available. Therefore, estimates were drawn from other sources and tested against basic economic principles to derive workable estimates for the purpose of this study.
Table B1 summaries some of the international literature on the price elasticity of waste disposal by different waste streams. Reported elasticities are generally inelastic, suggesting that waste disposal costs are more incidental to decisions regarding waste generation. In the absence of any Australian data, the US estimates seem most appropriate for use in the analysis and are more conservative than some of the other estimates. From the anecdotal evidence in other Australian states it appears that the price elasticity of demand for C&D waste disposal services is likely to be higher than for other wastes.
Table B1: Reported Estimates of the price elasticity of disposal of waste
Source Location Elasticity a
Household waste
• Wertz 1976 US -0.15
• Skumatz 1990 US -0.13
• Jenkins 1993 US -0.12
• Morris & Holthausen 1994 Perkasie -0.51 - 0.60
• Sterner & Bartelings 1999 Sweden -0.35
Commercial waste
• Skumatz/Jenkins -0.30 a A price elasticity of demand for waste disposal services of –0.15, for example, means that a
10% increase in price for the services will lead to a 1.5% fall in demand.
Economic principles also enable the above elasticities to be considered for specific application to waste disposal to landfills in Adelaide. Where there are limited opportunities for waste minimization or on-site recycling or reuse, the price elasticity of demand for waste disposal services will tend to be more inelastic. This is the case for municipal, commercial and industrial and landfill cover waste streams as compared to other waste streams in Adelaide where landfill diversion rates are substantial.
Information from ACT Waste90 on the quantities of different types of household waste going to landfill before and after the levy and charge increases in July 2000 show that waste streams are 90 RPM (2001), The actual cost of waste disposal in the ACT, report to ACT Waste, Department of Urban Services

Analysis of financial instruments for waste management in South Australia 22 June 2004
BDA Group and EconSearch 91
price sensitive (Table B2). The picture for changes in loads going to landfill by car and trailer is complicated because car load charges rose by 67% while trailer loads rose by 100%. There was thus significant shifting from trailer loads that dropped 52% to carloads, which increased by 124%. It is arguable that even though carloads increased with a price rise the figures still indicate price sensitivity, as people seemed to respond to a change in the differential price.
A clearer picture is available from other categories of waste delivery that experienced a price increase. For categories where prices rose 10% with the GST91, volumes fell by 2.5%, representing an elasticity of -0.25. This means that for a 1% increase in price there was a 0.25% reduction in volume going to landfill. For the categories of waste where prices rose by 32%92, ie from $25 to $33, volumes fell by 12.6%, representing a price elasticity of -0.39. The variation between different categories was significant, but in general volumes fell with the price rise.
Table B2: Price Elasticities
Type % volume Change
% Price Change
Price Elasticity
Total car/van 123 67 1.85
Total ute/trailer -52 100 -0.52
Categories with 10% price increase
-2.5 10 -0.25
Categories with 32% price increase
-12.6 32 -0.39
Source: RPM (2001)
Data for two periods are insufficient to derive reliable price elasticities, particularly for individual streams, which show wide variation in response. It is not possible to use individual price elasticities to estimate what would happen to individual waste streams in face of price changes. The most that can be said is that volumes are likely to decline somewhat as prices rise but relative price changes must be considered before drawing any conclusions.
Similarly, in Adelaide, the vast majority of household waste is collected through kerbside collection systems operating in each of the metropolitan council areas. For the most part, households are quite removed from market forces and the strength of price signals, conveyed through council rates, is relatively weak. For the purpose of this study, two demand price elasticities for waste disposal were used, both reflecting a relative inelastic response to changes in the price of waste 91 Tyres, asbestos, sullage, animal processing waste, animal carcasses and special burial. 92 Trade waste, litter van, builders’ spoil, clean fill (charged), garden waste (charged), radioactive waste, chemicals and other
ferrous waste.

Analysis of financial instruments for waste management in South Australia 22 June 2004
BDA Group and EconSearch 92
disposal services. Price responsiveness is assumed to be most inelastic in the sectors where the waste generators are most removed from the market signals (i.e. municipal and C&I). These elasticities are reported in Table B3.
Table B3: Assumed price elasticities of demand for disposal of waste in Adelaide
Type of waste Elasticity
Municipal waste -0.13
C&I waste -0.13
Cover material to landfill -0.13
C&D waste -0.30
Green waste -0.30
Biosolids -0.30
Regulated waste -0.30
The other key modelling assumptions required are the price elasticity of supply of landfill services and of recycling services. For the purpose of this study it was assumed that the supply of landfill services is highly elastic. In the short to medium term, capital costs associated with existing landfill capacity are sunk, and landfills would compete vigorously if an increasing levy were to result in declining disposal volumes. Although it is unclear what will happen in the Adelaide market following the closure of ACC’s Wingfield landfill, substantial investments have already been made in providing alternative landfill services and competition for landfill is expected to be strong.
Little information is available on recycling supply elasticities. For some waste streams and regions, economies of size may limit the price responsiveness of recycling. In other instances, high capital establishment costs, variable recyclate quality and volatile end-product prices may similarly weaken price responsiveness.
Palmer et al93 reviewed the own price supply elasticities for materials from recyclate collectors from municipal solid wastes in the US, drawing mainly on econometric studies and a few engineering
93 Palmer, Sigman and Wallis (1996), The cost of reducing Municipal Solid Waste, Discussion Paper 96-35, Resources for the
Future, Washington
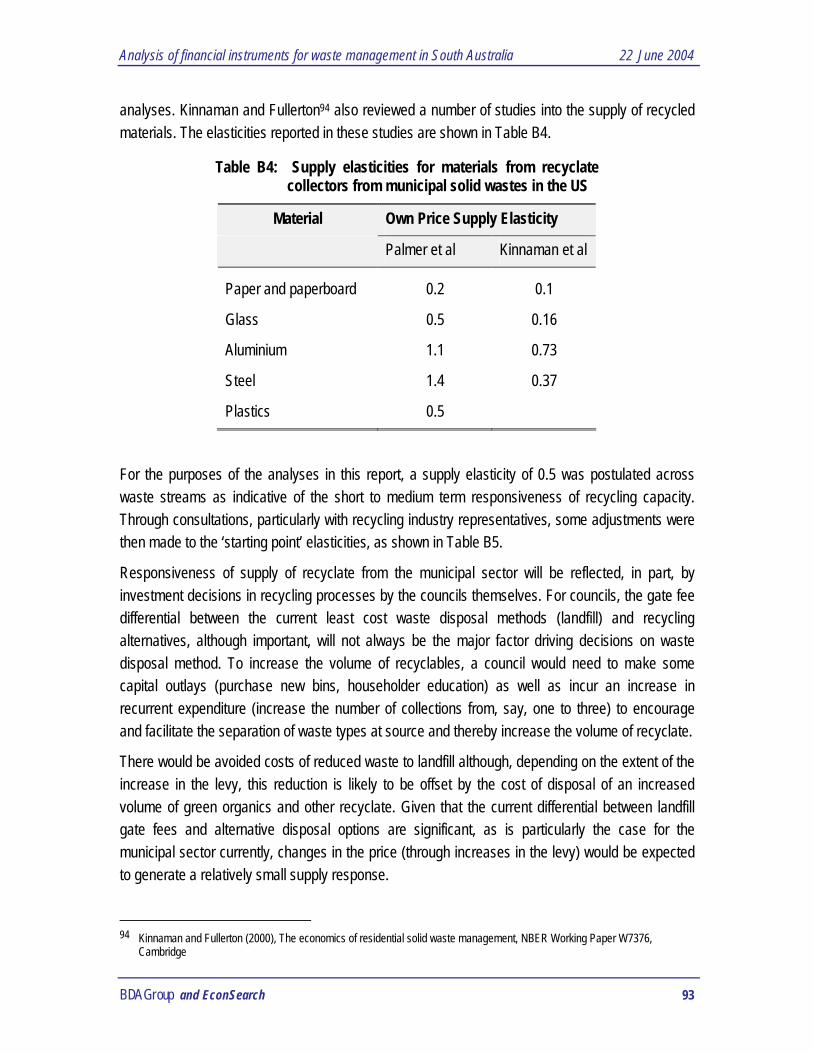
Analysis of financial instruments for waste management in South Australia 22 June 2004
BDA Group and EconSearch 93
analyses. Kinnaman and Fullerton94 also reviewed a number of studies into the supply of recycled materials. The elasticities reported in these studies are shown in Table B4.
Table B4: Supply elasticities for materials from recyclate collectors from municipal solid wastes in the US
Material Own Price Supply Elasticity
Palmer et al Kinnaman et al
Paper and paperboard 0.2 0.1
Glass 0.5 0.16
Aluminium 1.1 0.73
Steel 1.4 0.37
Plastics 0.5
For the purposes of the analyses in this report, a supply elasticity of 0.5 was postulated across waste streams as indicative of the short to medium term responsiveness of recycling capacity. Through consultations, particularly with recycling industry representatives, some adjustments were then made to the ‘starting point’ elasticities, as shown in Table B5.
Responsiveness of supply of recyclate from the municipal sector will be reflected, in part, by investment decisions in recycling processes by the councils themselves. For councils, the gate fee differential between the current least cost waste disposal methods (landfill) and recycling alternatives, although important, will not always be the major factor driving decisions on waste disposal method. To increase the volume of recyclables, a council would need to make some capital outlays (purchase new bins, householder education) as well as incur an increase in recurrent expenditure (increase the number of collections from, say, one to three) to encourage and facilitate the separation of waste types at source and thereby increase the volume of recyclate.
There would be avoided costs of reduced waste to landfill although, depending on the extent of the increase in the levy, this reduction is likely to be offset by the cost of disposal of an increased volume of green organics and other recyclate. Given that the current differential between landfill gate fees and alternative disposal options are significant, as is particularly the case for the municipal sector currently, changes in the price (through increases in the levy) would be expected to generate a relatively small supply response.
94 Kinnaman and Fullerton (2000), The economics of residential solid waste management, NBER Working Paper W7376,
Cambridge
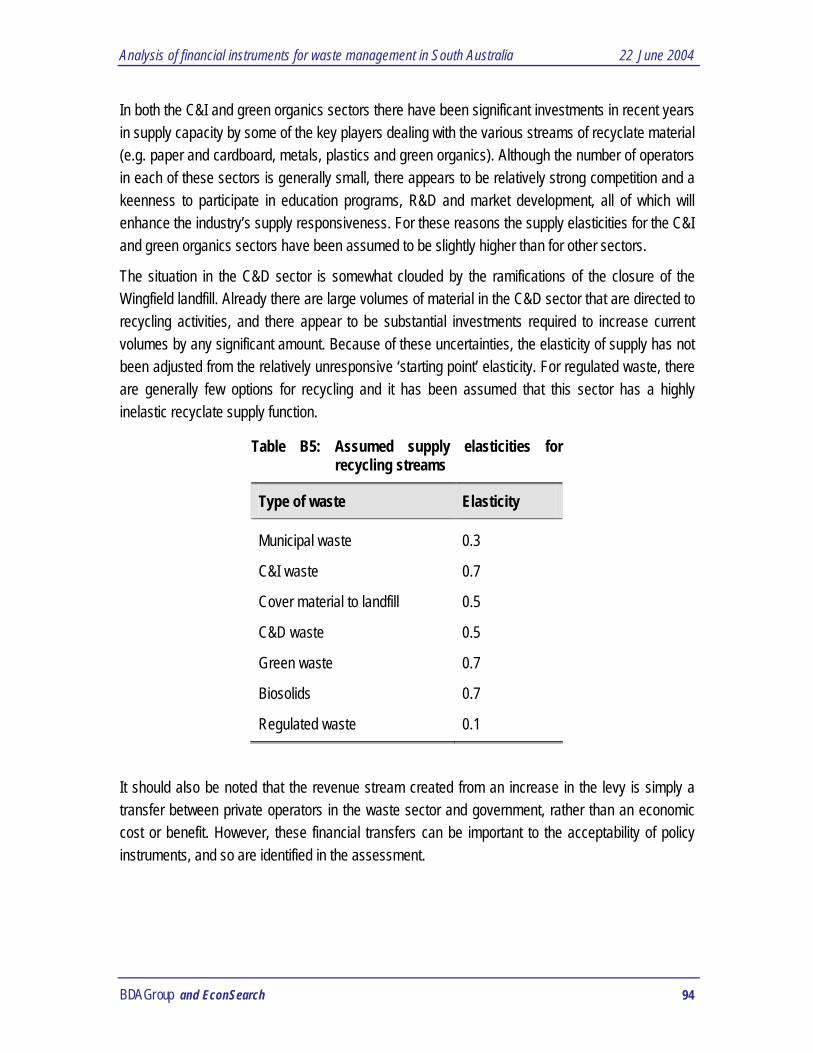
Analysis of financial instruments for waste management in South Australia 22 June 2004
BDA Group and EconSearch 94
In both the C&I and green organics sectors there have been significant investments in recent years in supply capacity by some of the key players dealing with the various streams of recyclate material (e.g. paper and cardboard, metals, plastics and green organics). Although the number of operators in each of these sectors is generally small, there appears to be relatively strong competition and a keenness to participate in education programs, R&D and market development, all of which will enhance the industry’s supply responsiveness. For these reasons the supply elasticities for the C&I and green organics sectors have been assumed to be slightly higher than for other sectors.
The situation in the C&D sector is somewhat clouded by the ramifications of the closure of the Wingfield landfill. Already there are large volumes of material in the C&D sector that are directed to recycling activities, and there appear to be substantial investments required to increase current volumes by any significant amount. Because of these uncertainties, the elasticity of supply has not been adjusted from the relatively unresponsive ‘starting point’ elasticity. For regulated waste, there are generally few options for recycling and it has been assumed that this sector has a highly inelastic recyclate supply function.
Table B5: Assumed supply elasticities for recycling streams
Type of waste Elasticity
Municipal waste 0.3
C&I waste 0.7
Cover material to landfill 0.5
C&D waste 0.5
Green waste 0.7
Biosolids 0.7
Regulated waste 0.1
It should also be noted that the revenue stream created from an increase in the levy is simply a transfer between private operators in the waste sector and government, rather than an economic cost or benefit. However, these financial transfers can be important to the acceptability of policy instruments, and so are identified in the assessment.
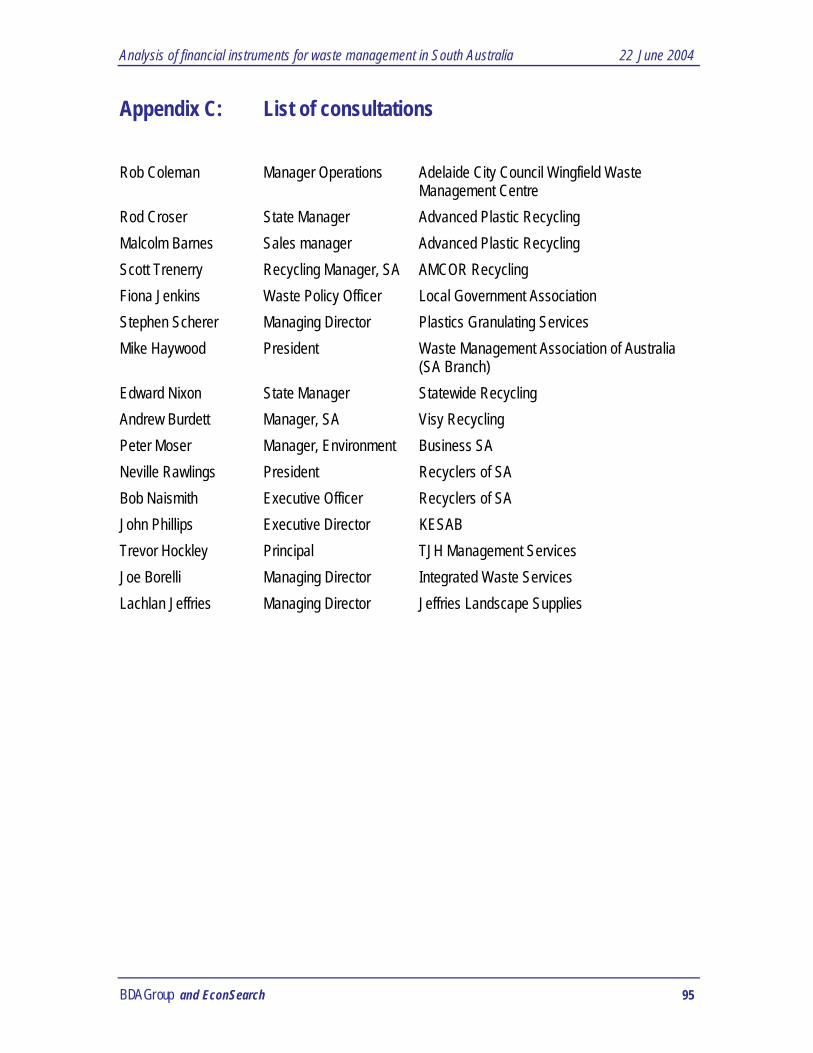
Analysis of financial instruments for waste management in South Australia 22 June 2004
BDA Group and EconSearch 95
Appendix C: List of consultations Rob Coleman Manager Operations Adelaide City Council Wingfield Waste Management Centre Rod Croser State Manager Advanced Plastic Recycling Malcolm Barnes Sales manager Advanced Plastic Recycling Scott Trenerry Recycling Manager, SA AMCOR Recycling Fiona Jenkins Waste Policy Officer Local Government Association Stephen Scherer Managing Director Plastics Granulating Services Mike Haywood President Waste Management Association of Australia (SA Branch) Edward Nixon State Manager Statewide Recycling Andrew Burdett Manager, SA Visy Recycling Peter Moser Manager, Environment Business SA Neville Rawlings President Recyclers of SA Bob Naismith Executive Officer Recyclers of SA John Phillips Executive Director KESAB Trevor Hockley Principal TJH Management Services Joe Borelli Managing Director Integrated Waste Services Lachlan Jeffries Managing Director Jeffries Landscape Supplies