analysis of lion air's competitive strategy in … · pt. lion mentari air, hereinafter...
TRANSCRIPT
ANALYSIS OF LION AIR'S COMPETITIVE STRATEGY IN
BUSINESS COMPETITION FOR SCHEDULED AIR TRANSPORT
SERVICES IN INDONESIA
Tiarto1 1. Sekolah Tinggi Penerbangan Indonesia
corresponding author: [email protected].
Abstract: Currently, Lion is in big trouble. The aim of this research is to analyze the
application competitive strategy of Low Cost Carrier (LCC) taken by Lion in business
competition of scheduled commercial air transport services in Indonesia. Through
measurement of market concentration : Concentration Ratio (CR), Index (HHI) and
number of equal sellers Lion has won the competition as the largest market share holder
since 2007 until now. Its success is because Lion is able to successfully cope with five
competitive forces (Porter) : (1) buyer, (2) suppliers, (3) substitution, (4) newcomers,
(5) rivalries, with LCC strategy. LCC can last long but not forever. The evolution of the
value industry of the LCC strategy of excellence declined, pushing a heavy burden for
Lion. Urgent need of strategy or other new business model, with strategic partners
(domestic and foreign) to maintain and even improve company performance in the
framework of Sustainable Competitive Advantage (SCA). Keywords: Market Concentration, Low Cost Carrier (LCC), Competition.
Introduction
PT. Lion Mentari Air, hereinafter abbreviated Lion, is the first airline company
in Indonesia to declare itself as a Low Cost Carrier (LCC).
Through vision “We Make People Fly” want to give the image to the public that
anyone can fly with Lion at affordable (www. Lionair,co.id).
Lion’s initial business capital has only 1 (one) aircraft, approximately seven
years later since 1999 has been able to dominate the aviation business in
Indonesia. (Peter F. Drucker n.d.) defines business as an organization that adds
value and creates wealth. Therefore, on November 18, 2011 President Director
of Lion, Rusdi Kirana has signed a purchase contract of 230 units of B737 aircraft
worth US.$21.7 billion or equivalent to 195 trillion rupiah. Then in March 2013
also signed another contract purchase of 234 Airbus aircraft worth US.$24 billion
or 230.4 trillion rupiah. It is planned that by 2027 the number of Lion’s fleets
will reach 770 aircraft (Indonesiareview.com)
194Copyright © 2018, the Authors. Published by Atlantis Press. This is an open access article under the CC BY-NC license (http://creativecommons.org/licenses/by-nc/4.0/).
Advances in Engineering Research (AER), volume 147Conference on Global Research on Sustainable Transport (GROST 2017)
The results of the study (Indra S. et. Al., 2015) in the Journal of Transportation
and Logistics Management (JMTRANSLOG) STMT Trisakti, concluded that
airlines deregulation led to the emergence of low-cost new airlines. Previously
by (Kuntjoroadi, Wibowo, Safitri, Nurul;, 2009) in Journal of Business &
Bureaucracy University of Indonesia, stated that based on analysis of BCG
matrix (Boston Consulting Group), Garuda’s competitive position was in the
“star” position until 2007, which means that Garuda has a relative high market
share in the growth of the airlines industry market in Indonesia.
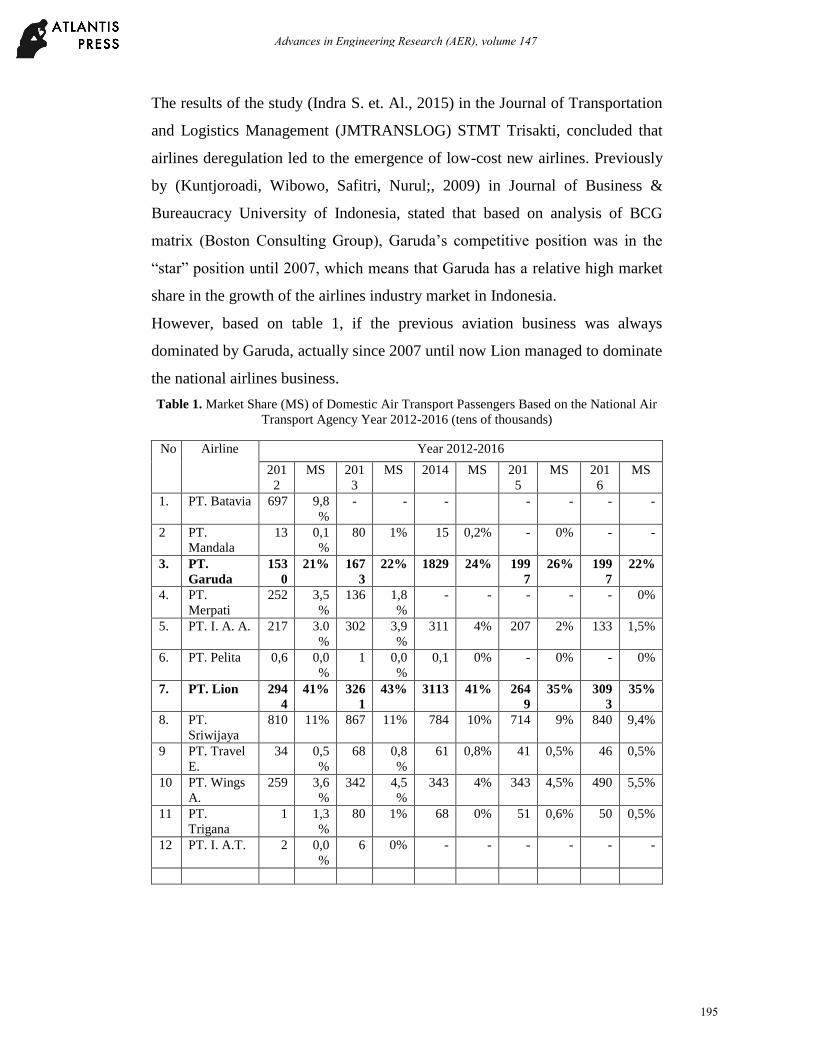
However, based on table 1, if the previous aviation business was always
dominated by Garuda, actually since 2007 until now Lion managed to dominate
the national airlines business.
Table 1. Market Share (MS) of Domestic Air Transport Passengers Based on the National Air
Transport Agency Year 2012-2016 (tens of thousands)
No Airline Year 2012-2016
201
2
MS 201
3
MS 2014 MS 201
5
MS 201
6
MS
1. PT. Batavia 697 9,8
%
- - - - - - -
2 PT.
Mandala
13 0,1
%
80 1% 15 0,2% - 0% - -
3. PT.
Garuda
153
0
21% 167
3
22% 1829 24% 199
7
26% 199
7
22%
4. PT.
Merpati
252 3,5
%
136 1,8
%
- - - - - 0%
5. PT. I. A. A. 217 3.0
%
302 3,9
%
311 4% 207 2% 133 1,5%
6. PT. Pelita 0,6 0,0
%
1 0,0
%
0,1 0% - 0% - 0%
7. PT. Lion 294
4
41% 326
1
43% 3113 41% 264
9
35% 309
3
35%
8. PT.
Sriwijaya
810 11% 867 11% 784 10% 714 9% 840 9,4%
9 PT. Travel
E.
34 0,5
%
68 0,8
%
61 0,8% 41 0,5% 46 0,5%
10 PT. Wings
A.
259 3,6
%
342 4,5
%
343 4% 343 4,5% 490 5,5%
11 PT.
Trigana
1 1,3
%
80 1% 68 0% 51 0,6% 50 0,5%
12 PT. I. A.T. 2 0,0
%
6 0% - - - - - -
195
Advances in Engineering Research (AER), volume 147
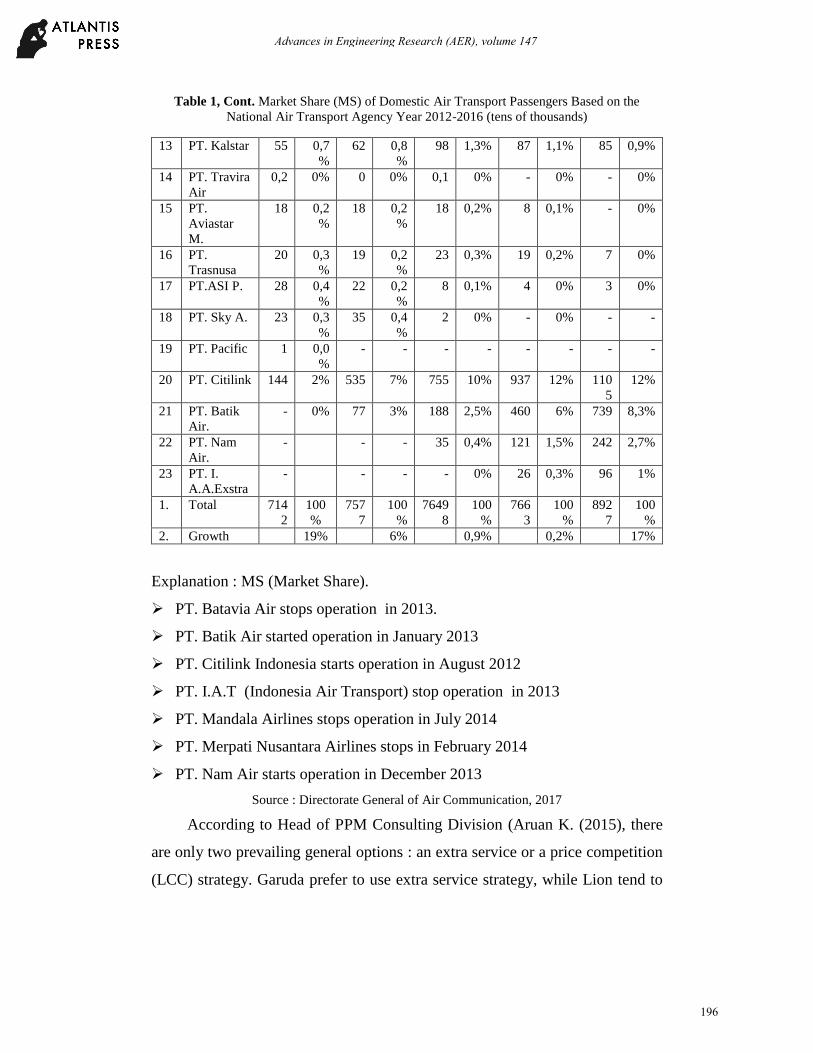
Table 1, Cont. Market Share (MS) of Domestic Air Transport Passengers Based on the
National Air Transport Agency Year 2012-2016 (tens of thousands)
Explanation : MS (Market Share).
PT. Batavia Air stops operation in 2013.
PT. Batik Air started operation in January 2013
PT. Citilink Indonesia starts operation in August 2012
PT. I.A.T (Indonesia Air Transport) stop operation in 2013
PT. Mandala Airlines stops operation in July 2014
PT. Merpati Nusantara Airlines stops in February 2014
PT. Nam Air starts operation in December 2013
Source : Directorate General of Air Communication, 2017
According to Head of PPM Consulting Division (Aruan K. (2015), there
are only two prevailing general options : an extra service or a price competition
(LCC) strategy. Garuda prefer to use extra service strategy, while Lion tend to
13 PT. Kalstar 55 0,7
%
62 0,8
%
98 1,3% 87 1,1% 85 0,9%
14 PT. Travira
Air
0,2 0% 0 0% 0,1 0% - 0% - 0%
15 PT.
Aviastar
M.
18 0,2
%
18 0,2
%
18 0,2% 8 0,1% - 0%
16 PT.
Trasnusa
20 0,3
%
19 0,2
%
23 0,3% 19 0,2% 7 0%
17 PT.ASI P. 28 0,4
%
22 0,2
%
8 0,1% 4 0% 3 0%
18 PT. Sky A. 23 0,3
%
35 0,4
%
2 0% - 0% - -
19 PT. Pacific 1 0,0
%
- - - - - - - -
20 PT. Citilink 144 2% 535 7% 755 10% 937 12% 110
5
12%
21 PT. Batik
Air.
- 0% 77 3% 188 2,5% 460 6% 739 8,3%
22 PT. Nam
Air.
- - - 35 0,4% 121 1,5% 242 2,7%
23 PT. I.
A.A.Exstra
- - - - 0% 26 0,3% 96 1%
1. Total 714
2
100
%
757
7
100
%
7649
8
100
%
766
3
100
%
892
7
100
%
2. Growth 19% 6% 0,9% 0,2% 17%
196
Advances in Engineering Research (AER), volume 147

price competition strategy LCC. LCC or no frills is a competitive strategy of
overall cost advantage that is more specific to the aviation business. The
tendency of passengers to choose LCC flights encourages more airlines to
compete to offer LCC. As a result, they are worried about loosing customer if
they continue to run only one strategy. When the strategy changed, Lion holding
LCC flights as well as full service flights, and vice versa, Garuda instead of full
service flights also penetrated the LCC flight. They are also forming strategic
alliances with their partners. Garuda with its subsidiary Citilink, the same thing
is also known by Lion with his subsidiary Batik Air. If Citilink is set up to
compete against the Lion in its low-cost competition strategy (LCC), Batik Air
to compete against Garuda in terms of premium price (full service). The same
thing was done by Sriwijaya Air with its subsidiary Nam Air, as well as Indonesia
Air Asia with Indonesia Air Asia Extra.
Now almost all airlines run the same strategy. The reason for the flexibility
of organization is as if the division of tasks or roles - Lion for LCC air travelers,
while Batik Air has a role in running a full service strategy. Therefore, Lion,
Garuda, Sriwijaya and other airlines doing the same thing did not present
anything. As (Magretta, 2012) : "When you change strategy with flexibility, your
organization will never represent anything or be good in anything". This is
because the airlines in question at the same time serve the same customers and
meet the same needs and sell the price with the same relative price. This means
Lion has not had a strategy, because the Lion is now run the same as other
airlines.
In addition, the LCC's superiority exerts a heavy burden on Lion to maintain its
position, which means reinvestment of capital for modern equipment, the
unquestionable disposal of the wealth of old aircraft that has been worn.
Therefore in 2011 and 2013 Lion has ordered 464 aircraft from Boeing and
Airbus. Now the aircraft began to arrive and it was difficult for delivery to be
postponed. To make money, the planes must fly. To be able to fly there must be
197
Advances in Engineering Research (AER), volume 147
a permit to fly. Flight approval covers the need for hard and soft infrastructures.
Hard infrastructure on domestic flights is the problem of airport density, the
depletion of aircraft parking at airports in Indonesia. While the infrastructure is
primarily the right to fly (traffic right). The number of passengers transported has
risen more than 10 times than before the deregulation, but since the economic
crisis there is no new airport development (beritatransnews.co.id, 2015). This
means Lion must focus on foreign flights, but this too many obstacles. In order
to utilize the aircraft and the development of market share Lion is trying to
establish cooperation with foreign partners : Malaysia, Thailand, Sri Lanka,
Vietnam, Australia and so on but only interested Malindo Airways from
Malaysia (Gerryonline.blogspot.co.id, 2015). The many problems make great
difficulty for Lion (Rosyid 1999).
Method
This research uses approach of conception of building/constructivism approach
(Haula R, 2011). This is an industrial economic policy study focused on the use
of five industrial structural strength evaluations by Porter (2008). Data were
extracted and obtained through literature studies, in-depth interviews and intense
discussions with practitioners in the field of aviation. Data and information
obtained from several institutions. In the instant the government is conducted at
the Directorate of Air Transportation, Directorate General of Civil Aviation, at
non government institutions such as INACA (Indonesian National Air Carrier
Association) and KPPU (Business Competition Supervisory Commission). As
key informant General Director of Air Transportation. The analyzed policies
cover several aspects in the field of air transport operations in Indonesia
contained in : Flight Laws No. 15/1992 and its successor no. : 1/2009). While in
the aviation industry focused on airlines Lion and Garuda.
The results and discussion are based on the main elements of the market
structure. In measuring the market concentration, two tools are used: 1) The
198
Advances in Engineering Research (AER), volume 147
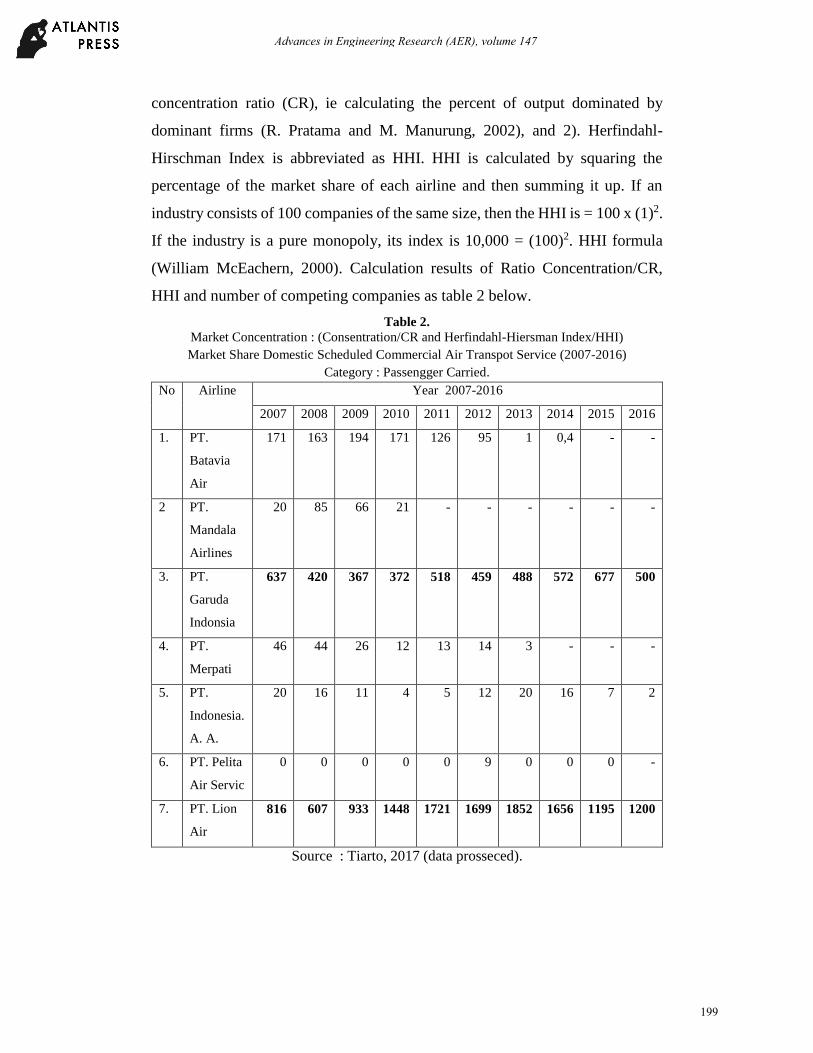
concentration ratio (CR), ie calculating the percent of output dominated by
dominant firms (R. Pratama and M. Manurung, 2002), and 2). Herfindahl-
Hirschman Index is abbreviated as HHI. HHI is calculated by squaring the
percentage of the market share of each airline and then summing it up. If an
industry consists of 100 companies of the same size, then the HHI is = 100 x (1)2.
If the industry is a pure monopoly, its index is 10,000 = (100)2. HHI formula
(William McEachern, 2000). Calculation results of Ratio Concentration/CR,
HHI and number of competing companies as table 2 below.
Table 2.
Market Concentration : (Consentration/CR and Herfindahl-Hiersman Index/HHI)
Market Share Domestic Scheduled Commercial Air Transpot Service (2007-2016)
Category : Passengger Carried.
No Airline Year 2007-2016
2007 2008 2009 2010 2011 2012 2013 2014 2015 2016
1. PT.
Batavia
Air
171 163 194 171 126 95 1 0,4 - -
2 PT.
Mandala
Airlines
20 85 66 21 - - - - - -
3. PT.
Garuda
Indonsia
637 420 367 372 518 459 488 572 677 500
4. PT.
Merpati
46 44 26 12 13 14 3 - - -
5. PT.
Indonesia.
A. A.
20 16 11 4 5 12 20 16 7 2
6. PT. Pelita
Air Servic
0 0 0 0 0 9 0 0 0 -
7. PT. Lion
Air
816 607 933 1448 1721 1699 1852 1656 1195 1200
Source : Tiarto, 2017 (data prosseced).
199
Advances in Engineering Research (AER), volume 147
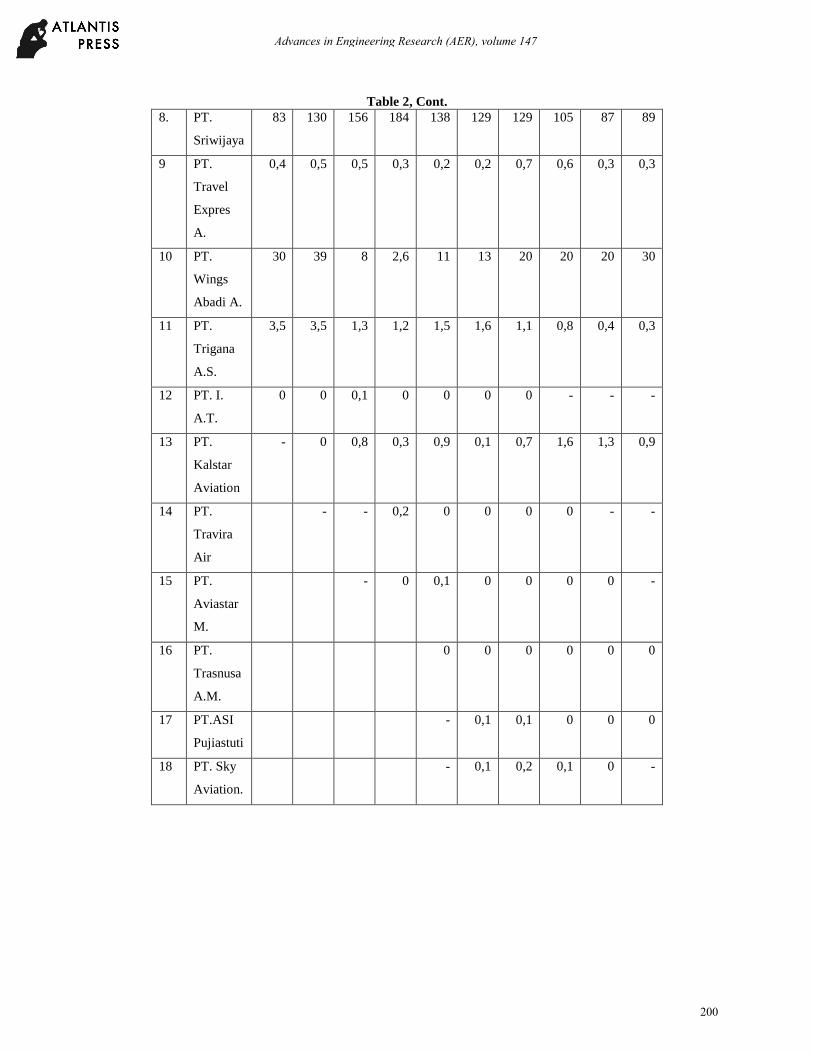
Table 2, Cont.
8. PT.
Sriwijaya
83 130 156 184 138 129 129 105 87 89
9 PT.
Travel
Expres
A.
0,4 0,5 0,5 0,3 0,2 0,2 0,7 0,6 0,3 0,3
10 PT.
Wings
Abadi A.
30 39 8 2,6 11 13 20 20 20 30
11 PT.
Trigana
A.S.
3,5 3,5 1,3 1,2 1,5 1,6 1,1 0,8 0,4 0,3
12 PT. I.
A.T.
0 0 0,1 0 0 0 0 - - -
13 PT.
Kalstar
Aviation
- 0 0,8 0,3 0,9 0,1 0,7 1,6 1,3 0,9
14 PT.
Travira
Air
- - 0,2 0 0 0 0 - -
15 PT.
Aviastar
M.
- 0 0,1 0 0 0 0 -
16 PT.
Trasnusa
A.M.
0 0 0 0 0 0
17 PT.ASI
Pujiastuti
- 0,1 0,1 0 0 0
18 PT. Sky
Aviation.
- 0,1 0,2 0,1 0 -
200
Advances in Engineering Research (AER), volume 147
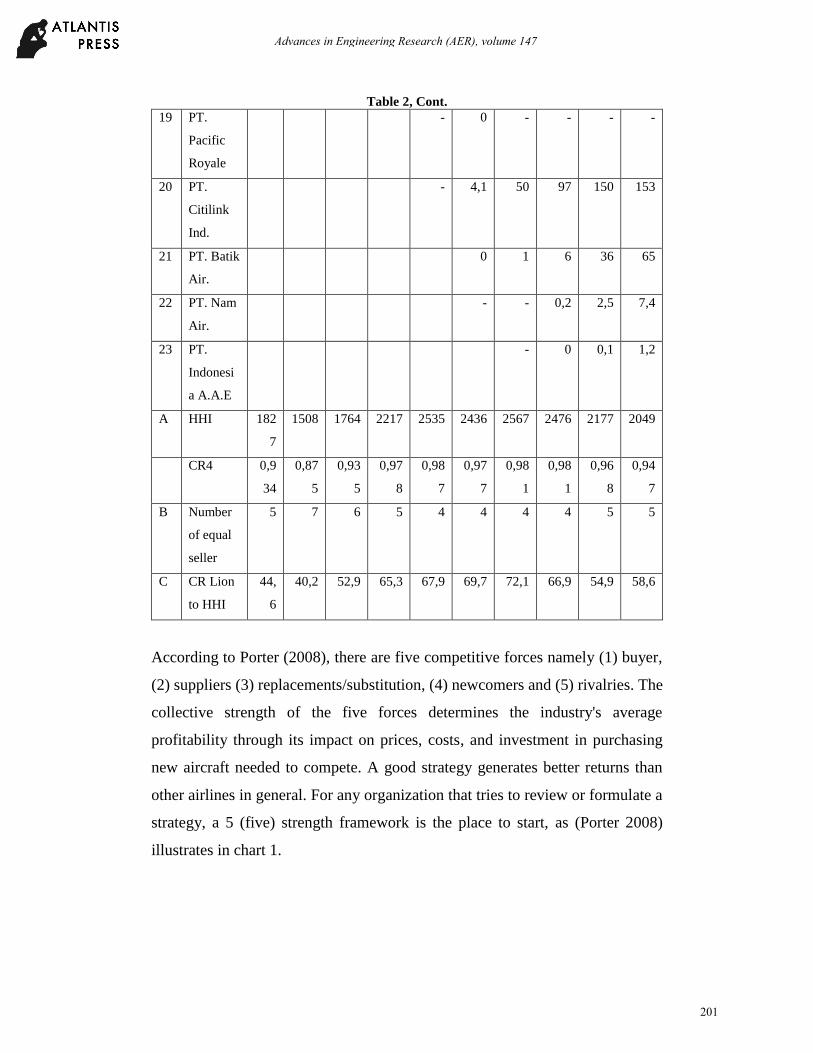
Table 2, Cont.
19 PT.
Pacific
Royale
- 0 - - - -
20 PT.
Citilink
Ind.
- 4,1 50 97 150 153
21 PT. Batik
Air.
0 1 6 36 65
22 PT. Nam
Air.
- - 0,2 2,5 7,4
23 PT.
Indonesi
a A.A.E
- 0 0,1 1,2
A HHI 182
7
1508 1764 2217 2535 2436 2567 2476 2177 2049
CR4 0,9
34
0,87
5
0,93
5
0,97
8
0,98
7
0,97
7
0,98
1
0,98
1
0,96
8
0,94
7
B Number
of equal
seller
5 7 6 5 4 4 4 4 5 5
C CR Lion
to HHI
44,
6
40,2 52,9 65,3 67,9 69,7 72,1 66,9 54,9 58,6
According to Porter (2008), there are five competitive forces namely (1) buyer,
(2) suppliers (3) replacements/substitution, (4) newcomers and (5) rivalries. The
collective strength of the five forces determines the industry's average
profitability through its impact on prices, costs, and investment in purchasing
new aircraft needed to compete. A good strategy generates better returns than
other airlines in general. For any organization that tries to review or formulate a
strategy, a 5 (five) strength framework is the place to start, as (Porter 2008)
illustrates in chart 1.
201
Advances in Engineering Research (AER), volume 147
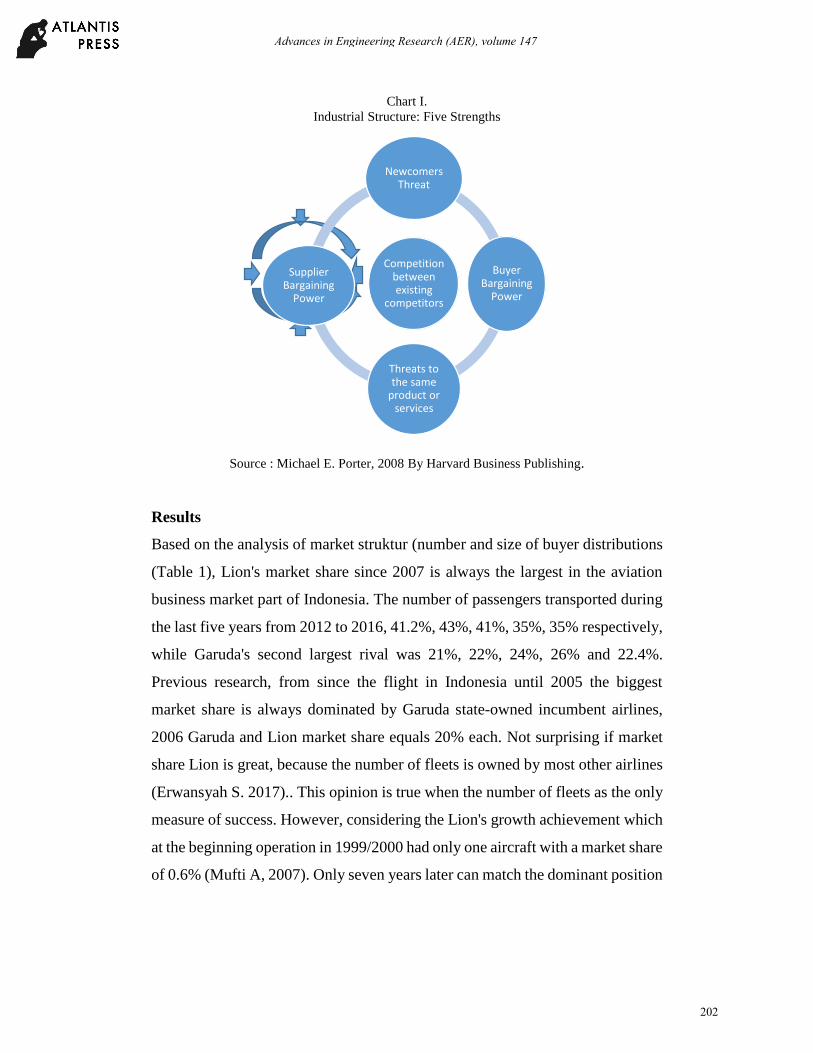
Chart I.
Industrial Structure: Five Strengths
Source : Michael E. Porter, 2008 By Harvard Business Publishing.
Results
Based on the analysis of market struktur (number and size of buyer distributions
(Table 1), Lion's market share since 2007 is always the largest in the aviation
business market part of Indonesia. The number of passengers transported during
the last five years from 2012 to 2016, 41.2%, 43%, 41%, 35%, 35% respectively,
while Garuda's second largest rival was 21%, 22%, 24%, 26% and 22.4%.
Previous research, from since the flight in Indonesia until 2005 the biggest
market share is always dominated by Garuda state-owned incumbent airlines,
2006 Garuda and Lion market share equals 20% each. Not surprising if market
share Lion is great, because the number of fleets is owned by most other airlines
(Erwansyah S. 2017).. This opinion is true when the number of fleets as the only
measure of success. However, considering the Lion's growth achievement which
at the beginning operation in 1999/2000 had only one aircraft with a market share
of 0.6% (Mufti A, 2007). Only seven years later can match the dominant position
Competition between existing
competitors
Newcomers Threat
Buyer Bargaining
Power
Threats to the same
product or services
Supplier Bargaining
Power
202
Advances in Engineering Research (AER), volume 147

of Garuda to 20%, and since 2007 as the largest market share holder, it seems
difficult to argue that Lion does have superior performance. As Magretta J.
(2012) points out: “competitive advantage is not how to beat rivals, it's about
creating superior value. Business competition is about struggle for profit”. Lion
excelled not only in terms of the size of the market he achieved but also excelled
in the value chain created in-between the LCC’s business strategy.
Based on the analysis of market concentration (Ratio Concentration/CR, HHI
Index, and number competing companies are as follow (table 2).CR4 is the
concentration ratio in the 4 (four) largest companies. CR4 always shows high
above 0,90 (90%), meaning that the market is concentrated in the 4 (four) large
airlines. It also shows that the national aviation industry belongs to the oligopoly
market category, since few companies are in the market. Likewise HHI shows
average above >1800, meaning that the market is classified with high
concentration.
Next column B table 2, is the number of companies that can can compete. This
figure is obtained from 1 divided by HHI. For example in 2016 amounted to 4,8
(rounded 5), meaning the number of airlines that can compete as many as 5
airlines. From the data above shows that airlines that can compete show decrease,
meaning that can compete to be a little, because it is concentrated on the
dominant players,
203
Advances in Engineering Research (AER), volume 147
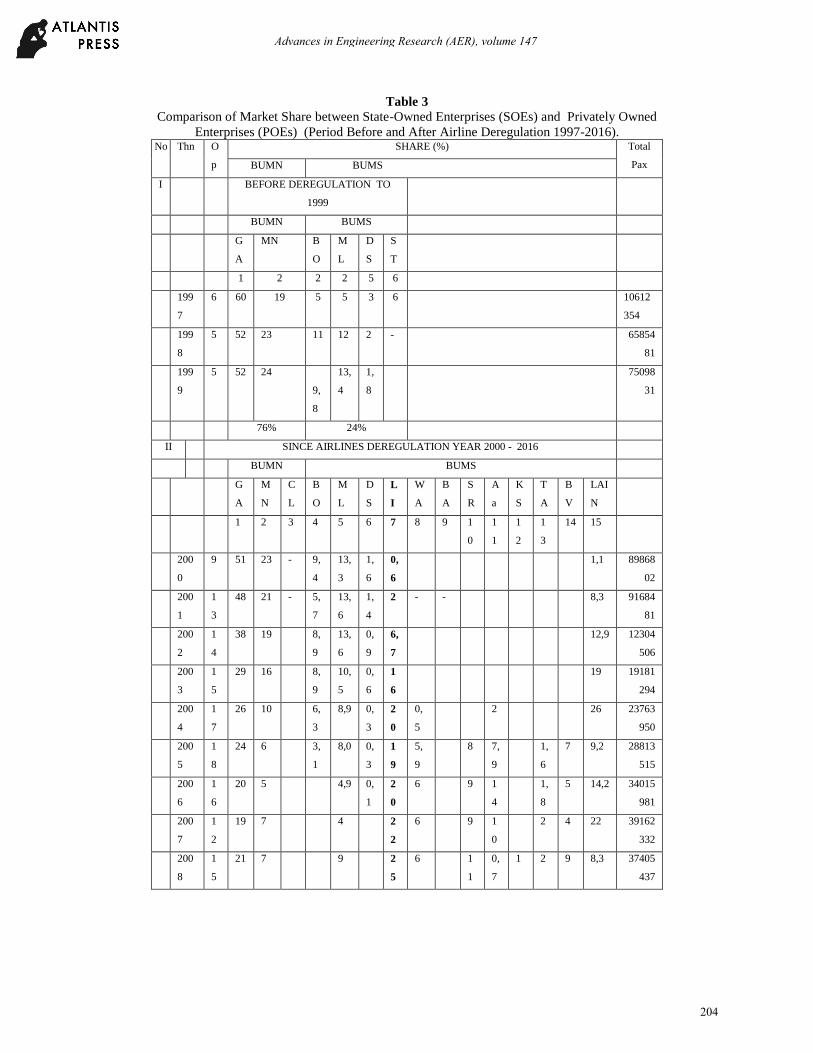
Table 3
Comparison of Market Share between State-Owned Enterprises (SOEs) and Privately Owned
Enterprises (POEs) (Period Before and After Airline Deregulation 1997-2016). No Thn O
p
SHARE (%) Total
Pax BUMN BUMS
I BEFORE DEREGULATION TO
1999
BUMN BUMS
G
A
MN B
O
M
L
D
S
S
T
1 2 2 2 5 6
199
7
6 60 19 5 5 3 6 10612
354
199
8
5 52 23 11 12 2 - 65854
81
199
9
5 52 24
9,
8
13,
4
1,
8
75098
31
76% 24%
II SINCE AIRLINES DEREGULATION YEAR 2000 - 2016
BUMN BUMS
G
A
M
N
C
L
B
O
M
L
D
S
L
I
W
A
B
A
S
R
A
a
K
S
T
A
B
V
LAI
N
1 2 3 4 5 6 7 8 9 1
0
1
1
1
2
1
3
14 15
200
0
9 51 23 - 9,
4
13,
3
1,
6
0,
6
1,1 89868
02
200
1
1
3
48 21 - 5,
7
13,
6
1,
4
2 - - 8,3 91684
81
200
2
1
4
38 19 8,
9
13,
6
0,
9
6,
7
12,9 12304
506
200
3
1
5
29 16 8,
9
10,
5
0,
6
1
6
19 19181
294
200
4
1
7
26 10 6,
3
8,9 0,
3
2
0
0,
5
2 26 23763
950
200
5
1
8
24 6 3,
1
8,0 0,
3
1
9
5,
9
8 7,
9
1,
6
7 9,2 28813
515
200
6
1
6
20 5 4,9 0,
1
2
0
6 9 1
4
1,
8
5 14,2 34015
981
200
7
1
2
19 7 4 2
2
6 9 1
0
2 4 22 39162
332
200
8
1
5
21 7 9 2
5
6 1
1
0,
7
1 2 9 8,3 37405
437
204
Advances in Engineering Research (AER), volume 147
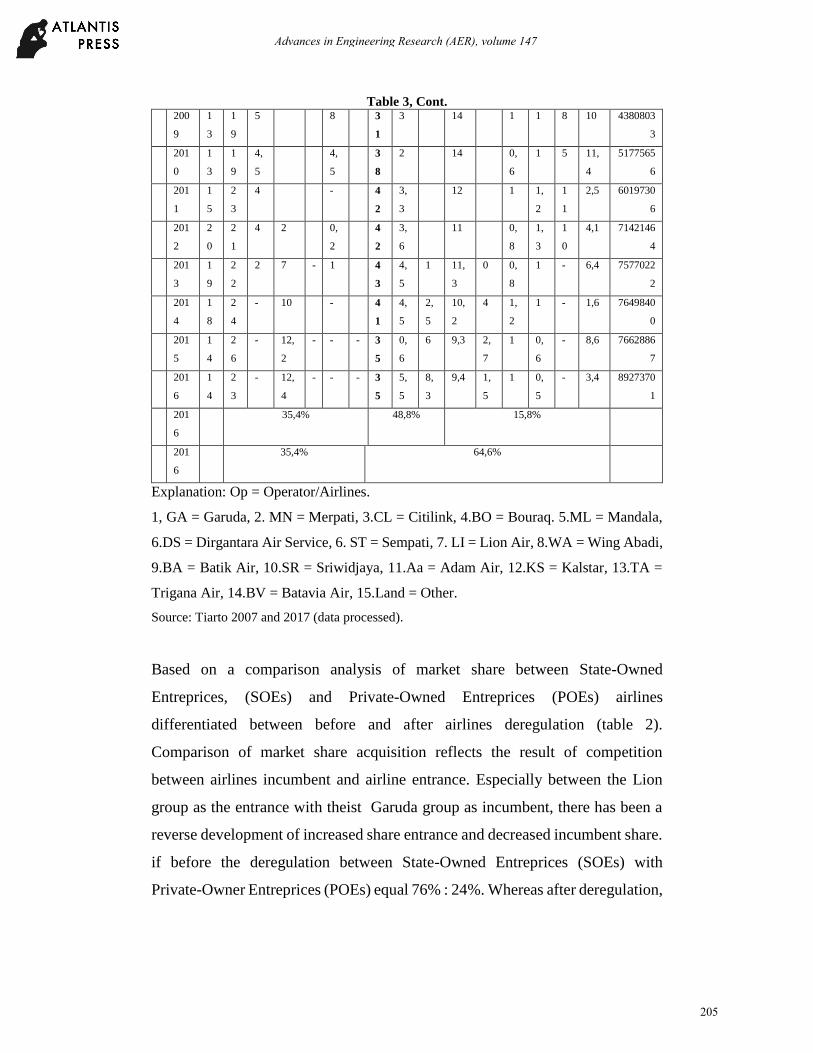
Table 3, Cont. 200
9
1
3
1
9
5 8 3
1
3 14 1 1 8 10 4380803
3
201
0
1
3
1
9
4,
5
4,
5
3
8
2 14 0,
6
1 5 11,
4
5177565
6
201
1
1
5
2
3
4 - 4
2
3,
3
12 1 1,
2
1
1
2,5 6019730
6
201
2
2
0
2
1
4 2 0,
2
4
2
3,
6
11 0,
8
1,
3
1
0
4,1 7142146
4
201
3
1
9
2
2
2 7 - 1 4
3
4,
5
1 11,
3
0 0,
8
1 - 6,4 7577022
2
201
4
1
8
2
4
- 10 - 4
1
4,
5
2,
5
10,
2
4 1,
2
1 - 1,6 7649840
0
201
5
1
4
2
6
- 12,
2
- - - 3
5
0,
6
6 9,3 2,
7
1 0,
6
- 8,6 7662886
7
201
6
1
4
2
3
- 12,
4
- - - 3
5
5,
5
8,
3
9,4 1,
5
1 0,
5
- 3,4 8927370
1
201
6
35,4% 48,8% 15,8%
201
6
35,4% 64,6%
Explanation: Op = Operator/Airlines.
1, GA = Garuda, 2. MN = Merpati, 3.CL = Citilink, 4.BO = Bouraq. 5.ML = Mandala,
6.DS = Dirgantara Air Service, 6. ST = Sempati, 7. LI = Lion Air, 8.WA = Wing Abadi,
9.BA = Batik Air, 10.SR = Sriwidjaya, 11.Aa = Adam Air, 12.KS = Kalstar, 13.TA =
Trigana Air, 14.BV = Batavia Air, 15.Land = Other.
Source: Tiarto 2007 and 2017 (data processed).
Based on a comparison analysis of market share between State-Owned
Entreprices, (SOEs) and Private-Owned Entreprices (POEs) airlines
differentiated between before and after airlines deregulation (table 2).
Comparison of market share acquisition reflects the result of competition
between airlines incumbent and airline entrance. Especially between the Lion
group as the entrance with theist Garuda group as incumbent, there has been a
reverse development of increased share entrance and decreased incumbent share.
if before the deregulation between State-Owned Entreprices (SOEs) with
Private-Owner Entreprices (POEs) equal 76% : 24%. Whereas after deregulation,
205
Advances in Engineering Research (AER), volume 147

its growth reversed. For example for 2016 to be 35.4%: 64.6% (table 2). The
largest growth was dominated by Lion group airline which reached 48.8% of the
total market share of aviation business in Indonesia.
Result and Discussion
The results show Lion's biggest market share since 2007 until now. This
shows that Lion's competitive strategy is superior to competitors. According to
the author's description analysis, it is influenced by price competition strategy
(LCC). As a newcomer to overcome barriers to entry cheaper than competitors.
Lion approaches: (1) reducing product costs, always trying to find ways to
produce products at lower cost than competitors. (2) entering the market by
selecting fat routes at an affordable price. Sacrificing short-term profits to compel
competitors to market for airlines Garuda, Merpati, Bouraq, Mandala etc.
Lion undertakes strategic alliances with partners (domestic and overseas)
and in particular with Wing Abadi and Batik Air not only in efforts to develop
market markets, as well as in order to avoid allegations of monopolistic practices
and unfair business competition. This is because the Lion competing position has
been in the approximate market share (50% and/or 75%) as meant in Article 27
paragraphs 1 and 2 of Law No. 5 of 1999.
Lion started his business with Michael E. Porter (2008) approach with 5
(five) competitive forces. To cope successfully with the five competitive forces
and thereby get a high return on investment for the company, the strategy or
business model Lion runs as follows. :
1) Newcomers (threat of newcomers). At the beginning of deregulation the
terms of setting up a scheduled airline is very easy, enough to master two
aircraft (1 owned and 1 leased base on KM11/2001), from the previous 5 to
73 airlines listed. So newcomers are always there and become a permanent
threat. Lion's luck was also attributed to the September 11 tragedy of 2001,
earning a very cheap airfare.
206
Advances in Engineering Research (AER), volume 147
2) Purchaser (buyer bargaining power), Since the beginning of the operation
Lion build motto “we make people fly” as a supporter of the LCC strategy.
Through this vision it gives an image to the consumer that anyone can fly
with Lion. Even poor people who are poor even dream of flying with Lion
through the lottery advertised on television. Inexpensive imagery has
imprinted on the psyche of consumers, even though the price of their
purchased tickets is not necessarily cheap. This means that Lion's value
proposition is unique, considered a god helper for consumers who want to
use airlines at low prices, making air travel consumers switch to the Lion.
Not only from fellow competitors of air transport services, but also from
other modes of transportation, land and sea.
3) Supplier (Supplier Bargaining Power). The union labour particular in
aviation, in particular, have a high bargaining power. They demanded a very
high salary because of the difficulty and scarcity of getting a pilot in
Indonesia at that time. The pilot salary in Indonesia can be 20-25 times
compared to ordinary administrative personnel with the same qualifications.
Lion, however, preferred the human resources of retired Air Force aviators,
contracted under a cheaper salary standard. The two take advantage of the
exertion of foreign aviators. Foreign pilots can sometimes be cheaper,
especially from a socialist country (Russia, Czechoslovakia, etc.), through an
after sales services engagement. Foreign pilots and mechanics are willing to
be paid cheaply to simply turn on their License. The bargaining power of
suppliers from aircraft makers / tenants also has great strength. Lion still has
a better strategy than a competitor. For example, if at the beginning of
deregulation Lion would prefer an old aircraft rental with lessor for the type
of aircraft that is generally no longer used in Europe and America but still
feasible operated in Indonesia so that it can get a very cheap aircraft rental to
be able to set rates lower than competitors. While in the next period Lion
207
Advances in Engineering Research (AER), volume 147
prefer to order new aircraft as much as possible to get a larger discount, as
well as a promotion.
4) Substitutes (Threats of replacement products or services). Garuda, Merpati
and other incumbent airlines generally use standard industry rates (food,
beverage, first class, business class, economy class etc.) so that the price
becomes very expensive for price sensitive consumers. Instead Lion does not
recognize standard industry tariffs. Takes advantage of the flight facilities
(airport, groundhandling etc.) that are really needed to save operational costs.
Selling service at varying prices, flying by the same plane but the price of
each seat can be different. Lion's economic scale is low due to the high fleet
and high flight frequency, so overall it can set prices lower than competitors.
When the busy period of the tariff is set as high as possible, on the contrary
when the peak-off period is set low to compete with the substitute products
or services of land and sea transportation modes.
5) Rivalry (Competition between existing competitors). The number after of
airlines deregulation has increased from 5 to 73 companies). Of the amount
is estimated only 15 companies that still can compete the rest have gone out
of business. This amount is actually fulfilling the requirements under Flight
Act No. 1 of 2009 as an airlines with only two or three group ic. State-owned
Enteprice (SOEs) group Garuda (and Citilink) and Private-Owned
Enteprice/POEs (group Lion, and Group Sriwijaya). Competition is a direct
contest among competitors. As a newcomer to win Lion preferred the
price/LCC competition strategy compared to the full service strategy, with
multiple aims and objectives : (1) seize the incumbent airline market share
(GIA, MNA, BOU etc) and (2) as a new player predator (entrance). The effect
on the competitors as a whole the number of airlines becomes less, and lion
win in competition.
These five industrial structure powers above determine Lion's profitability.
But the evolution of the industry, the value of LCC's superiority on Lion airlines
208
Advances in Engineering Research (AER), volume 147
has declined. The decline is not only due to the declining consumer confidence
as well as the increasing number of airlines that run the same LCC strategy.
Initially the airline running LCC in Indonesia only Lion. Then the Garuda group
with it Citilink, next Sriwijaya Air with Nam Air and followed by other airlines.
Another big difficulty Lion since 2011 and 2013 has ordered 462 fleets. The
planes had arrived and had to be flown. Lion saw that its growth in Indonesia
would be limited and slow due to infra-structure problems (airport and flight
navigation). Rapid growth can only be done outside Indonesia. Because Lion has
long planned to build cooperation with foreign parties, but seems not to bring the
results as expected (Ringkang Gumiwang, 2016). There are constraints that need
to be manifested well and correctly (gerryonline.blogspot.co.id).
Conclusion
Based on the market structure analysis Lion has managed to dominate the airline
business in Indonesia, with the largest market share since 2007 until now. Its
success is because it can successfully cope with five competitive forces: (1)
buyer, (2) suppliers, (3) replacements, (4) newcomers and (5) rivalry. All five
create competitive competitiveness in the implementation of LCC's flight
strategy. LCC can survive long lasting but not forever. The evolution of the
LCC's value industry declined, pushing a heavy burden on Lion, as almost all
airlines run the LCC, which means Lion has no strategy. Lion is now in big
trouble. Urgent need another new strategy to maintain and even improve the
company's performance.
References
Gerryonline.blogspot.co.id/2012/09/malindo-airways-lion-air-mengaum-di-
negeri Jiran-html.
Haula, R (2008), Rekontruksi Konsepsi Supply-side Tax Policy, Bisnis &
Birokrasi, Jurnal Ilmu Administrasi dan Organisasi, Sept-Des 2008, Volume
15, Nomor 3, Universitas Indonesia Depok.
209
Advances in Engineering Research (AER), volume 147
Indra Setiawan, Dewi Nusaningrum dan Yosi Pahala. (2015). “Deregulasi
Penerbangan dan Kinerja Perusahaan Penerbangan Niaga Berjadwal di
Indonesia”. Jurnal Managemen Transportasi & Logistik Volume 02 Nomor
01, Maret 2015 Jakarta: STMT Trisakti Jakarta.
Keputusan Menteri Perhubungan Nomor KM. 11 Tahun 2001 tentang
Penyelenggaraan Angkutan Udara.
Kuntjoroadi, Wibowo, safitri, Nurul. 2009. “Analisis Strategi Bersaing dalam
Persaingan Usaha Penerbangan Komersial, Bisnis & Birokrasi”, dalam
Jurnal Ilmu Administrasi dan Organisasi, Jan-april 2009, hllm.45-52. FISIP
UI, ISSN 0854-3844.
Kokoh, R.A, (2015), Menebak Arah Low Cost Carrier, Kepala Divisi Konsultasi
PPM Managemen (PPM Consulting), KRA@ppm-managemen. Ac.id.
Magretta, Joan. 2014. Understanding Michael Porter. The Essential Guide to
Competition and Strategy. Panduan Paling Penting tentang Kompetisi dan
Strategi (Diterjemahkan oleh Diana Kurnia Setialie). Diterbitkan oleh
Penerbit ANDI.copyright@2014, Yogyakarta.
Michael E. Porter. 1980, Competitive Strategy, Alih Bahasa Dalam Bahasa
Indonesia oleh : Ir. Agus Maulana, MSM, dengan judul : Strategi Bersaing,
Tehnik Menganalisis Industri dan Pesaing, Institute Pendidikan dan
Pengembangan Managemen, Penerbit Erlangga.
______, 2008, “The Five Competitive Forces That Shape Strategy,” Harvard
Business Review, January 2008, 78-83. Hak Cipta @ 2008 oleh Harvard
Business Publishing.
Mufti, Azhari. 2004. Implikasi Kebijakan Transportasi Udara Terhadap Industri
Penerbangan di Indonesia. Jakarta: Fakultas Ekonomi Universitas Indonesia
depok.
Osborne, David and Ted Gaebler, 1996. Reinventing government : How the
entrepreneurial spirit is transforming the public sector. Diterjemahkan oleh
Abdul Rosyid : Mewirausahakan Birokrasi, Penerbit Pustaka Binaman
Presindo,.Jakarta
Peter F. Drucker 1995, Managing In a Time of Great Change (Management Di
Tengah Perubahan Besar). Alih Bahasa: Agus Teguh Handoyo. Penerbit PT.
Elex Media Komputindo.
Ringkang Gumiwang, 2016, Bisnis.com, Jakarta. Maskapai Berbiaya Murah
Jalin Aliansi, Konsultan Ke Internasional Tak Significant.
Tiarto dan Saptono. 2014. “Berbagai Halangan Masuk Pada Bisnis Penerbangan
Berjadwal di Indonesia” dalam Jurnal Ilmiah Aviasi Langit Biru Volume 9
Nomor 18, Oktober 2014 STPI Curug Tangerang.
Undang-undang Penerbangan Nomor 1 Tahun 2009.
Undang-undang Nomor 5 tahun 1999 tentang Larangan Praktek Monopoli dan
Persaingan Usaha Tidak Sehat.
210
Advances in Engineering Research (AER), volume 147