analysis of liquid flow and mixing in an oscillatory flow
TRANSCRIPT

U.Porto Journal of Engineering, 4:2 (2018) 1-15 ISSN: 2183-6493 DOI: 10.24840/2183-6493_004.002_0001
Received: 15 April, 2018 Revised: 4 May, 2018
Published: 30 November, 2018
1
Analysis of Liquid Flow and Mixing in an Oscillatory Flow Reactor Provided with 2D Smooth Periodic Constrictions
F. Almeida1, F. Rocha2, A. Ferreira3 * 1Doctoral Program in Chemical and Biological Engineering, Faculty of Engineering, University of Porto, Porto, Portugal ([email protected]); 2LEPABE - Laboratory for Process Engineering, Environment, Biotechnology and Energy, Department of Chemical Engineering, Faculty of Engineering, University of Porto, Porto, Portugal ([email protected]) ORCID 0000-0002-2778-8374; 3LEPABE - Laboratory for Process Engineering, Environment, Biotechnology and Energy, Department of Chemical Engineering, Faculty of Engineering, University of Porto, Porto, Portugal ([email protected]) ORCID 0000-0002-6381-981X *corresponding author
Abstract In this research paper the residence time distribution (RTD) was monitored for a range of fluid oscillation, frequency, amplitude and flow rate in two oscillatory flow reactors (OFR) provided with 2D smooth periodic constrictions (2D-SPC) with different designs. It was studied the axial liquid dispersion using axial dispersion model and the mixing efficiency using tank-in-series model for continuous mode. Two cases, with and without fluid oscillation, were studied and determined the optimum conditions to ensure a close plug flow, an efficient mixing and a low axial liquid dispersion. The optimum operation conditions for the two 2D-SPC designs
were found. Moreover, the effect of open cross-sectional area () on mixing and axial dispersion was also investigated. For low cross-sectional area values the mixing is higher. It was observed that fluid oscillation increases the mixing intensity even at lower flow rates, and the axial dispersion increases as the flow rate increases.
Keywords. Oscillatory Flow Reactor, Mixing, Axial Dispersion, Residence Time Distribution
Type: Research Article
Open Access Peer Reviewed CC BY
1. Introduction
In the pharmaceutical industry it is crucial to acquire an efficient mixing, as this influence the reaction yield, mass and heat transfer, as well as the quality of the final product (Ferreira, Teixeira, and Rocha 2015). However, there are still some problems related with bad mixing leading to high costs. It has been estimated that more than 600 million dollars are lost in the processes of pharmaceutical industry related with bad mixing (Paul, Atiemo-Obeng, and Kresta 2004). In order to overcome these difficulties, studies have been carried out on the development of new reactors, such as the oscillatory flow reactors (OFR). In the last years, a new generation of OFR has been arising, the meso-OFR at millimetre scale which has an ability to operate at low flow rates, reducing reagent requirements and waste (Ferreira, Teixeira, and Rocha 2015).
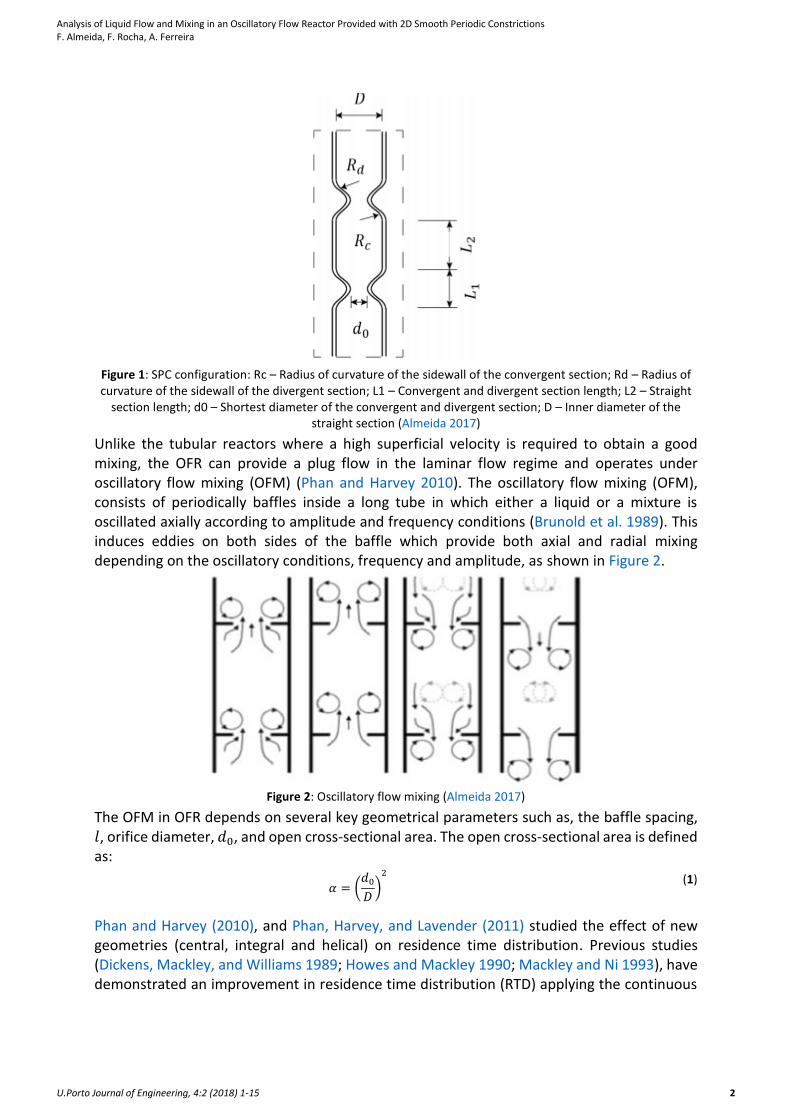
Several constrictions designs have been investigated, in order to achieve the optimum conditions. The first configurations were single-orifice and the multi-orifice (Mcglone et al. 2015). Since 1980s, the studies concerning the OFR increase remarkably, leading to a new constrictions designs, the smooth periodic constrictions (SPC) represented in Figure 1 (Mcglone et al. 2015).
Analysis of Liquid Flow and Mixing in an Oscillatory Flow Reactor Provided with 2D Smooth Periodic Constrictions F. Almeida, F. Rocha, A. Ferreira
U.Porto Journal of Engineering, 4:2 (2018) 1-15 2
Figure 1: SPC configuration: Rc – Radius of curvature of the sidewall of the convergent section; Rd – Radius of curvature of the sidewall of the divergent section; L1 – Convergent and divergent section length; L2 – Straight
section length; d0 – Shortest diameter of the convergent and divergent section; D – Inner diameter of the straight section (Almeida 2017)
Unlike the tubular reactors where a high superficial velocity is required to obtain a good mixing, the OFR can provide a plug flow in the laminar flow regime and operates under oscillatory flow mixing (OFM) (Phan and Harvey 2010). The oscillatory flow mixing (OFM), consists of periodically baffles inside a long tube in which either a liquid or a mixture is oscillated axially according to amplitude and frequency conditions (Brunold et al. 1989). This induces eddies on both sides of the baffle which provide both axial and radial mixing depending on the oscillatory conditions, frequency and amplitude, as shown in Figure 2.
Figure 2: Oscillatory flow mixing (Almeida 2017)
The OFM in OFR depends on several key geometrical parameters such as, the baffle spacing, 𝑙, orifice diameter, 𝑑0, and open cross-sectional area. The open cross-sectional area is defined as:
𝛼 = (𝑑0
𝐷)
2
(1)
Phan and Harvey (2010), and Phan, Harvey, and Lavender (2011) studied the effect of new geometries (central, integral and helical) on residence time distribution. Previous studies (Dickens, Mackley, and Williams 1989; Howes and Mackley 1990; Mackley and Ni 1993), have demonstrated an improvement in residence time distribution (RTD) applying the continuous

Analysis of Liquid Flow and Mixing in an Oscillatory Flow Reactor Provided with 2D Smooth Periodic Constrictions F. Almeida, F. Rocha, A. Ferreira
U.Porto Journal of Engineering, 4:2 (2018) 1-15 3
mode. The constriction spacing, 𝑙 should be in the range of 1 to 3 times the tube diameter, but 𝑙 = 1.5𝐷 is the most used (Brunold et al. 1989).
Ni et al. (1998) reported that 𝛼 ≈ 0.25 resulted in the shortest mixing time. Baird and Stonestreet (1995) reported a typical value of 𝛼 is in the range of 0.2 to 0.4.
More recently, Ejim et al. (2017) studied the effect of the parameters 𝛼, 𝑙 and 𝐷 on axial dispersion in the presence of solids (polyvinyl chloride), and compared the results of axial dispersion with two constrictions, the smooth periodic constrictions (SPC) and sharp edged periodic constrictions (SEPC). Ejim et al. (2017) reported that a SPC geometry with 𝑙 = 30 mm, 𝑑0 = 3.5 mm, 𝑙 𝐷⁄ = 3 and 𝛼 = 0.12 showed clear flow characteristic advantages over other meso-tubes studied.
The oscillatory flow conditions within the meso-reactor can be characterized by the three dimensionless numbers, the oscillatory Reynolds number (𝑅𝑒𝑜), Strouhal number (𝑆𝑡) and net flow Reynolds number (𝑅𝑒𝑛), as in the previous studies.
The oscillatory Reynolds number:
𝑅𝑒𝑜 =2𝜋𝑥0𝑓𝑑
𝜈 (2)
At 𝑅𝑒𝑜 values of 100-300, eddies rings are symmetrically, but at higher 𝑅𝑒𝑜 the flow becomes more intensely mixed and chaotic, leading to increased axial mixing such that OFR’s mixing increasingly resembles that of a stirred tank (Reis et al. 2005).
The Strouhal number:
𝑆𝑡 =𝑑
4𝜋𝑥0
(3)
The net flow Reynolds number:
𝑅𝑒𝑛 =𝑢𝑑
𝜈
(4)
The velocity ratio:
𝜑 =𝑅𝑒𝑜
𝑅𝑒𝑛
(5)
Where, 𝑥0 is the centre-to-peak amplitude (m), 𝑓 is the frequency of the oscillation (Hz), 𝑑 is the diameter of the tube (m), 𝜈 is the kinematic viscosity (m2s-1), 𝑑 is the tube diameter (m), 𝑢 is the superficial net flow velocity through the tube (m s-1). The oscillatory Reynolds number describes the intensity of mixing applied to the tube, Strouhal number describes the effective eddy propagation inside baffle cavities and the net flow Reynolds characterizes the fluid dynamics of additional net flow within the tube (Ni and Gough 1997). It is necessary for the oscillatory flow to be dominant for the full effect of the vortex cycle to be realized. In other words, the flow should be fully reversing, so velocity ratio should be at least greater than 1 (Stonestreet and Van Der Veeken 1999).
Despite the many advantages provided by the efficient mixing of meso-OFRs, some problems related to the flow and solids suspensions have been reported. To overcome these issues, and prevent the solids deposition, a new design was developed that replaces common circular cross-section with a rectangular cross-section – Figure 4 (Ferreira et al. 2017).
In this research paper, it is explored for the first time the influence of two 2D smooth periodic constrictions (2D-SPC) designs on liquid flow and mixing. For that the residence time distribution (RTD) was monitored for a range of oscillatory conditions and flow rate.

Analysis of Liquid Flow and Mixing in an Oscillatory Flow Reactor Provided with 2D Smooth Periodic Constrictions F. Almeida, F. Rocha, A. Ferreira
U.Porto Journal of Engineering, 4:2 (2018) 1-15 4
2. Methods
2.1. Experimental apparatus
The apparatus consists of a product vessel, a meso-reactor, a feed tank, a peristaltic pump, syringe, probes, spectrometer, linear motor, light source UV-Vis and a computer.
For this study, a meso-reactor constituted by two geometries providing a total length of 2 m and a total volume of 47 ml is shown in Figure 3.
Figure 3: Schematic diagram of meso-reactor for geometry 1: 1 – Feed tank; 2 – peristaltic pump; 3 – Linear
Motor; 4 – water inlet; 5 – meso-OFR-SPC; 6 – tracer injection; 7 – Probe 1; 8 - Light source UV-Vis; 9 – Spectrometer; 10 – Computer; 11 – Product vessel
The fluid oscillation was controlled by linear motor (LinMot, PS01-23x160) for a range of oscillation frequency 0 Hz to 7 Hz and amplitude 0 mm to 6 mm. The continuous net flow was controlled using a peristaltic pump (Longerpump, BT300-2J), which can feed the system with a net flow of 2.5 ml min-1 (𝑅𝑒𝑛 = 9) to 59.4 ml min-1 (𝑅𝑒𝑛 = 219). The syringe (Terumo) was used to inject a pulse tracer of indigo carmine (Merck), with a concentration of 0.2 g l-1. The solutions of Indigo carmine were prepared using an analytic balance (Adam equipment, WA120). Also, experimental setup incorporates a probe where absorbance is monitored using a spectrometer (Sarspec, spec res+) and a light source UV-Vis (Sarspec). The probe was covered with an aluminum foil to reduce noise from the environment light.
In Figure 4 is shown an illustration of the 2D-SPC with a rectangular cross section.
Figure 4: 2D smooth periodic constriction: DW – tube width; d0W - shortest tube width in the
constriction; ω – thickness; L1 – constriction length; L2 – Straight tube length

Analysis of Liquid Flow and Mixing in an Oscillatory Flow Reactor Provided with 2D Smooth Periodic Constrictions F. Almeida, F. Rocha, A. Ferreira
U.Porto Journal of Engineering, 4:2 (2018) 1-15 5
The 2D smooth periodic constriction characteristics are presented in Table 1.
Table 1: Parameters of 2D smooth periodic constrictions
The α for the 2D-smooth periodic constriction, is defined as:
𝛼 =𝑑𝑜𝑤
𝐷𝑤
(6)
Equation 1 is used just for tubes with circle cross section.
2.2. Measurement of RTD curves
In continuous mode, the meso-reactor system was constituted by two optical probes positioned at 1 m and 1.1 m downstream of the injection point of the OFR provide with geometry 1 and geometry 2, respectively. The probes were calibrated using distilled water at flow rate of 24.7 ml min-1 and with desired oscillation. Before starting the experiments, it was necessary to wait one hour until the light source reaches stabilization.
After washing the meso-reactor with distilled water to eliminate air bubbles, the operational conditions of frequency, amplitude and flow rate were settled. Then at initial time it was injected a 0.2 ml of Indigo carmine (0.2 g l-1) into the meso-reactor instantly, in order to achieve a perfect pulse. Hereby, the response was measured using a spectrometer and light source UV-Vis and data were recording in a computer. The data recording speed was 3 data points per second, and each data point was an average of 3 scans of the spectrometer. All the experiments were performed at room temperature (20 °C) and 3 times to achieve more precisely results. Experimental data were fitted to a plug flow with axial dispersion model and tanks-in-series model.
2.3. Absorbance calibration
For measure the absorbance over time, the Light Scan software 1.1.5 was used. The absorbance measurement was performed in wavelength of 610 nm, with an interval of ± 25 nm, applying in the software the following expression:
𝑆1 = ∫ 𝐼(𝜆) 𝑑𝜆635
585
(7)
Where 𝜆 is the wavelength and spectrum intensity.
Since in some cases the base line goes up, so it was necessary to find a reference value through the following expression:
𝑆2 = ∫ 𝐼(𝜆) 𝑑𝜆830
800
(8)
For convert the absorbance into tracer concentration it was used the Lambert-Beer law: 𝐴 = 𝜀𝑙𝑐 (9)
Where 𝑐 is the concentration of Indigo Carmine (g l-1), 𝑙 is the light path distance (m), 𝜀 is the wavelength-dependent molar absorptivity coefficient (M-1 cm-1).
In Figure 5 is presented an absorbance versus concentration plot incorporated with prediction band, confidence band and the estimated line for a 99% confidence interval.
Dw (mm)
d0w
(mm)
L1 (mm)
L2 (mm)
ω (mm)
α (%)
Geometry 1 4 1.5 6.76 12.4 5 37.5 Geometry 2 4 2 6.76 12.4 5 50

Analysis of Liquid Flow and Mixing in an Oscillatory Flow Reactor Provided with 2D Smooth Periodic Constrictions F. Almeida, F. Rocha, A. Ferreira
U.Porto Journal of Engineering, 4:2 (2018) 1-15 6
Figure 5 demonstrates a linear proportion with Indigo Carmine concentration, which shows the validity of Lambert-Beer Law for concentrations less than 0.1 g l-1.
Figure 5: Absorbance calibration
The results obtained to the slope and the confidence interval at 99 % are presented in Table 2.
Values Confidence interval at 99 %
𝑹𝟐
Slope 14,14 ±2,84 0,991 Interception 0,0519 ±0,1
Table 2: linear regression parameters
Figure 6: residual plots
In Figure 6 is presented the residual graphic. The plot Residuals vs Fitted of Figure 6 doesn’t show a pattern. Also, the Normal Q-Q plot of Figure 6 shows that the values are closely to the line (normal distribution) so the linear model seems to be alright. The plot Scale-Location,

Analysis of Liquid Flow and Mixing in an Oscillatory Flow Reactor Provided with 2D Smooth Periodic Constrictions F. Almeida, F. Rocha, A. Ferreira
U.Porto Journal of Engineering, 4:2 (2018) 1-15 7
shows if residuals are spread equally along the ranges of predictors. As it can be seen the residuals spread wider and wider, the red smooth line isn’t horizontal and shows a steep angle, so this isn’t good. On the other hand, the plot Residuals vs Leverage is used to analyze the influence of outliers (points far away of linear zone) in linear regression. As it can be seen the observation 1 is outside of Cook’s distance (red dashed lines). So, checking the residuals is a way to discover new insights in the model and data.
2.4. Axial dispersion model
This model has been used in RTD studies using an oscillatory flow reactor (Mackley and Ni 1993; Smith and Mackley 2006). This model was proposed by Danckwerts (1953), and it is used to describe non-ideal tubular reactors. The dispersion model in dimensionless form was described as:
𝜕𝐶
𝜕𝜃= (
𝐷𝐶
𝑢𝐿)
𝜕2𝐶
𝜕𝑧2−
𝜕𝐶
𝜕𝑧
(10)
Where 𝑢 is the mean axial velocity, 𝐿 is the length of the test section, 𝜃 = 𝑢𝑡 𝐿⁄ is the dimensionless time, 𝑧 = 𝑥 𝐿⁄ is the dimensionless length, 𝑥 is the axial position, 𝑡 (s) is the time measured from the tracer injection, 𝐶 is the dimensionless concentration, 𝐷𝐶 (m2 s-1) is the axial dispersion coefficient. The dimensionless group 𝑢𝐿 𝐷𝐶 ⁄ is called the Peclet number (𝑃𝑒). For a Peclet number greater than 100 occurs small deviations to a plug flow behaviour (Levenspiel 1999). The tracer concentration was normalized by:
𝐶(𝑡) =𝑐(𝑡)
∫ 𝑐(𝑡)∞
0𝑑𝑡
(11)
According to the close-open boundary conditions, open to diffusion to the entrance, the RTD for this model is defined as:
𝐸(𝑡) =√𝜏𝑃𝑒
2√𝜋𝑡3𝑒−
𝑃𝑒(𝜏−𝑡)2
4𝜏𝑡 (12)
Where 𝜏 = 𝐿 𝑢⁄ is the mean residence time. The model parameters are 𝑃𝑒 and 𝜏.
2.5. Tanks-in-series model
This model assumes the concentration time response can be represented by a cascade of equal-size ideal stirred tanks, N (Fogler 2006). The RTD is defined as:
𝐸(𝑡) =𝑡𝑁−1
(𝑁 − 1)!𝑒−𝑡
𝜏𝑖⁄ (13)
Where 𝜏𝑖 is the residence time in each stirred tank. The model parameters are 𝜏𝑖 and N.
3. Results and Discussion
The residence time distribution (RTD) measurements were performed at different experimental conditions. Figure 7 shows an example of the experimental data fitted with axial dispersion model. It was used the R software to fit the experimental data to the model.
Analysis of Liquid Flow and Mixing in an Oscillatory Flow Reactor Provided with 2D Smooth Periodic Constrictions F. Almeida, F. Rocha, A. Ferreira
U.Porto Journal of Engineering, 4:2 (2018) 1-15 8
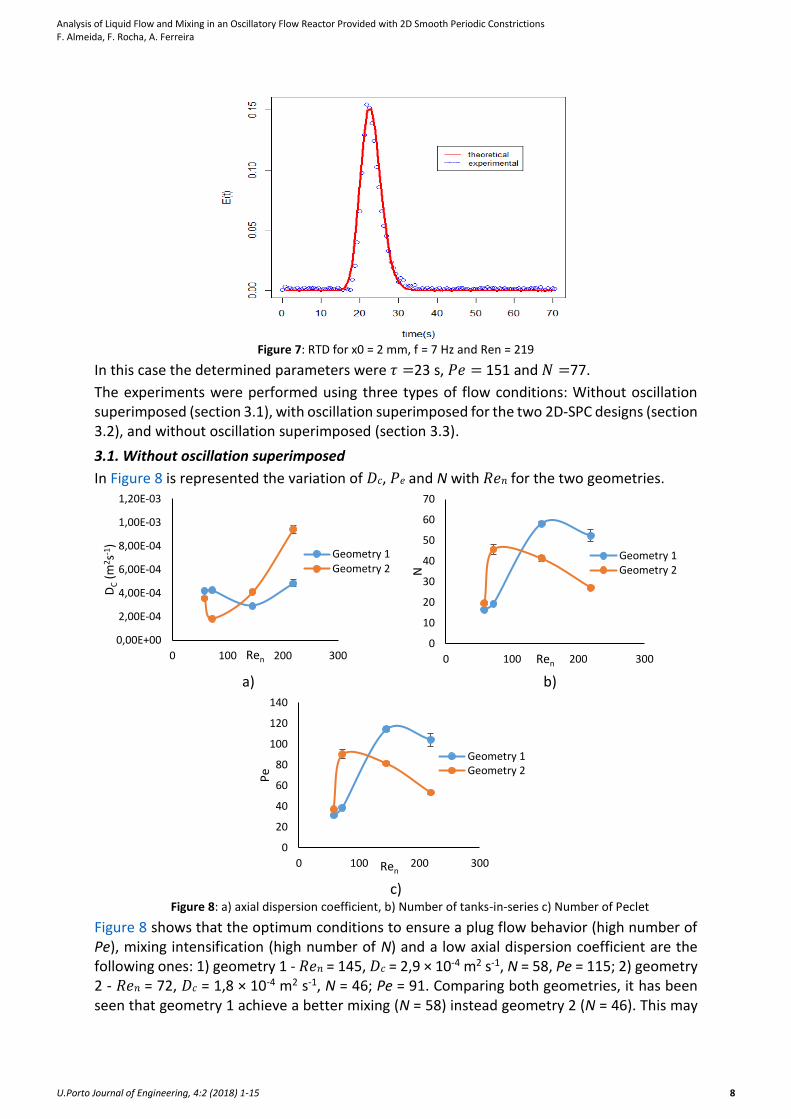
Figure 7: RTD for x0 = 2 mm, f = 7 Hz and Ren = 219
In this case the determined parameters were 𝜏 =23 s, 𝑃𝑒 = 151 and 𝑁 =77.
The experiments were performed using three types of flow conditions: Without oscillation superimposed (section 3.1), with oscillation superimposed for the two 2D-SPC designs (section 3.2), and without oscillation superimposed (section 3.3).
3.1. Without oscillation superimposed
In Figure 8 is represented the variation of 𝐷𝑐, 𝑃𝑒 and N with 𝑅𝑒𝑛 for the two geometries.
a) b)
c)
Figure 8: a) axial dispersion coefficient, b) Number of tanks-in-series c) Number of Peclet
Figure 8 shows that the optimum conditions to ensure a plug flow behavior (high number of Pe), mixing intensification (high number of N) and a low axial dispersion coefficient are the following ones: 1) geometry 1 - 𝑅𝑒𝑛 = 145, 𝐷𝑐 = 2,9 × 10⁻⁴ m2 s-1, N = 58, Pe = 115; 2) geometry 2 - 𝑅𝑒𝑛 = 72, 𝐷𝑐 = 1,8 × 10⁻⁴ m2 s-1, N = 46; Pe = 91. Comparing both geometries, it has been seen that geometry 1 achieve a better mixing (N = 58) instead geometry 2 (N = 46). This may
0,00E+00
2,00E-04
4,00E-04
6,00E-04
8,00E-04
1,00E-03
1,20E-03
0 100 200 300
DC
(m2 s
-1)
Ren
Geometry 1Geometry 2
0
10
20
30
40
50
60
70
0 100 200 300
N
Ren
Geometry 1Geometry 2
0
20
40
60
80
100
120
140
0 100 200 300
Pe
Ren
Geometry 1Geometry 2

Analysis of Liquid Flow and Mixing in an Oscillatory Flow Reactor Provided with 2D Smooth Periodic Constrictions F. Almeida, F. Rocha, A. Ferreira
U.Porto Journal of Engineering, 4:2 (2018) 1-15 9
be due to the constriction in geometry 1 is tight, resulting in a high velocity in this zone, thus forming eddies in the lower pressure zones, responsible by the mixing in geometry 1. The optimum conditions assure a plug flow behavior and a mixing intensification. Zheng and Mackley (2008) observed a linear relationship of the experimental axial dispersion coefficient with net flow Reynolds number for a SPC geometry. This behavior was also observed in present work for 𝑅𝑒𝑛 values higher than 72 and 145 for the geometries 2 and 1, respectively.
3.2. With oscillation superimposed
Figure 9 shows the variation of 𝐷𝑐 and 𝑃𝑒 with 𝑅𝑒𝑛 and 𝑅𝑒𝑜 for geometry 1.
a) b)
c) d)
e) f) Figure 9: a) and b) 𝑥0 = 2 mm; c) and d) 𝑥0 = 4 mm; e) and f) 𝑥0 = 6 mm for geometry 1
0,0E+00
1,0E-04
2,0E-04
3,0E-04
4,0E-04
5,0E-04
6,0E-04
7,0E-04
0 200 400 600
DC
(m2 s
-1)
Reo
Ren=9Ren=19Ren=58Ren=72Ren=145Ren=219
0
20
40
60
80
100
120
140
160
0 100 200 300 400 500
Pe
Reo
Ren=9
Ren=19
Ren=58
Ren=72
Ren=145
Ren=219
0,0E+00
5,0E-04
1,0E-03
1,5E-03
2,0E-03
2,5E-03
3,0E-03
0 500 1000
DC
(m2s-1
)
Reo
Ren=19Ren=9Ren=58Ren=72Ren=145Ren=219
0
20
40
60
80
100
120
140
160
0 500 1000
Pe
Reo
Ren=19Ren=9Ren=58Ren=72Ren=145Ren=219
0,0E+00
5,0E-04
1,0E-03
1,5E-03
2,0E-03
2,5E-03
3,0E-03
3,5E-03
4,0E-03
0 500 1000 1500
DC
(m2 s
-1)
Reo
Ren=9Ren=19Ren=58Ren=72Ren=145
0
50
100
150
200
0 500 1000 1500
Pe
Reo
Ren=9Ren=19Ren=58Ren=72Ren=145

Analysis of Liquid Flow and Mixing in an Oscillatory Flow Reactor Provided with 2D Smooth Periodic Constrictions F. Almeida, F. Rocha, A. Ferreira
U.Porto Journal of Engineering, 4:2 (2018) 1-15 10
Figure 10 shows the variation of N with 𝑅𝑒𝑛 and 𝑅𝑒𝑜 for geometry 1.
a) b)
c)
Figure 10: a) 𝑥0 = 2 mm; b) 𝑥0 = 4 mm; c) 𝑥0 = 6 mm for geometry 1
For geometry 1 the optimum conditions are the following ones: 1) 𝑅𝑒𝑜 between 200 to 400 for 𝑥0 = 2 mm; 2) 𝑅𝑒𝑜 between 300 to 500 for 𝑥0 = 4 mm; 3) 𝑅𝑒𝑜 between 400 to 600 for 𝑥0 = 6 mm. Zheng and Mackley (2008) obtained optimum conditions for 𝑥0 = 1 mm, 𝑅𝑒𝑜 between 100 and 300. Dickens, Mackley, and Williams (1989) obtained similar results.
It is further noted that 𝐷𝑐 and N tend to increase with increasing of the flow rate because as fluid passes through the constriction increases the velocity causing a greater axial dispersion, also enhancing the formation of eddies. However, for 𝑅𝑒𝑛 = 145 and 𝑥0 = 2 mm doesn’t seem to show that. This may be due to an alteration to the flow regime or it may be a critical value, in other words, from this flow rate value can form eddies that ensure the reduction of the axial dispersion, and mixing intensification becomes high.
0
10
20
30
40
50
60
70
80
90
0 100 200 300 400 500
N
Reo
Ren=9
Ren=19
Ren=58
Ren=72
Ren=145
Ren=219
0
10
20
30
40
50
60
70
0 500 1000
N
Reo
Ren=9
Ren=19
Ren=58
Ren=72
Ren=145
Ren=219
0
20
40
60
80
100
120
0 500 1000 1500
N
Reo
Ren=9
Ren=19
Ren=58
Ren=72
Ren=145
Ren=219

Analysis of Liquid Flow and Mixing in an Oscillatory Flow Reactor Provided with 2D Smooth Periodic Constrictions F. Almeida, F. Rocha, A. Ferreira
U.Porto Journal of Engineering, 4:2 (2018) 1-15 11
Figure 11 demonstrates the variation of 𝐷𝑐 and 𝑃𝑒 with 𝑅𝑒𝑛 and 𝑅𝑒𝑜 for geometry 2.
a) b)
c) d)
e) f)
Figure 11: a) and b) 𝑥0 = 2 mm; c) and d) 𝑥0 = 4 mm; e) and f) 𝑥0 = 6 mm for geometry 2
0,0E+00
2,0E-04
4,0E-04
6,0E-04
8,0E-04
1,0E-03
1,2E-03
0 200 400 600
DC
(m2s-1
)
Reo
Ren=9
Ren=19
Ren=58
Ren=72
Ren=145
Ren=219
0
20
40
60
80
100
120
140
160
180
200
0 100 200 300 400 500
Pe
Reo
Ren=9
Ren=19
Ren=58
Ren=72
Ren=145
Ren=219
0,0E+00
2,0E-04
4,0E-04
6,0E-04
8,0E-04
1,0E-03
1,2E-03
1,4E-03
0 500 1000
DC
(m2 s
-1)
Reo
Ren=19
Ren=9
Ren=58
Ren=72
Ren=145
Ren=219
0
50
100
150
200
250
0 500 1000
Pe
Reo
Ren=19
Ren=9
Ren=58
Ren=72
Ren=145
Ren=219
0,0E+00
2,0E-04
4,0E-04
6,0E-04
8,0E-04
1,0E-03
1,2E-03
0 500 1000 1500
DC
(m2 s
-1)
Reo
Ren=9
Ren=19
Ren=58
Ren=72
Ren=145
Ren=219
0
50
100
150
200
250
0 500 1000 1500
Pe
Reo
Ren=9
Ren=19
Ren=58
Ren=72
Ren=145
Ren=219

Analysis of Liquid Flow and Mixing in an Oscillatory Flow Reactor Provided with 2D Smooth Periodic Constrictions F. Almeida, F. Rocha, A. Ferreira
U.Porto Journal of Engineering, 4:2 (2018) 1-15 12
In Figure 12 is represented the variation of N with 𝑅𝑒𝑛 and 𝑅𝑒𝑜 for geometry 2.
a) b)
c)
Figure 12: a) 𝑥0 = 2 mm; b) 𝑥0 = 4 mm; c) 𝑥0 = 6 mm for geometry 2
From the analysis of Figure 11 and Figure 12 the optimum conditions are the following ones: 1) 𝑥0 = 2 mm, 𝑅𝑒𝑜 between 50 and 170; 2) 𝑥0 = 4 mm, 𝑅𝑒𝑜 between 530 and 780; 3) 𝑥0 = 6 mm, 𝑅𝑒𝑜 above 1150. Globally, the best operating condition in this OFR-2D-SPC is 𝑅𝑒𝑛 de 58 or 72, 𝑓 = 7 Hz e 𝑥0 = 6 mm. It is noticed that geometry 2 presents a plug flow behavior and an improvement in mixing intensification for lower flow rates. Therefore, the geometry 2 has a positive effect for lower flow rates, because when a low flow rate fluid crosses the constriction causes a lower velocity in axial direction, since d0w is largest than geometry 1, consequently, the axial dispersion coefficient is reduced.
For two 2D-SPC geometries, when an oscillation frequency is introduced, for the same 𝑅𝑒𝑛 and 𝑥0 the axial dispersion coefficient tends to decrease to a minimum value. This decrease occurs because with the increase of the frequency increases the radial dispersion and a formation and faster destruction of the eddies becomes more pronounced, making the flow regime more chaotic. The optimum conditions assure a plug flow behavior and a mixing intensification for both 2D-SPC designs tested.
0
10
20
30
40
50
60
70
80
90
100
0 200 400 600
N
Reo
Ren=9
Ren=19
Ren=58
Ren=72
Ren=145
Ren=219
0
10
20
30
40
50
60
70
80
90
100
0 500 1000
N
Reo
Ren=9
Ren=19
Ren=58
Ren=72
Ren=145
Ren=219
0
10
20
30
40
50
60
70
80
90
100
0 500 1000 1500
N
Reo
Ren=9Ren=19Ren=58Ren=72Ren=145Ren=219

Analysis of Liquid Flow and Mixing in an Oscillatory Flow Reactor Provided with 2D Smooth Periodic Constrictions F. Almeida, F. Rocha, A. Ferreira
U.Porto Journal of Engineering, 4:2 (2018) 1-15 13
3.3. Without oscillation superimposed for lower flow rate
Figure 13 shows the RTD results obtained with oscillation and without oscillation of the fluid for geometry 2.
a) b) Figure 13: a) the RTD for Ren = 19 with oscillation - 𝑥0 = 2 mm e 𝑓 = 1 Hz for
geometry 2; b) the RTD for Ren = 19 without oscillation for geometry 2
The analysis of the RTD profile from Figure13b, at low flow rates (𝑅𝑒𝑛 = 9 and 𝑅𝑒𝑛 =19) the reactor behaves as a laminar flow with low mixing, with low eddy formation. For geometry 2 with no oscillation and at low flow rates (𝑅𝑒𝑛 = 9 and 𝑅𝑒𝑛 =19) the results for the RTD profile were the same as Figure13b.
Therefore, it can be said that the oscillation of the fluid plays an important role in the mixing intensification of the fluid.
4. Conclusions
A continuous oscillatory flow reactor provided with 2D smooth periodic constrictions was developed for potential application in pharmaceutical industry. The performance of the RTD is an important parameter in the characterization of the OFR, since the RTD reflects the behavior of the mixing that occurs inside the OFR.
It was noticed a mixing intensification even at low flow rate, when oscillation of the fluid was present. The frequency has a radial dispersion effect, while amplitude has an axial dispersion effect. Moreover, it was concluded a positive effect for geometry 2, since it was achieved better results than geometry 1 at low flow rates when fluid oscillation is present.
Furthermore, it was concluded that, globally, the optimum conditions that assure a plug flow behavior, an efficient mixing and a low axial dispersion are as follows: 1) geometry 1 - 𝑅𝑒𝑛 = 19, 𝑥0 = 2 mm and 𝑓 = 5 Hz; 2) geometry 2 - 𝑅𝑒𝑛 = 58 or 72, 𝑥0 = 6 mm and 𝑓 = 7 Hz.
The oscillatory flow reactor provided with 2D - smooth periodic constrictions demonstrates potential in increasing process efficiency, mixing intensification and reduces the possibility of formation of secondary products, which gives it application in products of high added value in several areas, specifically in the fine chemical, biological and pharmaceutical industry.
0,0E+00
1,0E-03
2,0E-03
3,0E-03
4,0E-03
5,0E-03
6,0E-03
7,0E-03
8,0E-03
9,0E-03
1,0E-02
0 200 400
E(t)
(s-1
)
Time (s)
Experimental
0,0E+00
1,0E-03
2,0E-03
3,0E-03
4,0E-03
5,0E-03
6,0E-03
7,0E-03
8,0E-03
9,0E-03
1,0E-02
0 500 1000
E(t)
(s-1
)
Time (s)
Experimental

Analysis of Liquid Flow and Mixing in an Oscillatory Flow Reactor Provided with 2D Smooth Periodic Constrictions F. Almeida, F. Rocha, A. Ferreira
U.Porto Journal of Engineering, 4:2 (2018) 1-15 14
Future works need to be performed in order to verify the 2D - smooth periodic constrictions influence on solids mixing and suspension at different scales.
References
Almeida, Filipe. 2017. "Análise de perfis de escoamento e de mistura num meso-reator de fluxo oscilatório para aplicação na indústria farmacêutica". Master’s thesis, Faculty of Engineering, University of Porto. http://hdl.handle.net/10216/107080.
Baird, M. H. I., and P. Stonestreet. 1995. "Energy dissipation in oscillatory flow within a baffled tube". Chemical Engineering Research and Design 73, no. A5 (july): 503-11.
Brunold, C. R., J. C. B. Hunns, M. R. Mackley, and J. W. Thompson. 1989. "Experimental observations on flow patterns and energy losses for oscillatory flow in ducts containing sharp edges". Chemical Engineering Science 44, no. 5: 1227-44. https://doi.org/10.1016/0009-2509(89)87022-8.
Danckwerts, P. V. 1953. "Continuous flow systems: Distribution of residence times". Chemical Engineering Science 2, no. 1 (february): 1-13. https://doi.org/10.1016/0009-2509(53)80001-1.
Dickens, A. W., M. R. Mackley, and H. R. Williams. 1989. "Experimental residence time distribution measurements for unsteady flow in baffled tubes". Chemical Engineering Science 44, no. 7: 1471-79. https://doi.org/10.1016/0009-2509(89)80023-5.
Ejim, Louisa N., Stephanie Yerdelen, Thomas McGlone, Iyke Onyemelukwe, Blair Johnston, Alastair J. Florence, and Nuno M. Reis. 2017. "A factorial approach to understanding the effect of inner geometry of baffled meso-scale tubes on solids suspension and axial dispersion in continuous, oscillatory liquid–solid plug flows". Chemical Engineering Journal 308, (january): 669-82. https://doi.org/10.1016/j.cej.2016.09.013.
Ferreira, António Manuel Azevedo, Fernando Alberto Nogueira da Rocha, José António Couto Teixeira, and Filipa Juliana Fernandes Castro Freitas. 2017. Modular oscillatory flow plate reactor. WO 2017/175207 Al, filed April 10, 2017, and issued October 12, 2017.
Ferreira, A., José A. Teixeira, and F. Rocha. 2015. "O2 mass transfer in an oscillatory flow reactor provided with smooth periodic constrictions. Individual characterization of kL and a". Chemical Engineering Journal 262, (february): 499-508. https://doi.org/10.1016/j.cej.2014.09.125.
Fogler, H. Scott. 2006. "Models for nonideal reators". In Elements of Chemical Reaction Engineering, 945-1005. New York: Prentice Hall.
Howes, T., and M. R. Mackley. 1990. "Experimental axial dispersion for oscillatory flow through a baffled tube". Chemical Engineering Science 45, no. 5: 1349-58. https://doi.org/10.1016/0009-2509(90)87127-E.
Levenspiel, Octave. 1999. Chemical reaction engineering. 3rd edition. New York: John Wiley & Sons.
Mackley, Malcolm R., and Xiong-Wei Ni. 1993. "Experimental fluid dispersion measurements in periodic baffled tube arrays". Chemical Engineering Science 48, no. 18 (september): 3293-305. https://doi.org/10.1016/0009-2509(93)80213-A.
McGlone, Thomas, Naomi E. B. Briggs, Catriona A. Clark, Cameron J. Brown, Jan Sefcik, and Alastair J. Florence. 2015. "Oscillatory flow reactors (OFRs) for continuous manufacturing and crystallization". Organic Process Research & Development 19, no. 9 (august): 1186-1202. https://doi.org/10.1021/acs.oprd.5b00225.

Analysis of Liquid Flow and Mixing in an Oscillatory Flow Reactor Provided with 2D Smooth Periodic Constrictions F. Almeida, F. Rocha, A. Ferreira
U.Porto Journal of Engineering, 4:2 (2018) 1-15 15
Ni, X., G. Brogan, A. Struthers, D. C. Bennett, and S. F. Wilson. 1998. "A systematic study of the effect of geometrical parameters on mixing time in oscillatory baffled columns". Chemical Engineering Research and Design 76, no. 5 (july): 635-42. https://doi.org/10.1205/026387698525162.
Ni, X., and P. Gough. 1997. "On the discussion of the dimensionless groups governing oscillatory flow in a baffled tube". Chemical Engineering Science 52, no. 18 (september): 3209-12. https://doi.org/10.1016/S0009-2509(97)00104-8.
Paul, Edward. L., Victor A. Atiemo-Obeng, and Suzanne M. Kresta, eds. 2004. Handbook of industrial mixing: Science and practice. New Jersey: John Wiley & Sons.
Phan, Anh N., and Adam Harvey. 2010. "Development and evaluation of novel designs of continuous mesoscale oscillatory baffled reactors". Chemical Engineering Journal 159, no. 1 (may): 212-19. https://doi.org/10.1016/j.cej.2010.02.059.
Phan, Anh N., Adam Harvey, and Joshua Lavender. 2011. "Characterisation of fluid mixing in novel designs of mesoscale oscillatory baffled reactors operating at low flow rates (0.3–0.6ml/min)". Chemical Engineering and Processing: Process Intensification 50, no. 3 (march): 254-63. https://doi.org/10.1016/j.cep.2011.02.004.
Reis, N., A. P. Harvey, M. R. Mackley, A. A. Vicente, and J. A. Teixeira. 2005. "Fluid mechanics and design aspects of a novel oscillatory flow screening mesoreactor". Chemical Engineering Research and Design 83, no. 4 (april): 357-71. https://doi.org/10.1205/cherd.03401.
Smith, K. B., and M. R. Mackley. 2006. "An experimental investigation into the scale-up of oscillatory flow mixing in baffled tubes". Chemical Engineering Research and Design 84, no. 11 (november): 1001-11. https://doi.org/10.1205/cherd.05054.
Stonestreet, P., and P. M. J. Van Der Veeken. 1999. "The effects of oscillatory flow and bulk flow components on residence time distribution in baffled tube reactors". Chemical Engineering Research and Design 77, no. 8 (november): 671-84. https://doi.org/10.1205/026387699526809.
Zheng, Mingzhi, and Malcolm Mackley. 2008. "The axial dispersion performance of an oscillatory flow meso-reactor with relevance to continuous flow operation". Chemical Engineering Science 63, no. 7 (april): 1788-99. https://doi.org/10.1016/j.ces.2007.12.020.
Acknowledgements
This work was financially supported by: I) POCI-01-0145-FEDER-016816 (PTDC/QEQ-PRS/3787/2014) funded by the European Regional Development Fund (ERDF) through COMPETE2020 - Programa Operacional Competitividade e Internacionalização (POCI) and by national funds through Fundacao para a Ciencia e a Tecnologia (FCT) - Project 9471 – Reforçar a Investigação, o Desenvolvimento, Tecnológico e a Inovação (Projeto 9471 – RIDTI); II) IF exploratory project [IF/01087/2014] funded by FCT; III) POCI-01-0145-FEDER-006939 (Laboratory for Process Engineering, Environment, Biotechnology and Energy – UID/EQU/00511/2013) funded by the European Regional Development Fund (ERDF), through COMPETE2020 - Programa Operacional Competitividade e Internacionalização (POCI) and by national funds, through FCT - Fundacao para a Ciencia e a Tecnologia; IV) NORTE‐01‐0145‐FEDER‐000005 – LEPABE-2-ECO-INNOVATION, supported by North Portugal Regional Operational Programme (NORTE 2020), under the Portugal 2020 Partnership Agreement, through the European Regional Development Fund (ERDF). A. Ferreira is an Investigador FCT.