analysis of market potentials for commercial non … · analysis of market potentials for...
TRANSCRIPT

Analysis of Market Potentials for
Commercial Non-Retail Development
in the
City of Baltimore
Prepared for:
Baltimore Planning Department
December 12, 2005
Bay Area Economics
Home Appraisal & Inspection Service, Inc.

i
Table of Contents
Executive Summary....................................................................................................... iii I. Introduction .................................................................................................................. 1 II. Employment Trends ................................................................................................... 2
Baltimore and Regional Trends................................................................................................. 2 Office-Using Jobs...................................................................................................................... 3
III. Office Market Conditions and Trends ...................................................................... 5 City Office Market .................................................................................................................... 6
Downtown Baltimore.................................................................................................. 6 Non-Downtown Markets............................................................................................. 6 Absorption Trends....................................................................................................... 9
Subarea Market Conditions ....................................................................................................... 9 Reisterstown Road .................................................................................................... 12 York Road ................................................................................................................. 12 Harford Road............................................................................................................. 12 Belair Road ............................................................................................................... 12 Fells Point ................................................................................................................. 12 Canton ....................................................................................................................... 12 Locust Point .............................................................................................................. 13 Highlandtown............................................................................................................ 13 Seton Business Park .................................................................................................. 13 North Avenue/Midtown/State Center ....................................................................... 13 Jones Falls Valley ..................................................................................................... 13
Performance by Year Built ...................................................................................................... 13 Performance by Building Size................................................................................................. 14 Flex Office Space .................................................................................................................... 15
IV. Commercial Corridors............................................................................................. 17 Reisterstown Road................................................................................................................... 17
Glen/Fallstaff/Patterson Subarea............................................................................... 21 York Road Corridor................................................................................................................. 24
Belvedere Subarea..................................................................................................... 27 Harford Road Corridor ............................................................................................................ 29
Echodale Subarea ...................................................................................................... 32 Belair Road Corridor ............................................................................................................... 33
V. Future Development Potentials............................................................................... 35 Projected Absorption and Development.................................................................................. 35
ii
Absorption and Development by Submarket........................................................................... 36 Niche Markets ......................................................................................................................... 37 Opportunities for Transit-Oriented Development (TOD) ....................................................... 40
VI. Strategies for Encouraging Office Development.................................................. 42 1. Work to Retain Maryland Historic Preservation Tax Credits ............................................. 42 2. Enhance Historic Mixed-Use Business Districts and Neighborhoods ................................ 42 3. Encourage Live/Work Development ................................................................................... 43 4. Support BioPark and EBDI Developments ......................................................................... 43 5. Focus Corridor Redevelopment in Nodes with Superior Auto and Transit Access ............ 43 6. Adopt Station Area Plans to Encourage Transit-Oriented Development ............................ 43 7. Adopt Zoning Provisions That Offer Greater Certainty and Simplify the Development Approvals Process..................................................................................................................................... 44
Appendix A. Tables Appendix B. Evaluation of Glen/Fallstaff/Patterson Station Area Appendix C. Evaluation of the Belvedere Avenue Node Appendix D. Evaluation of the Echodale Avenue Node Appendix E. Evanston, Illinois Research Park District Zoning

iii
Executive Summary The Baltimore Department of Planning has undertaken a new comprehensive plan for the city to be accompanied by rezoning. As input, the Department asked Bay Area Economics (BAE) and Home Appraisal & Inspection Service, Inc. (HAIS) to evaluate the city’s commercial office market, focusing on areas outside the Central Business District (CBD). The goals were to:
1) better understand the dynamics of the office market as it affects Baltimore’s commercial corridors, emerging business districts and new business parks;
2) identify niche markets for which Baltimore could compete; 3) recommend strategies to enhance Baltimore’s ability to compete; and 4) recommend changes to the zoning code to better address future office market needs.
Employment Trends Office demand is ultimately tied to the number of employees needing office space. The City of Baltimore employment base has been declining for several years. From 2001 through 2004, the city lost 26,141 jobs or 6.9 percent of its 2001 base. At the same time, the Baltimore metropolitan area economy was relatively steady, expanding 0.9 percent to 1.21 million jobs in 2004. Focusing on jobs in industries that most often are based in office space – Information, Financial Activities and Professional and Business Services – Baltimore lost 13.1 percent of its jobs in these industries while the metropolitan area had no change. Baltimore lost almost 12,000 jobs in office-using industries from 2001 through 2004. Office Market Conditions and Trends The regional office market has been relatively steady in recent years with a net absorption of 5.9 million square feet from the first quarter of 2001 through the third quarter of 2005, according to CoStar. At the same time, 8.5 million square feet of new space was constructed, a 10.1-percent increase in the overall inventory. As a result, the regional supply of vacant office space has grown from 7.5 million to 11.1 million square feet, increasing the vacancy rate from 8.8 to 11.9 percent. In the city, vacant space has grown from 3.3 million to 4.7 million square feet, increasing the vacancy rate from 10.0 percent to 13.7 percent. As a result of the large overhang of vacant space, the average full-service rents of $19.34 per square foot in the city and $20.48 per square foot in the region are discouraging new construction except in specific submarkets (e.g., near Fort Meade) and build-to-suit office space for specific tenants. Non-CBD Submarkets Several submarkets pose particular issues for the Comprehensive Plan. To better inform the Plan about office potentials in older commercial corridors and in emerging new office clusters, BAE examined office market conditions in the four commercial corridors that dominate the north Baltimore market – Reisterstown Road, York Road, Harford Road and Belair Road. Each is lined with a variety of older neighborhood business districts, strip retail centers, freestanding retail buildings and rowhouses converted

iv
for retail and office use as well as a series of smaller office buildings dating from the 1920s to 1960s. These submarkets showed surprising high occupancy rates with vacancies of only 0.8 to 6.8 percent. Rents are low for what space is currently available, ranging from $10 to $15 per square foot. The corridors’ most viable office space is clustered in nodes with retail, restaurants and a pedestrian environment. This inventory accommodates a range of businesses, primarily focused on professionals in law, medicine, dentistry, insurance, accounting and real estate serving local residents. To a lesser degree, this office space is occupied by small businesses and entrepreneurs seeking less expensive, and often smaller, spaces than are available in the CBD and other more competitive submarkets. The city’s most competitive submarkets are Fells Point, Canton, Locust Point and the Jones Falls Valley where the historic neighborhoods now offer restaurants and retail shops as well as access to attractive loft and historic rowhouse housing. The urban ambiance of these neighborhoods makes them attractive to a range of companies that rely on young and talented workers who enjoy living in the area. The renovation of historic industrial buildings offers unique and competitive office space, particularly in buildings with a view and easy access to the waterfront. Vacancies in these submarkets are largely concentrated in new buildings that have not yet completed their lease-up. Rents range up to $26.50 per square foot. Future Development Potentials Though the Baltimore office market has been buffeted by a series of business mergers, acquisitions and relocations that vacated large blocks of space, that decline appears to have been arrested. Over the next 10 years, the regional market is projected to absorb 13.0 to 16.0 million square feet of office space. Assuming that the city could capture 20 to 30 percent of that absorption, the city would see 2.6 to 4.8 million square feet of office space absorbed. Much, but not all, of that absorption will draw down existing vacant space. New construction is projected to range between 1.13 and 3.25 million square feet from 2006 through 2015. The bulk of the new construction is projected for Fells Point, Canton, Jones Falls Valley and Midtown. With appropriate zoning and environmental remediation, the Middle Branch area could also attract significant office development. The older commercial corridors could attract a small amount of new office space, but current rents would not justify significant development of new speculative office space.

v
Office Development Potentials in Selected Submarkets, 2006-2015 Subarea Total New Construction1 Reisterstown Road Corridor 21,000 - 42,000 York Road Corridor 21,000 - 53,000 Harford Road Corridor 8,000 - 14,000 Belair Road Corridor 3,000 - 8,000 Fells Point 1,000 - 632,000 Canton 105,000 - 316,000 Locust Point 32,000 - 53,000 Highlandtown 3,000 - 5,000 Seton Business Park 53,000 - 158,000 North Ave/Midtown/State Center2 132,000 - 237,000 Jones Falls Valley 263,000 - 368,000 Selected Areas Total 1,062,000 - 1,886,000 Notes: 1Assumes a 5.0-percent vacancy rate. 2Excludes redevelopment of State office buildings.
Two new bioscience parks are under development to attract and serve biotech and bioscience companies with links to Johns Hopkins University and Health System and the University of Maryland, Baltimore. Though Baltimore has long had world-class research in biotechnology and pharmaceuticals, the city has lack a focused biotech park that offers immediate access to the Hopkins and UMB researchers and facilities. The two new parks can accommodate more than 1.9 million square feet of space, some of which will be devoted to academic laboratories. This development potential is in excess of the traditional office space development projected above. Baltimore serves a few distinct niches, which will continue as important sources of office demand:
• local service-providers; • entrepreneurs; • biotech and bioscience companies; • research institutions; and • other technology companies.
Transit improvements may generate new opportunities for office development. However, transit enhances office markets but does not create office demand by itself. Many other factors influence office development and tenant location decisions. Future transit-oriented development (TOD) is most likely to occur in locations that can compete on the basis of auto access, proximity of retail and restaurants, proximity to executive housing and access to the companies’ labor force. That is most likely to be

vi
concentrated in areas already identified as competitive neighborhoods – Inner Harbor East, Fells Point, Patterson Park, Canton, Canton Crossing and possibly Highlandtown. Strategies for Encouraging Office Development Seven key strategies should form the base of the City’s efforts to encourage additional office development:
1. Work to retain Maryland’s Historic Preservation Tax Credits and ensure access for Baltimore projects.
2. Enhance historic mixed-use business districts and neighborhoods that have the vitality and pedestrian environment to attract professionals, technology firms and other businesses that value access to the young workforce that finds urban living most appealing.
3. Encourage live/work development through zoning review that eliminates impediments to live/work structures.
4. Support BioPark and EBDI developments to tap an important new niche market and to position the city for long-term economic growth.
5. Focus corridor redevelopment in nodes with superior auto and transit access, and discourage continued conversion of rowhouses to office and retail uses on older commercial corridors.
6. Adopt station area plans to encourage transit-oriented development on lines with good connectivity and at stations with good auto access and existing business activity.
• Adopt zoning provisions that offer greater certainty and simplify the development approvals process to reduce the risks of private office development.
1
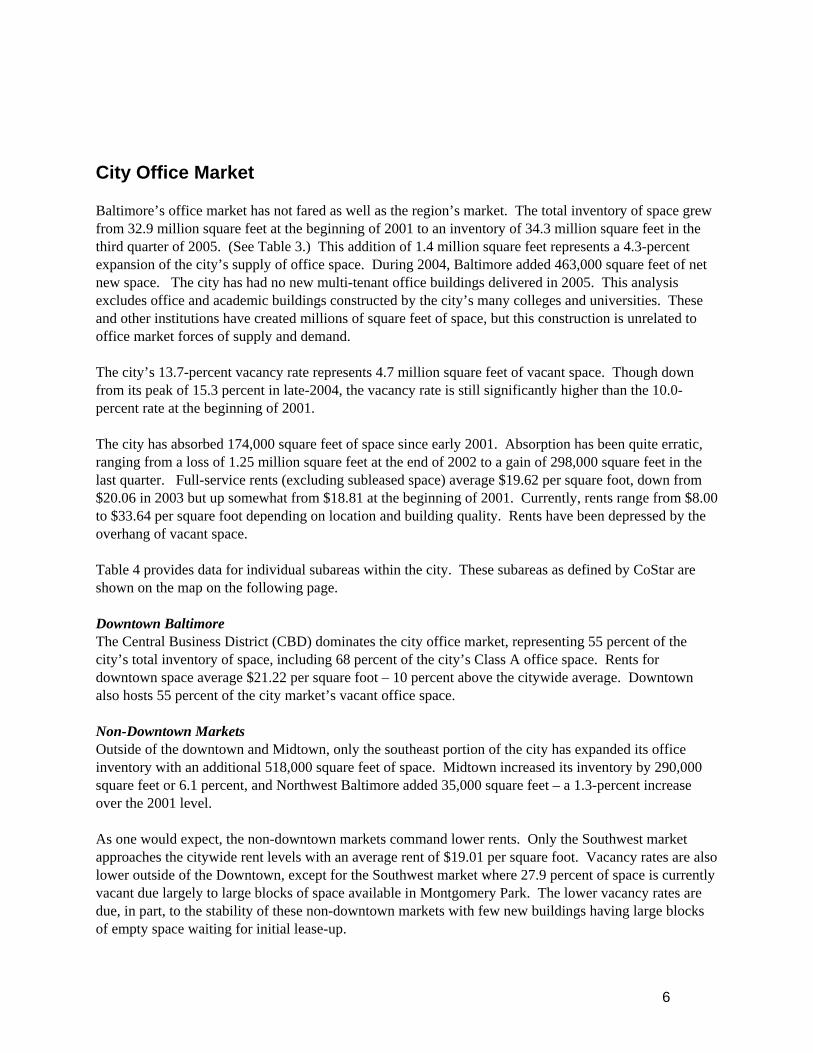
I. Introduction The Baltimore Department of Planning has undertaken a new comprehensive plan for the city to be accompanied by rezoning. As input, the Department asked Bay Area Economics (BAE) and Home Appraisal & Inspection Service, Inc. (HAIS) to evaluate the city’s commercial office market, focusing on areas outside the Central Business District. The goals were to:
5) better understand the dynamics of the office market as it affects Baltimore’s commercial corridors, emerging business districts and new business parks;
6) identify niche markets for which Baltimore could compete; 7) recommend strategies to enhance Baltimore’s ability to compete; and 8) recommend changes to the zoning code to better address future office market needs.
The report is organized as follows:
1) analysis of demand as evidenced by changes in employment, particularly in categories that typically use office space;
2) review of citywide and subarea office trends in terms of absorption, occupancy and prevailing rents;
3) review of opportunities along four major arterials, assessing the existing stock of office space and evaluating three specific nodes that could potentially attract additional office development;
4) evaluation of opportunities associated with transit investments as well as other niche markets; and 5) evaluation of the zoning code as it relates to new biotech research parks at Johns Hopkins and the
University of Maryland, Baltimore.
2
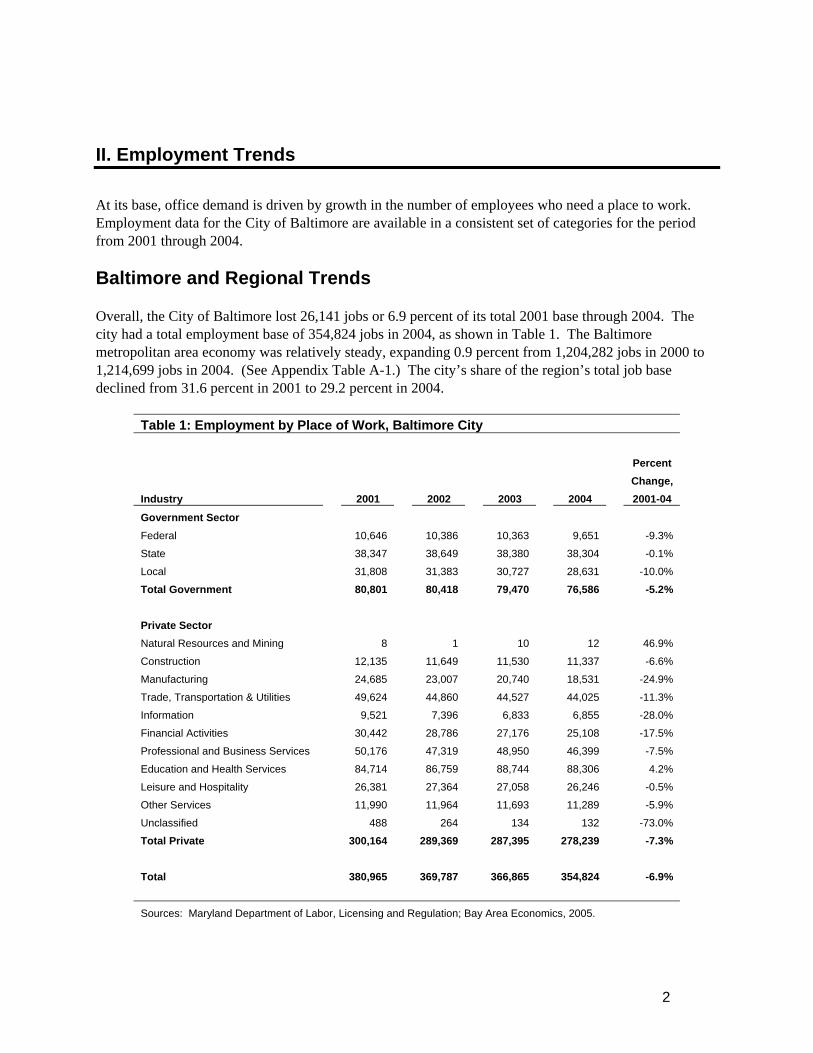
II. Employment Trends At its base, office demand is driven by growth in the number of employees who need a place to work. Employment data for the City of Baltimore are available in a consistent set of categories for the period from 2001 through 2004. Baltimore and Regional Trends Overall, the City of Baltimore lost 26,141 jobs or 6.9 percent of its total 2001 base through 2004. The city had a total employment base of 354,824 jobs in 2004, as shown in Table 1. The Baltimore metropolitan area economy was relatively steady, expanding 0.9 percent from 1,204,282 jobs in 2000 to 1,214,699 jobs in 2004. (See Appendix Table A-1.) The city’s share of the region’s total job base declined from 31.6 percent in 2001 to 29.2 percent in 2004.
Table 1: Employment by Place of Work, Baltimore City
Percent Change, Industry 2001 2002 2003 2004 2001-04
Government Sector
Federal 10,646 10,386 10,363 9,651 -9.3%
State 38,347 38,649 38,380 38,304 -0.1%
Local 31,808 31,383 30,727 28,631 -10.0%
Total Government 80,801 80,418 79,470 76,586 -5.2%
Private Sector
Natural Resources and Mining 8 1 10 12 46.9%
Construction 12,135 11,649 11,530 11,337 -6.6%
Manufacturing 24,685 23,007 20,740 18,531 -24.9%
Trade, Transportation & Utilities 49,624 44,860 44,527 44,025 -11.3%
Information 9,521 7,396 6,833 6,855 -28.0%
Financial Activities 30,442 28,786 27,176 25,108 -17.5%
Professional and Business Services 50,176 47,319 48,950 46,399 -7.5%
Education and Health Services 84,714 86,759 88,744 88,306 4.2%
Leisure and Hospitality 26,381 27,364 27,058 26,246 -0.5%
Other Services 11,990 11,964 11,693 11,289 -5.9%
Unclassified 488 264 134 132 -73.0%
Total Private 300,164 289,369 287,395 278,239 -7.3% Total 380,965 369,787 366,865 354,824 -6.9%
Sources: Maryland Department of Labor, Licensing and Regulation; Bay Area Economics, 2005.

3
City employment declined in every category except education and health services. Educational institutions and hospitals continue to grown in the city, at times generating demand for office space beyond their own campuses. Losses were greatest in five industries – manufacturing (6,154 jobs lost), financial activities (5,334 jobs lost), Federal and local government (4,172 jobs lost), professional and business services (3,778 jobs lost) and information (2,667 jobs lost). In terms of percent of the existing job base, the greatest losses were in information, manufacturing and financial activities. In many cases, these job losses were the result of activities beyond the city borders. International competition undermined America’s manufacturing base. Mergers and takeovers resulted in the movement of Alex. Brown jobs and others out of the region and consolidation and downsizing among local banks. The “dot-com bust” and the bursting of the bubble in the telecommunications industry resulted in major cutbacks in information industry employment nationally and internationally. In some cases, movement from the city to lower-cost office space in the suburbs explained the city’s declining job base. However, cutbacks in construction, manufacturing and information hit the suburbs as well during the 2001-2004 period, as shown in Appendix Table A-2. The state’s economy fared somewhat better, growing 1.5 percent from 2001 to 2004 with the addition of 37,100 jobs, as shown in Appendix Table A-3. This superior performance is attributable largely to the strength of the Washington, D.C. market with job growth in Montgomery, Prince George’s and Frederick counties. Office-Using Jobs Focusing specifically on industries that tend to locate in office buildings provides more specific insight into the demand for office space in the city. Industries that use office space most heavily include information, financial activities, professional and business services, and government. The first three are most important for the general occupancy office market, excluding owner-occupied buildings. Of course, all of the other industries also generate office demand (e.g., utility companies, physicians), but for a smaller share of their total employment base. Baltimore’s office market depends heavily on professional and business services. The industry provided 46,399 jobs in 2004, down 7.5 percent from 2000. Many of the region’s law firms, architecture and engineering firms and accounting companies maintain their headquarters in Downtown Baltimore. Smaller companies and individual agents serve the legal and accounting needs of residents and small businesses from offices throughout the city. In the metropolitan area as a whole, this industry sector added 3,400 jobs from 2001 to 2004. Financial activities generate significant office demand from banks, insurance companies and agents, investment advisors, and real estate development and management firms. Baltimore’s financial industry employed 25,108 persons in 2004, down 17.5 percent from the 2000 level. At the same time, the region expanded financial activities employment by 4.1 percent, adding 3,200 jobs. In part, the industry is following its customers and locating new offices in areas with growing population.

4
The information industry nationally and regionally experienced a rapid expansion during the late 1990s and 2000 before crashing in 2001-2002. The telecommunications industry contracted significantly with company failures and mergers in response to extreme oversupply in the industry following the boom generated by deregulation. Baltimore’s information sector declined from 9,521 jobs in 2001 to 6,833 jobs in 2003 and then held steady in 2004. The metropolitan area suffered similar losses.
Table 2: Employment in Private Office-Using Sectors, Baltimore and Metro Area
Baltimore Baltimore Metro Area
Change, Change, Industry 2001 2004 2001-04 2001 2004 2001-04
Information 9,521 6,855 -28.0% 24,458 17,864 -27.0%
Financial Activities 30,442 25,108 -17.5% 77,804 81,010 4.1%
Professional and Business Services 50,176 46,399 -7.5% 166,820 170,252 2.1%
Total 90,139 78,361 -13.1% 269,082 269,126 0.0%
Sources: Maryland Department of Labor, Licensing and Regulation; Bay Area Economics, 2005.

5
III. Office Market Conditions and Trends The regional office market has been relatively steady in recent years with limited absorption activity. In response to the employment losses discussed in Section II, office vacancy rates rose from 2001 into 2003. The regional office market had a total inventory of 92.7 million square feet in the third quarter of 2005 with a vacancy rate of 11.9 percent, according to inventories compiled by CoStar. In the metropolitan area as a whole, net absorption has averaged 1.25 million square feet per year since the beginning of 2001, ranging from a loss of 647,000 square feet in 2002 to a net gain of 2.3 million square feet during 2003. The vacancy rate is affected by the addition of new space to the market. From 2001 through the third quarter of 2005, the region saw delivery of 8.5 million square feet of net new space. The improving supply/demand balance in the office market has led to increasing rents. The region’s office space had an average rent of $20.48 per square foot at the end of the third quarter of 2005, up 3.9 percent from $19.71 in 2001. Inflation during the same period was almost 10 percent. Vacancies vary significantly by building quality level. Class A office space in the region had a 12.3-percent vacancy rate at the end of the third quarter of 2005 as compared with 13.7 percent for Class B space and 7.0 percent for Class C space.
1
Table 3: Office Trends, Baltimore Metropolitan Area and Baltimore 2001-2005 Change 1st Qtr 2001 3rd Qtr 2005 Number Percent Baltimore Metro Area1 Rentable SF 84,243,329 92,712,268 8,468,939 10.1% Total Vacant SF 7,450,763 11,073,816 3,623,053 48.6% Total Percent Vacant 8.8% 11.9% 3.1% n/a Average Rents2 (Full Service) $19.71 $20.48 $0.77 3.9%
Baltimore City Rentable SF 32,890,170 34,315,707 1,425,537 4.3% Total Vacant SF 3,298,253 4,701,844 1,403,591 42.6% Total Percent Vacant 10.0% 13.7% 3.7% n/a Average Rents2 (Full Service) $18.82 $19.34 $0.52 2.8% 1Baltimore Metro Area includes Baltimore city and the following counties: Carroll, Baltimore, Anne Arundel, Howard and Harford. 2Average rents for direct rentals, excluding subleases. Source: CoStar; Bay Area Economics, 2005.
1 CoStar defines Class A space as extremely desirable investment-grade properties that are well located. Class B space
describes buildings that generally offer more utilitarian space without special attractions and have ordinary design with average to good maintenance. Class C buildings are typically no-frills, older buildings that offer basic space and depend on lower rents to attract tenants.
6
City Office Market Baltimore’s office market has not fared as well as the region’s market. The total inventory of space grew from 32.9 million square feet at the beginning of 2001 to an inventory of 34.3 million square feet in the third quarter of 2005. (See Table 3.) This addition of 1.4 million square feet represents a 4.3-percent expansion of the city’s supply of office space. During 2004, Baltimore added 463,000 square feet of net new space. The city has had no new multi-tenant office buildings delivered in 2005. This analysis excludes office and academic buildings constructed by the city’s many colleges and universities. These and other institutions have created millions of square feet of space, but this construction is unrelated to office market forces of supply and demand. The city’s 13.7-percent vacancy rate represents 4.7 million square feet of vacant space. Though down from its peak of 15.3 percent in late-2004, the vacancy rate is still significantly higher than the 10.0-percent rate at the beginning of 2001. The city has absorbed 174,000 square feet of space since early 2001. Absorption has been quite erratic, ranging from a loss of 1.25 million square feet at the end of 2002 to a gain of 298,000 square feet in the last quarter. Full-service rents (excluding subleased space) average $19.62 per square foot, down from $20.06 in 2003 but up somewhat from $18.81 at the beginning of 2001. Currently, rents range from $8.00 to $33.64 per square foot depending on location and building quality. Rents have been depressed by the overhang of vacant space. Table 4 provides data for individual subareas within the city. These subareas as defined by CoStar are shown on the map on the following page. Downtown Baltimore The Central Business District (CBD) dominates the city office market, representing 55 percent of the city’s total inventory of space, including 68 percent of the city’s Class A office space. Rents for downtown space average $21.22 per square foot – 10 percent above the citywide average. Downtown also hosts 55 percent of the city market’s vacant office space. Non-Downtown Markets Outside of the downtown and Midtown, only the southeast portion of the city has expanded its office inventory with an additional 518,000 square feet of space. Midtown increased its inventory by 290,000 square feet or 6.1 percent, and Northwest Baltimore added 35,000 square feet – a 1.3-percent increase over the 2001 level. As one would expect, the non-downtown markets command lower rents. Only the Southwest market approaches the citywide rent levels with an average rent of $19.01 per square foot. Vacancy rates are also lower outside of the Downtown, except for the Southwest market where 27.9 percent of space is currently vacant due largely to large blocks of space available in Montgomery Park. The lower vacancy rates are due, in part, to the stability of these non-downtown markets with few new buildings having large blocks of empty space waiting for initial lease-up.

CBD
SE
SW
NW NE
Midtown
Baltimore City Office Submarket BoundariesAs Defined by CoStar, Inc.
0 2.5 51.25Miles ®
Legend
Limited Access
Highway
Major Road
Local Road
City Boundary
Park
Water
CoStar Submarket Boundary

8
Table 4: Office Trends by Area 2001-2005 Change Subarea 1st Qtr 2001 3rd Qtr 2005 Number Percent Downtown (CBD) Rentable SF 18,222,657 19,002,695 780,038 4.3% Total Vacant SF 1,535,194 2,587,459 1,052,265 68.5% Total Percent Vacant 8.4% 13.6% 5.2% n/a Average Rents1 (Full Service) $19.91 $21.22 $1.31 6.6%
Midtown Rentable SF 4,720,280 5,009,872 289,592 6.1% Total Vacant SF 566,974 704,306 137,332 24.2% Total Percent Vacant 12.0% 14.1% 2.0% n/a Average Rents1 (Full Service) $14.05 $15.59 $1.54 11.0%
Northeast Rentable SF 757,308 757,308 - 0.0% Total Vacant SF 30,881 60,297 29,416 95.3% Total Percent Vacant 4.1% 8.0% 3.9% n/a Average Rents1 (Full Service) $14.24 $15.75 $1.51 10.6%
Southeast Rentable SF 3,612,385 4,130,399 518,014 14.3% Total Vacant SF 651,842 448,091 (203,751) -31.3% Total Percent Vacant 18.0% 10.8% -7.2% n/a Average Rents1 (Full Service) $21.14 $18.19 -$2.95 -14.0%
Northwest Rentable SF 2,762,447 2,797,331 34,884 1.3% Total Vacant SF 96,753 170,641 73,888 76.4% Total Percent Vacant 3.5% 6.1% 2.6% n/a Average Rents1 (Full Service) $18.82 $17.60 -$1.22 -6.5%
Southwest Rentable SF 2,627,102 2,627,102 - 0.0% Total Vacant SF 194,655 733,550 538,895 276.8% Total Percent Vacant 7.4% 27.9% 20.5% n/a Average Rents1 (Full Service) $18.24 $19.01 $0.77 4.2% 1Average rents for direct rentals, excluding subleases. Source: CoStar; Bay Area Economics, 2005.

9
Building age and quality impact rents. Class B and C buildings dominate city’s submarkets outside the downtown with 65 percent of the office inventory. Southeast Baltimore has 2.0 million square feet of Class A, and Southwest has 1.6 million square feet of Class A space, reflecting extensive rehabilitation of historic buildings in Locust Point, Fells Point and Canton. The distribution of space by building class and the market performance of Class A, B and C buildings are summarized in Appendix Table A-3. Absorption Trends Shown in Table 5, the city as a whole captured less than two percent of the region’s net absorption since 2001. Downtown actually lost share with a total negative net absorption of 68,000 square feet. The biggest gainer was the Southeast market with a net increase of 590,000 square feet of occupied office space. This reflects the shifting of some major office tenants from the downtown to Fells Point as well as increased interest in Canton. During the same period, Southwest had a net loss of 418,000 square feet of occupied space.
Table 5: Office Net Absorption Trends 2001 2002 2003 2004 20051 Total Baltimore Metro Area2 1,301,352 (647,005) 1,025,889 2,261,291 2,000,512 5,942,039 Baltimore City 476,911 (898,148) (66,668) 112,827 548,859 173,781 Downtown (CBD) 165,037 (336,271) (82,206) 180,298 4,705 (68,437) Midtown 174,480 161,633 (151,383) (187,242) 59,508 56,996 Northeast 31,155 (18,251) (14,282) (1,356) 11,365 8,631 Southeast (17,357) 96,531 49,575 209,691 251,676 590,116 Northwest (15,013) (130,146) 46,168 41,248 27,671 (30,072) Southwest 124,509 (671,144) 81,159 (120,024) 167,047 (418,453) 1Includes 1st, 2nd, and 3rd market quarters only 2Baltimore Metro Area includes Baltimore city and the following counties: Carroll, Baltimore, Anne Arundel, Howard and Harford. Source: CoStar; Bay Area Economics, 2005.
Subarea Market Conditions Within the city, several submarkets pose particular issues for the Comprehensive Plan. To better inform the Plan about office potentials in older commercial corridors and in emerging new office clusters, this section includes a more detailed review of conditions within four commercial corridors and seven submarkets shown in the map on the following page. Four commercial corridors dominate the north Baltimore market – Reisterstown Road, York Road, Harford Road and Belair Road. Each is lined with a variety of older neighborhood business districts, strip retail centers, freestanding retail buildings and rowhouses converted for retail and office use as well as a series of smaller office buildings dating from the 1920s to 1960s. Table 6 summarizes the current office supply for each corridor and subarea.


11
Table 6: Office Supply in Selected Baltimore Submarkets, August 2005 Office Space Available Percent Buildings Total S.F. S.F. Vacant Rent Range Reisterstown Road Corridor Existing 9 331,254 2,800 0.8% $10.00 Proposed Total Corridor 9 331,254 2,800 0.8% York Road Corridor Existing 24 234,837 5,650 2.4% $15.00Harford Road Corridor Existing 24 177,367 12,000 6.8% $14.50Belair Road Corridor Existing 14 102,655 22,950 22.4% $10.50Fells Point Existing 36 841,619 33,981 4.0% $11.20-$20.94 Proposed 1 252,000 252,000 100.0% Negotiable Total Corridor 37 1,093,619 285,981 26.1% Canton Existing 23 594,656 63,464 10.7% $19.50-$23.00 Under Construction/Renov. 3 720,857 309,993 43.0% $20.16-$26.50 Total Corridor 26 1,315,513 373,457 28.4% Locust Point Existing 8 489,972 40,397 8.2% $9.95-$22.00Highlandtown Existing 6 43,064 15,000 34.8% $12.50Seton Business Park Existing 8 301,065 23,000 7.6% $13.00North Ave/Midtown/State Ctr. Existing 32 735,344 142,915 19.4% $7.50-$20.00Jones Falls Valley Existing 30 1,009,698 64,277 6.4% $21.50-$23.00 Under Construction/Renov. 1 41,446 36,207 87.4% $19.54 Total Corridor 31 1,051,144 100,484 9.6% Selected Areas Total Existing 214 4,861,531 426,434 8.8% Under Construction/Renovation 4 762,303 346,200 45.4% Proposed 1 252,000 252,000 100.0% 219 5,875,834 1,024,634 17.4% Source: CoStar; Bay Area Economics, August 2005.
12
Reisterstown Road Reisterstown Road from Cold Spring Lane to the city/county line has nine office buildings with 331,000 square feet of space that are virtually fully leased. The overall vacancy rate is only 0.8 percent. While rents are relatively low – $10.00 per square foot – this office inventory appears to be meeting a market need for convenient and inexpensive office space. The office market benefits from the revitalized retail offerings at Reisterstown Plaza and along the strip as well as proximity to Seton Business Park. Reisterstown Plaza is a transit hub, providing access to the Metro line to Downtown Baltimore and East Baltimore. The established community at the northwestern end of the corridor has helped to maintain this local business district. York Road York Road also provides inexpensive office space with access to residential communities both in the city and across the line in Baltimore County. The corridor from 33rd Street to the city/county line has 24 office buildings with 235,000 square feet of space. Only 2.4 percent of the space is vacant with an asking rent of $15.00 per square foot. Harford Road Harford Road has a more residential character in parts and a somewhat smaller office supply with 177,000 square feet of space, of which 12,000 square feet or 6.8 percent is vacant. This inventory describes the corridor from Erdman Avenue to the city/county line. The asking rent for available space is $14.50 per square foot. Belair Road Belair Road (U.S. 1) is largely dominated by auto dealers with a significantly smaller office inventory. From Erdman Avenue to the city/county line, Belair Road has 14 office buildings with 103,000 square feet of space. Vacancies are higher with 23,000 square feet of vacant space – 22.4 percent of the total inventory. Much of the space is Class C space with rents around $10.50 per square foot. Fells Point Taking advantage of the waterfront and the revitalized retail and residential neighborhood, Fells Point is an expanding office market with a total of 842,000 square feet of space. Of the total inventory, almost two-thirds (537,000 square feet) is in Class A buildings with asking rents averaging $20.94 per square foot. All but 3.4 percent of the Class A space is leased. Class B space represents another 21 percent of the inventory with 8.2 percent vacancies and rents of $19.50 to $21.13 per square foot. The 252,000 square-foot Thames Pier Building is proposed for development. Fells Point has benefited particularly from relocation of Johns Hopkins administrative offices into private office buildings in the area. Canton The Canton submarket encompasses 26 buildings, including three buildings with 721,000 square feet of space under construction or renovation. When completed, these buildings will bring the total inventory to 1.3 million square feet of space. As of August, the existing buildings had 63,000 square feet of vacant space (10.7 percent) and the new buildings had 310,000 square feet of unleased space. Rents in existing buildings range from $19.50 to $23.00 per square foot.

13
Locust Point Eighty percent of the Locust Point office inventory is in the Tide Point complex of renovated industrial buildings. The area has 40,000 square feet of vacant space – 8.2 percent of the total 490,000 square-foot inventory. Rents range from $9.95 to $22.00 per square foot. Highlandtown A neighborhood business district beginning to see renewed investment, Highlandtown has just six office buildings currently with 43,000 square feet of space. Vacancies are still high at 34.8 percent, and rents have reached $12.50 per square foot. Seton Business Park Baltimore’s most significant office park, Seton Business Park offers a suburban-style setting for buildings constructed primarily in the 1980s. Three smaller buildings have been added since 1997. Overall, Seton has an inventory of 301,000 square feet of space, of which, only 23,000 square feet (7.6 percent) are vacant. Asking rents average $13.00 per square foot. North Avenue/Midtown/State Center Thirty-two private buildings make up the supply of office space in the North Avenue, Midtown and State Center portions of the city. They offer 735,000 square feet of space at rents from $7.50 to $20.00 per square foot. Almost 20 percent of the space is currently vacant (143,000 square feet). Jones Falls Valley The Jones Falls Valley stretching from North Avenue to the city/county line has 1.0 million square feet of existing office space with another 41,000 square-foot building under construction/renovation. The area’s office space is well leased with vacancies of only 6.4 percent and asking rents of $21.50 per square foot in Clipper Mill, a recent renovation of historic industrial buildings, and $23.00 per square foot in Cross Keys. Performance by Year Built Table 7 shows current vacancies by the year each building was constructed or renovated for the specific submarkets discussed above and shown in Table 6. The largest chunk of vacant space – roughly one-third of all vacant space – is in buildings constructed from 2000 to 2005. This reflects their continued lease-up with 9.2 percent of space vacant. Vacancies are highest in buildings from the 1960s and 1970s – 22.8 percent on average as compared with 8.8 percent as a whole. Though 11 percent of the total inventory in these subareas, buildings from the 1960s and 1970s have 29 percent of the vacant space. Many of these buildings are functionally obsolescent for modern office needs with old building systems (heating, ventilation, air conditioning and telecommunications). Though facing similar issues of old building systems, office buildings built from 1940 to 1959 and those built before 1940 have low vacancy rates at 4.9 and 5.7 percent, respectively. Some of these buildings may have had renovations through the years that were not reported as a major renovation.

14
Table 7: Office Space in Selected Non-Downtown Submarkets by Year Built Year Built or Renovated
Number of Buildings
Total Square Feet
Vacant Square
Feet Vacancy
Rate Before 1940 54 376,508 24,464 6.5% 1940 to 1959 15 153,179 20,950 13.7% 1960 to 1979 24 540,484 123,252 22.8% 1980 to 1989 33 1,204,311 54,883 4.6% 1990 to 1999 25 864,410 61,609 7.1% 2000 to 2005 27 1,498,306 138,276 9.2% Not Reported 36 224,333 3,000 1.3% Total 214 4,861,531 426,434 8.8% Source: Co-Star; Bay Area Economics, August 2005.
Performance by Building Size Office occupancy rates in the selected non-downtown submarkets also vary by building size. Shown in Table 8, the 113 small buildings have 487,000 square feet of space – 10 percent of the total inventory – and an average vacancy rate of only 4.5 percent. The largest buildings with 100,000 square feet or more include 35 percent of the total supply with vacancies of only 5.0 percent. Vacancies are most extensive among mid-sized buildings between 50,000 and 100,000 square feet – 16.2 percent.
Table 8: Office Space in Selected Non-Downtown Submarkets by Building Size
Building Size Number of Buildings
Total Square
Feet
Vacant Square
Feet Vacancy
Rate Less than 10,000 s.f. 113 487,499 22,070 4.5% 10,000 to 49,999 s.f. 73 1,525,782 133,558 8.8% 50,000 to 99,999 s.f. 17 1,146,394 185,934 16.2% 100,000 s.f. and over 11 1,701,856 84,872 5.0% Total 214 4,861,531 426,434 8.8% Source: Co-Star; Bay Area Economics, August 2005.

15
Flex Office Space The city’s supply of flex office space is much more limited than office space with a total of 1.0 million square feet in the selected submarkets, according to inventories prepared by CoStar. A lower-density use, flex space is versatile space typically on one or two stories that may be configured for office space, R&D and/or retail sales as well as industrial or warehouse uses. Flex space is distributed across the Reisterstown Road corridor, Canton, Seton Business Park, North Avenue/Midtown and the Jones Falls Valley, as shown in Table 9. These flex buildings have only 5.0-percent vacancies. Two new buildings are proposed for construction in the Reisterstown Road corridor. Typically, flex space rents average about $6.00 per square foot, but that varies substantially depending on the amount of the space that is fitted out for offices rather than semi-finished warehouse space.

16
Available PercentBuildings Total S.F. S.F. Vacant Rent Range
Reisterstown Road Corridor Existing 7 166,336 10,240 6.2% $6.00 Proposed 2 103,000 103,000 Negotiable Total Corridor 9 269,336 113,240 42.0%York Road Corridor Existing 1 6,000 0 0.0%Harford Road Corridor Existing 5 41,647 10,500 25.2% NABelair Road Corridor Existing 4 81,620 0 0.0% NAFells Point Existing 3 6,833 0 0.0% NACanton Existing 5 159,620 0 0.0% NALocust Point Existing 1 4,920 0 0.0% NAHighlandtown Existing 1 4,600 0 0.0% NASeton Business Park Existing 3 190,610 0 0.0% NANorth Ave/Midtown/State Center Existing 2 146,040 10,550 7.2% $5.92Jones Falls Valley Existing 5 214,389 19,766 9.2% $1.00-$12.21 Total Corridor 39 1,125,615 154,056 13.7%
Selected Areas Total Existing 37 1,022,615 51,056 5.0% Under Construction/Renovation - - - Proposed 2 103,000 103,000 100.0%
39 1,125,615 154,056 13.7%
Table 9: Flex Office Supply in Selected Baltimore Submarkets, August 2005
Source: CoStar; Bay Area Economics, August 2005.
17
IV. Commercial Corridors A key question for the City’s Comprehensive Plan is the future of office and retail space along the city’s older commercial corridors. This study did not examine the potentials for future retail uses in these corridors. However, the fate of the office market is intertwined with the future of the retail districts. Retail shops and activity provide an amenity for office tenants and help to attract potential customers for the many real estate and insurance agents and small law and accounting offices that populate neighborhood office space. Though often functionally obsolescent and run down, the office space in these older corridors is surprisingly well-leased. This office space is clearly filling a need for inexpensive offices for small businesses that cannot afford downtown rents and whose businesses do not require them to be downtown. To better understand these markets, the BAE Consultant Team focused attention on office tenancy in the Reisterstown Road, York Road, Harford Road and Belair Road corridors. Summarized in Appendix Table A-4, the workers employed in the census tracts adjoining these four corridors in 2000 show a wide variation in industry and occupation
2 reflecting the variety of businesses located in each corridor. The
predominant industry in each corridor was educational, health and social services, as one would expect given the presence of several colleges and hospitals in these corridors. More than half of the jobs in the York Road corridor fell in this sector. Retail trade accounted for 5 to 19 percent of corridor employees. Traditional office-using industries – information; finance, insurance, real estate; and professional, management, administrative services – accounted for 16.1 percent of Reisterstown Road corridor employees, 15.1 percent of York Road corridor employees, 17.7 percent of Harford Road corridor employees and 11.5 percent of Belair Road corridor employees. The number of workers employed in the corridors is shown by occupation in Appendix Table A-5. Typical office occupations – management, business and financial operations, computer and mathematics; architecture and engineering, legal and office administrative support – represented 27.9 percent of Reisterstown Road corridor workers, 32.2 percent of York Road corridor workers, 28.5 percent of Harford Road corridor workers and 24.0 percent of Belair Road corridor workers. Of course, many of these workers were employed in local colleges, universities, hospitals and other corridor institutions and businesses not located in private office space along these major arterials. These data were then disaggregated into nodes within each corridor. Reisterstown Road Workers in traditional office-using industries were 19.0 percent of workers employed in census tracts in the Patterson Avenue portion of the Reisterstown Road corridor. The 3,183 corridor employees in these industries were spread evenly across the Patterson Avenue, North Parkway/Rogers and Belvedere nodes with only a small percentage located in the Cold Spring Lane portion of the corridor. (See Table 10.)
2 This analysis draws on 2000 U.S. Census data that have been reaggregated by place of work using software prepared
by the University of Wisconsin-Milwaukee Employment Training Institute/Southern University at New Orleans.

18
Table 10: Potential Office Nodes Along Reisterstown Road Corridor
NodeWorkers % of Total Workers % of Total Workers % of Total Workers % of Total
Workers By IndustryTotal Workers 5,580 100.0% 5,725 100.0% 5,865 100.0% 1,030 100.0%
Information 170 3.0% 160 2.8% 160 2.7% 0 0.0%Finance, Insurance, Real Estate 385 6.9% 345 6.0% 360 6.1% 80 7.8%Professional, Mgmnt., Admin. Services 505 9.1% 500 8.7% 484 8.3% 34 3.3%
Subtotal 1,060 19.0% 1,005 17.6% 1,004 17.1% 114 11.1%Retail Trade 135 2.4% 770 13.4% 865 14.7% 165 16.0%
Workers By OccupationTotal Workers 5,580 100.0% 5,725 100.0% 5,865 100.0% 1,030 100.0%
Management 530 9.5% 505 8.8% 480 8.2% 50 4.9%Business, Financial Operations 245 4.4% 254 4.4% 254 4.3% 39 3.8%Computer, Mathematical 90 1.6% 105 1.8% 84 1.4% 0 0.0%Architecture, Engineering 35 0.6% 35 0.6% 35 0.6% 0 0.0%Life, Physical, Social Science 55 1.0% 45 0.8% 45 0.8% 0 0.0%Legal 25 0.4% 25 0.4% 15 0.3% 0 0.0%Healthcare Practitioners, Technicians 180 3.2% 79 1.4% 89 1.5% 30 2.9%Healthcare Support 130 2.3% 124 2.2% 134 2.3% 70 6.8%Office, Administrative Support 860 15.4% 805 14.1% 825 14.1% 105 10.2%
Subtotal 2,150 38.5% 1,977 34.5% 1,961 33.4% 294 28.5%Sales, Related 790 14.2% 795 13.9% 850 14.5% 120 11.7%
Notes: 1) Includes the following 2000 Census tracts: 2720.01, 2801.01. [Reist Rd. Plaza & Metro]2) Includes the following 2000 Census tracts: 2718.01, 2719, 2801.013) Includes the following 2000 Census tracts: 1513, 2718.01, 2718.02, 2801.01.4) Includes the following 2000 Census tracts: 1513, 2716.
Source: U.S. Census of Population, 2000; University of Wisconsin-Milwaukee Employment Training Institute/Southern University at New Orleans; BAE 2005
Patterson Ave1 N.Pkwy./Rogers2 Belvedere3 Cold Spring Lane4
Using these same nodes to search yellowpages.com identified businesses within one-half mile of each node. Businesses in law, medicine, dentistry, accounting, insurance and real estate were identified and counted for each node to help characterize the nature of office space demand in each corridor. These counts were then sorted between those along the arterial itself and those off the main road. Shown in Table 11, the greatest concentration of these types of businesses was in the Patterson submarket with 39 establishments listed. Another 21 such businesses were located in the Northern Parkway/Rogers node. Physicians and insurance offices were most plentiful.


20
Table 11: Number of Establishments Within 1/2 Mile of "Nodes" Along North Baltimore Corridors
CorridorNode
# of # on # of # on # of # onEstablishments Main Rd Establishments Main Rd Establishments Main Rd
Type of BusinessLaw 6 3 12 8 5 1Medicine 7 3 9 8 2 2Dentist *4 2 3 3 1 1Accounting *2 1 4 2 1 1Insurance *5 0 3 3 5 5Real Estate *7 3 3 1 5 4
Total 31 12 34 25 19 14
CorridorNode
# of # on # of # on # of # onEstablishments Main Rd Establishments Main Rd Establishments Main Rd
Type of BusinessLaw 4 2 5 3 0 0Medicine 5 5 3 3 5 1Dentist 4 3 1 1 1 1Accounting 1 1 1 1 3 2Insurance 4 2 1 1 3 1Real Estate 3 2 6 3 2 2
Total 21 15 17 12 14 7
CorridorNode
# of # on # of # on # of # onEstablishments Main Rd Establishments Main Rd Establishments Main Rd
Type of BusinessLaw 4 0 1 0 5 0Medicine 17 11 5 3 12 2Dentist 6 3 3 1 5 2Accounting 4 3 2 2 1 1Insurance 13 7 2 1 3 1Real Estate 13 6 0 0 2 0
Total 57 30 13 7 28 6
CorridorNode
# of # on # of # on # of # on # of # onEstablishments Main Rd Establishments Main Rd Establishments Main Rd Establishments Main Rd
Type of BusinessLaw 6 0 3 0 0 0 0 0Medicine 15 5 8 1 3 0 2 1Dentist 2 1 1 0 0 0 0 0Accounting 5 3 4 2 0 0 2 0Insurance 8 5 5 3 2 1 0 0Real Estate 3 1 0 0 5 1 1 0
Total 39 15 21 6 10 2 5 1
Note: *Several of these establishments are in Baltimore County.
Source: Yellowpages.com; BAE, 2005.
Harford Rd6600-N. Pkwy 5500- Hamilton/Echodale 4500- Cold Spring
Belair Rd5900-Upper Belair 4800-Moravia 2500-Belair-Edison/Erdman
York Rd5900 - Belvedere/Northern 4600 - Cold Spring Lane 3300 - 33rd St
Reisterstown Rd6400-Patterson 5700-N. Pkwy/Rogers 5000-Belvedere 4400-Cold Spring

21
Glen/Fallstaff/Patterson Subarea Given the importance of access to customers and retail amenities (e.g., places for lunch) in the location decisions of office tenants, the Reisterstown Road corridor opportunities for future development are most likely to occur within the corridor’s major business node at Patterson Avenue. To assess the opportunities for expanded office development in this node, HAIS evaluated the existing office stock and recent office sales in the node bounded by Menlo Drive on the south, Wabash Avenue on the west, Fallstaff on the north and Park Heights Avenue on the east (shown on the preceding map). Site-by-site profiles appear in Appendix B. This node, made up of three neighborhoods known as Glen, Fallstaff, and Patterson Station, consists of a mixture of retail space, office space, industrial space, multi-family dwellings, and single-family dwellings. Amenities include easy access to downtown Baltimore, major highways, neighborhood shopping, places of worship, public transportation, employment centers, and public/private schools. Summarized in Table 12, the existing properties range in gross building area from 6,793 to 123,000 square feet with a typical size in the low 20,000s. Most of the office space in this area is occupied. The rents range from $6.00 to $18.50 per square foot with a typical rent of about $10.00. The vacancy rate is roughly 6 percent, which appears to be typical of the entire Northwest submarket. HAIS found good opportunities to increase non-retail commercial activity in the node. The new development of flex space is a good indicator of demand for office space in the area.

22
Type/Name Business
4121-4137 Amos Ave
Class B Flex 1 Multi-tenant 32,200 Unknown Surface Menlo Industrial Park
4139-4153 Amos Ave.
Class B Flex 1 Multi-tenant 20,400 .94 Ac. Surface Menlo Industrial Park
4214-4226 Amos Ave.
Class B Flex 1 Multi-tenant 23,088 3.82 Ac Surface Menlo Industrial Park
4230 Amos Avenue
Class A Flex 1 Multi-tenant 75,000 5 Ac Unknown Proposed, Menlo Industrial Park
4124-4134 Menlo Drive
Class B Flex/Warehouse
1 Multi-tenant 34,480 1.58 Ac Surface Menlo Industrial Park
6100 Oakleaf Ave.
Flex 1 Single Tenant 28,000 2 Ac Unknown Proposed
6101-6107 Oakleaf Ave.
Class B Flex/Warehouse
1 Multi-tenant 22,240 1.99 Ac Surface Menlo Industrial Park
No plat found
134,600 Sq. Ft.
Baltimore Medical
No Plat found
Professional Building
67,954 Sq. Ft.
No Plat FoundUnknown107x12513,438 Sq. Ft.
Source: CoStar; Home Appraisal & Inspection Service, Inc., 2005.
Table 12: Existing Office Buildings in Glen/Fallstaff/Patterson Node
Professional offices
Average small lot
6,7936819-21 Reisterstown
Road
Class C Office 2 Fallstaff Professional
Good Surface
Noted a mixture of businesses
6776 Office Plaza Ctr.
Class B Office 2 Dept. of Public Safety
123,000 Limited Surface
Attached to a mall
6609-15 Reisterstown Road
Class B Office/Medical
2 37,180
Lot Dimensions/
Lot Size Parking Remarks
4201 Patterson Avenue
Class B Office 5 Dept. of Health
84,674 Good Surface
State Govt. Leased Space
Address Type# of
StoriesGross Building Area (Sq. Ft.)

Address City Property Type Property Size Space Avail Rent/SF/Yr
Class B Flex 32,200 SF 0 SF -4121-4137 Amos Ave Baltimore1
Class B Flex 20,400 SF 0 SF -4139-4153 Amos Ave Baltimore2
Class B Flex 23,088 SF 0 SF -4214-4226 Amos Ave Baltimore3
Class A Flex 75,000 SF 75,000 SF Negotiable4230 Amos Ave Baltimore4
Class B Flex/Warehouse 34,480 SF 10,240 SF $6.004124-4134 Menlo Dr Baltimore5
Flex 28,000 SF 28,000 SF Negotiable6100 Oakleaf Ave Baltimore6
Class B Flex/Warehouse 22,240 SF 0 SF -6101-6107 Oakleaf Ave Baltimore7
Class C Office/Medical 37,500 SF 0 SF -4117-4173 Patterson Ave Baltimore8
Class B Office 84,674 SF 0 SF -4201 Patterson Ave Baltimore9
Class B Office/Medical 35,000 SF 0 SF -6609-6615 Reisterstown Rd Baltimore10
Class B Office 123,000 SF 0 SF -6776 Reisterstown Rd Baltimore11
Class C Office 6,800 SF 0 SF -6819 Reisterstown Rd Baltimore12
This copyrighted report contains research licensed to Home Appraisal and Inspections - 190257.
24
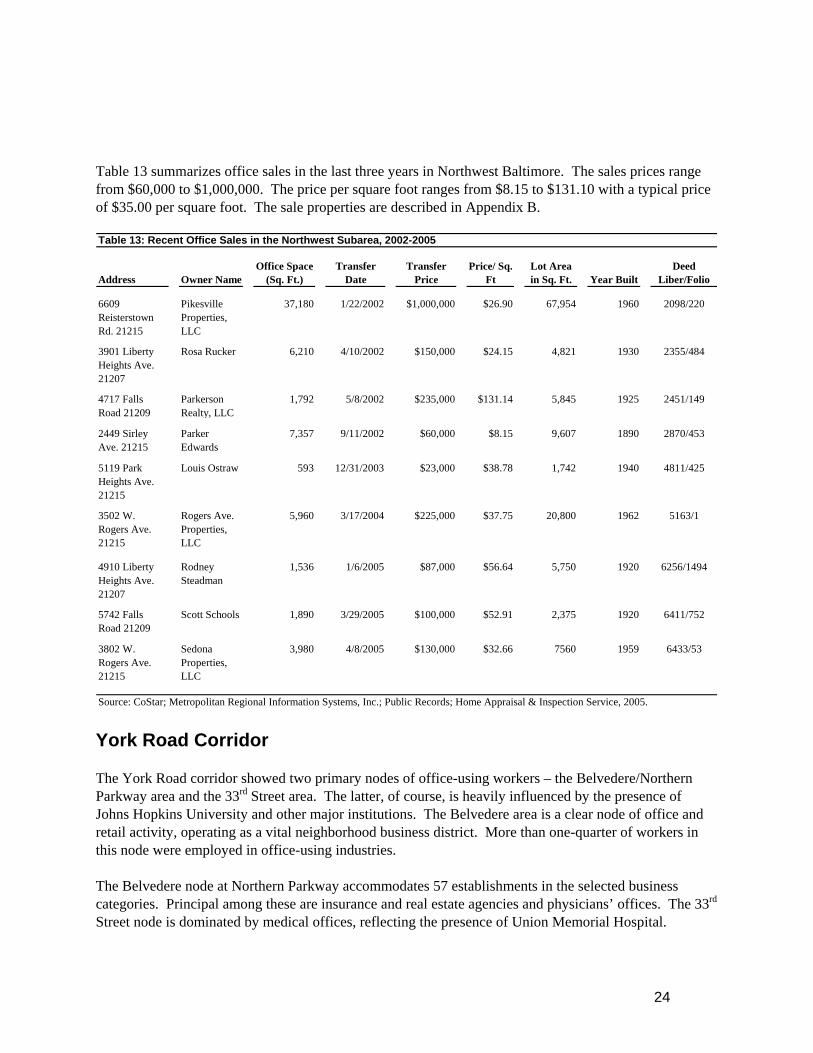
Table 13 summarizes office sales in the last three years in Northwest Baltimore. The sales prices range from $60,000 to $1,000,000. The price per square foot ranges from $8.15 to $131.10 with a typical price of $35.00 per square foot. The sale properties are described in Appendix B.
Address Owner NameOffice Space
(Sq. Ft.)Transfer
DateTransfer
PricePrice/ Sq.
FtLot Area in Sq. Ft. Year Built
Deed Liber/Folio
6609 Reisterstown Rd. 21215
Pikesville Properties, LLC
37,180 1/22/2002 $1,000,000 $26.90 67,954 1960 2098/220
3901 Liberty Heights Ave. 21207
Rosa Rucker 6,210 4/10/2002 $150,000 $24.15 4,821 1930 2355/484
4717 Falls Road 21209
Parkerson Realty, LLC
1,792 5/8/2002 $235,000 $131.14 5,845 1925 2451/149
2449 Sirley Ave. 21215
Parker Edwards
7,357 9/11/2002 $60,000 $8.15 9,607 1890 2870/453
5119 Park Heights Ave. 21215
Louis Ostraw 593 12/31/2003 $23,000 $38.78 1,742 1940 4811/425
3502 W. Rogers Ave. 21215
Rogers Ave. Properties, LLC
5,960 3/17/2004 $225,000 $37.75 20,800 1962 5163/1
4910 Liberty Heights Ave. 21207
Rodney Steadman
1,536 1/6/2005 $87,000 $56.64 5,750 1920 6256/1494
5742 Falls Road 21209
Scott Schools 1,890 3/29/2005 $100,000 $52.91 2,375 1920 6411/752
3802 W. Rogers Ave. 21215
Sedona Properties, LLC
3,980 4/8/2005 $130,000 $32.66 7560 1959 6433/53
Table 13: Recent Office Sales in the Northwest Subarea, 2002-2005
Source: CoStar; Metropolitan Regional Information Systems, Inc.; Public Records; Home Appraisal & Inspection Service, 2005. York Road Corridor The York Road corridor showed two primary nodes of office-using workers – the Belvedere/Northern Parkway area and the 33rd Street area. The latter, of course, is heavily influenced by the presence of Johns Hopkins University and other major institutions. The Belvedere area is a clear node of office and retail activity, operating as a vital neighborhood business district. More than one-quarter of workers in this node were employed in office-using industries. The Belvedere node at Northern Parkway accommodates 57 establishments in the selected business categories. Principal among these are insurance and real estate agencies and physicians’ offices. The 33rd Street node is dominated by medical offices, reflecting the presence of Union Memorial Hospital.

25
Table 14: Potential Office Nodes Along York Road Corridor
NodeWorkers % of Total Workers % of Total Workers % of Total
Workers By IndustryTotal Workers 2,810 100.0% 3,770 100.0% 13,775 100.0%
Information 234 8.3% 60 1.6% 220 1.6%Finance, Insurance, Real Estate 110 3.9% 49 1.3% 444 3.2%Professional, Mgmnt., Admin. Services 380 13.5% 160 4.2% 1,409 10.2%
Subtotal 724 25.8% 269 7.1% 2,073 15.0%Retail Trade 260 9.3% 130 3.4% 669 4.9%
Workers By OccupationTotal Workers 2,810 100.0% 3,770 100.0% 13,775 100.0%
Management 164 5.8% 385 10.2% 1,295 9.4%Business, Financial Operations 155 5.5% 120 3.2% 384 2.8%Computer, Mathematical 20 0.7% 120 3.2% 614 4.5%Architecture, Engineering 10 0.4% 4 0.1% 154 1.1%Life, Physical, Social Science 20 0.7% 69 1.8% 829 6.0%Legal 20 0.7% 8 0.2% 105 0.8%Healthcare Practitioners, Technicians 155 5.5% 89 2.4% 1,869 13.6%Healthcare Support 79 2.8% 55 1.5% 315 2.3%Office, Administrative Support 460 16.4% 670 17.8% 1,860 13.5%
Subtotal 1,083 38.5% 1,520 40.3% 7,425 53.9%Sales, Related 260 9.3% 165 4.4% 810 5.9%
Notes: 1) Includes the following 2000 Census Tracts: 2708.04, 2708.05, 2712.2) Includes the following 2000 Census Tracts: 2710.01, 2710.02, 2711.01, 2711.02. [captures Loyola/ND]3) Includes the following 2000 Census Tracts: 901, 903, 904, 905, 1201, 1202, 1203.[captures JHU]
Belvedere/Northern1 Cold Spring-North2 33rd St3
Source: U.S. Census of Population, 2000; University of Wisconsin-Milwaukee Employment Training Institute/Southern University at New Orleans; BAE 2005


27
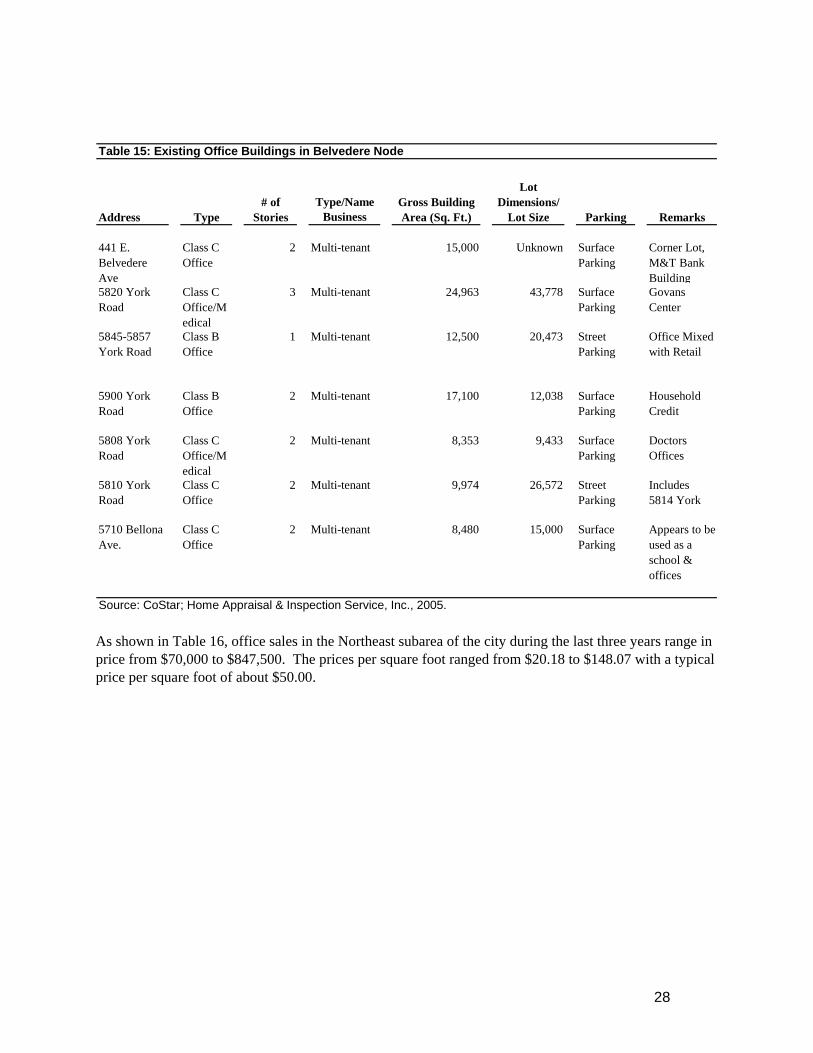
Belvedere Subarea This node at York Road and Belvedere Avenue is made up of two neighborhoods known as Mid Govans and Rose Bank. The node boundaries include Northern Parkway to the north, Clearspring Avenue to the east, Orkney Road to the south and Bellona Avenue to the west. The area consists of a mixture of retail space, office space, multi-family dwellings and single-family dwellings. Amenities include easy access to downtown Baltimore and downtown Towson, major highways, entertainment centers, neighborhood shopping, places of worship, public transportation, employment centers and public/private schools. Gross building areas among existing office buildings ranges from 8,480 to 24,963 square feet with a median size around 15,000 square feet, as shown in Table 15. Most of the office space in the area is occupied. The rental rates in Northeast Baltimore range from $10.00 to $17.00 per square foot with a typical rent of about $15.00, based on a triple-net lease. Profiles of individual buildings appear in Appendix C. The HAIS review found that the area has a good balance of residential, office and retail space and offers opportunities for additional office development. The area enjoys higher rents than found in other commercial corridors, significant pedestrian activity, quality retail space and superior access.
28
Type/Name Business
441 E. Belvedere Ave
Class C Office
2 Multi-tenant 15,000 Unknown Surface Parking
Corner Lot, M&T Bank Building
5820 York Road
Class C Office/Medical
3 Multi-tenant 24,963 43,778 Surface Parking
Govans Center
5845-5857 York Road
Class B Office
1 Multi-tenant 12,500 20,473 Street Parking
Office Mixed with Retail
5900 York Road
Class B Office
2 Multi-tenant 17,100 12,038 Surface Parking
Household Credit
5808 York Road
Class C Office/Medical
2 Multi-tenant 8,353 9,433 Surface Parking
Doctors Offices
5810 York Road
Class C Office
2 Multi-tenant 9,974 26,572 Street Parking
Includes 5814 York
5710 Bellona Ave.
Class C Office
2 Multi-tenant 8,480 15,000 Surface Parking
Appears to be used as a school & offices
Source: CoStar; Home Appraisal & Inspection Service, Inc., 2005.
Lot Dimensions/
Lot Size Parking Remarks
Table 15: Existing Office Buildings in Belvedere Node
Address Type# of
StoriesGross Building Area (Sq. Ft.)
As shown in Table 16, office sales in the Northeast subarea of the city during the last three years range in price from $70,000 to $847,500. The prices per square foot ranged from $20.18 to $148.07 with a typical price per square foot of about $50.00.

29
Address Owner NameOffice Space
(Sq. Ft.)Transfer
DateTransfer
PricePrice/ Sq. Ft
Lot Area in Sq. Ft. Year Built
Deed Liber/Folio
5900 York Road 21212
Household Credit Services, Inc
17,100 4/20/2004 $847,500 $49.56 12,038 1059 5308/406
5710 Bellona Ave. 21212
Samadhi Enterprises, Inc.
8,480 11/10/2003 $450,000 $53.07 15,000 1965 4586/482
4808 Harford Road 21214
Historical Ellicott Properties
2,881 8/12/2005 $70,000 $24.30 1,742 1940 Unknown
5017 Harford Road 21214
Geraldine R. Oakley
1,761 3/5/2003 $89,000 $50.54 5,663 1927 3749/427
4303 Frankford Ave. 21206
Vivian A. Taylor
1,392 12/19/2003 $116,900 $83.98 6,120 1929 4770/84
6111 Harford Road 21214
Brian B. Daily 2,828 5/14/2005 $125,000 $44.20 6,900 1947 5440/256
5405 York Road 21212
Shepherd’s Heart Missionary Baptist Church
8,178 12/3/2003 $165,000 $20.18 10,545 1956 4694/55
5440 Belair Road 21206
George K Thomas
2,026 9/30/2005 $300,000 $148.07 10,019 1920 Unknown
4701 Belair Road 21205
Robert J. Schwarz
6,505 9/28/2005 $460,000 $70.71 13,504 1916 Unknown
Table 16: Recent Office Sales, Northeast Submarket, 2002-2005
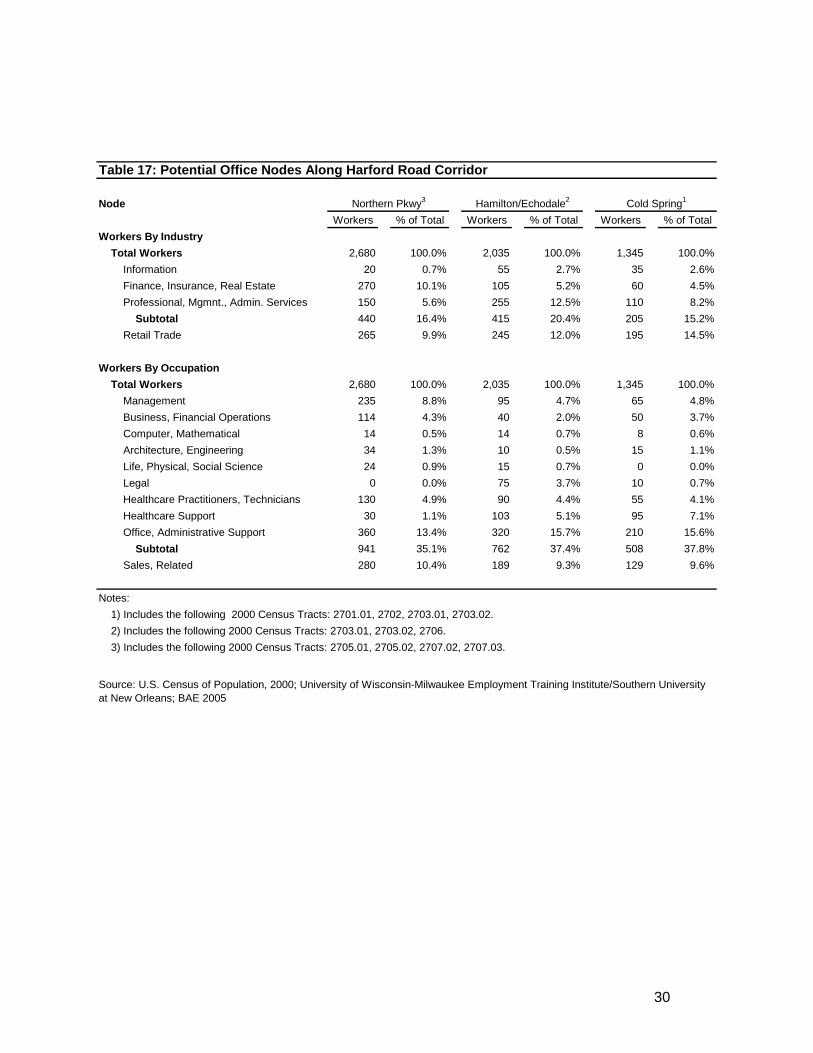
Source: CoStar; Metropolitan Regional Information Systems, Inc.; Public Records; Home Appraisal & Inspection Service, 2005. Harford Road Corridor Two nodes within the Harford Road corridor had significant numbers of workers in office-using industries – a cluster at Northern Parkway and the Hamilton/Echodale area. Each had roughly 40 percent of the corridor total. The Hamilton/Echodale portion of Harford Road has attracted 12 law offices and nine medical offices, providing an important center of services for local residents and businesses. Most of these businesses have their offices on Harford Road itself.
30
Table 17: Potential Office Nodes Along Harford Road Corridor
NodeWorkers % of Total Workers % of Total Workers % of Total
Workers By IndustryTotal Workers 2,680 100.0% 2,035 100.0% 1,345 100.0%
Information 20 0.7% 55 2.7% 35 2.6%Finance, Insurance, Real Estate 270 10.1% 105 5.2% 60 4.5%Professional, Mgmnt., Admin. Services 150 5.6% 255 12.5% 110 8.2%
Subtotal 440 16.4% 415 20.4% 205 15.2%Retail Trade 265 9.9% 245 12.0% 195 14.5%
Workers By OccupationTotal Workers 2,680 100.0% 2,035 100.0% 1,345 100.0%
Management 235 8.8% 95 4.7% 65 4.8%Business, Financial Operations 114 4.3% 40 2.0% 50 3.7%Computer, Mathematical 14 0.5% 14 0.7% 8 0.6%Architecture, Engineering 34 1.3% 10 0.5% 15 1.1%Life, Physical, Social Science 24 0.9% 15 0.7% 0 0.0%Legal 0 0.0% 75 3.7% 10 0.7%Healthcare Practitioners, Technicians 130 4.9% 90 4.4% 55 4.1%Healthcare Support 30 1.1% 103 5.1% 95 7.1%Office, Administrative Support 360 13.4% 320 15.7% 210 15.6%
Subtotal 941 35.1% 762 37.4% 508 37.8%Sales, Related 280 10.4% 189 9.3% 129 9.6%
Notes: 1) Includes the following 2000 Census Tracts: 2701.01, 2702, 2703.01, 2703.02.2) Includes the following 2000 Census Tracts: 2703.01, 2703.02, 2706.3) Includes the following 2000 Census Tracts: 2705.01, 2705.02, 2707.02, 2707.03.
Cold Spring1Northern Pkwy3 Hamilton/Echodale2
Source: U.S. Census of Population, 2000; University of Wisconsin-Milwaukee Employment Training Institute/Southern University at New Orleans; BAE 2005


32
Echodale Subarea The Echodale node is made up of three neighborhoods known as Glenarm Belford, Waltherson and Harford-Echodale Perring Parkway. The node is defined by the following boundaries: Evergreen Road to the north, Twin Oak to the east, Echodale Avenue to the south and Elsrode Avenue to the west. In the midst of a predominantly residential area, this node offers retail and office spaces that serve the local neighborhood primarily. Area amenities include easy access to downtown Baltimore and downtown Towson, major highways, public transportation, employment centers and places of worship. Among existing office buildings, gross building area ranges from 1,909 to 20,350 square feet with a median size around 11,000 square feet. Office space in the node is well occupied.
Type/Name Business
3037-3041 Hamilton Ave.
Class C Office 2 Multi-tenant 10,000 20,350 Surface Parking
Has small warehouse in rear
5610 Harford Road
Class B Office/Medical
3 Baltimore City Health Dept.
15,000 8,276 Reserved Parking
Renovated in 1988
5629 Harford Road
Class C Office 1 Multi-tenant 7,250 10,914 Surface Parking
Renovated in 1990
5519 Harford Rd.
Class B Office 3 Multi-tenant 3,000 1,909 Surface Parking
Renovated in 2004
5414 Harford Rd.
Class C Office/Medical
2 Multi-tenant 3,800 3,783 6 Parking spaces
Retail/office
5301 Harford Road
Class C Office 3 Multi-tenant 8,479 4,848 Street Parking
Corner Lot
Source: CoStar; Home Appraisal & Inspection Service, Inc., 2005.
Lot Dimensions/
Lot Size Parking Remarks
Table 18: Existing Office Buildings in Echodale Node
Address Type# of
StoriesGross Building Area (Sq. Ft.)

33
Belair Road Corridor The only real node of office-using employees in the Belair Road corridor was in the upper portion of the corridor near the city/county line. The Belair nodes have a variety of office-using businesses, but many fewer than in the major nodes on the other three corridors.
NodeWorkers % of Total Workers % of Total Workers % of Total
Workers By IndustryTotal Workers 3,680 100.0% 1,750 100.0% 1,470 100.0%
Information 10 0.3% 30 1.7% 15 1.0%Finance, Insurance, Real Estate 210 5.7% 130 7.4% 35 2.4%Professional, Mgmnt., Admin. Services 230 6.3% 95 5.4% 34 2.3%
Subtotal 450 12.2% 255 14.6% 84 5.7%Retail Trade 820 22.3% 329 18.8% 180 12.2%
Workers By OccupationTotal Workers 3,680 100.0% 1,750 100.0% 1,470 100.0%
Management 230 6.3% 150 8.6% 79 5.4%Business, Financial Operations 125 3.4% 75 4.3% 12 0.8%Computer, Mathematical 8 0.2% 4 0.2% 20 1.4%Architecture, Engineering 29 0.8% 10 0.6% 0 0.0%Life, Physical, Social Science 20 0.5% 15 0.9% 25 1.7%Legal 10 0.3% 4 0.2% 4 0.3%Healthcare Practitioners, Technicians 130 3.5% 110 6.3% 65 4.4%Healthcare Support 89 2.4% 75 4.3% 23 1.6%Office, Administrative Support 515 14.0% 169 9.7% 205 13.9%
Subtotal 1,156 31.4% 612 35.0% 433 29.5%Sales, Related 635 17.3% 194 11.1% 110 7.5%
Notes: 1). Includes the following 2000 Census Tracts: 801.01, 801.02, 2603.01.2). Includes the following 2000 Census Tracts: 2602.01, 2602.02, 2701.01, 2701.02.3). Includes the following 2000 Census Tracts: 2601.01, 2601.02, 2704.01, 2705.01, 2705.02.
Table 19: Potential Office Nodes Along Belair Road Corridor
Belair-Edison/Erdman1Moravia2Upper Belair Rd3
Source: U.S. Census of Population, 2000; University of Wisconsin-Milwaukee Employment Training Institute/Southern University at New Orleans; BAE 2005

35
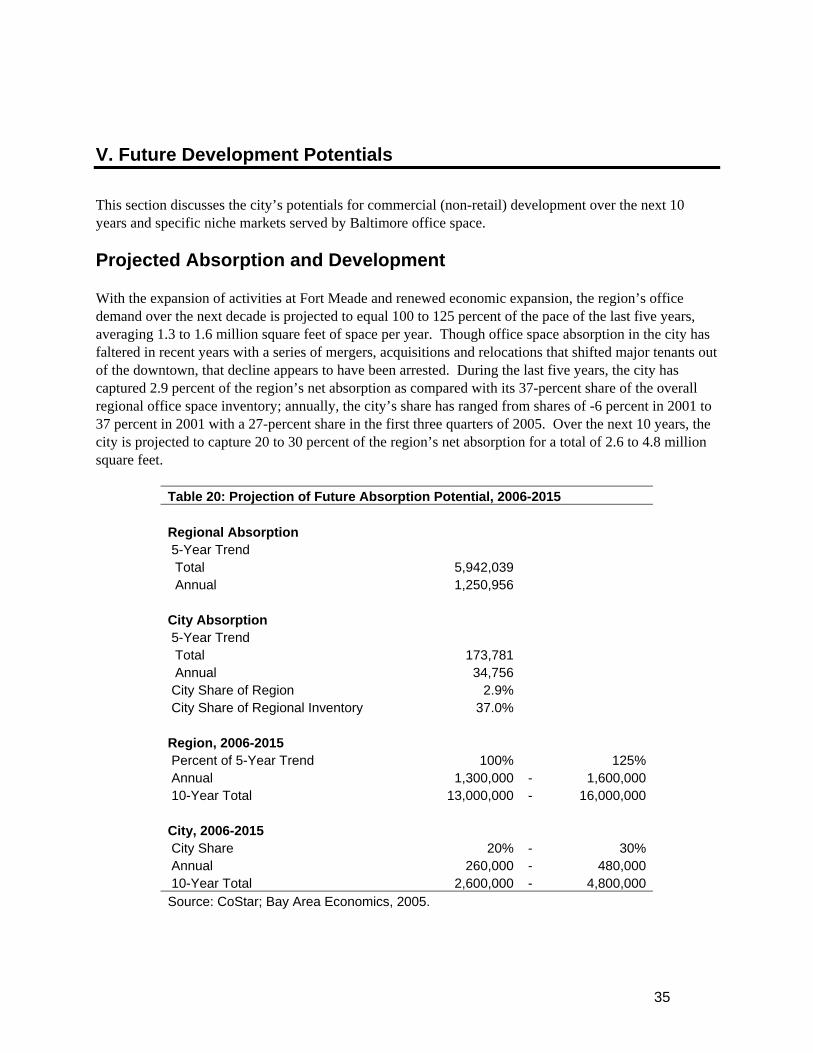
V. Future Development Potentials This section discusses the city’s potentials for commercial (non-retail) development over the next 10 years and specific niche markets served by Baltimore office space. Projected Absorption and Development With the expansion of activities at Fort Meade and renewed economic expansion, the region’s office demand over the next decade is projected to equal 100 to 125 percent of the pace of the last five years, averaging 1.3 to 1.6 million square feet of space per year. Though office space absorption in the city has faltered in recent years with a series of mergers, acquisitions and relocations that shifted major tenants out of the downtown, that decline appears to have been arrested. During the last five years, the city has captured 2.9 percent of the region’s net absorption as compared with its 37-percent share of the overall regional office space inventory; annually, the city’s share has ranged from shares of -6 percent in 2001 to 37 percent in 2001 with a 27-percent share in the first three quarters of 2005. Over the next 10 years, the city is projected to capture 20 to 30 percent of the region’s net absorption for a total of 2.6 to 4.8 million square feet.
Table 20: Projection of Future Absorption Potential, 2006-2015 Regional Absorption 5-Year Trend Total 5,942,039 Annual 1,250,956 City Absorption 5-Year Trend Total 173,781 Annual 34,756 City Share of Region 2.9% City Share of Regional Inventory 37.0% Region, 2006-2015 Percent of 5-Year Trend 100% 125% Annual 1,300,000 - 1,600,000 10-Year Total 13,000,000 - 16,000,000 City, 2006-2015 City Share 20% - 30% Annual 260,000 - 480,000 10-Year Total 2,600,000 - 4,800,000 Source: CoStar; Bay Area Economics, 2005.

36
Office space absorption involves both vacant space in existing buildings and new construction. Given the high prevailing vacancy rates, absorption in Baltimore is likely to occur initially through filling of vacant spaces. Typically, a healthy office market will have 5- to 8-percent vacancies. At Baltimore’s current 13.7-percent vacancy rate, the owners of buildings with major vacancies are competing with lower rents and other incentives. These actions impact prevailing rents in existing buildings and the rents potentially available for newly constructed buildings. Low rents limit the opportunities for new construction by inhibiting developers’ ability to finance their projects. BAE projects that the market will draw down current vacancies to 8 to 9 percent over the next 10 years, absorbing 1.1 to 1.7 million square feet of vacant space. Not all new demand will be captured by existing buildings due to tenants’ locational preferences, which may not match the locations of existing vacant space, and issues of building quality and condition matching tenant needs. It should be noted that net absorption masks a lot of movement within the market as some tenants expand and upgrade their space while others contract and economize in less expensive space. Netting out absorption of existing vacant space indicates the potential for new buildings’ absorption of 1.1 to 3.1 million square feet over the next decade. Adding 5 percent for frictional vacancies (vacancies between tenants) results in projected new construction of 1.1 to 3.3 million square feet by 2015 (Table 21).
Table 21: Projection of Future City Development Potential, 2006-2015 City Construction, 2006-2015 Vacant Space in 2005 4,701,844 Vacancy Rate in 2005 13.7% Vacancy Rate in 2015 9.0% - 8.0% Vacant Space in 2015 3,186,000 - 2,993,000 Reduction in Existing Vacancies 1,516,000 - 1,709,000 Absorption in New Buildings 1,084,000 - 3,091,000 Vacancy Rate in New Buildings 5.0% - 5.0% Total New Space Constructed 1,141,000 - 3,254,000 Source: CoStar; Bay Area Economics, 2005.
Absorption and Development by Submarket Table 22 projects office absorption and construction for the major non-downtown submarkets, based on recent market trends and proposed development activity. Future demand in the four aging commercial corridors will be relatively limited, ranging from 5,00 to 10,000 square feet in the Belair Road corridor to 20,000 to 50,000 square feet in the York Road corridor. While the existing office buildings have found a comfortable niche, attracting tenants with low rents and free parking, the prevailing rents of $8 to $15 per square foot do not support new construction. These neighborhood business districts are unlikely to see significantly higher rents in the foreseeable future due to weak underlying demand, the overhang of vacant space and competition from suburban locations. The exceptions to this projection would be established nodes that offer retail (especially restaurants) and services, a pedestrian environment, auto and transit access and a safe and clean environment. The York Road/Belvedere Avenue node offers such a

37
supportive environment, which will allow it to compete better than most of the other nodes in these corridors. The historic waterfront neighborhoods – Fells Point, Canton and Locust Point – are anticipated to continue to compete well for future office demand. The pedestrian environments they offer combined with the amenities of historic buildings, waterfront access and proximity of attractive housing for young professionals are powerful magnets for certain types of businesses. Locust Point’s ability to compete is constrained by the limited supply of waterfront sites not reserved for industry that needs deepwater access. Into the future, redevelopment of the Middle Branch area could offer similar office space with waterfront access and views as well as good access to the regional highway network. The Jones Falls Valley is becoming a stronger competitor for office space with its easy access to the Jones Falls Expressway and the renovation of the historic mill buildings that once lined the stream. Excluded from this projection are single-tenant buildings for the city’s colleges and universities as well as redevelopment of State office buildings proposed for the Mid-Town submarket. Niche Markets Baltimore currently serves a few distinct niche markets in the region, some of which could be expanded into the future. Local Service Providers As with any office market, service providers who target the local population are a mainstay of the neighborhood office demand. These service providers include physicians, dentist, insurance agents, accountants, real estate agents, attorneys and others. There is a continued trend toward expanding these services in the suburbs with easy access to growing population centers, but there remains a market need to be filled in Baltimore’s neighborhoods. Entrepreneurs Nationally, self-employment is becoming more prevalent and more appealing to individuals throughout the economy. Technology is making it easier and easier for solo practitioners and entrepreneurs to run companies with minimal staff. The affordable office rents offered in Baltimore’s Class B and C buildings are attractive to many, though they typically require access to high-speed telecommunications lines, which are not always available in older office buildings. While many entrepreneurs begin working from a spare room in their homes, not all can grow and sustain their businesses in that environment. Such entrepreneurs are good candidates for affordable office space in the city’s neighborhoods, particularly in those neighborhoods closest to their homes. Those that wish to continue working in their homes are good candidates for live/work space designed to accommodate work space within a residential setting.

38
Table 22: Office Development Potentials in Selected Submarkets, 2006-2015
Subarea Potential Space Absorption Absorption in New
Buildings Total New Construction1 (in Square Feet) Reisterstown Road Corridor 20,000 - 40,000 20,000 - 40,000 21,000 - 42,000 York Road Corridor 20,000 - 50,000 20,000 - 50,000 21,000 - 53,000 Harford Road Corridor 10,000 - 15,000 8,000 - 13,000 8,000 - 14,000 Belair Road Corridor 5,000 - 10,000 3,000 - 8,000 3,000 - 8,000 Fells Point 400,000 - 600,000 400,000 - 600,000 421,000 - 632,000 Canton 400,000 - 600,000 100,000 - 300,000 105,000 - 316,000 Locust Point 40,000 - 60,000 30,000 - 50,000 32,000 - 53,000 Highlandtown 3,000 - 5,000 3,000 - 5,000 3,000 - 5,000 Seton Business Park 50,000 - 150,000 50,000 - 150,000 53,000 - 158,000 North Ave/Midtown/State Center2 200,000 - 300,000 125,000 - 225,000 132,000 - 237,000 Jones Falls Valley 300,000 - 400,000 250,000 - 350,000 263,000 - 368,000 Selected Areas Total 1,448,000 - 2,230,000 1,009,000 - 1,791,000 1,062,000 - 1,886,000 Notes: 1Assumes a 5.0-percent vacancy rate. 2Excludes redevelopment of State office buildings. Source: Bay Area Economics, August 2005.

39
Biotech and Bioscience Industry The city is in the fortunate position of having not one, but two new bioscience parks to attract and serve biotech and bioscience companies with links to Johns Hopkins University and Health System and the University of Maryland, Baltimore. Adjacent to the Johns Hopkins Medical Campus, East Baltimore Development, Inc. (EBDI), Forest City and Baltimore Biotech Ventures, a consortium of minority-owned companies, are developing the Life Sciences & Biotechnology Park on 80 acres bounded by Patterson Park Avenue, Broadway, the railroad tracks and Madison Street. They plan to complete 1.1 million square feet of biotech research building construction by 2014, starting with the first life sciences building by the end of Fall 2005. This 292,000 square-foot building will include space for the Johns Hopkins School of Medicine’s Institute for Basic Biomedical Sciences, local life science companies, international companies and Hopkins-affiliated spin-off companies. Included will be accelerator space geared to smaller companies in the second phase of their development (as opposed to incubator space for start-up companies). The accelerator space, renting at $34 to $36 per square foot, will include wet labs as well as Class A office space amenities, such as state-of-the-art infrastructure and broadband connectivity. West of its campus and Martin Luther King, Jr. Boulevard, the University of Maryland, Baltimore is pursuing development of the UMB BioPark. The $300 million BioPark will include more than 800,000 square feet of space for private commercial bioscience and pharmaceutical companies. The first 120,000 square-foot building features flexible, modular wet labs and prep rooms as well as access to several University amenities and services, including the Health Sciences and Human Services Library, an animal care facility, an electron microscope facility, a nuclear magnetic resonance facility, the pharmacokinetics/ bioparmaceutics lab, the Center for Fluorescent Microscopy, a molecular modeling lab, a physiology electronics and machine shop, and a number of other highly specialized facilities. The BioPark’s initial anchor tenants are SNBL Clinical Pharmacology, Inc., a Japanese pharmaceutical research firm specializing in conducting clinical trials for new pharmaceuticals, and the newly formed Center for Vascular and Inflammatory Disease. Townsend Capital, LLC is UMB’s development partner in the venture. Baltimore and Maryland have long had world-class research in biotechnology and pharmaceuticals, but the city has lacked a focused biotech park that offers immediate access to the Hopkins and UMB researchers and facilities. The Bayview Research Campus offered sites proximate to the Bayview Medical Center but not to the mass of Johns Hopkins researchers on the main East Baltimore campus. It also suffered from the limited availability of specialized laboratory space designed to meet the needs of biotech companies. The two new parks have responded to that need with construction of speculative buildings that will house both academic research units and private bioscience companies. With the resources of major developers, the City and the State behind them, these two parks are well situated to establish a significant base of biotech and bioscience companies in Baltimore. The demand from private biotech and bioscience tenants represents a relatively new market for Baltimore, one not reflected in the past absorption history.

40
Research Institutions Though typically not a major factor in demand for multi-tenant office buildings, the city’s universities and research institutions continue to generate significant demand for office space. At Johns Hopkins Bayview Medical Center, the National Institutes of Health has joined with Hopkins in building the Biomedical Research Center (BRC) to accommodate intramural research programs for the National Institute on Aging and the National Institute on Drug Abuse with 1,000 scientists. Opening in Fall 2006, the BRC will include 500,000 square feet of laboratory space. Johns Hopkins Institutions plans to expand their operations onto the recently acquired 68-acre Mount Washington Corporate Campus. Hopkins plans to occupy 275,000 square feet of space with administrative offices for both the Health System and University operations. The remainder of the extensive conference facilities onsite will be used for Hopkins-related meetings, conferences, training sessions and receptions. The conference space accommodates up to 150 individuals with 12 dedicated rooms. Other Technology Companies Though the “dot.com crash” and the collapse of the telecommunications industry at the beginning of this decade burst the bubble of “irrational exuberance” and resulted in a sharp increase in vacant space designed for technology companies, Baltimore continues to offer unique attractions to technology companies. The Brewers Hill development in Canton just attracted a software manufacturer tied to the Department of Defense from its previous location in Anne Arundel County near the National Security Agency. Ontology Works, Inc. was reported to be attracted by Canton’s lively urban environment with reasonable rents and excellent access to Interstate-95. Unique office space in historic industrial buildings with access to the waterfront, housing, restaurants and retail services distinguishes Baltimore from all the modern suburban business parks scattered throughout the region. The atmosphere is very attractive for companies that rely on a technological labor force that is often young and interested in urban amenities. This continues to be an important niche for the city. Opportunities for Transit-Oriented Development (TOD) Baltimore has the advantage of a heavy rail, light rail, bus and commuter rail transit network, one that could offer opportunities for new concentrations of office space. Transit access provides a valuable competitive advantage, but transit access is only one factor that must occur in conjunction with other competitive factors to result in new office development at transit stations. Key location criteria for office development include:
• auto access; • proximity to other offices; • proximity to housing for executives, who typically make the location decisions; • proximity to labor force; • retail and support services; • visibility; • prestige; • proximity to anchors such as hospitals and universities, courts and government offices;

41
• neighborhood environment; and • availability of sites with appropriate zoning.
Considering these location criteria in review of the potential for new transit stations along the Red and Green lines, BAE evaluated opportunities for leveraging significant new office development at new light rail stations. The Green Line offers limited opportunities for new office development other than that associated with the Life Sciences & Biotechnology Park. On the Red Line, the key opportunities lie in areas already identified as competitive neighborhoods – Inner Harbor East, Fells Point, Patterson Park Canton and Canton Crossing. Extension of transit service to these areas could increase their ability to attract and compete for office tenants by providing much easier access to downtown and other business centers. Given transit access and proximity to these areas, Highlandtown also could benefit from new light rail access. Careful design of the stations to allow for a pedestrian environment and good linkages to business districts and residential neighborhoods will be critical to achieving the incremental TOD office space leveraged by improved access. Other stations may be able to leverage a small amount of office space (e.g., 10,000 to 25,000 square feet) by virtue of the new activity focus provided by a new light rail station. The scale of supportable space will depend on the local neighborhood economics. However, transit access alone is unlikely to make the difference in change a neighborhood business district location into one that can compete regionally for larger scale office development.
42
VI. Strategies for Encouraging Office Development 1. Work to Retain Maryland Historic Preservation Tax Credits First and foremost in the City’s strategies to encourage office development must be continued revitalization of historic neighborhoods and the financial incentive provided by the State’s historic preservation tax credit. The State’s tax credit provides for up to 25 percent of the qualified costs of rehabilitating historic structures up to $3 million per building. These credits have been instrumental in facilitating the adaptive reuse of historic industrial buildings along Baltimore’s waterfront and elsewhere (e.g., Tide Point, the Can Company, Brewers Hill, Clipper Mill). Maintaining the program’s viability with access for Baltimore projects is critically important to the continued creation of these highly competitive and unique office products. The building code should be reviewed to be sure that it encourages adaptive reuse of historic buildings and does not create undue cost burdens by applying building codes designed for new construction. 2. Enhance Historic Mixed-Use Business Districts and Neighborhoods The overall appeal of a vibrant urban neighborhood is another critical advantage for Baltimore’s competition for office tenants. Continued support for revitalization of these urban neighborhoods will be important to capturing a “fair share” of the region’s office and employment growth. The strengths of Fells Point and Canton that allow them to compete effectively for office development lie in their character as vibrant urban neighborhoods. Mixed-use communities that allow people to live near their work create the opportunity for restaurants and retailers to draw upon both daytime and evening/weekend markets. Without both a lunch and dinner business, restaurants often find it difficult to survive and flourish. The lack of a variety of restaurants inhibits office development when prospective tenants and their employees consider a location. As technology has made office-based businesses less dependent on locations in close proximity to their customers, these businesses are freed to make location decisions on different criteria. For some competing for the best young talent, urban ambiance can be very important in their ability to attract and retain these workers. Many are attracted by locations in an urban neighborhood with a base of active restaurants and retailers, a walkable pedestrian environment and nearby historic housing. Public sector tools for reinforcing these urban neighborhoods can include enhanced public spaces (e.g., waterfront parks and promenades), infrastructure upgrades, Main Street-style technical assistance to individual retailers and property owners, Business Improvement Districts (BIDs), facilitating development through expedited development approvals, crime prevention strategies such as community policing, historic preservation incentives, recruitment of specific retailers to fit gaps in the local offerings and joint parking facilities that serve multiple businesses. The revival of several of Baltimore’s urban neighborhoods has demonstrated the power of mixed-use neighborhoods in attracting residents and businesses.
43
3. Encourage Live/Work Development Zoning provisions that encourage live/work space and adaptive reuse of historic buildings should be incorporated into the Comprehensive Plan and the new Zoning Code. In this age when more and more professionals are pursuing entrepreneurial career paths, the opportunity to live and work in a vibrant urban neighborhood can provide a powerful draw. Individuals who work at home often need easy access to support services and value having nearby restaurants and public spaces where they can escape their isolation and see other people. New housing models integrate offices and retail into first-floor streetfront spaces with housing above. Zoning language that facilitates this type of development should be adopted. 4. Support BioPark and EBDI Developments Continued support for EBDI and UMB in their bioscience park developments will pay good dividends in the creation and exploitation of a new niche market for the city. As Baltimore proceeds to develop a larger biotech business base, it would be appropriate to ensure that provisions of the zoning code support that development. Currently, the City has no zoning category that directly responds to the needs of biotech industry. The new parks are being developed under B-2 zoning with a Planned Unit Development. Biotech park zoning should allow limited manufacturing as a matter of right with high performance standards to ensure that surrounding properties and neighborhoods are not exposed to odors, noise or safety hazards. Prototype and scale-up manufacturing is often an important element in biotech R&D. The B-2 density limits of a 0.8 Floor Area Ratio are too constraining given the benefits of more compact development in easy walking distance of university and hospital facilities. The research park zoning adopted for the Northwestern University-Evanston Research Park is instructive in its provisions for a mixed-use, higher-density urban development. The relevant portion of the Evanston zoning code is included in Appendix E. 5. Focus Corridor Redevelopment in Nodes with Superior Auto and Transit Access Along the city’s aging commercial corridors, redevelopment efforts should be focused on individual nodes to create pedestrian environments with restaurants and quality retail spaces as well as office space. Such redevelopment is encouraged by improvements to the public spaces and streetscape, low-interest loans for façade and building improvements, assembly of parcels for construction of modern new facilities, and creation of public support facilities, such as shared parking facilities and possibly Wi-Fi access to the Internet. Discourage continued conversion of streetfront rowhouses to office and retail use. 6. Adopt Station Area Plans to Encourage Transit-Oriented Development Where appropriate adopt plans for mixed-use development at future transit stations. Transit-oriented development requires higher densities to support both higher transit ridership and the retail, service and office space needed for a vibrant pedestrian center that meets neighborhood residents’ needs. Opportunities for additional office development associated with transit stations will be concentrated at

44
those stations on transit lines that have good connectivity with transit and other modes of transportation (in other words, on lines that go where people want to go) and at stations that also have good auto access and existing business activity. 7. Adopt Zoning Provisions That Offer Greater Certainty and Simplify the Development Approvals Process While zoning cannot create a market, proper zoning is a development incentive when it minimizes the impediments to appropriate development. Development entails a great deal of risk, not the least of which is the potential for significant setbacks, or even just delays, in the development approval process. Clear zoning regulations that create matter-of-right opportunities and reduce the time and uncertainty in the development approval process can help a great deal in convincing developers to take on the other risks inherent in urban development and redevelopment.

Appendix Tables

Table A-1: Employment by Place of Work, Baltimore Metropolitan Area
Percent Change, Industry 2001 2002 2003 2004 2001-04
Government Sector
Federal 42,379 42,146 42,078 41,353 -2.4%
State 65,511 66,040 65,278 64,728 -1.2%
Local 104,559 105,926 105,347 103,338 -1.2%
Total Government 212,449 214,112 212,703 209,420 -1.4%
Private Sector
Agriculture 1,351 1,414 1,395 1,355 0.3%
Mining 294 188 237 233 -20.8%
Construction 72,390 71,856 72,267 63,017 -12.9%
Manufacturing 91,553 85,416 80,353 76,271 -16.7%
Trade, Transportation & Utilities 236,135 230,207 229,646 234,066 -0.9%
Information 24,458 21,433 20,316 17,864 -27.0%
Telecommunications 12,995 10,243 9,149 8,433 -35.1%
Financial Activities 77,804 79,113 81,035 81,010 4.1%
Professional and Business Services 166,820 166,277 165,269 170,252 2.1%
Professional and technical services 85,430 86,030 87,750 91,211 6.8%
Management of companies and enterprises 3,229 3,165 3,101 3,783 17.1%
Administrative and support services 73,974 72,819 70,289 71,654 -3.1%
Waste management and remediation services 4,187 4,263 4,129 3,605 -13.9%
Education and Health Services 178,817 184,181 189,751 193,933 8.5%
Educational services 33,572 34,645 35,346 37,119 10.6%
Ambulatory health care services 41,949 42,621 43,387 44,054 5.0%
Hospitals 54,099 56,075 58,584 59,322 9.7%
Nursing and residential care facilities 29,565 30,624 29,911 30,450 3.0%
Social assistance 19,632 20,216 22,523 22,989 17.1%
Leisure and Hospitality 101,717 105,114 106,816 109,792 7.9%
Performing arts and spectator sports 3,611 2,889 2,807 3,394 -6.0%
Museums, historical sites, zoos, and parks 1,533 1,574 1,448 1,352 -11.8%
Amusements, gambling, and recreation 12,207 12,759 13,000 13,595 11.4%
Food services and drinking places 75,279 78,209 79,766 81,878 8.8%
Other Services 38,926 39,312 39,675 40,266 3.4%
Repair and maintenance 12,043 12,141 12,341 12,615 4.7%
Personal and laundry services 14,555 14,212 14,466 14,722 1.1%
Membership associations and organizations 10,081 10,765 10,780 10,944 8.6%
Private households 2,247 2,194 2,088 1,992 -11.3%
Unclassified 1,488 774 460 449 -69.8%
Total Private 991,833 985,337 987,304 1,005,279 1.4%
Total 1,204,282 1,199,449 1,200,007 1,214,699 0.9%
Sources: Maryland Department of Labor, Licensing and Regulation; Bay Area Economics, 2005.

Table A-2: Employment by Place of Work, State of Maryland
Percent Change, Industry 2001 2002 2003 2004 2001-04
Government Sector
Federal 126,782 128,314 128,264 126,911 0.1%
State 98,134 98,415 97,069 95,922 -2.3%
Local 218,036 223,486 225,125 223,476 2.5%
Total Government 442,952 450,215 450,458 446,308 0.8%
Private Sector
Agriculture 4,732 4,842 5,024 5,155 8.9%
Mining 1,546 1,224 1,223 1,522 -1.5%
Construction 164,880 165,725 167,495 175,903 6.7%
Manufacturing 168,360 156,875 147,798 111,445 -33.8%
Transportation, Transportation & Utilities 466,494 461,501 458,526 462,952 -0.8%
Information 58,380 53,402 50,365 50,121 -14.1%
Telecommunications 26,355 22,180 20,145 18,917 -28.2%
Financial Activities 148,821 151,187 156,231 156,188 5.0%
Professional and Business Services 358,310 357,504 360,676 370,605 3.4%
Professional and technical services 198,446 198,768 202,007 206,603 4.1%
Management of companies and enterprises 9,587 9,283 8,974 11,061 15.4%
Administrative and support services 143,103 142,270 142,379 146,275 2.2% Waste management and remediation services 7,174 7,183 7,316 6,802 -5.2%
Education and Health Services 307,161 318,044 326,564 333,376 8.5%
Educational services 47,487 49,240 50,289 52,664 10.9%
Ambulatory health care services 84,068 86,713 88,873 90,740 7.9%
Hospitals 82,754 85,679 88,920 89,884 8.6%
Nursing and residential care facilities 55,980 58,082 57,595 59,285 5.9%
Social assistance 36,872 38,330 40,887 41,052 11.3%
Leisure and Hospitality 208,691 215,106 218,993 224,325 7.5%
Performing arts and spectator sports 6,978 6,941 6,796 7,350 5.3%
Museums, historical sites, zoos, and parks 1,874 1,918 1,791 1,767 -5.7%
Amusements, gambling, and recreation 23,305 24,355 25,109 26,314 12.9%
Food services and drinking places 150,533 156,825 160,408 164,080 9.0%
Other Services 86,401 87,606 88,770 88,493 2.4%
Repair and maintenance 24,204 24,442 24,959 25,145 3.9%
Personal and laundry services 29,044 28,833 29,515 29,783 2.5%
Membership associations and organizations 24,227 25,304 25,462 24,849 2.6%
Private households 8,926 9,027 8,834 8,717 -2.3%
Unclassified 6,410 3,984 2,164 2,236 -65.1%
Total Private 1,980,186 1,977,181 1,984,022 2,013,983 1.7% Total 2,423,138 2,427,396 2,434,480 2,460,292 1.5%
Sources: Maryland Department of Labor, Licensing and Regulation; Bay Area Economics, 2005.
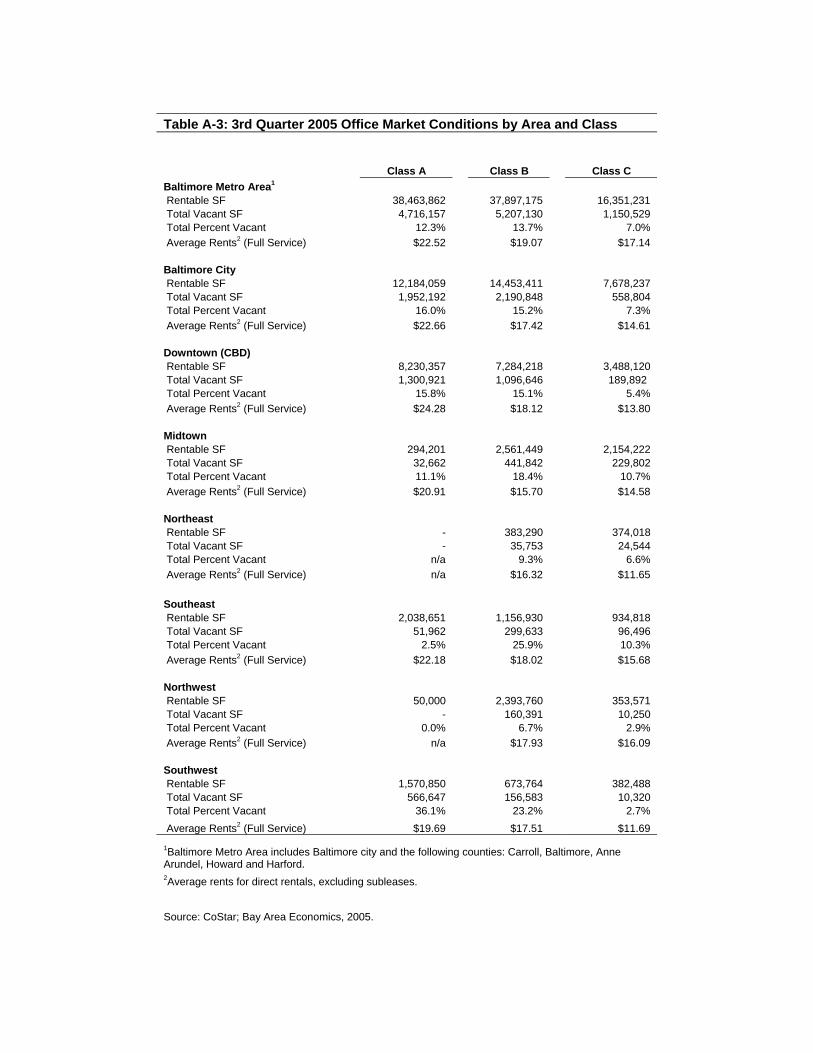
Table A-3: 3rd Quarter 2005 Office Market Conditions by Area and Class Class A Class B Class C Baltimore Metro Area1 Rentable SF 38,463,862 37,897,175 16,351,231 Total Vacant SF 4,716,157 5,207,130 1,150,529 Total Percent Vacant 12.3% 13.7% 7.0% Average Rents2 (Full Service) $22.52 $19.07 $17.14
Baltimore City Rentable SF 12,184,059 14,453,411 7,678,237 Total Vacant SF 1,952,192 2,190,848 558,804 Total Percent Vacant 16.0% 15.2% 7.3% Average Rents2 (Full Service) $22.66 $17.42 $14.61
Downtown (CBD) Rentable SF 8,230,357 7,284,218 3,488,120 Total Vacant SF 1,300,921 1,096,646 189,892 Total Percent Vacant 15.8% 15.1% 5.4% Average Rents2 (Full Service) $24.28 $18.12 $13.80
Midtown Rentable SF 294,201 2,561,449 2,154,222 Total Vacant SF 32,662 441,842 229,802 Total Percent Vacant 11.1% 18.4% 10.7% Average Rents2 (Full Service) $20.91 $15.70 $14.58
Northeast Rentable SF - 383,290 374,018 Total Vacant SF - 35,753 24,544 Total Percent Vacant n/a 9.3% 6.6% Average Rents2 (Full Service) n/a $16.32 $11.65
Southeast Rentable SF 2,038,651 1,156,930 934,818 Total Vacant SF 51,962 299,633 96,496 Total Percent Vacant 2.5% 25.9% 10.3% Average Rents2 (Full Service) $22.18 $18.02 $15.68
Northwest Rentable SF 50,000 2,393,760 353,571 Total Vacant SF - 160,391 10,250 Total Percent Vacant 0.0% 6.7% 2.9% Average Rents2 (Full Service) n/a $17.93 $16.09
Southwest Rentable SF 1,570,850 673,764 382,488 Total Vacant SF 566,647 156,583 10,320 Total Percent Vacant 36.1% 23.2% 2.7% Average Rents2 (Full Service) $19.69 $17.51 $11.69
1Baltimore Metro Area includes Baltimore city and the following counties: Carroll, Baltimore, Anne Arundel, Howard and Harford. 2Average rents for direct rentals, excluding subleases. Source: CoStar; Bay Area Economics, 2005.

Workers % of Total Workers % of Total Workers % of Total Workers % of Total
30 0.4% 10 0.0% 0 0.0% 4 0.1%420 5.0% 890 4.4% 605 11.2% 745 10.8%600 7.2% 673 3.3% 249 4.6% 379 5.5%234 2.8% 355 1.7% 68 1.3% 200 2.9%
1,125 13.4% 1,059 5.2% 600 11.1% 1,329 19.3%159 1.9% 314 1.5% 120 2.2% 165 2.4%170 2.0% 504 2.5% 110 2.0% 55 0.8%565 6.7% 603 3.0% 400 7.4% 380 5.5%618 7.4% 1,949 9.6% 450 8.3% 359 5.2%
1,875 22.3% 10,970 54.0% 1,690 31.2% 2,165 31.4%570 6.8% 1,529 7.5% 210 3.9% 464 6.7%
1,005 12.0% 1,059 5.2% 655 12.1% 545 7.9%1,020 12.2% 409 2.0% 200 3.7% 105 1.5%
0 0.0% 8 0.0% 55 1.0% 0 0.0%Total 8,391 100.0% 20,332 100.0% 5,412 100.0% 6,895 100.0%
Table A-4: Workers By Industry Along North Baltimore Corridors
Industry
Corridor
Agriculture, Forestry, Mining
Reisterstown Road1 York Road2 Harford Road3 Belair Road4
ConstructionManufacturingWholesale TradeRetail TradeTransportation, Warehousing, UtilitiesInformationFinance, Insurance, Real EstateProfessional, Management, Administrative Services
Armed Forces
Notes: 1) Includes the following 2000 Census tracts: 1513, 2716, 2718.01, 2718.02, 2719, 2720.01, 2801.01.
Educational, Health and Social ServicesEntertainment, Accommodations, Food ServicesOther Services (Except Public)Public Administration
2) Includes the following 2000 Census tracts: 901, 903, 904, 905, 1201, 1202, 1203, 2708.04, 2708.05, 2710.01, 2710.02, 2711.01, 2711.02, 2712.3) Includes the following 2000 Census tracts: 2701.01, 2702, 2703.01, 2703.02, 2704.02, 2705.01, 2705.02, 2706, 2707.02, 2707.03.4) Includes the following 2000 Census tracts: 801.01, 801.02, 2601.01, 2601.02, 2602.01, 2602.02, 2603.01, 2701.01, 2701.02, 2704.01, 2705.01, 2705.02.
Source: U.S. Census of Population, 2000; University of Wisconsin-Milwaukee Employment Training Institute/Southern University at New Orleans; BAE 2005

Table A-5: Workers By Occupation Along North Baltimore Corridors
CorridorWorkers % of Total Workers % of Total Workers % of Total Workers % of Total
Occupational GroupingManagement 725 8.7% 1,844 9.1% 370 6.9% 459 6.7%Farmers, Farm Managers 4 0.0% 0 0.0% 0 0.0% 0 0.0%Business, Financial Operations 343 4.1% 659 3.2% 189 3.5% 212 3.1%Computer, Mathematical 119 1.4% 754 3.7% 32 0.6% 32 0.5%Architecture, Engineering 35 0.4% 168 0.8% 59 1.1% 39 0.6%Life, Physical, Social Science 55 0.7% 918 4.5% 39 0.7% 60 0.9%Community, Social Service 415 5.0% 458 2.3% 138 2.6% 102 1.5%Legal 35 0.4% 133 0.7% 75 1.4% 18 0.3%Education, Training, Library 585 7.0% 2,885 14.2% 695 12.9% 865 12.6%Arts, Design, Entertainment, Sports, Media 80 1.0% 499 2.5% 114 2.1% 109 1.6%Healthcare Practitioners, Technicians 264 3.2% 2,113 10.4% 255 4.7% 305 4.4%Healthcare Support 269 3.2% 449 2.2% 133 2.5% 187 2.7%Protective Service 454 5.4% 363 1.8% 155 2.9% 124 1.8%Food Preparation, Serving Related 270 3.2% 1,055 5.2% 153 2.8% 315 4.6%Building, Grounds Clearing, Maintenance 379 4.5% 757 3.7% 150 2.8% 210 3.1%Personal Care, Service 480 5.7% 774 3.8% 328 6.1% 348 5.1%Sales, Related 1,130 13.5% 1,235 6.1% 529 9.8% 939 13.6%Office, Administrative Support 1,080 12.9% 2,990 14.7% 805 15.0% 889 12.9%Farming, Fishing, Forestry 40 0.5% 0 0.0% 0 0.0% 30 0.4%Construction, Excavation 314 3.8% 730 3.6% 475 8.8% 559 8.1%Installation, Maintenance, Repairs 410 4.9% 525 2.6% 234 4.4% 344 5.0%Production 564 6.7% 374 1.8% 265 4.9% 399 5.8%Transportation, Material Moving 319 3.8% 634 3.1% 179 3.3% 340 4.9%Armed Forces 0 0.0% 4 0.0% 0 0.0% 0 0.0%
Total 8,369 100.0% 20,321 100.0% 5,372 100.0% 6,885 100.0%
Notes: 1) Includes the following 2000 Census tracts: 1513, 2716, 2718.01, 2718.02, 2719, 2720.01, 2801.01.2) Includes the following 2000 Census tracts: 901, 903, 904, 905, 1201, 1202, 1203, 2708.04, 2708.05, 2710.01, 2710.02, 2711.01, 2711.02, 2712.3) Includes the following 2000 Census tracts: 2701.01, 2702, 2703.01, 2703.02, 2704.02, 2705.01, 2705.02, 2706, 2707.02, 2707.03.4) Includes the following 2000 Census tracts: 801.01, 801.02, 2601.01, 2601.02, 2602.01, 2602.02, 2603.01, 2701.01, 2701.02, 2704.01, 2705.01, 2705.02.
Source: U.S. Census of Population, 2000; University of Wisconsin-Milwaukee Employment Training Institute/Southern University at New Orleans; BAE 2005
Reisterstown Road1 York Road2 Harford Road3 Belair Road4

Appendix B. Evaluation of Glen/Fallstaff/Patterson Station Area
HOME APPRAISAL & INSPECTION SERVICE, INC. 100 WEST ROAD, SUITE 300
TOWSON, MARYLAND 21204 (410)521-9945
Inventory of Non-Retail Commercial Activity Glen/Fallstaff/Patterson Station Areas
Report Prepared For Bay Area Economics
Report Dated September 8, 2005

2
September 8, 2005 Re: Glen/Fallstaff/Patterson Station Dear Ms. Morrison Pursuant to your request, I have inspected the above areas to determine the amount and type of office space available for the area. I have also researched properties specifically office space which has sold in the past 3 years in or near that northwest corridor of Baltimore City. As a result of The supporting data analysis and conclusion upon are contained in the accompanying report. Respectfully submitted,
______________________________ Gale A. McClelland Certification #03-1522 MD

3
AREA DESCRIPTION The target area is made up of three neighborhoods known as Glen, Fallstaff, and Patterson Station. The target area boundaries include Menlo Drive to the south, Wabash Avenue to the west, Fallstaff to the north, and Park Heights Avenue to the east. The area consists of a mixture of retail space, office space, industrial space, multi-family dwellings, and single family dwellings. Amenities include easy access to downtown Baltimore, major highways, neighborhood shopping, places of worship, public transportation, employment centers, and public/private schools. Offices: Reisterstown Road at Patterson Avenue Address Type # of Stories Type/Name
Business Gross Building Area
Lot Dimensions/ Lot Size
Parking Remarks
4121-4137 Amos Ave
Class B Flex 1 Story Mult-tenant 32,200 Unk Surface Parking
Menlo Industrial Park
4139-4153 Amos Ave.
Class B Flex 1 Story Multi-tenant 20,400 .94 Ac. Surface Parking
Menlow Industrial Park
4214-4226 Amos Ave.
Class B Flex 1 Story Multi-tenant 23,088 3.82 Ac Surface Parking
Menlo Industrial Park
4230 Amos Avenue
Class A Flex 1 story Multi-tenant 75,000 5 Ac Unk Proposed Menlo Industrial Park
4124-4134 Menlo Drive
Class B Flex/Warehouse
1 story Multi-tenant 34,480 1.58 Ac Surface Parking
Menlo Industrial Park
6100 Oak leaf Ave.
Flex 1 story Single Tenant
28,000 2 Ac Unk Proposed
6101-6107 Oakleaf Ave.
Class B Flex/Warehouse
1 story Multi-tenant 22,240 1.99 Ac Surface Parking
Menlo Industrial Park
4201 Patterson Avenue
Class B Office 5 Stories Dept of Health
84,674 No plat found 134,600 Sq.Ft.
Good Surface Parking
State Gov Lease Space
6609-15 Reisterstown Road
Class B Office/Medical
2 Stories
Baltimore Medical Professional Building
37,180 No Plat found 67,954 Sq. Ft.
Good Surface Parking
Noted a mixture of business
6776 Office Plaza Ctr.
Class B Office 2 Dept of Public Safety
123,000 No Plat Found Unknown
Limited Surface Parking
Attached to a mall
6819-21 Reisterstown Road
Class C Office 2 Stories
Fallstaff Professional
6,793 107x125 13,438 Sq. Ft.
Average small parking lot
Professional offices
There appear to be an even balance of Flex/office/warehouse space, Retail, and Office Space. The appraiser noted quite a bit of mixed use properties. There are 2 proposed flex spaces in this target area. No new proposed office spaces noted. Gross building area ranges from 6,793 – 123,000 with typical size in the low 20,000s

Location:
Stories:
Total Avail:
Status:
Management:Recorded Owner: Ward-Haines Limited Partnership
Menlo Industrial Park, Inc.
1
Built 1974Baltimore City Ind ClusterBaltimore NW Ind SubmarketBaltimore City CountyBaltimore, MD 21215
No Spaces Currently Available
Building Type: Class B Flex
% Leased: 100%
Tenancy: Multiple Tenant
Land Area: -
-Drive Ins:
20'0" Crane: None
Cross Docks:1Rail Line: None
Utilities: Heating - Oil (Fired), Sewer - City, Water - City
Column Spacing: -
Loading Docks: 6 extPower: -
Ceiling Height:
RBA: 32,200 SF
Const Mat: -
Free Surface Spaces; Ratio of 1.00/1,000 SFProperty Manager on SiteAmenities:
For Sale: Not For SaleParking:
Building NotesThe building has ample parking. It is close to Jones Falls Expressway, the beltway, and their is a metro station nearby. Dock and drive-in loading.
4121-4137 Amos Ave - Menlo Industrial Park
This copyrighted report contains research licensed to Home Appraisal and Inspections - 190257.

Location:
Stories:
Total Avail:
Status:
Management:Recorded Owner: Ward-Haines Limited Partnership
Menlo Industrial Park, Inc.
1
Built 1974Baltimore City Ind ClusterBaltimore NW Ind SubmarketBaltimore City CountyBaltimore, MD 21215
No Spaces Currently Available
Building Type: Class B Flex
% Leased: 100%
Tenancy: Multiple Tenant
Land Area: 0.94 AC
NoneDrive Ins:
20'0" Crane: None
Cross Docks:4Rail Line: None
Utilities: Heating - Gas
Column Spacing: -
Loading Docks: 7 extPower: -
Ceiling Height:
RBA: 20,400 SF
Const Mat: Masonry
Free Surface Spaces; Ratio of 1.00/1,000 SFProperty Manager on SiteAmenities:
For Sale: Not For SaleParking:
Building NotesAmple parking, close to Jones Falls Expressway and Beltway, metro station nearby, dock and drive-in loading, attractive industrial park.
4139-4153 Amos Ave - Menlo Industrial Park
This copyrighted report contains research licensed to Home Appraisal and Inspections - 190257.

Location:
Stories:
Total Avail:
Status:
Management:Recorded Owner: Ward-Haines Limited Partnership
Menlo Industrial Park, Inc.
1
Built 1976Baltimore City Ind ClusterBaltimore NW Ind SubmarketBaltimore City CountyBaltimore, MD 21215
No Spaces Currently Available
Building Type: Class B Flex
% Leased: 100%
Tenancy: Multiple Tenant
Land Area: 3.82 AC
-Drive Ins:
18'0"-20'0" Crane: None
Cross Docks:-Rail Line: None
Utilities: Heating - Gas
Column Spacing: -
Loading Docks: -Power: -
Ceiling Height:
RBA: 23,088 SF
Const Mat: -
Free Surface Spaces; Ratio of 1.00/1,000 SFProperty Manager on SiteAmenities:
For Sale: Not For Sale
Parking:28-01-4281-112Parcel Number:
Building NotesVideo, audio production studio. Located one block from Reisterstown Rd and also one block from Northern Parkway. A metro station is nearby and there is also ample parking.
4214-4226 Amos Ave - Menlo Industrial Park
This copyrighted report contains research licensed to Home Appraisal and Inspections - 190257.

Location:
Stories:
Total Avail:
Status:
Management:Recorded Owner: Ward-Haines Limited Partnership
Menlo Industrial Park, Inc.
1
ProposedBaltimore City Ind ClusterBaltimore NW Ind SubmarketBaltimore City CountyBaltimore, MD 21215
75,000 SF
Building Type: Class A Flex
% Leased: 0%
Tenancy: Multiple Tenant
Land Area: 5 AC
-Drive Ins:
- Crane: -
Cross Docks:-Rail Line: -
Utilities: -
Column Spacing: -
Loading Docks: -Power: -
Ceiling Height:
RBA: 75,000 SF
Const Mat: -
For Sale: Not For Sale28-01-4281-112Parcel Number:
Floor OccupancyRent/SF/Yr + Svs TermBldg ContigSF Avail Use/TypeE 75,000 div TBDNegotiable75,000 NewTBDWill divide to 50,000 sf
1st
Building NotesBuilt to suit property, ready for development.
4230 Amos Ave - Menlo Industrial Park
This copyrighted report contains research licensed to Home Appraisal and Inspections - 190257.

Location:
Stories:
Total Avail:
Status:
Management:Recorded Owner: Ward-Haines Limited Partnership
Menlo Industrial Park, Inc.
1
Built 1963Baltimore City Ind ClusterBaltimore NW Ind SubmarketBaltimore City CountyBaltimore, MD 21215
10,240 SF
Building Type: Class B Flex/Warehouse
% Leased: 100%
Tenancy: Multiple Tenant
Land Area: 1.58 AC
NoneDrive Ins:
18'0"-20'0" Crane: None
Cross Docks:1Rail Line: CSX
Utilities: Heating - Gas
Column Spacing: -
Loading Docks: 4 extPower: -
Ceiling Height:
RBA: 34,480 SF
Const Mat: Masonry
Free Surface Spaces; Ratio of 1.00/1,000 SFProperty Manager on SiteAmenities:
For Sale: Not For Sale
Parking:28-01-4281-004Parcel Number:
Floor OccupancyRent/SF/Yr + Svs TermBldg ContigSF Avail Use/TypeP 10,240/1,000 ofc 30 Days$6.00/ig10,240 DirectNegotiable1st
Building Notes3/97 Winkle Hawk leased 10,240 sf at 4124 Menlo. Clara Haines represented the landlord, Ward-Haines, L.P.
11/95 Italian Gourmet Foods leased 14,400 sf at 4128-34 Menlo. Thomas Haines of Menlo Industrial Park, Inc represented in the transaction
Ample Parking; close to Jones Falls Expressway and Beltway. Metro station nearby. Dock and drive-in loading. Attractive industrial park.
4124-4134 Menlo Dr - Menlo Industrial Park
This copyrighted report contains research licensed to Home Appraisal and Inspections - 190257.

Ample Parking; close to Jones Falls Expressway and Beltway. Metro station nearby. Dock and drive-in loading. Attractive industrial park.
4124-4134 Menlo Dr - Menlo Industrial Park(cont'd)
This copyrighted report contains research licensed to Home Appraisal and Inspections - 190257.

Location:
Stories:
Total Avail:
Status:
Management:Recorded Owner: Menlo Industrial Park, Inc.
Menlo Industrial Park, Inc.
1
ProposedBaltimore City Ind ClusterBaltimore NW Ind SubmarketBaltimore City CountyBaltimore, MD 21215
28,000 SF
Building Type: Flex
% Leased: 0%
Tenancy: Single Tenant
Land Area: 2 AC
-Drive Ins:
- Crane: -
Cross Docks:-Rail Line: -
Utilities: -
Column Spacing: -
Loading Docks: -Power: -
Ceiling Height:
RBA: 28,000 SF
Const Mat: -
For Sale: Not For Sale
Floor OccupancyRent/SF/Yr + Svs TermBldg ContigSF Avail Use/TypeE 28,000 TBDNegotiable28,000 NewTBD1st
Building NotesBuilt-to-suit
Located one block from Reisterstown Rd and one block from Northern Parkway. There is a large truck court on-site with ample parking and a metro station nearby.
6100 Oakleaf Ave - Menlo Industrial Park
This copyrighted report contains research licensed to Home Appraisal and Inspections - 190257.

Location:
Stories:
Total Avail:
Status:
Management:Recorded Owner: Menlo Industrial Park, Inc.
Menlo Industrial Park, Inc.
1
Built 1977Baltimore City Ind ClusterBaltimore NW Ind SubmarketBaltimore City CountyBaltimore, MD 21215
No Spaces Currently Available
Building Type: Class B Flex/Warehouse
% Leased: 100%
Tenancy: Multiple Tenant
Land Area: 1.99 AC
NoneDrive Ins:
18'0"-20'0" Crane: None
Cross Docks:2Rail Line: None
Utilities: Heating - Gas
Column Spacing: -
Loading Docks: 1 extPower: -
Ceiling Height:
RBA: 22,240 SF
Const Mat: Masonry
Free Surface Spaces; Ratio of 1.00/1,000 SFProperty Manager on SiteAmenities:
For Sale: Not For Sale
Parking:28-01-4281-102Parcel Number:
Building Notes* Ample Parking
* Close to Jones Falls Expressway and Beltway
* Metro station nearby
* Dock and drive-in loading
* Attractive industrial park
6101-6107 Oakleaf Ave - Menlo Industrial Park
This copyrighted report contains research licensed to Home Appraisal and Inspections - 190257.

* Dock and drive-in loading
* Attractive industrial park
6101-6107 Oakleaf Ave - Menlo Industrial Park(cont'd)
This copyrighted report contains research licensed to Home Appraisal and Inspections - 190257.

Location:
Stories:
Total Avail:
Status:
Developer:Management:
Recorded Owner: Brooks & GoldmanBrooks & GoldmanBrooks & Goldman
1
Built 1970Patterson VillageAKA Wabash @ Reisterstown RdBaltimore City West ClusterBaltimore Northwest SubmarketBaltimore City CountyBaltimore, MD 21215
No Spaces Currently Available
Building Type: Class C Office/Medical
% Leased: 100%
RBA: 37,500 SFTypical Floor: 37,500 SF
Free Surface SpacesDry Cleaner, Food Service, RestaurantAmenities:
For Sale: Not For SaleParking:
4117-4173 Patterson Ave - Patterson Village
This copyrighted report contains research licensed to Home Appraisal and Inspections - 190257.

Location:
Stories:
Total Avail:
Status:
Developer:Management:
Recorded Owner: HUB MA Realty TrustReit Management & Research LLC-
6
Built Jun 1989Baltimore City West ClusterBaltimore Northwest SubmarketBaltimore City CountyBaltimore, MD 21215
No Spaces Currently Available
Building Type: Class B Office
% Leased: 100%
RBA: 84,674 SFTypical Floor: 14,112 SF
For Sale: Not For Sale28-01-4276C-090Parcel Number:
Building Notes3/31/99: Building sold to HRPT Properties Trust for $9 million. The seller was Metro LP. Casey/ONCOR International represented both the buyer and the seller.
4201 Patterson Ave
This copyrighted report contains research licensed to Home Appraisal and Inspections - 190257.

Location:
Stories:
Total Avail:
Status:
Developer:Management:
Recorded Owner: Pikesville Properties-Uptown Federal Savings & Loan
3
Built 1963, Renov May 1997Baltimore Medical & Professional BldgBaltimore City West ClusterBaltimore Northwest SubmarketBaltimore City CountyBaltimore, MD 21215
No Spaces Currently Available
Building Type: Class B Office/Medical
% Leased: 100%
RBA: 35,000 SFTypical Floor: 11,667 SF
Free Surface Spaces; Ratio of 4.00/1,000 SFAtrium, Property Manager on Site, SignageAmenities:
For Sale: Not For Sale
Parking:27-23-4293-014Parcel Number:
Building NotesNew roof, full interior renovation, new exterior wall. Parking lot to be resurfaced. Frontage and visibility on Reisterstown Rd. Former bank branch and medical office.
6609-6615 Reisterstown Rd - Baltimore Medical & Professional Bldg
This copyrighted report contains research licensed to Home Appraisal and Inspections - 190257.

Location:
Stories:
Total Avail:
Status:
Developer:Management:
Recorded Owner: Reisterstown Plaza AssociatesContinental Realty CorporationContinental Realty Corporation
2
Built Dec 1986Plaza Office TowerNW CornerBaltimore City West ClusterBaltimore Northwest SubmarketBaltimore City CountyBaltimore, MD 21215
No Spaces Currently Available
Building Type: Class B Office
% Leased: 100%
RBA: 123,000 SFTypical Floor: 61,500 SF
Free Surface Spaces; Ratio of 5.00/1,000 SFCorner LotAmenities:
For Sale: Not For SaleParking:
Building NotesCurrently, this building represents the top two floors of office space attached to The Plaza shopping mall.
6776 Reisterstown Rd - Plaza Office Tower
This copyrighted report contains research licensed to Home Appraisal and Inspections - 190257.

Location:
Stories:
Total Avail:
Status:
Developer:Management:
Recorded Owner: Dr & Mrs Saluja--
1
Built Jun 1969SE CornerBaltimore City West ClusterBaltimore Northwest SubmarketBaltimore City CountyBaltimore, MD 21215
No Spaces Currently Available
Building Type: Class C Office
% Leased: 100%
RBA: 6,800 SFTypical Floor: 6,800 SF
Corner LotAmenities:
For Sale: Not For Sale27-23-4218J-004Parcel Number:
6819 Reisterstown Rd
This copyrighted report contains research licensed to Home Appraisal and Inspections - 190257.

Address ProposedUse
City ST Price Company Listing Sale Broker PhoneSize (AC)Parcel
(Land)Price/AC
Zoning
4121-4137 Amos AveMenlo Industrial Park
- Baltimore MD No - - - - -M-1-1
4139-4153 Amos AveMenlo Industrial Park
- Baltimore MD No 0.94 - - - -M-1-1
4214-4226 Amos AveMenlo Industrial Park
- Baltimore MD No 3.82 - - - -M-1-1
4230 Amos AveMenlo Industrial Park
- Baltimore MD No 5 - - - -M-2
4124-4134 Menlo DrMenlo Industrial Park
- Baltimore MD No 1.58 - - - -M-1-1
6100 Oakleaf AveMenlo Industrial Park
- Baltimore MD No 2 - - - -M-2
6101-6107 Oakleaf AveMenlo Industrial Park
- Baltimore MD No 1.99 - - - -Multiple
4117-4173 Patterson AvePatterson Village
- Baltimore MD No - - - - --
4201 Patterson Ave - Baltimore MD No 3.09 - - - -Multiple
6609-6615 Reisterstown RdBaltimore Medical & Professional Bldg
- Baltimore MD No 1.55 - - - -B-2-1
6776 Reisterstown RdPlaza Office TowerNW Corner
- Baltimore MD No - - - - --
6819 Reisterstown RdSE Corner
- Baltimore MD No 0.31 - - - -C1
This copyrighted report contains research licensed to Home Appraisal and Inspections - 190257.
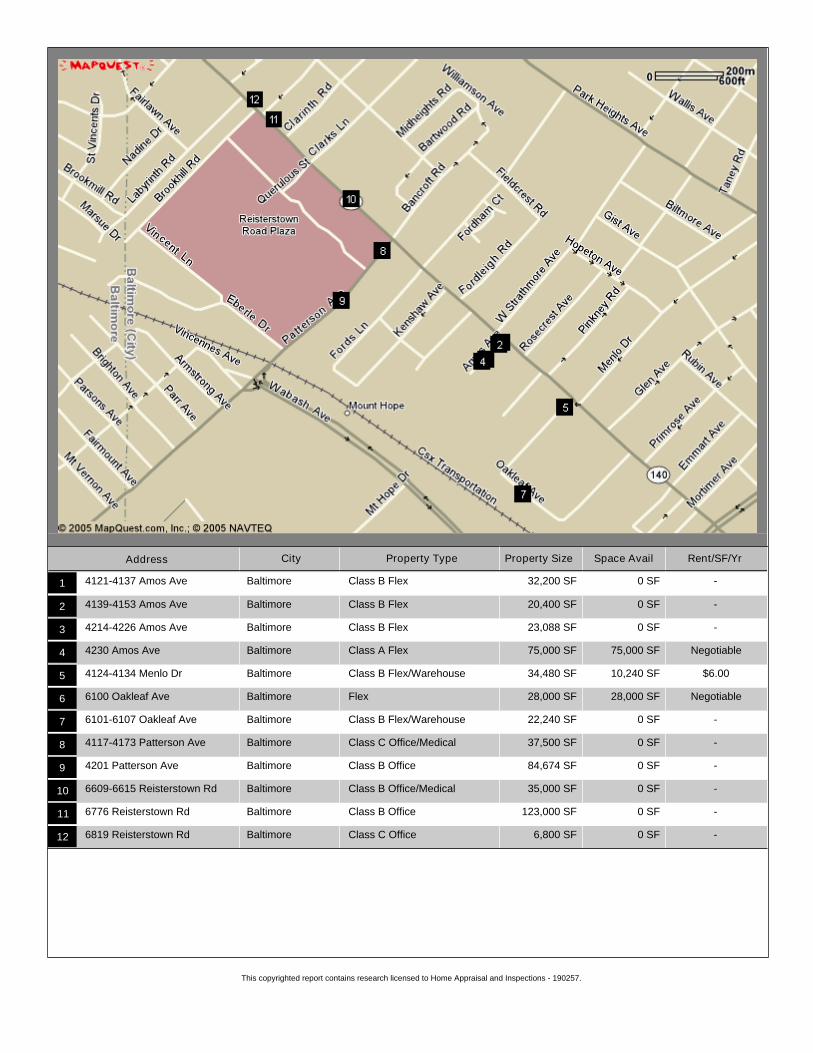
Address City Property Type Property Size Space Avail Rent/SF/Yr
Class B Flex 32,200 SF 0 SF -4121-4137 Amos Ave Baltimore1
Class B Flex 20,400 SF 0 SF -4139-4153 Amos Ave Baltimore2
Class B Flex 23,088 SF 0 SF -4214-4226 Amos Ave Baltimore3
Class A Flex 75,000 SF 75,000 SF Negotiable4230 Amos Ave Baltimore4
Class B Flex/Warehouse 34,480 SF 10,240 SF $6.004124-4134 Menlo Dr Baltimore5
Flex 28,000 SF 28,000 SF Negotiable6100 Oakleaf Ave Baltimore6
Class B Flex/Warehouse 22,240 SF 0 SF -6101-6107 Oakleaf Ave Baltimore7
Class C Office/Medical 37,500 SF 0 SF -4117-4173 Patterson Ave Baltimore8
Class B Office 84,674 SF 0 SF -4201 Patterson Ave Baltimore9
Class B Office/Medical 35,000 SF 0 SF -6609-6615 Reisterstown Rd Baltimore10
Class B Office 123,000 SF 0 SF -6776 Reisterstown Rd Baltimore11
Class C Office 6,800 SF 0 SF -6819 Reisterstown Rd Baltimore12
This copyrighted report contains research licensed to Home Appraisal and Inspections - 190257.

Appendix C. Evaluation of the Belvedere Avenue Node

Location:
Stories:
Total Avail:
Status:
Developer:Management:
Recorded Owner: Century Building Ltd. PartnershipAlbert Marani & Bertero Basignani-
2
Built 1963Century BldgAKA 5910 York RdgSW CornerBaltimore City East ClusterBaltimore Northeast SubmarketBaltimore City CountyBaltimore, MD 21212
No Spaces Currently Available
Building Type: Class C Office
% Leased: 100%
RBA: 15,000 SFTypical Floor: 5,000 SF
Free Surface Spaces; Ratio of 4.00/1,000 SFCorner LotAmenities:
For Sale: Not For SaleParking:
Building NotesLocated along the York Road corridor within walking distance to restaurants, retail shopping, and local bus stops. On-site banking and dry cleaning. Elevator access to 2nd floor. One level partly below grade.
441 E Belvedere Ave - Century Bldg
This copyrighted report contains research licensed to Home Appraisal and Inspections - 190257.

Location:
Stories:
Total Avail:
Status:
Developer:Management:
Recorded Owner: Tsunami LLC--
3
Built Dec 1965Govans Medical CenterBaltimore City East ClusterBaltimore Northeast SubmarketBaltimore City CountyBaltimore, MD 21212
No Spaces Currently Available
Building Type: Class C Office/Medical
% Leased: 100%
RBA: 24,963 SFTypical Floor: 8,000 SF
Free Surface Spaces; Ratio of 5.00/1,000 SF
For Sale: Not For Sale
Parking:27-64-5099-008Parcel Number:
Building NotesNewly renovated common areas and elevators. New ownership is providing upgraded signage on York Road and is relandscaping the exterior and upgrading the exterior of the building. Great exposure with huge parking lot.
* Handicap accessible *
5820 York Rd - Govans Medical Center
This copyrighted report contains research licensed to Home Appraisal and Inspections - 190257.
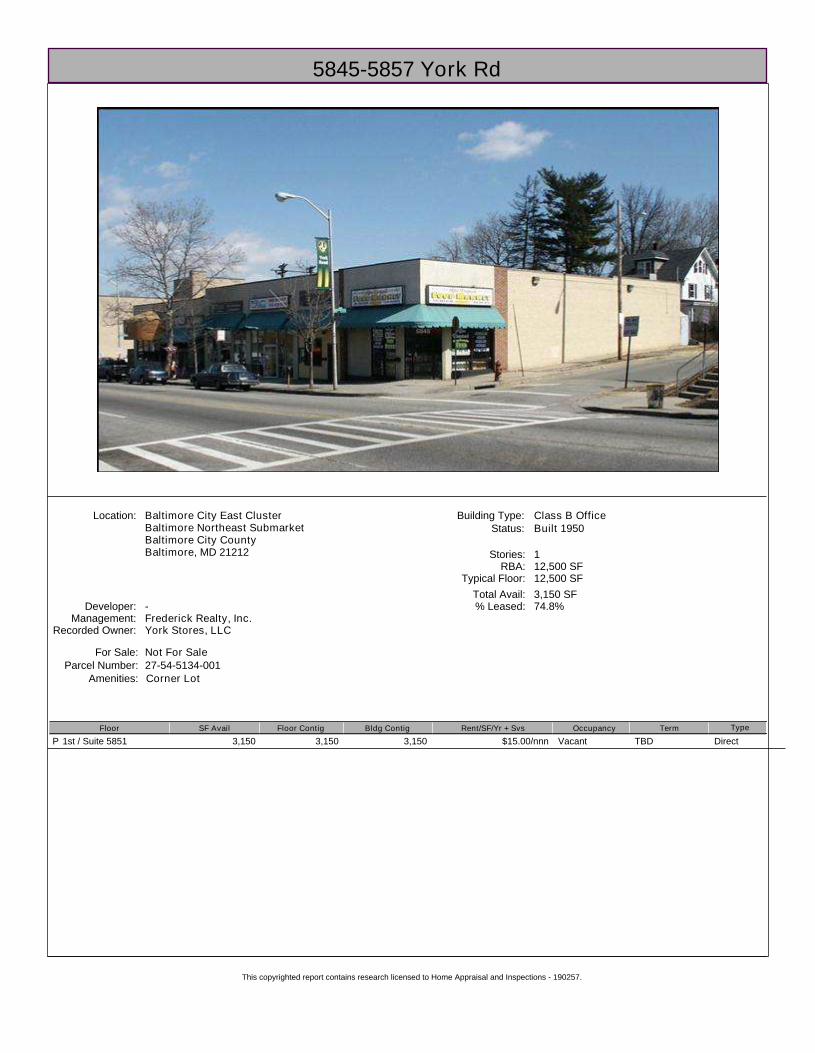
Location:
Stories:
Total Avail:
Status:
Developer:Management:
Recorded Owner: York Stores, LLCFrederick Realty, Inc.-
1
Built 1950Baltimore City East ClusterBaltimore Northeast SubmarketBaltimore City CountyBaltimore, MD 21212
3,150 SF
Building Type: Class B Office
% Leased: 74.8%
RBA: 12,500 SFTypical Floor: 12,500 SF
Corner LotAmenities:
For Sale: Not For Sale27-54-5134-001Parcel Number:
Floor OccupancyRent/SF/Yr + Svs TermBldg ContigFloor ContigSF Avail Type
3,150 Vacant$15.00/nnn3,150 3,150 TBDP 1st / Suite 5851 Direct
5845-5857 York Rd
This copyrighted report contains research licensed to Home Appraisal and Inspections - 190257.

Location:
Stories:
Total Avail:
Status:
Developer:Management:
Recorded Owner: Household Credit Services, Inc.--
2
Built 1953NW CornerBaltimore City East ClusterBaltimore Northeast SubmarketBaltimore City CountyBaltimore, MD 21212
No Spaces Currently Available
Building Type: Class B Office
% Leased: 100%
RBA: 17,100 SFTypical Floor: 8,700 SF
Free Surface Spaces; Ratio of 0.50/1,000 SFCorner LotAmenities:
For Sale: Not For Sale
Parking:27-64-5093C-004Parcel Number:
Building NotesOctober 2004: This property was sold by private investor Kee Ju Choi to RGB Enterprises for 847,500.
5900 York Rd
This copyrighted report contains research licensed to Home Appraisal and Inspections - 190257.

Metropolitan Regional Information Systems, Inc. Gallery Report
5810 YORK RD BALTIMORE, MD 21212 TAX ID#: 0327645099 006 Leg Subd: Owner: X CUOMO L L C F Addtnl:
Abs Owner: Y
Tax Map: Map: 27
Lot/Block: 6 Zoning: 0B022
Land Use Code: Commercial
Census Trct/Blck: 270,805 Year Built: 1920
Total Tax Bill: $6,557 County/St: Front Foot Fee: Spec Assmt: Assessed: 2003 Tax Value: $277,666 Deed Liber/Folio: 3853/358 Grantor: Model: Living Area: 5,866 Ext Wall: Roof: LotSize: 9,378 Acreage: 0.22 Legal Description: IMPS 80-1X133-10
City Tax: $6,205 Refuse: Improvement: $213,800 Deed Date:
Grantee: CUOMO, FRANCIS X
Tax Levy Yr: 2004 Tax Rate: 2.46 Land: $75,000 Deed Price: $0
Units: 0 Rooms: BR: FB: HB: Heat: Stories:
Sewer: Bsmt Type:
Phone #:
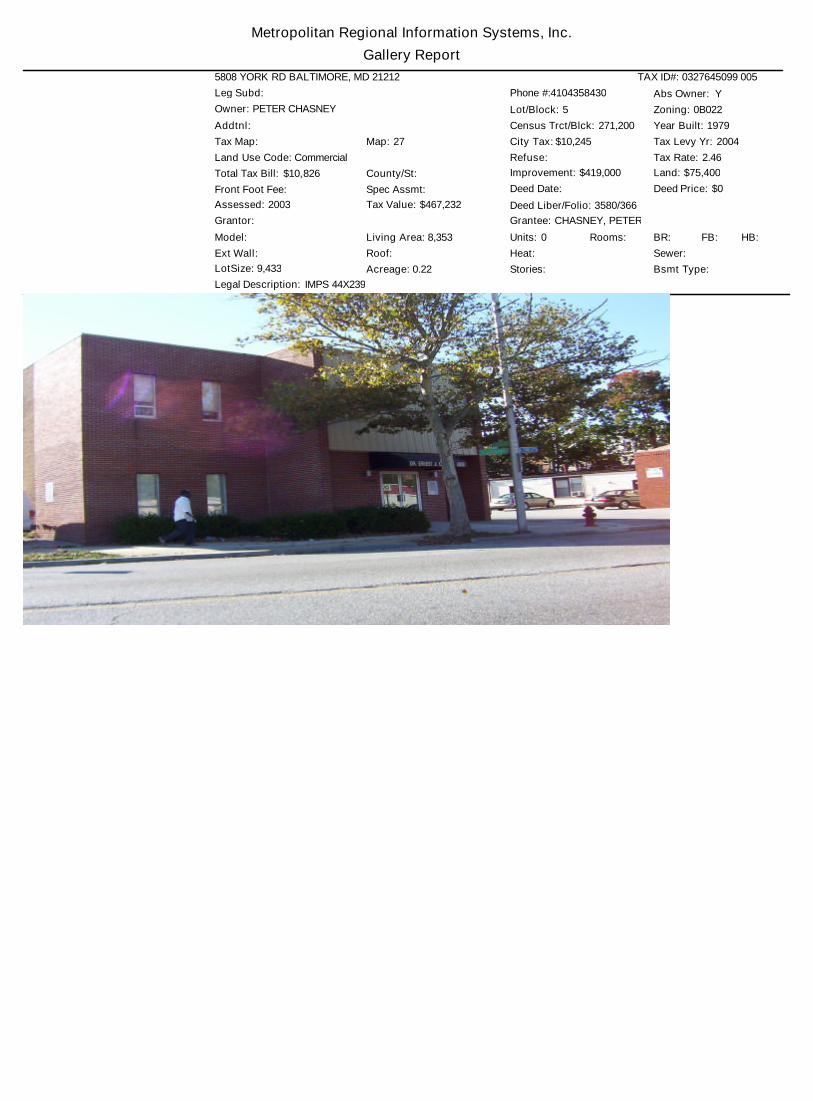
Metropolitan Regional Information Systems, Inc. Gallery Report
5808 YORK RD BALTIMORE, MD 21212 TAX ID#: 0327645099 005 Leg Subd: Owner: PETER CHASNEY Addtnl:
Abs Owner: Y
Tax Map: Map: 27
Lot/Block: 5 Zoning: 0B022
Land Use Code: Commercial
Census Trct/Blck: 271,200 Year Built: 1979
Total Tax Bill: $10,826 County/St: Front Foot Fee: Spec Assmt: Assessed: 2003 Tax Value: $467,232 Deed Liber/Folio: 3580/366 Grantor: Model: Living Area: 8,353 Ext Wall: Roof: LotSize: 9,433 Acreage: 0.22 Legal Description: IMPS 44X239
City Tax: $10,245 Refuse: Improvement: $419,000 Deed Date:
Grantee: CHASNEY, PETER
Tax Levy Yr: 2004 Tax Rate: 2.46 Land: $75,400 Deed Price: $0
Units: 0 Rooms: BR: FB: HB: Heat: Stories:
Sewer: Bsmt Type:
Phone #:4104358430

Metropolitan Regional Information Systems, Inc. Gallery Report
5710 BELLONA AVE BALTIMORE, MD 21212 TAX ID#: 0327115014A008 Leg Subd: Owner: Addtnl:
Abs Owner: Y
Tax Map: Map: 27
Lot/Block: 8 Zoning: 0Y010
Land Use Code: Commercial
Census Trct/Blck: 271,200 Year Built: 1965
Total Tax Bill: $8,289 County/St: Front Foot Fee: Spec Assmt: Assessed: 2003 Tax Value: $406,032 Deed Liber/Folio: 4586/482 Grantor: JONES FALLS COMMUNITY CORPORAT Model: Living Area: 8,480 Ext Wall: Roof: LotSize: 15,000 Acreage: 0.34 Legal Description: IMPS 100X150
City Tax: $7,845 Refuse: Improvement: $400,100 Deed Date: 10-Nov-2003
Grantee: SAMADHI ENTERPRISES, INC
Tax Levy Yr: 2004 Tax Rate: 2.46 Land: $75,000 Deed Price: $450,000
Units: 0 Rooms: BR: FB: HB: Heat: Stories:
Sewer: Bsmt Type:
Phone #:
.

Appendix D. Evaluation of the Echodale Avenue Node
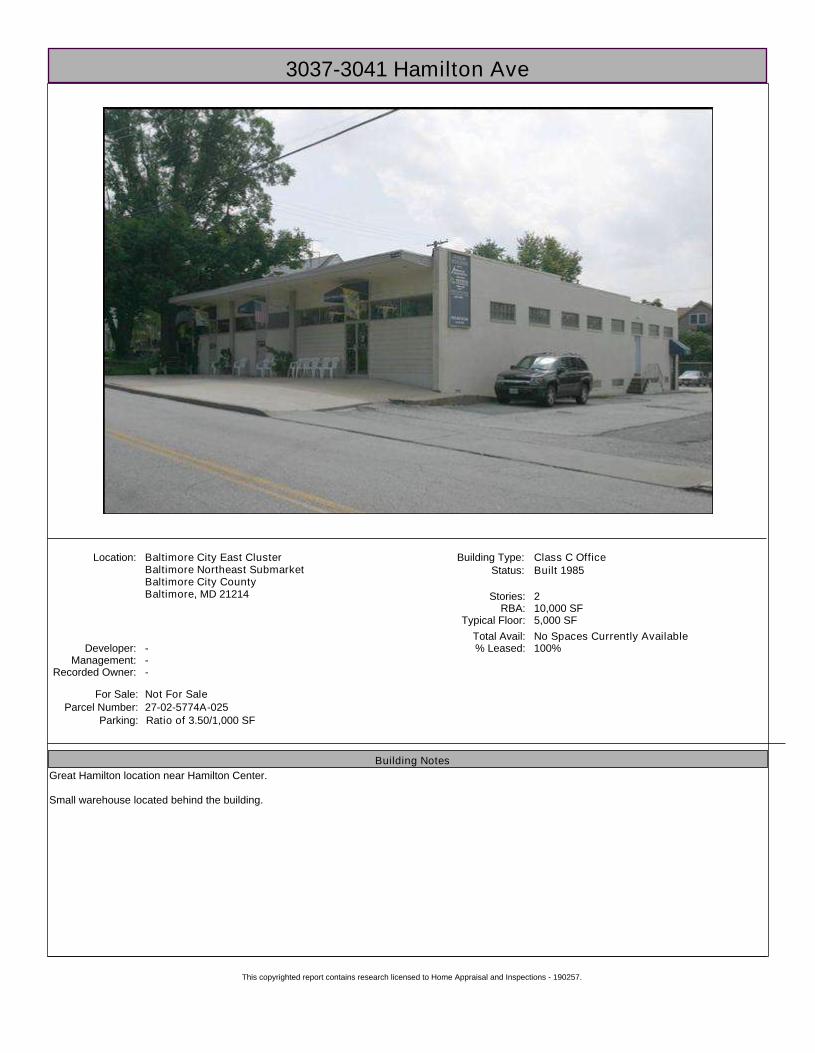
Location:
Stories:
Total Avail:
Status:
Developer:Management:
Recorded Owner: ---
2
Built 1985Baltimore City East ClusterBaltimore Northeast SubmarketBaltimore City CountyBaltimore, MD 21214
No Spaces Currently Available
Building Type: Class C Office
% Leased: 100%
RBA: 10,000 SFTypical Floor: 5,000 SF
Ratio of 3.50/1,000 SF
For Sale: Not For Sale
Parking:27-02-5774A-025Parcel Number:
Building NotesGreat Hamilton location near Hamilton Center.
Small warehouse located behind the building.
3037-3041 Hamilton Ave
This copyrighted report contains research licensed to Home Appraisal and Inspections - 190257.
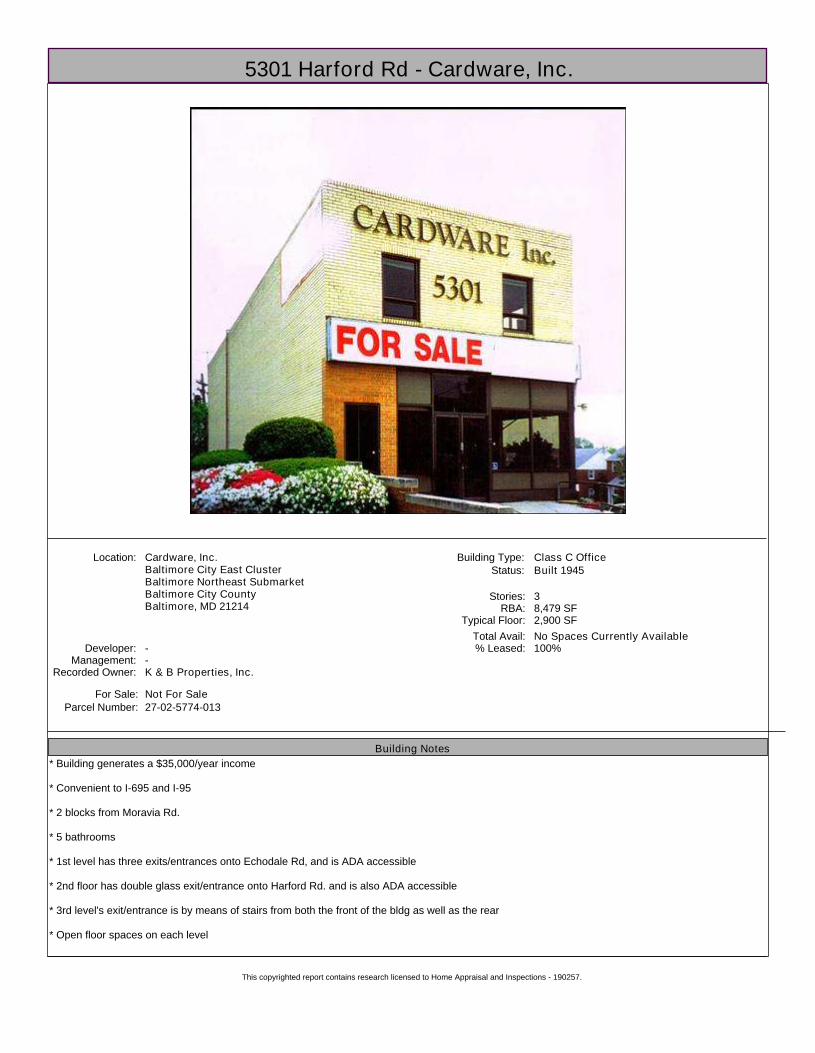
Location:
Stories:
Total Avail:
Status:
Developer:Management:
Recorded Owner: K & B Properties, Inc.--
3
Built 1945Cardware, Inc.Baltimore City East ClusterBaltimore Northeast SubmarketBaltimore City CountyBaltimore, MD 21214
No Spaces Currently Available
Building Type: Class C Office
% Leased: 100%
RBA: 8,479 SFTypical Floor: 2,900 SF
For Sale: Not For Sale27-02-5774-013Parcel Number:
Building Notes* Building generates a $35,000/year income
* Convenient to I-695 and I-95
* 2 blocks from Moravia Rd.
* 5 bathrooms
* 1st level has three exits/entrances onto Echodale Rd, and is ADA accessible
* 2nd floor has double glass exit/entrance onto Harford Rd. and is also ADA accessible
* 3rd level's exit/entrance is by means of stairs from both the front of the bldg as well as the rear
* Open floor spaces on each level
* Each level will be built out to the specifications of the tenant; all bathrooms will be renovated to suit the needs of the tenant
* Building has central a/c unit with supplemental window units which allow each individual office to control the temperature of that room
* Located in the heart of Hamilton in Baltimore City; surrounded by delis and restaurants within walking distance as well as an MTA stop on the corner of Harford and Echodale
5301 Harford Rd - Cardware, Inc.
This copyrighted report contains research licensed to Home Appraisal and Inspections - 190257.

* Each level will be built out to the specifications of the tenant; all bathrooms will be renovated to suit the needs of the tenant
* Building has central a/c unit with supplemental window units which allow each individual office to control the temperature of that room
* Located in the heart of Hamilton in Baltimore City; surrounded by delis and restaurants within walking distance as well as an MTA stop on the corner of Harford and Echodale
5301 Harford Rd - Cardware, Inc.(cont'd)
This copyrighted report contains research licensed to Home Appraisal and Inspections - 190257.
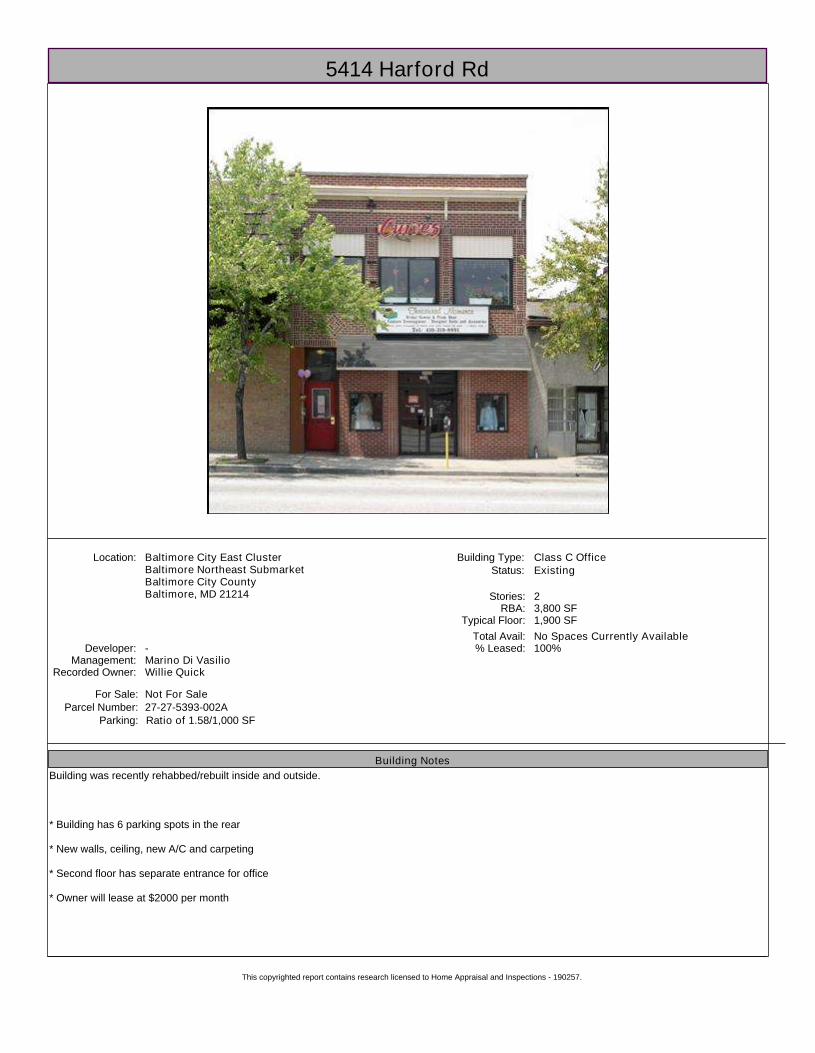
Location:
Stories:
Total Avail:
Status:
Developer:Management:
Recorded Owner: Willie QuickMarino Di Vasilio-
2
ExistingBaltimore City East ClusterBaltimore Northeast SubmarketBaltimore City CountyBaltimore, MD 21214
No Spaces Currently Available
Building Type: Class C Office
% Leased: 100%
RBA: 3,800 SFTypical Floor: 1,900 SF
Ratio of 1.58/1,000 SF
For Sale: Not For Sale
Parking:27-27-5393-002AParcel Number:
Building NotesBuilding was recently rehabbed/rebuilt inside and outside.
* Building has 6 parking spots in the rear
* New walls, ceiling, new A/C and carpeting
* Second floor has separate entrance for office
* Owner will lease at $2000 per month
5414 Harford Rd
This copyrighted report contains research licensed to Home Appraisal and Inspections - 190257.

Location:
Stories:
Total Avail:
Status:
Developer:Management:
Recorded Owner: CMS Property, LLC--
3
Built Jun 1928, Renov 2004AKA Hamilton Ave @ Wisteria AveBaltimore City East ClusterBaltimore Northeast SubmarketBaltimore City CountyBaltimore, MD 21214
No Spaces Currently Available
Building Type: Class B Office
% Leased: 100%
RBA: 3,000 SFTypical Floor: 1,000 SF
Expenses:
Free Surface SpacesCorner Lot
2003 Est Tax @ $2.64/sf
Amenities:
For Sale: Not For Sale
Parking:27-03-5773-028Parcel Number:
Building NotesProperty Taxes are $4,686 per year and insurance is $1,850.
Flat roof with commercial grade glass doors. Wood flooring with 9' ceilings.
$4 million revitalization plan scheduled for Spring 2004. Highly visible office/retail location with 64' frontage along Harford Rd.
Centrally located with easy access to Downtown Baltimore, I-695 and I-95. Walking distance to local shopping, banking and restaurant in Hamilton.
PROPERTY ID & ADDRESS 5519-5527 Harford RoadBaltimore, MD 21214-2233
3000 & 3002 Wisteria AveBaltimore, MD 21214-2233 LEGAL DESCRIPTION City Tax Map Ward 27, Section 030, Block 5773 Lots 027, 028 Lots 030, 031 BUILDING SIZE 9,000 sq ft (office / retail / storage) 3,243 sq ft (rental dwellings) 12,243 sq ft Approximate Total SITE SIZE .09 Acre .23 Acre .32 Acre Total ZONING B-2-2 which is Baltimore City's designation for Community Business District PROPERTY TAXES $4,686 $3,230 $7,916 Total INSURANCE $1,850 $1,584 $3,434 Total PARKING Free surface parking TOTAL # OF LEVELS 3 ELECTION DISTRICT Third UTILITY SERVICE Public water and public sewer serve the property YEAR BUILT 1928 1924 FOUNDATION Foundations are 5-inch concrete slab-on-grade FRAMING Steel EXTERIOR WALLS Brick and block ROOFING Flat roof EXTERIOR DOORS Commercial grade glass doors TRAFFIC COUNT 25,000 cars per day along the 6-lane road PLUMBING 4 restrooms serve the Harford Road buildings ELECTRIC SERVICE Electrical service to the building is a 400 amp main panel, 120/208 volt. Four separate meters service the commercial building and each rental dwelling is separately metered. HVAC Split system air conditioning, supplemental window units and packaged rooftop units for central air. Hot water and steam boiler heat. FLOORING Wood CEILINGS Dropped ceiling over original tin roof ceiling CEILING HEIGHT 9 ft
5519 Harford Rd
This copyrighted report contains research licensed to Home Appraisal and Inspections - 190257.

5519 Harford Rd(cont'd)
LEGAL DESCRIPTION City Tax Map Ward 27, Section 030, Block 5773 Lots 027, 028 Lots 030, 031 BUILDING SIZE 9,000 sq ft (office / retail / storage) 3,243 sq ft (rental dwellings) 12,243 sq ft Approximate Total SITE SIZE .09 Acre .23 Acre .32 Acre Total ZONING B-2-2 which is Baltimore City's designation for Community Business District PROPERTY TAXES $4,686 $3,230 $7,916 Total INSURANCE $1,850 $1,584 $3,434 Total PARKING Free surface parking TOTAL # OF LEVELS 3 ELECTION DISTRICT Third UTILITY SERVICE Public water and public sewer serve the property YEAR BUILT 1928 1924 FOUNDATION Foundations are 5-inch concrete slab-on-grade FRAMING Steel EXTERIOR WALLS Brick and block ROOFING Flat roof EXTERIOR DOORS Commercial grade glass doors TRAFFIC COUNT 25,000 cars per day along the 6-lane road PLUMBING 4 restrooms serve the Harford Road buildings ELECTRIC SERVICE Electrical service to the building is a 400 amp main panel, 120/208 volt. Four separate meters service the commercial building and each rental dwelling is separately metered. HVAC Split system air conditioning, supplemental window units and packaged rooftop units for central air. Hot water and steam boiler heat. FLOORING Wood CEILINGS Dropped ceiling over original tin roof ceiling CEILING HEIGHT 9 ft
This copyrighted report contains research licensed to Home Appraisal and Inspections - 190257.

HVAC Split system air conditioning, supplemental window units and packaged rooftop units for central air. Hot water and steam boiler heat. FLOORING Wood CEILINGS Dropped ceiling over original tin roof ceiling CEILING HEIGHT 9 ft
5519 Harford Rd(cont'd)
This copyrighted report contains research licensed to Home Appraisal and Inspections - 190257.
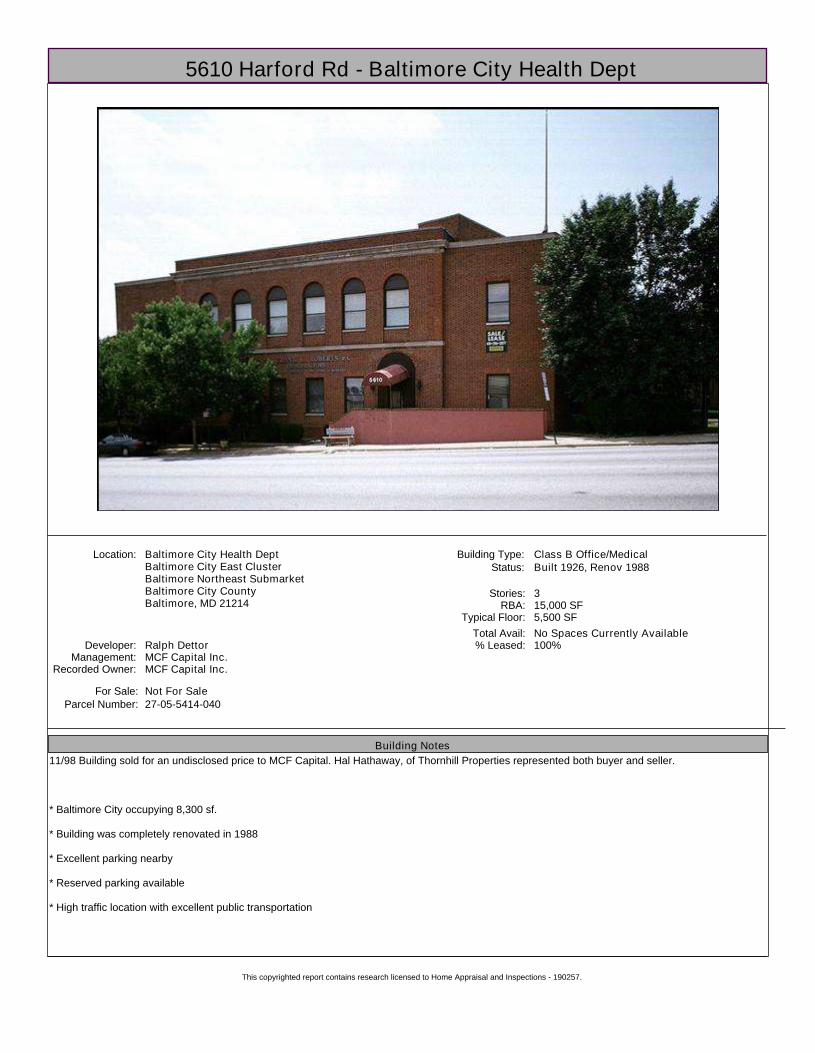
Location:
Stories:
Total Avail:
Status:
Developer:Management:
Recorded Owner: MCF Capital Inc.MCF Capital Inc.Ralph Dettor
3
Built 1926, Renov 1988Baltimore City Health DeptBaltimore City East ClusterBaltimore Northeast SubmarketBaltimore City CountyBaltimore, MD 21214
No Spaces Currently Available
Building Type: Class B Office/Medical
% Leased: 100%
RBA: 15,000 SFTypical Floor: 5,500 SF
For Sale: Not For Sale27-05-5414-040Parcel Number:
Building Notes11/98 Building sold for an undisclosed price to MCF Capital. Hal Hathaway, of Thornhill Properties represented both buyer and seller.
* Baltimore City occupying 8,300 sf.
* Building was completely renovated in 1988
* Excellent parking nearby
* Reserved parking available
* High traffic location with excellent public transportation
5610 Harford Rd - Baltimore City Health Dept
This copyrighted report contains research licensed to Home Appraisal and Inspections - 190257.

Location:
Stories:
Total Avail:
Status:
Developer:Management:
Recorded Owner: ---
1
Built 1960, Renov 1990Baltimore City East ClusterBaltimore Northeast SubmarketBaltimore City CountyBaltimore, MD 21214
No Spaces Currently Available
Building Type: Class C Office
% Leased: 100%
RBA: 7,250 SFTypical Floor: 7,250 SF
Dry CleanerAmenities:
For Sale: Not For Sale27-03-5766-016Parcel Number:
Building NotesNewly renovated common areas and elevators. New ownership is providing upgraded signage on York Road and is relandscaping the exterior and upgrading the exterior of the building. Easily accessible by public transportation. Larger space has numberous windows. Handicapped accessible. Ideal for medical users.
Building has great exposure on Harford Road. Ideally suited for contractor or small manufacturer with fenced yard and 3300 feet of warehouse.
5629 Harford Rd
This copyrighted report contains research licensed to Home Appraisal and Inspections - 190257.

Appendix E. Evanston, Illinois Research Park District Zoning

CITY OF EVANSTON RESEARCH PARK PLANNED
DEVELOPMENT INFORMATION SHEET 2100 RIDGE AVENUE ROOM 3700
847/866-2930 FAX: 847/ 448-8120
This handout describes the planned development procedure within the Research Park (RP) Zoning District. The Zoning Ordinance establishes rules and procedures allowing planned developments in each of the 32 different zoning districts into which the Zoning Ordinance divides the City. A planned development is a particular type of special use designed to maximize efficiencies and to encourage innovation. The Zoning Ordinance contains general regulations for planned developments in section 6-3-6. Additionally, the Zoning Ordinance attaches to each zoning district specific regulations and development allowances found in the chapter which addresses the individual zoning districts. Planned developments require an extraordinary, site specific review by the Site Plan and Appearance Review Committee, the Plan Commission, and the City Council. The Plan Commission holds a public hearing based upon which it makes a recommendation to the City Council. The Council then may consider adoption of an ordinance granting the planned development. The developer must record the planned development ordinance and plan. For detailed information, please refer to the Zoning Ordinance, Chapter 3, Section 6-3-6, "Implementation and Administration - Planned Developments," and Appendix D, Section D.3, "Planned Development Application Submission Requirements." Prior to filing for a planned development, the developer must have applied for zoning certification, through a zoning analysis application. The City would have denied the application for zoning certification and issued a form listing the proposed development's zoning problems. In this way, the land user learns of all the potential zoning defects in a development plan. The Zoning Ordinance also requires a pre-application conference with the developer, the Site Plan and Appearance Review Committee, the alderpersons in whose wards the proposed development lies, and the Plan Commission chair. Planned Development (§6-3-6) 1. General:
1. A planned development is granted only by ordinance adopted by the City Council following a public hearing before the Plan Commission.
PLANND DEVELOPM'T RP INFORMATION SHEET 1
2. The City Council cannot authorize by planned development a use not listed as permitted or special within the zoning district in which the proposed planned development lies. (§6-3-6-

2) 3. The Zoning Ordinance prohibits the approval of a variation in combination with a planned
development (§6-3-5-8(B)). 4. The Zoning Ordinance contains a nonexclusive list of "public benefits" which "are
intended to be derived from the approval of planned developments" (§6-3-6-3) 5. The parcel which is subject to the planned development must be under unitary control. (§6-
3-6-6) 6. The City may grant certain "site development allowances" which vary various standards,
including lot area and width, height, yards, and parking and loading requirements for a planned development. (§6-3-6-5) These are subject to the Ordinance's stated site development allowances for each zoning district. For the RP District these are located at §6-12-1-7(C).
7. The City Council may modify the established site development allowances for a zoning district by a 2/3 rds vote, if such a modification is essential to achieve a public benefit. (§6-3-6-6)
8. Within one year of obtaining a special use permit the recipient must either obtain a building permit and commence construction, or obtain a certificate of occupancy and commence the use. The City Council may extend this one year limitation upon request.
9. A developer shall complete the planned development within 2 years of the issuance of the special use (planned development) permit, unless a longer period is noted as part of the planned development.
2. The Plan Commission: 1. has 9 citizen full members chosen by the Mayor and confirmed by the City Council; 2. generally meets the second Wednesday of every month; 3. after proper public notice, hears applications for planned developments, and amendments
to the map or text of the Zoning Ordinance ; 4. the Plan Commission makes a recommendation to the City Council to grant or not grant
the request, and the Council considers adopting an ordinance granting the amendment or planned development;
5. the Plan Commission requires 5 votes to make a recommendation (Plan Commission Administrative Rules and Procedures, XII(B));
6. the City Council can approve a planned development by simple majority (§6-3-5-8) though approval of a planned development which exceeds the site development allowances requires a 2/3rds majority of the alderpersons (6 votes).
3. Application Requirements: See Required Submittals 4. Standards (§6-3-5-10): In order for the Plan Commission to recommend that the City Council
grant a planned development, they must find that the proposed planned development meets the standards for a special use. The development must: 1. comply with the site controls and standards for planned developments for the zoning
district in which the property lies; 2. comply with the purposes and policies of the Comprehensive General Plan and the Zoning
Ordinance; 3. not cause a negative cumulative effect in combination with existing special uses; 4. not interfere with or diminish the value of property in the neighborhood; 5. be adequately served by public facilities and services; 6. not cause undue traffic congestion; 7. preserve significant historical and architectural resources; 8. preserve significant natural and environmental resources; and
PLANND DEVELOPM'T RP INFORMATION SHEET 2
9. complies with all other applicable regulations.

5. General Conditions of Planned Developments within the Research Park 1. The planned development must be compatible with surrounding development. 2. The height, bulk or scale of the planned development only may exercise influences in
conformance with the purposes and intents of the Zoning Ordinance as set forth in § 6-1-2, "Purpose and Intent."
3. The planned development and all landscaping must be compatible with and implement the Research Park Master Plan and the Comprehensive General Plan.
6. Site Controls and Standards for Planned Developments within the Research Park 1. Minimum area for planned development is 19,500 square feet. 2. A tree preservation statement is required. 3. Walkways shall be logical, safe, and convenient. Care must be taken in their design to
minimize contacts of children with automobiles. Bicycle paths shall be incorporated into the circulation system is substantial bicycle traffic is anticipated.
4. Parking, loading and service areas shall avoid adverse effects upon residential uses within and without the development.
5. Vehicular access shall provide minimum hazards to other traffic. 6. The development shall provide for underground installation of utilities, if possible. 7. The development shall incorporate acceptably designed facilities for storm water and
treatment of turf and maintenance of facilities. 7. Development Allowances for Research Park Planned Developments
1. Height increases are allowed up to the minimum height necessary to achieve the Research Park Master Plan building density.
2. Floor area ratio increases are allowed up to .8 for parking structures and 2.0 for other buildings.
8. Time Frame: The approximate time from when the Zoning Division receives an accurately completed application for a planned development to when the applicant can reasonably expect a decision on that application is 4 months. A positive decision on an application for a planned development does not eliminate any requirement for other City approvals such as building permits, business licenses, certificates of occupancy, etc.
9. Fee (Ordinance 82-O-97): The City charges the following fees for processing the planned development application. These are not building permit or license fees and are not refundable depending on the outcome. 1. $2400 for processing of planned development; 2. $165, for processing of a subdivision or consolidation plat (if necessary); 3. $100 deposit for copy of recorded subdivision or consolidation plat (if necessary); 4. applicant is responsible for transcript costs at a rate of $6/page; 5. an additional fee of $1.50/page is charged for production of a transcript in less than the
normal number of days; 6. the City requires a $150 transcript deposit for all applications except those involving 1 and
2 family homes; 7. the City will issue a refund if the deposit exceeds the actual transcript fee.
10. Standing (§6-3-5-4): The applicant must own, lease, or have legal or equitable interest in the
subject property. The Zoning Division requires the applicant to demonstrate his or her connection to the ownership interest in the property. This can be in the form of a title insurance policy or a deed, and a lease or contract to lease or purchase.
11. Required Documents:
PLANND DEVELOPM'T RP INFORMATION SHEET 3
1. Interested parties may obtain applications in the office of the Zoning Division, Civic

PLANND DEVELOPM'T RP INFORMATION SHEET 4
Center, Room 3700. Completed applications must be returned here. Please, refer to the list of Required Submittals for specific necessary items. On a case by case basis, the Zoning Division may require documentation and information in addition to the items on that list.
2. The Zoning Division will review an applicant's initial submittal. If it is accurate and as complete as necessary, the Division will return it with a letter telling the applicant how many copies of various items the applicant needs to make. A complete application includes all required documents and information, and the requested copies.
12. Notice (§6-3-6-8):
1. The City through its Geographic Information System can supply the names and addresses of the property owners within a 1000 foot radius from any point on the subject property. The applicant is responsible for the accuracy of the list provided to the City.
2. The City mails notice of the hearing to the neighboring property owners within the 1000 foot radius.
3. The City publishes a notice of the hearing in a locally circulating newspaper, generally the Evanston Review, no less than 15 nor more than 30 days prior to hearing;
4. The City posts a notice of the request for a hearing on the subject property no less than 10 working days prior to the hearing.
13. Decision process (§6-3-6-7).
1. Pre-application conference - The developer shall meet with the Zoning Administrator, the Plan Commission chair, the alderpersons of the wards in which the proposed planned development lies, a representative of the Preservation Commission, where applicable, and the Site Plan and Appearance Review Committee. See Required Submittals for the materials the Ordinance requires the developer to provide for the pre-application conference.
2. The Plan Commission holds a public hearing and makes a recommendation based on findings of fact to the City Council. A court reporter produces a transcript of the hearing which is sent to the City Council with the Plan Commission's recommendation.
3. The Planning and Development Committee of the City Council considers the Plan Commission's recommendation and forwards it to the full Council with or without a recommendation.
4. The City Council considers the Plan Commission's recommendation and may introduce an ordinance granting the planned development.
5. The City Council may adopt an ordinance granting the planned development at the following or any subsequent City Council meeting.
6. The developer shall record the ordinance granting the planned development and the development plan with the Cook County Recorder.
X:\FORMS\PD.WPD JULY 21, 1999

CHAPTER 12 RESEARCH PARK DISTRICT
PART A. GENERAL REQUIREMENTS
6-12-1: GENERAL PROVISIONS:
6-12-1-1: LAND USE INTERPRETATION:
All applications for a permitted or special use set forth in each zoning district shall be submitted to the Zoning Administrator for a use interpretation pursuant to the standards and procedures set forth in Section 6-3-9, "Administrative Interpretations" of this Ordinance.
6-12-1-2: ACCESSORY USES AND STRUCTURES:
Accessory uses and structures that are incidental to the permitted and special uses in the downtown districts shall be permitted in the districts and yards specified in Section 6-4-6, "Accessory Uses and Structures" of this Ordinance.
6-12-1-3: SITE PLAN REVIEW:
Applications for development approval for properties located within the Research Park District shall be subject to site plan review in accordance with the provisions of Chapter 3, "Implementation and Administration" of this Ordinance, and the separate Site Plan and Appearance Review Ordinance, Ordinance No. 31-0-93, as amended.
6-12-1-4: OFF-STREET PARKING AND LOADING:
Off-street parking and loading facilities shall be provided for the Research Park District in accordance with the guidelines set forth in the research park master plan and the regulations contained in Chapter 16, "Off-Street Parking and Loading" of this Ordinance.
6-12-1-5: LANDSCAPING AND SCREENING:
Landscaping and screening shall be provided for in the Research Park district in accordance with the guidelines set forth in the research park master plan, and

the regulations contained in Chapter 17, "Landscaping and Screening" of this Ordinance.
6-12-1-6: SIGNAGE AND GRAPHICS:
Signs in the Research Park District shall meet the sign guidelines set forth in the research park master plan and the regulations set forth in the Sign Ordinance 128 of the City as applicable.
6-12-1-7: PLANNED DEVELOPMENTS:
In addition to the general requirements for planned developments set forth in Section 6-3-6, "Planned Developments", the Plan Commission shall not recommend approval of, nor shall the City Council adopt a planned development in the Research Park District unless they shall determine, based on written findings of fact, that the planned development adheres to the following standards:
(A)General Conditions:
1. Each planned development shall be compatible with surrounding development and not be of such a nature in height, bulk, or scale as to exercise any influence contrary to the purpose and intent of the Zoning Ordinance as set forth in Section 6-1-2, "Purpose and Intent".
If the proposed planned development is for a property listed as an Evanston landmark, or for property located within an historic district listed on the National Register of Historic Places or for property located within an historic district so designated by the Evanston Preservation Commission, the planned development shall be compatible with the "Secretary of the Interior's Standards for Rehabilitation" as set forth in the National Historic Preservation Act of 1966, as amended.
2. Each planned development shall be compatible with and implement the research park master plan as amended and the Comprehensive General Plan as amended.
3. Each planned development shall be completed within two (2) years of the issuance of the special use permit for the planned development. If extensive or staged development is approved as part of the planned development, however, the two (2) year requirement may be extended to provide for a more reasonable time schedule. The expanded time schedule shall be

adopted as part of the planned development and so noted on the special use permit for a planned development.
4. No special use permit for a planned development shall be valid for a period longer than one year unless a building permit is issued and construction is actually begun within that period and is diligently pursued to completion. The City Council may, however, for good cause shown, extend the one year period for such time as it shall determine, without further hearing before the Plan Commission. The City Council may, at its sole discretion, place conditions on the extension in order to assure that the planned development is diligently pursued to its completion.
5. All landscaping treatment within the planned development shall be provided in accordance with requirements set forth in the research park master plan and Chapter 17, "Landscaping and Screening". All landscaping treatment shall be shown on the required landscape plan submitted as part of the planned development application.
(B)Site Controls and Standards: The following site controls and standards are established to provide a regulatory framework that will promote excellence in site design. Their establishment is not intended to restrict or inhibit the Site Plan and Appearance Review Committee or the applicant from applying other site design principles and standards that may be applicable to the planned development being proposed and that may be found in the research park master plan, the City's Manual of Design Guidelines, or in common use by design professionals.
1. The minimum area for a planned development established in the Research Park Districts shall nineteen thousand five hundred (19,500) square feet.
2. For each planned development there shall be submitted a tree preservation statement evaluating each building site as to whether desirable tree stands or other natural features exist and can be preserved. The preservation statement shall be made part of the required landscape plan submitted as part of the planned development application.
3. Walkways developed for a planned development shall form a logical, safe, and convenient system for pedestrian access to all dwelling units, all project facilities, as well as any off-site destination likely to attract substantial pedestrian traffic. Walkways, when used by substantial numbers of children as play areas, routes to school or other principal destinations, shall be so located and safeguarded as to minimize contacts with normal automobile

traffic. Street crossings shall be located, designed, and marked to promote the utmost safety. If substantial bicycle traffic is anticipated, bicycle paths shall be incorporated into the walkway system. Pedestrianways shall not be used by other automotive traffic.
4. The location, construction and operation of parking, loading areas and service areas, shall be designed to avoid adverse effects on residential uses within or adjoining the development.
5. Principal vehicular access points shall be designed to permit smooth traffic flow with controlled turning movements and minimum hazards to vehicular and pedestrian traffic.
6. The planned development shall provide, if possible, for underground installation of utilities (including electricity and telephone) both in public ways and private extensions thereof. Provisions shall be made for acceptable design and construction of storm water facilities including grading, gutter, piping, and treatment of turf and maintenance of facilities.
7. The zoning administrator may, at his discretion, require of the applicant additional studies or impact analyses when he determines that a reasonable need for such investigation is indicated.
(C)Development Allowances: As provided in section 6-3-6, "Planned Developments", of this title the plan commission may recommend approval of, and the city council may grant, site development allowances for planned developments established in the research park districts. These allowances shall be limited as follows:
1. The maximum height increase over that otherwise permitted in the research park districts shall be the minimum height necessary to achieve the desired building density as referenced in the research park master plan.
2. The maximum increase in floor area ratio over that otherwise permitted in the research park districts shall be 2.0 for buildings and 0.8 for parking structures. (Ord. 43-0-93)
(D)Mandatory Planned Development Minimum Thresholds: Any development the land use of which is listed among the permitted uses or special uses for the zoning district in which the subject property is located meeting any one of the following characteristics may only be authorized as a planned development in accordance with section 6-3-6 of this title. For purposes of this subsection, "new construction" is defined as construction that results in

the zoning lot being improved with substantially new structures, and/or construction conforming to the definition of a "substantial rehabilitation and substantial additions" in section 6-18-3 of this title.
1. The area of the zoning lot to be improved with new construction is in excess of thirty thousand (30,000) square feet.
2. The development provides for the construction of more than twenty four (24) new residential units.
3. The development plan for which application for a building permit is made contains more than twenty four (24) units of any one type or in any combination of any commercial, business, retail or office uses.
4. The development plan for which application for a building permit is made contains more than twenty four (24) units of any one type or in any combination of any residential, commercial, business, retail, or office uses.
5. The development plan for which application for a building permit is made provides for the new construction of more than twenty thousand (20,000) square feet of gross floor area under one roof for any commercial, business, retail or office use. For purposes of this subsection, gross floor area excludes the area of any floors or portion of floors the volume of which is below the established grade but shall include all accessory areas, areas devoted to parking or loading, elevator shafts, stairwells, space used solely for heating, cooling, mechanical, electrical and mechanical penthouses, refuse rooms and uses accessory to the building, notwithstanding floor areas excluded from the calculation of gross floor area by section 6-18-3 of this title. (Ord. 59-0-04)
PART B. DISTRICT REQUIREMENTS
6-12-2: RP RESEARCH PARK DISTRICT:
6-12-2-1: PURPOSE STATEMENT:
The RP research park district is intended to provide a regulatory framework that will assist the development of applied research oriented and advanced technology activities in a high quality mixed use business park setting. The district also provides for a limited amount of light assembly, processing, and distribution uses along with their related support activities. (Ord. 43-0-93)

6-12-2-2: PERMITTED USES:
The following uses are permitted in the RP district:
Commercial indoor recreation.
Commercial parking garage.
Conference facility (college/university).
Conference facility (noncollege/university).
Cultural facility.
Daycare center - adult (subject to the general requirements of section 6-4-3, "Adult Daycare Homes", of this title).
Daycare center - child (subject to the general requirements of section 6-4-2, "Child Daycare Homes", of this title).
Dwellings - multiple-family.
Financial institution.
Government institution.
Hotel.
Industrial service establishments.
6-12-2-3: SPECIAL USES:
The following special uses may be permitted in the RP district, subject to the provisions set forth in section 6-3-5 of this title:
Open sales lot. (Ord. 114-0-02)
Outdoor storage.
Performance entertainment venue. (Ord. 2-0-00)
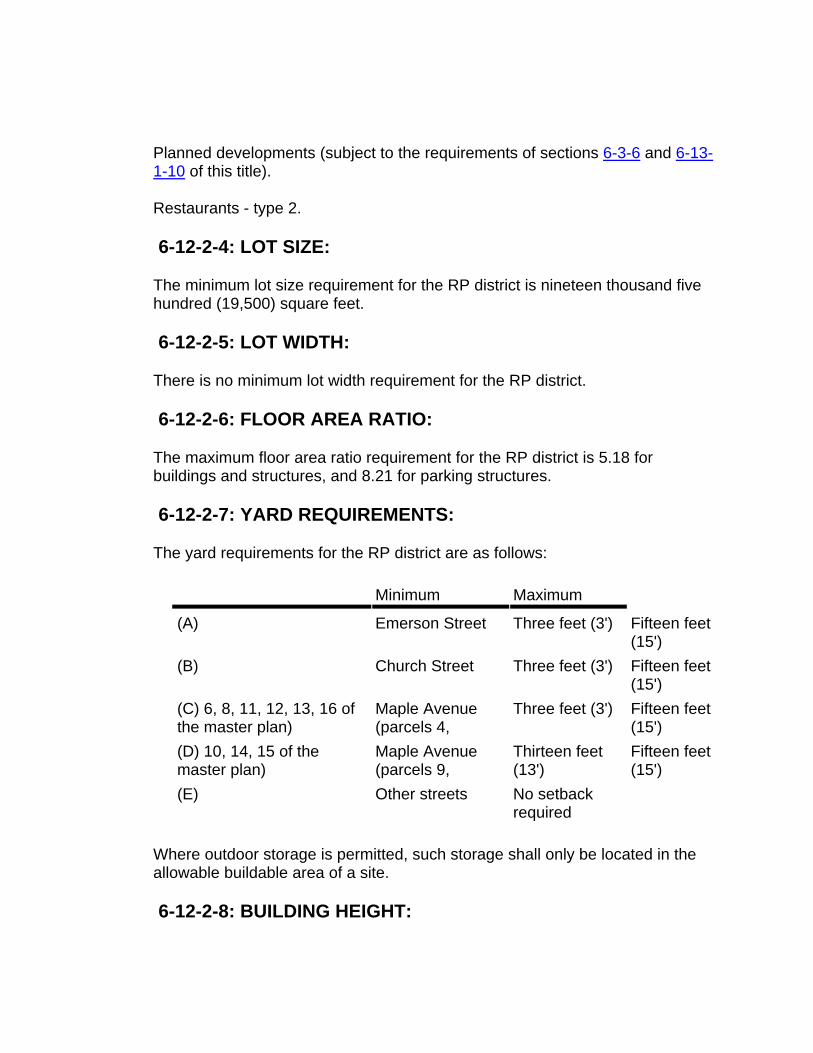
Planned developments (subject to the requirements of sections 6-3-6 and 6-13-1-10 of this title).
Restaurants - type 2.
6-12-2-4: LOT SIZE:
The minimum lot size requirement for the RP district is nineteen thousand five hundred (19,500) square feet.
6-12-2-5: LOT WIDTH:
There is no minimum lot width requirement for the RP district.
6-12-2-6: FLOOR AREA RATIO:
The maximum floor area ratio requirement for the RP district is 5.18 for buildings and structures, and 8.21 for parking structures.
6-12-2-7: YARD REQUIREMENTS:
The yard requirements for the RP district are as follows:
Minimum Maximum
(A) Emerson Street Three feet (3') Fifteen feet (15')
(B) Church Street Three feet (3') Fifteen feet (15')
(C) 6, 8, 11, 12, 13, 16 of the master plan)
Maple Avenue (parcels 4,
Three feet (3') Fifteen feet (15')
(D) 10, 14, 15 of the master plan)
Maple Avenue (parcels 9,
Thirteen feet (13')
Fifteen feet (15')
(E) Other streets No setback required
Where outdoor storage is permitted, such storage shall only be located in the allowable buildable area of a site.
6-12-2-8: BUILDING HEIGHT:

The maximum building height requirements for the RP district are as follows:
Location Height In Feet
(A) stories to achieve the desired building density as referenced in the research park master plan are allowed at a minimum of 50 feet behind the setback lines)
Maple Avenue (additional
Sixty feet (60')
(B) Central Plaza feet (150')
One hundred fifty
(C) Emerson Street Eighty five feet (85')
(D) to achieve the desired building density as referenced in the research park master plan are allowed at a minimum of 50 feet behind the setback lines.)
Church Street (additional stories
Eighty five feet (85')