analysis of microarray data 1.scan the images 2.quantify intensity of spots 3.normalization...
TRANSCRIPT

Analysis of Microarray Data
1. Scan the images
2. Quantify intensity of spots
3. Normalization
4. Analysis of data
5. Identification of genes of interest
6. Validation

Analysis of Microarray Data
1. Scan the images
2. Quantify intensity of spots
3. Normalization
4. Analysis of data
5. Identification of genes of interest
6. Validation

Analysis of Microarray Data
1. Scan the images
2. Quantify intensity of spots
3. Normalization
4. Analysis of data
5. Identification of genes of interest
6. Validation

Quantification of Spot Intensity
• BlueFuse• QuantArray• ScanAlyze• NHGRI – Scanalytics• Imagene• GenePix• ArrayVision• TIGR Spotfinder

BlueFuse

Analysis of Microarray Data
1. Scan the images
2. Quantify intensity of spots
3. Normalization
4. Analysis of data
5. Identification of genes of interest
6. Validation
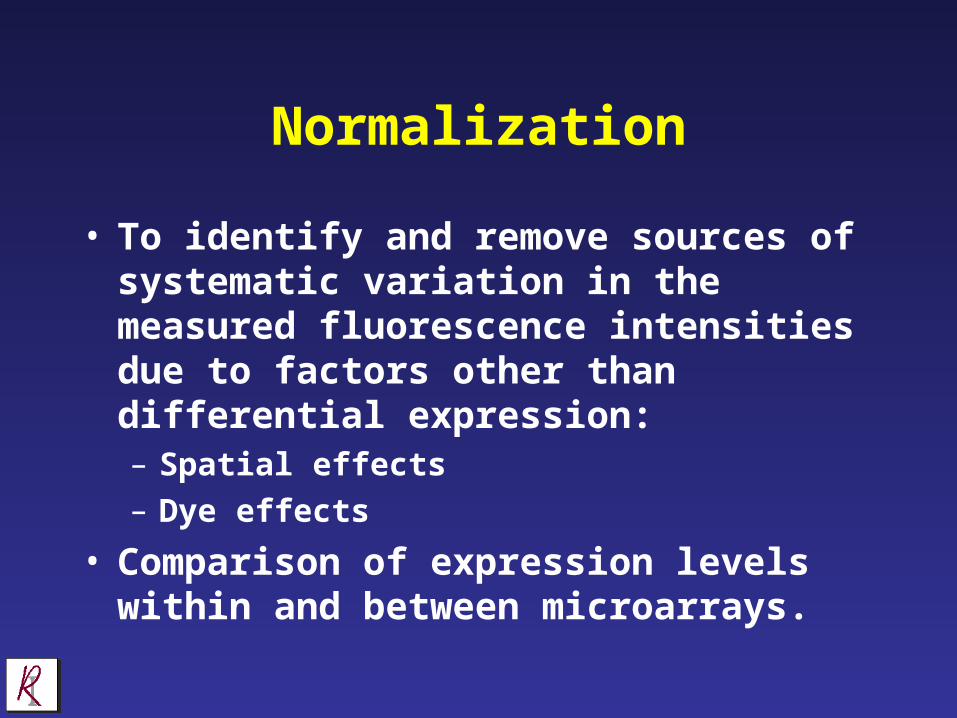
Normalization
• To identify and remove sources of systematic variation in the measured fluorescence intensities due to factors other than differential expression:– Spatial effects– Dye effects
• Comparison of expression levels within and between microarrays.
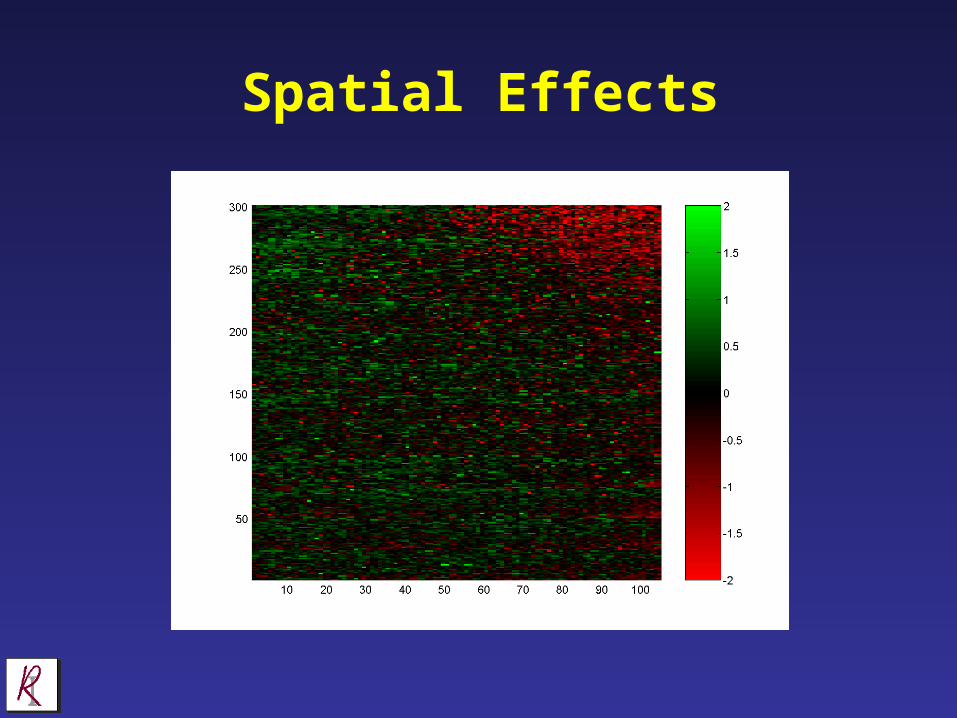
Spatial Effects

MA Plots
Before normalization After normalization
M = log2R – log2GA = (log2R+ log2G)/2
Analysis of Microarray Data
1. Scan the images
2. Quantify intensity of spots
3. Normalization
4. Analysis of data
5. Identification of genes of interest
6. Validation

Analysis of Data
GeneSpring

Analysis of Microarray Data
1. Scan the images
2. Quantify intensity of spots
3. Normalization
4. Analysis of data
5. Identification of genes of interest
6. Validation

Identification of Genes of Interest
• Microarray analysis can identify hundreds of differentially expressed genes.
• How do you identify genes of particular interest?

Data Mining Tools
• Literature searches– Chilibot (www.chilibot.net)– Protein Annotator’s Assistant (www.ebi.ac.uk/paa)– iHOP (www.pdg.cnb.uam.es/UniPub/iHOP)
• Pathway searches– DAVID & EASE (www.david.niaid.nih.gov/david)– Biorag (www.biorag.org)
• Transcription factor binding sites– MatInspector (www.genomatrix.de)

Analysis of Microarray Data
1. Scan the images
2. Quantify intensity of spots
3. Normalization
4. Analysis of data
5. Identification of genes of interest
6. Validation

Validation
• Confirm microarray results by:– qRT-PCR– Northern blots
• Confirm biological significance by investigating protein expression:– Western blots

Conclusions (3)
• Several stages are involved in analyzing microarray data:– Scan images– Quantify spots– Statistical analysis
• There are many different soft-ware packages and methods for this analysis.
• Further analysis is required to pin-point genes of interest.
• Microarray results need to be validated by other methods.

Conclusions (general)• Microarray experiments are expensive.• Microarray experiments are time-consuming.• Microarray experiments generate huge
amounts of data.• The quality of the data obtained from a
microarray experiment depends on:– Design of the experiment– Quality of RNA– Statistical analysis– Interpretation of the data
• There is, at present, no definitive method for either designing or analyzing a microarray experiment.