analysis of morocco’s trade policy · analysis of morocco’s trade policy : impact of...
TRANSCRIPT

Analysis of Morocco’s Trade Policy Volume 2: Impact of Morocco’s Tariff Policy on its Position
as a Hub for the Rest of Africa

Analysis of Morocco’s Trade Policy
Volume 2 : Impact of Morocco’s Tariff Policy on its Positionas a Hub for the Rest of Africa


3A f r i c a n D e v e l o p m e n t B a n k
Analysis of Morocco’s Trade Policy : Impact of Morocco’s Tariff Policyon its Position as a Hub for the Rest of Africa
Table of contents
I. INTRODUCTION : MOROCCO’S AFRICAN AMBITIONS
II. TRADE AGREEMENTS BETWEEN MOROCCO AND OTHER AFRICAN COUNTIRES
III. EXISTING CUSTOMS DUTIES BETWEEN MOROCCO AND OTHER AFRICAN COUNTRIES
IV. WHAT IS A HUB?
V. DESCRIPTIVE ANALYSIS OF THE TREND OF TRADE BETWEEN MOROCCO AND
AFRICAN COUNTRIES
VI. IDENTIFICATION OF THE ROLE OF MOROCCO’S TARIFF POLICY IN ITS POSITION
AS A HUB FOR AFRICA
VII. HOW SHOULD THE RESULTS BE INTEREPRETED AND WHAT DO THEY CONTRIBUTE
IN TERMS OF ECONOMIC POLICIES
ANNEXES
8
10
16
27
30
31
43
43
43
46
48

4 A f r i c a n D e v e l o p m e n t B a n k
Analysis of Morocco’s Trade Policy : Impact of Morocco’s Tariff Policyon its Position as a Hub for the Rest of Africa
EFTAAMU CFCCOMESAEACECCASECOWASEUFDI GDPGSTPLDC MFNOCPPAFTAPPMLSITCSMEUNUNCTADUSAWTO
European Free Trade AssociationArab Maghreb Union Casa Finance CityCommon Market for Eastern and Southern AfricaEast African CommunityEconomic Community of Central African StatesEconomic Community of West African StatesEuropean Union Foreign Direct InvestmentGross Domestic Product Global System of Trade Preferences among Developing CountriesLeast Developed Countries Most-favoured-nation Office Chérifien des Phosphates (National Moroccan Phosphates Pan-Arab Free Trade Area Company)Poisson Pseudo-Maximum LikelihoodStandard International Trade Classification - United Nations Statistics DivisionSmall and Medium-sized EnterprisesUnited Nations United Nations Conference on Trade and Development United State of America World Trade Organization
LIST OF ACRONYMS
Project Coordinators and Authors Patricia AUGIER and Vincent CASTEL
Authors
Marion DOVISMichael GASIOREKCharles LAI-TONGNor-eddine OUMANSOUR
ContributionsDriss CHARRIER – RACHIDIAlia AMIMIKaouther ABDERRAHIM
MAGHRAOUI Said Director, Trade Policy Division, Ministry of Foreign Trade
HAKIM Jamâa Head of Studies and Communication Division, Ministry of Foreign Trade
BERJA Fatima Economist Engineer, Ministry of Foreign Trade
SEMMAR Yassir Economist, Ministry of Foreign Trade
The authors would like to thank the following people:

5A f r i c a n D e v e l o p m e n t B a n k
Analysis of Morocco’s Trade Policy : Impact of Morocco’s Tariff Policyon its Position as a Hub for the Rest of Africa
Executive Summary
Morocco remains firmly moored to the European market
which remains the Kingdom’s main trading partner,
accounting for 67% of the country’s exports, with trade
between the two partners approaching 30 billion Euros in
2014. In this context, the rest of the African continent, in particular,
sub-Saharan Africa with an average growth rate over the 2000
decade of almost 6.3% (the world’s second largest economic zone
after Asia) appears to provide a solid opportunity for Moroccan
economic operators. Indeed, Morocco’s trade with Africa has
increased by 20% in recent years, i.e. a 1.5 billion dollar increases
and recently accelerated with a 13% growth in trade with sub-
Saharan Africa in 2014. However, Morocco does not wish to
position itself as simply a trading partner and economic actor on
the continent but is seeking above all to become a potential
economic hub.
The main question this report will try to answer is that of
determining whether Morocco has been able to benefit from
its tariff policy in developing its trade with the African countries,
and whether the country could, on the basis of its current tariff
policy, fully play the hub role it is envisaging. In addition to
the agreements concluded with Egypt and Tunisia, Morocco has
signed bilateral agreements with three other African countries:
Guinea, Mauritania and Senegal. Other African countries have
agreements with Morocco through multilateral agreements. The
Global System of Trade Preferences among Developing Countries
(GSTP), which has not been very active to-date, comprises Algeria,
Benin, Cameroon, Ghana, Mozambique, Nigeria, Sudan, Tanzania,
Zimbabwe and once again Egypt, Guinea and Tunisia. The PAFTA
(Pan-Arab Free Trade Association), involves Comoros, Djibouti,
Libya, Somalia and once again Algeria, Sudan and Tunisia. Finally,
Mauritania is a member of the AMU (Arab Maghreb Union).
Morocco has also exempted Africa’s Least Developed Countries
from customs duties but only for a limited list of goods comprising
a few agricultural and fishery products and a small number of
semi-finished products. Nine countries do not have any trade
agreement with Morocco. These are Gabon, Côte d’Ivoire, Sao
Tome, Republic of Congo (Congo-Brazzaville), Kenya, South
Africa, Botswana, Namibia and Swaziland. Only three Mediter-
ranean African countries (Algeria, Egypt, and Tunisia) and Senegal
apply a preferential tariff to their imports from Morocco.
Even though customs duties have fallen considerably (as
a reminder, this reduction has been about 78%, i.e. 39
percentage points), the fact that there are virtually no active
trade agreements between Morocco and the sub-Saharan
countries implies that the customs duties applied by
Morocco to imports from non-Mediterranean African
countries remain, on average, at the same level as the tariffs
applied to all other middle- and low-income countries, i.e.
12%. For industry, the average rate of tariffs applied to imports
from non-Mediterranean African countries is much higher than
from other countries, since it is slightly above 10%, with 6% for
West Africa, 9.3% for Central Africa, almost 7% for East Africa
and 12% for Southern Africa. Rate differences are even more
pronounced in agriculture, since the average ranges from 1.4%
for Mediterranean countries to almost 27% for Southern African
countries. Moreover, it was observed that, irrespective of
category of goods, the difference between the average rate of
customs duties applied to European countries and the highest
average of customs duties applied to African countries is about
17 percentage points.
The tariff policy pursued by Morocco over the past 20 years
has resulted in an involuntary unfavourable difference in
the rate for African countries (excluding the Mediterranean
countries), compared to the customs duties applied to
European, American and Mediterranean countries, irrespective
of the category of goods. Logically, it was noted that both in
2001 and in 2012, the tariffs applied by African countries on imports
from Morocco were on average 3 or 4 percentage points above
the tariffs applied to European or American products.
Sub-Saharan Africa represents a little over 6% (compared
3% in 93) of exports and a little under 1% (compared to 5%
in 93) of Moroccan imports. Only one sub-Saharan African
country appears among the top 25 destinations for Moroccan
exports (which represent about 86% of total Moroccan exports).

6 A f r i c a n D e v e l o p m e n t B a n k
Analysis of Morocco’s Trade Policy : Impact of Morocco’s Tariff Policyon its Position as a Hub for the Rest of Africa
On the import side, among Morocco’s top 25 suppliers (which
represent slightly less than 90% of total imports), there is no sub-
Saharan country, while there was one, Cameroon, among
Morocco’s top 25 suppliers in 1993.
Reciprocally, in terms of Morocco’s weight in sub-Saharan
Africa’s trade, it is observed that Morocco was not included
among these countries’ 50 main exporters in 2013. In the
classification of export markets, Morocco is ranked in 95th position,
with only 0.05% of the region’s exports (compared to 0.07% in 93
and 0.36% in 98). On the import side, Morocco’s weight is also
negligible, since, with 0.27% of the region’s imports (compared to
0.07% in 93), it is ranked 62nd among all importers.
If the analysis is completed by taking trade intensity into
account, it is observed that the index for Moroccan exports in
relation to 28 other partners exceeded 1: of these 28 partners 9
are sub-Saharan countries (Guinea, Senegal, Equatorial Guinea,
Côte d’Ivoire, Ghana, Togo, Angola, Nigeria and Mauritania), 6 are
Mediterranean countries (Tunisia, Algeria, Libya, Lebanon, Egypt
and Turkey). This index calculated for Moroccan imports over the
same period shows that it exceeds 1 in relation to 22 partners, of
which 4 are sub-Saharan countries (Togo, Senegal, Malawi and
Cameroon), 4 Mediterranean countries (Egypt, Algeria, Tunisia and
Turkey) and 7 are European countries (Spain, Portugal, France,
Romania, Italy, Greece and Sweden).
It may, therefore, be deduced from this initial analysis that,
while the sub-Saharan countries are neither a very important
destination, nor source in terms of volume for Moroccan
exports and imports, some African countries are fairly important
partners for Morocco. These are, Senegal, Equatorial Guinea,
Ghana, Angola, Guinea, Côte d’Ivoire, Togo and Egypt.
At sector level, the 5 industries with the highest shares .in 2013
of Moroccan exports to sub-Saharan Africa were petroleum
products (15.4% compared to 0% in 93), fishery products
(14% compared to 27.4% in 93), fertilizer (9.8% compared to
1.8% in 93), semolina and flour (5.9% compared to 0% in 93)
and electrical equipment (5% compared to 0.02% in 93). If the
overall trend of the structure of Morocco’s exports is compared
with that of exports to sub-Saharan Africa, Egypt and Turkey, the
salient feature is the very strong progress made by the transport
machinery and equipment sector which is well-placed in the case
of exports to Egypt and Turkey but not at all in the case of exports
to the sub-Saharan market. This 1-digit sector breakdown of
Moroccan exports, therefore, shows that there are wide disparities
between the structure of exports intended for sub-Saharan
countries and that of exports to Egypt and Turkey, and also in the
way these structures have developed.
The 10 products for which the index measuring the intensity
of Moroccan exports to sub-Saharan Africa has risen most
rapidly alone represent 47% of Moroccan exports to the sub-
Saharan market. This indicates a fairly high concentration of these
exports on a fairly limited number of products.
In the case of Moroccan imports, it was observed that the low
share from sub-Saharan Africa is concomitant with increasing
difficulties experienced by sub-Saharan products in entering
the Moroccan market compared to all other world partners.
Sub-Saharan Africa’s exports to Morocco mainly comprise coal
(15. 8%), coffee (136%), animal feedstuffs (11.2%), spices (6.2%)
and inorganic chemical products (4.7%).
The econometric analysis of the impact of customs duties
between Morocco and African countries on trade and a
potential reduction gives the following results: first, a reduction
in customs duties applied to sub-Saharan products did not
stimulate Moroccan exports to these countries; second, a reduction
in tariffs applied to products from the EU and United States does
not appear to have had any impact on Moroccan exports to
African markets; on the other hand, the reduction in customs
duties applied to products from Mediterranean countries has
impacted negatively on Moroccan exports to sub-Saharan
African countries. The econometric results thus confirm what the
descriptive analysis suggests, i.e. that the tariff policy pursued
by Morocco has been unable to intensify trade flows between
Morocco and sub-Saharan Africa.
On the other hand, goods from sub-Saharan Africa are more
sensitive to Morocco’s tariff policy than goods from the rest
of the world. A reduction in Moroccan customs duties applied
to sub-Saharan countries would, therefore, contribute to an
increase in exports from sub-Saharan African countries to
Morocco.

7A f r i c a n D e v e l o p m e n t B a n k
Analysis of Morocco’s Trade Policy : Impact of Morocco’s Tariff Policyon its Position as a Hub for the Rest of Africa
Moreover, the analysis of the sensitivity of Moroccan exports
to variation in customs duties applied by African countries
reveals that, irrespective of the economic community, a reduction
in the tariffs of African countries will always have a positive
impact on Moroccan exports. The strength of the impact does,
however, depend on the economic community concerned: A 50%
reduction in customs duties for example, decided upon by the
Economic Community of West African States (ECOWAS), could lead
to an increase in Moroccan exports of about 5%, while an equivalent
reduction applied by the Economic Community of Central African
States (ECCAS) or by the Common Market for Eastern and Southern
Africa (COMESA), could increase these same Moroccan exports
by 23% in the case of ECCAS and by 15% for COMESA. The most
significant impact to be expected comes from a reduction in
customs duties applied by the East African Community (EAC):
a 50% reduction in tariffs could, in fact, increase Moroccan exports
by 40%.
In terms of recommendations, attention should, therefore, be
drawn to the fact that:
• A reduction in customs duties remains a trade policy tool that
could effectively boost bilateral trade flows with a positive
impact for Morocco and the rest of the world, in particular,
sub-Saharan Africa;
• In order to optimize the recent initiatives taken to stimulate and
bolster trade between Morocco and its African partners, it will
rapidly become essential to prioritize the negotiation of tariff
policies applied by both sides.

8 A f r i c a n D e v e l o p m e n t B a n k
Analysis of Morocco’s Trade Policy : Impact of Morocco’s Tariff Policyon its Position as a Hub for the Rest of Africa
I. INTRODUCTION: MOROCCO’S AFRICAN AMBITIONS
Morocco remains firmly moored to the European market
which remains the Kingdom’s main trading partner
accounting for 67% of the country’s exports, with trade between
the two partners approaching 30 billion Euros in 2014. However,
Europe’s sluggish growth in recent years has prompted Morocco
to seek new markets which would provide new sources of growth
for Morocco.
In this context, the rest of the African continent, in particular,
sub-Saharan Africa with an average growth rate over the 2000
decade of almost 6.3% (the world’s second largest economic
zone after Asia) appears to provide a sound opportunity for
Moroccan economic operators. Even more important than existing
potential is the medium-term potential of the Continent which, for
Morocco, represents a tremendous opportunity. African growth is
in fact diversifying with relatively high increases in the roles of private
consumption and investment. Consumption is expected to develop
rapidly on the Continent over the next few years with an exponential
increase in population growth from 1 to 2 billion by 2050. This
population will account for 21% of the world’s labour force. It will
be characterized by a very high urbanization rate (over one out
of every two Africans will live in urban areas by 2030) and the
development of a strong middle class. On the investment front, the
improved business climate has resulted in a rapid increase in private
investment, especially in the areas of banking (53%), telecommu-
nications (34%) and real estate (1%).
Indeed, Morocco’s trade with Africa has increased by 20% in
recent years, i.e. a 1.5 billion dollar increase and recently
accelerated with a 13% growth in trade with sub-Saharan
Africa in 2014. Morocco is also the second largest African
investor in the continent after South Africa. The Kingdom’s
investments in sub-Saharan Africa – made by the large private
and public enterprises – rose by 200% between 2000 and 2013
and 85% of FDI targets sub-Saharan Africa in strategic areas of
Africa’s development: telecommunications, infrastructure, banking,
finance, housing, tourism, transport, energy, agriculture, and
agrifood.
However, Morocco does not wish to position itself as simply a
trading partner and economic actor on the continent but is
seeking above all to become a potential economic hub.
Consequently, several types of hub are currently being discussed
by the actors, in particular, in the areas of trade, production and
investment, but all them are contingent on a number of prerequisites
on which Morocco is working including: (i) policy and institutional
support, (ii) the existence of sufficiently large public enterprises
promoting Moroccan know-how and with knock-on effects on
Moroccan SMEs, (iii) the establishment of adequate logistics and
transport facilities: (iv) the existence of support agencies and, (v) the
existence of an incentive framework for trade. Recent progress in
these different areas has been substantial.
From a political standpoint, this vision was consolidated by Royal
visits to Africa in January 2014 (Mali, Cote d’Ivoire, Guinea and
Gabon) and in 2015 (Senegal, Guinea-Bissau, Côte d’Ivoire and
Gabon), which culminated in the signing of several partnership
agreements to strengthen cooperation and regional integration
(26 public-private partnership and investment agreements in
Cote d’Ivoire ; 21 bilateral cooperation agreements with Guinea
and 17 bilateral cooperation agreements with Mali) and the
signing of bilateral public-private and private-private economic
partnership agreements. The royal visits also provided an opportunity
to establish Moroccan-Senegalese and Moroccan-Ivorian economic
impetus groups aimed at encouraging co-emergence and to see to
the effective and timely conclusion of all the partnership agreements.
Morocco is also currently negotiating strategic partnership
agreements with ECOWAS and CEMAC including the gradual
establishment of free-trade areas.
From the standpoint of public and private enterprises, Moroccan
know-how and expertise are the main assets presented by

9A f r i c a n D e v e l o p m e n t B a n k
Analysis of Morocco’s Trade Policy : Impact of Morocco’s Tariff Policyon its Position as a Hub for the Rest of Africa
Moroccan investors who are now established in many Central
African and West African countries. Indeed, Moroccan firms have
the capacity to operate in difficult environments and to anticipate
the needs of developing companies in a context of fragmented
market segments. The most striking examples include that of
Maroc-Telecom, which has several African subsidiaries including
Mauritel (Mauritania), Onatel (Burkina Faso), Gabon-Telecom
(Gabon) and Sotelma (Mali). As regards air transport, Royal Air
Maroc is the second biggest African airline after South African
Airways. In the areas of phosphates and food security, the National
Moroccan Phosphates Company (OCP) is planning to launch
several large-scale projects in West Africa. The buoyancy of the
public sector is also reflected in the private sector with the
establishment of the Casa Finance City - CFC financial which clearly
harbours African ambitions, by establishing engineering structures
and financial services enabling private sector actors to invest in
Africa from Morocco.
Furthermore, in terms of logistics facilities, this institutional
momentum is sustained by the accelerating development of
trading infrastructure, port capacities which are expanding
rapidly (5 ports) as well as by the development of 70 logistics
hubs. Therefore, in order for Morocco to emerge as a potential hub,
it is necessary to offer very low export lead times as well as matching
import and export costs. Also, the fact that customs procedures
were simplified in 2009 and import licenses and permits required
for security, health or environmental reasons, suggests that the
Kingdom could become a regional economic power.
Finally, in terms of support agencies, the Moroccan Export
Promotion Centre, the purpose of which is to promote exports
of industrial, agrifood, tourism and handicraft products aims
to: (i) promote Moroccan production for export to international
markets in harmony with the National Sector Strategies, (ii) diversify
Moroccan export markets, (iii) foster the internationalization of
Moroccan firms, initiate promotional actions to make Moroccan
better known in international markets, (iv) channel public or private
investment towards industries or activities whose output can be
easily sold on foreign markets under the best possible conditions.
Maroc-Export is also trying to support operators in other African
countries interested in Morocco. Thus, the Agency has signed 17
memoranda of understanding with trade or investment promotion
organizations in 11 sub-Saharan countries.
Notwithstanding, and in spite of, the strides made during the
Royal tours, it would appear that further progress is necessary
as regards the establishment of an incentive regulatory
framework for trade, for the progress made in terms of trade
agreements remains modest and ought to be deepened to
ensure that Morocco is in a position to become a hub for
African destinations. Indeed, following the effective entry into force
of a number of bilateral and multinational trade agreements,
Moroccan customs duties have fallen considerably and the tariff
structure vis-à-vis its partners has significantly changed. It is clear
that the tariffs applied to the countries with which it has signed trade
agreements have fallen sharply compared to those with which no
trade agreement has been signed. In the case of the latter and the
sub-Saharan African countries, which are almost all in this situation,
a reduction in tariffs simply corresponds to a reduction in MFN
customs duties obtained in negotiations with the WTO. Therefore,
none of these changes has had any impact on trade flows.
The following report explores these aspects by analysing the
impact of Morocco’s tariff policy on its position as a hub for
Africa. The report begins by reviewing existing trade agreements
and customs duties between Morocco and the African countries.
It then analyses the trend of trade between Morocco and African
countries and identifies how Morocco’s and Africa’s trade policies
influence Morocco’s capacity to position itself as a hub for Africa.
Finally, the report shows how the renegotiations of certain tariff
agreements could be carried out to the advantage of Morocco and
the other countries of the African Continent.

10 A f r i c a n D e v e l o p m e n t B a n k
Analysis of Morocco’s Trade Policy : Impact of Morocco’s Tariff Policyon its Position as a Hub for the Rest of Africa
II. TRADE AGREEMENTS BETWEEN MOROCCO AND OTHERAFRICAN COUNTRIES
In addition to the agreements signed with Egypt and Tunisia(presented in Table 1 of Volume 1 of this study), Morocco
has signed bilateral trade agreements with 3 other African
countries1: Guinea, Mauritania and Senegal. These 3 agreements
are presented in Table 1. In addition, other African countries have
agreements with Morocco through multilateral agreements. The
countries concerned and the names of these agreements are given
in Table 2.
• These are Algeria, Benin, Cameroon, Ghana, Mozambique,
Nigeria, Sudan, Tanzania, Zimbabwe and once again Egypt,
Guinea and Tunisia under the Global System of Trade
Preferences among Developing Countries (GSTP), which is
not very active.
• The PAFTA (Pan-Arab Free Trade Area), involves Comoros,
Djibouti, Libya, Somalia and, once again, Algeria, Sudan
and Tunisia. Lastly, Mauritania is a member of the AMU
(Arab Maghreb Union).
• Morocco has also exempted Africa’s Least Developed
Countries from customs duties but only for a limited list of
goods comprising a few agricultural and fishery products and a
small number of semi-finished products.
Nine countries do not have any trade agreement with Morocco.
These are Gabon, Cote d’Ivoire, Sao Tome, Republic of Congo
(Congo-Brazzaville), Kenya, South Africa, Botswana, Namibia and
Swaziland.
1 These bilateral agreements do not appear in Table 1 of volume 1 of this study which lists all the agreements ratified by Morocco insofar as they have not been notifiedby WTO.
Sources: Ministry of Foreign Trade http://www.mce.gov.ma and Moroccan Customs, http://www.douane.gov.ma
Table 1: Bilateral trade agreements between Morocco and African countries
Africa Countries Concerned and Agreement
Name
Scope Signature Date Date of Entry into
Force
Morocco-Guinea
Morocco-Guinea Trade and Tariff AgreementList of Goods April 1997 September 2000
Morocco – Mauritania
Trade and Tariff Agreement between the Kingdom ofMorocco and the Islamic Republic of Mauritania
List of Goods August 1986 May 1993
Morocco – Senegal
Moroccan-Senegalese Trade AgreementList of Goods
February 1963September 1987
February 1968December 1987
11A f r i c a n D e v e l o p m e n t B a n k
Analysis of Morocco’s Trade Policy : Impact of Morocco’s Tariff Policyon its Position as a Hub for the Rest of Africa
Sources: WTO, http://www.wto.org.
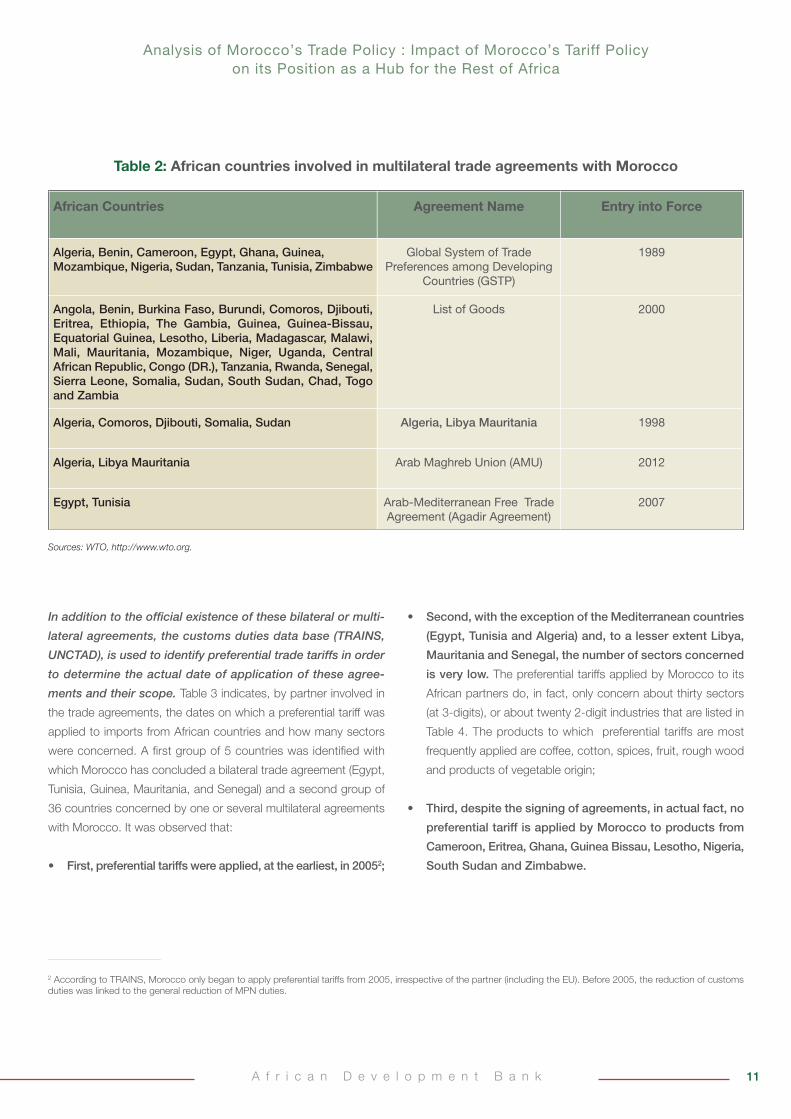
Table 2: African countries involved in multilateral trade agreements with Morocco
African Countries Agreement Name Entry into Force
Algeria, Benin, Cameroon, Egypt, Ghana, Guinea, Mozambique, Nigeria, Sudan, Tanzania, Tunisia, Zimbabwe
Global System of TradePreferences among Developing
Countries (GSTP)
1989
Angola, Benin, Burkina Faso, Burundi, Comoros, Djibouti,Eritrea, Ethiopia, The Gambia, Guinea, Guinea-Bissau,Equatorial Guinea, Lesotho, Liberia, Madagascar, Malawi,Mali, Mauritania, Mozambique, Niger, Uganda, Central African Republic, Congo (DR.), Tanzania, Rwanda, Senegal,Sierra Leone, Somalia, Sudan, South Sudan, Chad, Togoand Zambia
List of Goods 2000
Algeria, Comoros, Djibouti, Somalia, Sudan Algeria, Libya Mauritania 1998
Algeria, Libya Mauritania Arab Maghreb Union (AMU) 2012
Egypt, Tunisia Arab-Mediterranean Free TradeAgreement (Agadir Agreement)
2007
In addition to the official existence of these bilateral or multi-
lateral agreements, the customs duties data base (TRAINS,
UNCTAD), is used to identify preferential trade tariffs in order
to determine the actual date of application of these agree-
ments and their scope. Table 3 indicates, by partner involved in
the trade agreements, the dates on which a preferential tariff was
applied to imports from African countries and how many sectors
were concerned. A first group of 5 countries was identified with
which Morocco has concluded a bilateral trade agreement (Egypt,
Tunisia, Guinea, Mauritania, and Senegal) and a second group of
36 countries concerned by one or several multilateral agreements
with Morocco. It was observed that:
• First, preferential tariffs were applied, at the earliest, in 20052;
• Second, with the exception of the Mediterranean countries
(Egypt, Tunisia and Algeria) and, to a lesser extent Libya,
Mauritania and Senegal, the number of sectors concerned
is very low. The preferential tariffs applied by Morocco to its
African partners do, in fact, only concern about thirty sectors
(at 3-digits), or about twenty 2-digit industries that are listed in
Table 4. The products to which preferential tariffs are most
frequently applied are coffee, cotton, spices, fruit, rough wood
and products of vegetable origin;
• Third, despite the signing of agreements, in actual fact, no
preferential tariff is applied by Morocco to products from
Cameroon, Eritrea, Ghana, Guinea Bissau, Lesotho, Nigeria,
South Sudan and Zimbabwe.
2 According to TRAINS, Morocco only began to apply preferential tariffs from 2005, irrespective of the partner (including the EU). Before 2005, the reduction of customsduties was linked to the general reduction of MPN duties.

12 A f r i c a n D e v e l o p m e n t B a n k
Analysis of Morocco’s Trade Policy : Impact of Morocco’s Tariff Policyon its Position as a Hub for the Rest of Africa
Only three 3 Mediterranean African countries (Algeria, Egypt and
Tunisia) and Senegal apply preferential tariffs to their imports
from Morocco (Table 5). In the case of Algeria, a preferential
tariff only appeared in 1993, but its application only concerned 18
products3. The second wave of preferential tariffs occurred in 2009
and on a larger scale since this time it covered about one hundred
products. Egypt began to apply preferential tariffs to Moroccan
exports in 2005 (in about 70 sectors), then extended the preferential
agreement in 2008 and 2009 to cover about 200 products. Tunisia
introduced a preferential tariff in 2005 which directly concerned
about 200 industries. Finally, Senegal introduced a preferential tariff
on Moroccan products in 2006 to about 60 products.
3 These 18 products are identified at 3-digits in the SITC Rev3 classification.
Country 1st date of appearanceof a preferential
tariff
Number of 3-digit sectorsconcerned (SITC Rev3)
in trade
3-digit sectorsconcerned(where they number < 10)
Countries with which Morocco has a bilateral agreement
Egypt 2005 Between 100 and 150
Tunisia 2005 About 150
Guinea 2005 3 057, 071, 247
Mauritania 2005 45
Senegal 2005 24
Countries with which Morocco has a Multilateral Agreement
Algeria 2005 About 100
Angola 2005 2 057, 247
Benin 2005 2 075, 263
Burkina Faso 2005 2 057, 263
Burundi 2005 1 071
Cameroon No preferential tariff is applied
Central African Republic 2005 2 071, 075
Comoros 2006 1 075
Congo (Dem. Rep.) 2006 1 071
Djibouti 2007 3 621, 697, 761
Eritrea No preferential tariff is applied
Table 3: Effective Application Dates and Scope of Preferential Agreements appliedby Morocco to Imports from African Countries

13A f r i c a n D e v e l o p m e n t B a n k
Analysis of Morocco’s Trade Policy : Impact of Morocco’s Tariff Policyon its Position as a Hub for the Rest of Africa
Ethiopia 2005 2 071, 075
The Gambia 2006 1 057
Ghana No preferential tariff is applied
Guinea Bissau No preferential tariff is applied
Equatorial Guinea 2005 3 247, 248, 282
Lesotho No preferential tariff is applied
Liberia 2005 1 231
Libya 2005 40
Madagascar 2005 3 071, 075, 265
Malawi 2005 1 121
Mali 2005 3 057, 263, 292
Mozambique 2007 1 036
Niger 2005 3 034, 075, 231
Nigeria No preferential tariff is applied
Uganda 2005 1 071
Rwanda 2005 1 071
Sierra Leone 2005 2 071, 247
Somalia 2005 6 292, 642, 652, 696, 784, 841
Sudan 2005 9222, 251, 263, 292, 541, 699,
713, 841, 892
South Sudan No preferential tariff is applied
Tanzania 2005 4 071, 121, 263, 265
Chad 2005 2 263, 292
Togo 2005 5 057, 071, 072, 075, 263
Zambia 2005 1 071
Zimbabwe No preferential tariff is applied
Source: UNCTAD – TRAINS database.

14 A f r i c a n D e v e l o p m e n t B a n k
Analysis of Morocco’s Trade Policy : Impact of Morocco’s Tariff Policyon its Position as a Hub for the Rest of Africa
2 and 3-Digit Industries (SITC Rev3) Frequency (number of countries benefiting from a preferential tariff)
03. Fish and crustaceans034. Fish, fresh036. Crustaceans and molluscs
11
05. Vegetables and fruit057. Fruit, fresh or dried 6
07. Coffee, Tea, Cocoa, Spices071. Coffee072. Cocoa075. Spices
1217
12. Tobacco121. Tobacco, unmanufactured 222. Oil seeds and oleaginous fruit222. Oil seeds and oleaginous fruit for soft fixed vegetable oil 1
23. Rubber231. Crude rubber 2
24. Cork and wood247. Wood, rough248. Wood, simply worked
41
25. Pulp and paper waste251. Paper pulp and paper waste 1
26. Textile fibres263. Cotton265. Vegetable textile fibres
72
28. Metalliferous ores282. Waste and scrap metal of iron or steel 129. Crude animal materials292. Crude vegetable materials 454. Medicinal and pharmaceutical products541. Medicinal and pharmaceutical products other than for human or veterinary medicine 162. Rubber manufactures621. Materials of rubber 164. Paper and Paper board642. Pre-cut paper and paper board 165. Yarn and fabrics652. Cotton fabrics 1
69. Manufactures of metal696. Cutlery697. Household equipment of base metals699. Manufactures of base metal
111
71. Power generating machines713. Internal combustion piston engines and parts thereof 176. Telecommunications equipment761. Television receivers 178. Vehicles784. Motor vehicle parts and accessories 184. Clothing841. Men’s clothing 289. Miscellaneous manufactured goods892. Printed matter 1
Source: UNCTAD – TRAINS Database.
Table 4: Industries concerned by the application of a preferential tariff by Morocco to importsfrom African countries

15A f r i c a n D e v e l o p m e n t B a n k
Analysis of Morocco’s Trade Policy : Impact of Morocco’s Tariff Policyon its Position as a Hub for the Rest of Africa
Sources: WTO, http://www.wto.org.
Table 5: Effective application dates and scope of preferential agreements appliedby African Countries to Moroccan exports
Countries 1st Date of appearance of
preferential tariff
Number of 3-digit sectors
concerned (SITC Rev3) in trade
Algeria 19932009
18about 100
Egypt 20052008/2009
about 70about 300
Tunisia 2005 about 200
Senegal 2006 60

16 A f r i c a n D e v e l o p m e n t B a n k
Analysis of Morocco’s Trade Policy : Impact of Morocco’s Tariff Policyon its Position as a Hub for the Rest of Africa
III. EXISTING CUSTOMS DUTIES BETWEEN MOROCCO ANDAFRICAN COUNTRIES
III.1. TARIFFS APPLIED BY MOROCCO TO IMPORTSFROM AFRICAN COUNTRIES
Even though they have dropped considerably (78%, i.e. 39
percentage points), customs duties applied by Morocco to
imports from non-Mediterranean African countries remain,
on average, at the same level as the tariffs applied to all
other middle and low income countries, i.e. 12%, which is
unsurprising considering the low application rate of preferential
tariffs.
While the average tariff applied to all imports from the 4
Mediterranean African countries (Algeria, Egypt, Libya and
Tunisia) is virtually zero, Figure 1 shows that the customs
duties applied to sub-Saharan imports average 12%, which is
far above the average rate applied by Morocco to all its imports
(5%) and of the average tariffs applied to European (1%) and
American (4%) imports. This is the unfortunate consequence
of agreements signed with the other regions whereas few or no
agreements were signed with African countries. Indeed, as shown
in Table 2 of Volume 1 of the analysis, while in 1993, the average
for customs duties on European imports was about 13 percentage
points above the average for customs duties applied to African
imports, this difference has now largely reversed: on average,
customs duties applied by Morocco to imports from sub-Saharan
African countries are overall 11 percentage points above the
average for customs duties applied to European products, 9
percentage points above the average for customs duties applied
to Mediterranean countries4 and 8 percentage points above the
average for customs duties applied to American products. These
differences are due both to the fact that products imported from
African countries differ from those imported by the Mediterranean
countries and even more so from those imported by Europe or the
United States but especially, as already indicated by the quasi
non-existence of trade agreements and consequently of preferential
tariffs between Morocco and the sub-Saharan African countries5.
4 In part 1, it was shown that the average rate of customs duties applied by Morocco to imports from all the Mediterranean countries participating in the Barcelonaprocess was about 3% in 2012 (see Volume 1, Table 2 of this study).5 In annex, customs duties applied to 3-digit imported products both by the Mediterranean and sub-Saharan African countries are compared. It is clearly observed that,not only are the products imported by these 2 groups of countries different (of the 100 main products imported by each partner no more than 18 products are similar for a Mediterranean country and all sub-Saharan African countries, which is very low), but also that for the same product, customs duties applied by Morocco to sub-Saharan imports are higher since there are almost no real active trade agreements between Morocco and the African countries.

17A f r i c a n D e v e l o p m e n t B a n k
Analysis of Morocco’s Trade Policy : Impact of Morocco’s Tariff Policyon its Position as a Hub for the Rest of Africa
0
10
20
30
40
50
60
70
All African Countries The 4 Mediterranean AfricanCountries
All African Countries withoutthe 4 Mediterranean
1993
2012
Figure 1: Customs Duties applied by Morocco to African imports in 1993 and in 2012, simple average, effectively applied tariffs
Source: UNCTAD – TRAINS Database.
0
10
20
30
40
50
60
70
1993 1997 2000 2001 2002 2003 2005 2006 2007 2008 2009 2010 2011 2012
Southern Africa
Central Africa East Africa
West Africa
Figure 2: Customs Duties applied by Morocco to African imports in 1993 and in 2012, simple average, effectively applied tariffs
Source: UNCTAD – TRAINS Database.
Figure 2 shows the trend of average customs duties applied by
Morocco to sub-Saharan imports from West Africa, Central Africa, East
Africa and Southern Africa. It was observed that these averages actually
range between 9.4% for West Africa and 14.8% for East Africa and
that the gap between the highest and lowest averages has narrowed
considerably since it was 28 points in 1993 and is now a little over 5 points.

18 A f r i c a n D e v e l o p m e n t B a n k
Analysis of Morocco’s Trade Policy : Impact of Morocco’s Tariff Policyon its Position as a Hub for the Rest of Africa
For industry, the average tariff rate applied to imports from
sub-Saharan Africa (over 10%) is much higher than that
applied to the other regions. It is 6% for West Africa, 9.3% for
Central Africa, almost 7% pour East Africa and 12% for Southern
Africa (Figure 3). The lowest rates are those applied to European
countries and to Mediterranean countries (respectively 0.14% and
0.16%). These are followed by customs duties applied to American
imports (with an average of 3.4%).
In agriculture, the rate differences are even more pronounced
since the average ranges from 1.4% for the Mediterranean
countries to almost 27% for Southern African countries. On the
other hand, compared to industry, there is less difference between
the average customs duties applied to European imports (15%)
and the average for customs duties applied to African imports
(13.2% for Central Africa, 16.3% for West Africa, 17.7% for East Africa
and an average of 19.5% for all sub-Saharan African countries).
It was observed that, irrespective of the category of goods
(Figure 4 – capital goods, intermediate goods, commodities
and consumer goods), the gap between the average rate of
customs duties applied to European countries and the highest
average rate of customs duties applied to African countries is
about 17 percentage points. It even rises to 23 percentage points
for intermediate goods. With the United States, this rate difference
ranges from 12 to 21 percentage points. It was also observed that
in the case of capital goods and intermediate goods, the highest
average concerned East African countries (17.5% for capital goods
and 24% for intermediate goods); the lowest average rate was
for West Africa for capital goods (3.1%) and Southern Africa for
intermediate goods (6.5%). For commodities, the average rate of
customs duties applied to imports from sub-Saharan Africa was
between 9.8% for Central Africa and 24% for Southern Africa. On
the other hand, for consumer goods, the tariffs applied to the
different sub-Saharan African regions are, on average, less widely
spread since their average lies between 14.3% for West Africa and
19.9% for Southern Africa.
The tariff policy pursued by Morocco over the past 20 years
has resulted in an involuntary, unfavourable difference in the
rate for African countries (excluding the Mediterranean countries),
compared to the customs duties applied to European, American
and Mediterranean countries, irrespective of the category of
goods.
024681012
Industry
Med
cou
ntrie
s
Afric
an c
ount
ries
Wes
t Afri
ca
East
Afri
ca
Cen
tral A
frica
Sou
ther
n Af
rica
EU
Uni
ted
Sta
tes
051015202530
Agriculture
Med
cou
ntrie
s
Afric
an c
ount
ries
Wes
t Afri
ca
East
Afri
ca
Cen
tral A
frica
Sou
ther
n Af
rica
EU
Uni
ted
Sta
tes
Figure 3: Comparison between customs duties currently applied by Morocco in industryand in agriculture between African countries, the EU and USA,
effectively applied tariffs, simple average
Source: UNCTAD – TRAINS Database.

19A f r i c a n D e v e l o p m e n t B a n k
Analysis of Morocco’s Trade Policy : Impact of Morocco’s Tariff Policyon its Position as a Hub for the Rest of Africa
-2
3
8
13
18
Med countries African countries West Africa East Africa Central Africa Southern Africa EU United States
Capital Goods
Med countries African countries West Africa East Africa Central Africa Southern Africa EU United States0
5
10
15
20
25
Intermediate Goods
Figure 4: Comparison between customs duties currently applied by Morocco according by category of goods between African countries, EU and USA,
effectively applied tariffs,simple average
Med countries African countries West Africa East Africa Central Africa Southern Africa EU United States0
5
10
15
20
25
Commodities

III.2. TARIFFS APPLIED BY AFRICAN COUNTRIES TOIMPORTS FROM MOROCCO
It was also noted that, both in 2001 and in 2012, the tariffs
applied by African countries to imports from Morocco were, on
average, 3 or 4 percentage points higher than tariffs applied to
European or American imports. It is, therefore, more advantageous
for a European or American firm to export directly to sub-Saharan
Africa rather than do so from Morocco (Figure 5). While they have
been maintained in the Figure, the averages obtained before 2001
must be considered with great caution to the extent that, before that
date, tariffs were not available for many countries, which obviously
distorts the averages. Therefore, the trend of these averages can only
be commented on from 2001. It was also noted that the customs duties
applied by sub-Saharan African countries have remained virtually
unchanged: between 2001 and 2012, they dropped from 17.3% to
15.2% for imports from Morocco, from 13.4% to 11.6% for European
imports and from 13.7% to 12.7% for American products.
20 A f r i c a n D e v e l o p m e n t B a n k
Analysis of Morocco’s Trade Policy : Impact of Morocco’s Tariff Policyon its Position as a Hub for the Rest of Africa
Med countries African countries West Africa East Africa Central Africa Southern Africa EU United States
Consumer Goods
0
5
10
15
20
Source: UNCTAD – TRAINS Database.
3
7
9
11
13
15
17
19
21
23
25
1993
1994
1995
1996
1997
1998
1999
2000
2001
2002
2003
2004
2005
2006
2007
2008
2009
2010
2011
2012
EU
USA
Morocco
Figure 5: Trend of customs duties applied by sub-Saharan African countries to importsfrom Morocco, the EU and USA, effectively applied tariff, simple average
Source: UNCTAD – TRAINS Database.

21A f r i c a n D e v e l o p m e n t B a n k
Analysis of Morocco’s Trade Policy : Impact of Morocco’s Tariff Policyon its Position as a Hub for the Rest of Africa
In the section on tariff agreements between Morocco and the
African countries, it was observed that 4 countries (Algeria,
Egypt, Tunisia and Senegal) have effectively established
preferential tariffs in favour of Moroccan imports (see Table 5).
Therefore, a determination was made as to how the average rate
of customs duties applied by each of these four countries to
Moroccan imports had developed compared to the average rate
of customs duties applied to European and American imports.
Figure 7 shows that while the average rate of customs duties
applied by Algeria and Egypt to Moroccan imports is 0 and, there-
fore, falls far short of the averages applied to European (13% for
Algeria, 9% for Egypt) and American (16.8% for Algeria, 15% for
Egypt) imports, on the other hand, in the case of Tunisia, TRAINS
data suggest that this average could have exceeded those which
are applied to European and American imports. Custom duties
imposed by Tunisia on Moroccan imports are reported to be on
average 20.4%, while those applied to European and American
imports are 12.6% and 13.1% respectively. It is worth noting that
the same TRAINS data also indicate that the average rate of
customs duties applied to applied by Tunisia to Moroccan imports
had fallen to 0 in 2005, 2006 et 2007. This average rose to 29% in
2008. However, the procedure used by TRAINS to populate the
database6 does not, in our opinion, make it possible to determine
the real level of customs duties effectively applied by Tunisia from
2008. Similarly, Egyptian customs duties in 2006 and 2007, must
be interpreted with considerable caution. In the case of Senegal,
customs duties applied to Moroccan, European and American
imports have an average that is almost identical at around 13%.
6 Following the signing of agreements involving the Mediterranean countries and more specifically Egypt and Tunisia (Agadir agreement, bilateral and PAFTA agreements),TRAINS re-entered from 2005 for Tunisia and for Egypt a preferential tariff on Moroccan imports equal to 0%. Where the countries no longer communicated to TRAINSthe level of preferential customs duties, TRAINS considered the only customs duty that existed was the MFN duty. The effectively applied tariffs then become equal tothe MFN tariffs. This procedure explains why Egyptian customs duties on Moroccan imports rose from 0% in 2005 then surge to 49% and 48% in 2006 and 2007,beforereturning to 0% from 2008. Similarly, it also explains why Tunisian customs duties applied to Moroccan imports which were 0% in 2005, 2006 and 2007, suddenly surgeto 29% in 2008 and remain at a relatively high rate from the onwards. There is therefore great uncertainty surrounding the real level of customs duties effectively appliedto Moroccan imports, especially in the case of the customs duties effectively applied especially in the case of these 2 Mediterranean countries. This procedure used byTRAINS may distort the data. This risk of data error has therefore been factored into the econometric estimations by replacing the false effectively applied tariffs by thepreferential tariffs.

When the customs duties applied to Moroccan imports are
disaggregated by African regions, these customs duties are
generally the highest. (Figure 7). Only in the case of East African
countries is the average rate of customs duties applied to Moroccan
imports the lowest with 11.7% for Moroccan imports compared to
14.8% for European imports, 14.7% for American imports, 14.2%
for imports from other developed countries and 15.7% for imports
from other low- and middle-income countries.
22 A f r i c a n D e v e l o p m e n t B a n k
Analysis of Morocco’s Trade Policy : Impact of Morocco’s Tariff Policyon its Position as a Hub for the Rest of Africa
Source: UNCTAD – TRAINS Database.
051015202530
Algeria Tariffs
EU Morocco USA
0102030405060
Egypt Tariffs
EU Morocco USA
0
10
20
30
40
50
Tunisia Tariffs
EU Morocco USA
0
5
10
15
20
Senegal Tariffs
EU Morocco USA
Figure 6: Trend of customs duties applied by the 4 African countries whichhave established preferential tariffs on imports from Morocco,
effectively applied tariff, simple average

23A f r i c a n D e v e l o p m e n t B a n k
Analysis of Morocco’s Trade Policy : Impact of Morocco’s Tariff Policyon its Position as a Hub for the Rest of Africa
Source: UNCTAD – TRAINS Database.
0.00 2.00 4.00 6.00 8.00 10.00 12.00 14.00 16.00 18.00 20.00
EU
Middle and low-income countries
USA
Other high-income countries
Other high-income countries
Morocco
Morocco
EU
EU
Middle and low-income countries
Middle and low-income countries
USA
USA
Other high-income countries
Other high-income countries
Morocco
Morocco
Middle and low-income countries
EU
EU
Middle and low-income countriesOther high-income countries
USA
USA
Morocco
East
Afr
ica
Cen
tral
Afr
ica
Sout
hen
Afr
ica
Afr
ican
coun
trie
sw
ithou
t Med
Wes
t Afr
ica
Figure 7: Comparison of customs duties applied by African countries by origin of imports, effectively applied tariff, simple average
In order to complete this analysis, a comparison has been
made on the same graph (Figure 8) between the trend of
the average rate of customs duties applied by Morocco to
imports from sub-Saharan African countries as well as the
trend of the average tariff rates applied by sub-Saharan
African countries to Moroccan imports. Bearing in mind that
behind this average which concerns all trade, there is significant
heterogeneity both between industries and between African
countries, the following general conclusions may be reached
from this graph:
• First, over the entire period, Moroccan customs duties
applied to imports from sub-Saharan Africa on average,
exceed African customs duties applied to Moroccan
imports, with the exception of only 3 years (1997, 19987
and, more recently 2012);
7 As a reminder, these 2 years fall within the period during which African data on customs duties were not available for many countries.

24 A f r i c a n D e v e l o p m e n t B a n k
Analysis of Morocco’s Trade Policy : Impact of Morocco’s Tariff Policyon its Position as a Hub for the Rest of Africa
8 The year from which African tariffs are correctly entered which gives a meaningful average.9 COMESA comprises Burundi, Comoros, Democratic Republic of Congo, Ethiopia, Eritrea, Djibouti, Kenya, Libya, Madagascar, Malawi, Mauritius, Rwanda, the Seychelles,Zimbabwe, Sudan, Swaziland, Uganda, Egypt and Zambia.10 EAC comprises Burundi, Kenya, Rwanda, Uganda and Tanzania.11 ECCAS comprises: Angola, Burundi, Cameroon, Central African Republic, Chad, Congo, Republic of Congo, Equatorial Guinea, Gabon and Sao Tome.12 ECOWAS comprises Cape Verde, Benin, The Gambia, Ghana, Guinea, Côte d’Ivoire, Liberia, Mali, Niger, Nigeria, Guinea-Bissau, Senegal, Sierra Leone, Togo andBurkina Faso.
0
10
20
30
40
50
60 Tariffs applied by Moroccoto African imports
Tariffs applied by African countries to Moroccanimports
Figure 8: Comparison between the trend of Moroccan customs duties appliedto African imports, effectively applied tariff, simple average
Source: UNCTAD – TRAINS Database.
• Second, the average rate of Moroccan customs duties
on African imports has converged towards the average
rate of African customs duties on Moroccan imports: while
in 20018, the average rate of Moroccan import duties on
imports from sub-Saharan Africa was 12 percentage points
above the average rate of customs duties applied by
African countries to Moroccan imports, this wide gap
narrowed steadily until 2012. There was still a difference of 2
points in 2011 but the trend reversed in 2012 and the average
rate of Moroccan customs duties fell 3 points below the
average rate of African customs duties on Moroccan imports.
These averages were respectively 12.3% and 15.2% in 2012).
Lastly, reciprocal tariffs between Morocco and Africa’s 4 main
regional economic communities were considered, namely the
Common Market for Eastern and Southern Africa (COMESA9),
the East African Community (EAC10), the Economic Community
of Central African States (ECCAS11) and the Economic Community
of West African States (ECOWAS12) (Figure 9). It was observed
that while for COMESA, the lowest rate of customs duties was that
applied to Moroccan imports (with 6.2%, compared to 11.3% to
European imports and 13.1% to American imports), on the other
hand, for the ECCAS, ECOWAS and EAC, the average rate of
customs duties applied to Moroccan imports (respectively 16.35%,
14.5% and 13.4%) is higher than that of the tariffs applied to
European imports (14.3%, 12.9% and 12.8%) and to American
imports (13.7%, 13.1% and 13.3%). It should be noted that the

25A f r i c a n D e v e l o p m e n t B a n k
Analysis of Morocco’s Trade Policy : Impact of Morocco’s Tariff Policyon its Position as a Hub for the Rest of Africa
0 2 4 6 8 10 12 14 16 18
USA
USA
USA
USA
CEA
CEDEAO
CEEAC
COMSA
Morocco
EU
Morocco
EU
Morocco
EU
Morocco
EU
Figure 9: Customs Duties applied by COMESA, ECCAS, ECOWAS and the EACto Moroccan, European and American Imports
Source: UNCTAD – TRAINS Database.
fairly low average rate of customs duties applied by COMESA to
Moroccan imports is largely due to the involvement of Egypt and
Libya in this economic community. It was also observed that the
ECOWAS and ECCAS average rates for customs duties are very
close to those calculated in the case of West African and Central
African countries since the definitions of these groups of countries
are very close.
In conclusion, it is clear that the average rate of customs
duties applied by Morocco to African imports is higher than that
applied by African countries only in the case of the EAC (with
14.8% compared to 13.4%) (Figure 10). For the 3 other economic
communities, the average rate of customs duties applied by Morocco
to imports from these African countries is lower than that applied
by African countries to Moroccan imports.

26 A f r i c a n D e v e l o p m e n t B a n k
Analysis of Morocco’s Trade Policy : Impact of Morocco’s Tariff Policyon its Position as a Hub for the Rest of Africa
02468
1012141618
Tariffsapplied by
Africancountries toMoroccan
imports
Tariffsapplied byMorocco to
African imports
Tariffsapplied by
Africancountries toMoroccan
imports
Tariffsapplied byMorocco to
African imports
Tariffsapplied by
Africancountries toMoroccan
imports
Tariffsapplied byMorocco to
African imports
Tariffsapplied by
Africancountries toMoroccan
imports
Tariffsapplied byMorocco to
African imports
EAC ECOWAS ECCAS COMESA
Figure 10: Reciprocal Customs Duties between Morocco and the 4 main African economycommunities, simple average by country*, effectively applied tariffs
Source: UNCTAD – TRAINS Database.
The average customs duties by country are simple averages. On the other hand, when calculating averages for a group of countries, TRAINS uses an average weighted by the
share of imports of the partner from the country concerned.
In summary, over these past ten years, following tariff
negotiations between Morocco and other economic partners,
Morocco has, on average, applied higher customs duties to
imports from sub-Saharan Africa than the customs duties
applied by these countries to Moroccan imports to African
markets. The average rate of Moroccan tariffs to sub-Saharan
African countries has fallen to 3 percentage points below the
average applied by sub-Saharan African countries to Moroccan
imports in 2012. Moreover, customs duties reciprocally applied
by Morocco and sub-Saharan African countries remain relatively
high (12.3% for tariffs applied by Morocco and 15.2% for tariffs
applied by the sub-Saharan African countries), i.e. for Moroccan
tariffs, respectively 11 and 8 percentage points above the
customs duties applied to European and American imports and,
for African tariffs, between 3 and 4 points percentage points
above the tariffs applied to European and American imports.

27A f r i c a n D e v e l o p m e n t B a n k
Analysis of Morocco’s Trade Policy : Impact of Morocco’s Tariff Policyon its Position as a Hub for the Rest of Africa
IV. WHAT IS A HUB?
The overlapping of free trade agreements has led to the
emergence of a particular trade relations system called
a hub-and-spoke system”. Economic literature provides a
specific definition13 of such a system by considering the case
where there are three countries and the case with more than 3
countries. These definitions are as follows:
• Where there are three countries A, B and C, and A and B have
a bilateral trade agreement, if A signs a bilateral trade agreement
with C, a hub-and-spoke system emerges where A plays the
role of hub and where B and C are the spokes. This relationship
remains valid as long as there is no agreement between B and C
(see Diagram 1).
• Where there are three countries, if country i has bilateral agreements
with m countries (m>1) and country j belongs to countries m,
then country j is defined as a spoke if it has trade agreements
with m-1 country (or less) among the m countries that have an
agreement with country i and country i is a hub (see diagram 2).
It should be noted that a country belonging to more than 2
free-trade agreements may be both a hub and a spoke.
Diagram 1: 3 country hub-and-spoke system
Free Trade Agreement
Country A
Country B Country C
Diagram 2: More than 3 Country Hub-and-Spoke System
Country A
Country B Country C Country D Country E Country F
13 See Hur et al. (2010), Chong & Hur (2008).

28 A f r i c a n D e v e l o p m e n t B a n k
Analysis of Morocco’s Trade Policy : Impact of Morocco’s Tariff Policyon its Position as a Hub for the Rest of Africa
A country in a hub position enjoys preferential access to a
greater number of markets than the spoke countries and is
consequently more competitive, which helps to create export
growth. A hub also has the advantage of being more attractive for
foreign direct investment. In return, firms in country A which export
are faced with several bilateral agreements, which complicates the
regulatory system and may increase their transaction cost when
they want to benefit from preferential tariffs and fulfil the conditions
imposed by rules of origin and accumulation. In empirical literature,
the privileged positions of hubs is confirmed in the sense that
following a free-trade agreement, their exports will grow faster than
those of countries in a spoke position14 (Hur et al., 2010).
Diagram 3 illustrates all the free trade agreements which
directly or indirectly concern Morocco in its relationships with
the African countries. As an analysis of the situation regarding
customs duties might suggest, the structure of its agreements
does not put Morocco in a hub position vis-à-vis African countries.
Insofar as the United States has not signed any free trade
agreement with Africa’s sub-Saharan countries, Morocco
could assume a hub position if it were to enter into one or
more multilateral or multilateral free-trade agreements
with the sub-Saharan countries. On the other hand, the EU
has already signed free-trade agreements with South Africa
(implemented since January 2000), Cameroon (implemented since
August 2014), Côte d’Ivoire (implemented since January 2009) and
the countries of Eastern and Southern Africa (Madagascar,
Mauritius, Seychelles and Zimbabwe). Consequently, even though
Morocco establishes a free-trade agreement with sub-Saharan
Africa it will not benefit from a hub situation, with as spoke
countries, the EU and 7 sub-Saharan countries.
14 Chong and Hur (2008) showed that in the case of a small open country like Singapore, the hub situation was preferable from the standpoint of well-being than a free-trade area involving the same countries. Delmas et al. (2012) carried out their empirical analysis based on the experience of Israel. That country achieved a hub positionwhen the free trade agreement with the United States was applied in 1985 while it already had a free-trade agreement with the EU since 1975. They show that this hubsituation was beneficial to Israel to the extent that not only did its exports to USA increase but its exports to the EU also increased after 1985.
(Algeria, Saudi Arabia, Bahrein, Comoros,
Djibouti, Egypt, UnitedArab Emirates, Iraq,
Jordan, Kuwait, Lebanon,Libya, Oman, Palestine,Qatar, Somalia, Sudan, Syria, Tunisia, Yemen)
Eastern &Southern Africa
(Madagascar,Mauritius,
Seychelles,Zimbabwe)
Cameroon South Africa Côte d’Ivoire
United Arab EmiratesJordan
Tunisia
AELE
Egypt
Turkey
Mauritius
PAFTA
(Egypt, Jordan, Tunisia)
AGADIR
(Algeria, Libya, Tunisia, Mauritania)
UMA
USA
EU
Morocco
Diagram 3: The free-trade system concerning Morocco and relations with the EUand African countries
Sources: Ministry of Foreign Trade, http://www.mce.gov.ma, Moroccan Customs, http://www.douane.gov.ma and WTO, http://www.wto.org.

29A f r i c a n D e v e l o p m e n t B a n k
Analysis of Morocco’s Trade Policy : Impact of Morocco’s Tariff Policyon its Position as a Hub for the Rest of Africa
It was noted that the existing structure of free-trade agreements
puts Morocco in a hub situation in many instances with the
following as spoke countries:
• The EU and USA (since the entry into force of the Free Trade
Agreement with the USA in 2006) ;
• The USA, Egypt and Tunisia (also since the entry into force of
the Free Trade Agreement with the USA in 2006);
• The EU, USA, United Arab Emirates, Mauritania and Libya
(since the implementation of the agreement with the Arab
Maghreb Union in 2012).
Moreover, if the Pan-Arab Free Trade Area (PAFTA) was effective, it
would provide Morocco with an opportunity to position itself as a
hub involving a larger number of countries, i.e. to have as spokes
on the one hand, the USA and all the PAFTA countries and, on the
other, the EU, USA and all the PAFTA countries that do not have
free-trade agreements with the EU.
In this system of overlapping free trade agreements, Morocco
is, however, frequently in a spoke country situation, which could,
perhaps be one of the reasons why the country would not fully
benefit from these agreements and thus from its tariff policy. De
Benedictis et al. (2005) have, for example, shown that the existence
of free-trade agreements qualified as intra-periphery between the
countries of Central and Eastern Europe and the Baltic countries
have contributed to the growth of trade between these countries and
to limiting the emergence of a hub-and-spoke structure between
these countries and the EU. These factors should be examined more
closely in the definition of Morocco’s future trade policy.

30 A f r i c a n D e v e l o p m e n t B a n k
Analysis of Morocco’s Trade Policy : Impact of Morocco’s Tariff Policyon its Position as a Hub for the Rest of Africa
V. DESCRIPTIVE ANALYSIS OF THE TREND OF TRADE BETWEENMOROCCO AND AFRICAN COUNTRIES
The aim of this section is to look at Morocco’s role in
Africa’s regional trade and determine whether, despite
differences in customs duties that are not conducive to the
development of trade and a structure of free trade agreements
which does not, from a theoretical standpoint, put Morocco in
a hub situation in relation to the sub-Saharan African countries,
the trend of trade flows is, or is not, evolving towards the
establishment of a hub-and-spoke relationship between
Morocco and the African countries. In order to meet the objective
of this section, an initial overview of the geographical development
of Moroccan trade will be carried out followed by an assessment of
the weight of African partners in Moroccan trade and finally the
weight of Morocco in Africa’s trade.
V.1. GENERAL TREND OF MOROCCO’S TRADE
Sub-Saharan Africa only represents slightly over 6% of Moroccan
exports and slightly under 1% of Moroccan imports. Moroccan
trade has been mainly channelled towards the EU since, in 2013,
over 60% of exports were intended for the European market and
over 50% of imports from the European of 27. France and Spain
hold dominant positions among the European countries: the French
and Spanish markets respectively represent 21.5% and 18% of
Moroccan exports and 26% of Morocco’s imports originate from
France and Spain.
There is only one sub-Saharan country, Senegal, among the 25
top destinations for Moroccan exports (which represent about
86% of total exports). It represents about 1% of Morocco’s
exports. In 1993, the only sub-Saharan African country among
the top 25 destinations for Moroccan exports (which, at the time,
represented 92% of total exports) was Liberia. Only 15 of these top
destinations were present in both 1993 and 2013 which clearly
confirms that there has been a fairly profound change in the
structure of Moroccan exports. By taking the 50 main destinations
for Moroccan exports, 95% of total exports are covered. Total
exports rose by 488% between 1993 and 201315. Morocco has
increased its exports more rapidly than this average to 31 countries,
which thus represent increasingly important markets for the country.
7 of these 31 countries are sub-Saharan (Equatorial Guinea, Angola,
Senegal, Ghana, Guinea, Cote d’Ivoire and Nigeria) and 3 are
Mediterranean countries (Egypt, Lebanon and Turkey).
On the import side, there are no sub-Saharan countries among
Morocco’s top 25 suppliers (which represent a little under 90%
of total imports), while there was one in 1993, Cameroon. 19
countries appear in both lists of 25 in 1993 and in 2013, suggesting
from a geographical standpoint that the structure of imports has
changed slightly less than that of exports. In the case of Morocco’s
50 main importers (which represent 97% of imports), these imports
grew by 635% on average between 1993 and 2013. Imports from
Morocco have grown more rapidly in 26 countries which have
assumed a strong position among them. None of the 26 countries
is sub-Saharan, while 3 are Mediterranean (Turkey, Egypt and
Algeria). Thus 2 Mediterranean countries, Turkey and Egypt are to
be found both on the export and import sides as countries where
trade with Morocco has risen most sharply. As a reminder, and as
mentioned above, these are 2 countries with which Morocco has
implemented a bilateral free trade agreement and a multilateral
agreement in the case of Egypt.
If, reciprocally, the importance of Morocco in sub-Saharan
African trade is taken into consideration, it is noted that
Morocco was not among these countries’ 50 main exporters in
2013. In the classification of export markets, Morocco was, in
fact, ranked 95th with only 0.05% of the region’s exports. On the
15 In the descriptive analysis in the previous section it was shown that Moroccan exports had grown by 406% between 1990 and 2012.

31A f r i c a n D e v e l o p m e n t B a n k
Analysis of Morocco’s Trade Policy : Impact of Morocco’s Tariff Policyon its Position as a Hub for the Rest of Africa
import side, Morocco’s importance is relative since with 0.27% of
the region’s imports, it is ranked 62nd out of all the importers.
However, in addition to the value of the flows, it is also necessary
to consider at this point, as mentioned above, the concentration
of trade between a country and its partners which may be
measured by the Trade Intensity Index (TII). This index compares
the share of trade of a given country with a partner with world trade
with the same partner. It may be calculated both for exports and
for imports. On the export side Morocco’s trade intensity index for
any partner j is equal to the ratio between the total share of Moroccan
exports to partner j and the total share of world exports to the same
partner j. If the share of Moroccan exports exceeds the share of
world exports, i.e. if the index is greater than 1, this means that
Morocco is a major supplier for country j in relation to the entire
world. It is then possible to identify countries to which Morocco can
export with some success.
Over the 2011-2013 period, the trade intensity index for
Morocco was greater than 1 vis-à-vis 28 partners, 9 of which
were sub-Saharan countries (Guinea, Senegal, Equatorial
Guinea, Cote d’Ivoire, Ghana, Togo, Angola, Nigeria and
Mauritania), 6 were Mediterranean countries (Tunisia, Algeria,
Libya, Lebanon, Egypt and Turkey) and 6 European (France, Spain,
Portugal, Italy, Malta and Romania). These are, therefore, countries
to which Morocco exports more intensively in comparison with
average world exports.
The calculation of the same index for Moroccan imports over
the 2011-2013 period shows that it is greater than 1 in the case
of 22 partners, four of which are sub-Saharan countries (Togo,
Senegal, Malawi and Cameroon), 4 are Mediterranean countries
(Egypt, Algeria, Tunisia and Turkey) and 7 are European countries
(Spain, Portugal, France, Romania, Italy, Greece and Sweden).
Therefore, it can be deduced that Morocco represents an
important destination for the products of these countries.
The fact of having highlighted that the large majority of
Morocco’s partner countries for which the trade intensity index
is greater than 1, either for exports or imports, are countries in
relatively close proximity to Morocco, could be interpreted
as being related to lower transport costs, the existence of a
common language or to a cultural proximity which would
reinforce the role played by economies of scale. These are
fundamental arguments to explain the trade flows in gravity models.
Also, to go beyond these arguments, changes in the trade intensity
index were also considered.
On the basis of the 50 main country destinations for Moroccan
exports, those partners were retained for which the trade
intensity index was greater than 1 and had increased between
the beginning and end of the period under consideration, i.e.
between 1993-1995 and 2011-201316. 19 partners, which are
Moroccan export recipient countries, met this dual condition of
having a rising index greater than 1 in 2011-2013. 8 of them are
sub-Saharan countries (Senegal, Equatorial Guinea, Ghana,
Angola, Guinea, Cote d’Ivoire, Togo and Mauritania) and only 2 are
Mediterranean countries (Egypt and Lebanon).
From this initial analysis it may be deduced that the African
countries that appear to be relatively important partners for
Morocco both from the export and import standpoints are, in
the case of sub-Saharan Africa, Senegal, Equatorial Guinea,
Ghana, Angola, Guinea, Cote d’Ivoire and Togo. Among the
Mediterranean African countries there is Egypt. It should,
however, be noted that one Mediterranean country which is not
African appears to play a key role in trade with Morocco, namely
Turkey. That is why that country sometimes appears in some parts
of the following descriptive analysis.
V.2. AFRICA’S IMPORTANCE TO MOROCCO
Sub-Saharan African countries are neither a very important
destination nor source for Moroccan exports and imports.
However, these export and import shares have altered
slightly over the past 20 years (Figure 11). The share of
Moroccan imports from sub-Saharan Africa has in fact declined
since it fell from about 5% in 1997 to a little less than 1% in
2013. The share of Moroccan exports to the sub-Saharan
African market has, on the other hand, been strengthened
since it rose from slightly over 3% in 1993 to 6% in 2013. In
aggregate terms, it was, therefore, observed that sub-Saharan
Africa is more important to Morocco in terms of exports rather
than imports.
16 The indices are calculated on 3-year averages in order to reduce the risk of outliers that might be found in annual data. There may, in fact, be surprising inter-annualvariations.

32 A f r i c a n D e v e l o p m e n t B a n k
Analysis of Morocco’s Trade Policy : Impact of Morocco’s Tariff Policyon its Position as a Hub for the Rest of Africa
0.00%
1.00%
2.00%
3.00%
4.00%
5.00%
6.00%
7.00%
1993 1995 1997 1999 2001 2003 2005 2007 2009 2011 2013
% Imports
% Exports
Figure 11: Trend of sub-Saharan African shares in Moroccan trade
The share of Moroccan exports to sub-Saharan has risen
over these past 20 years, but especially the relative share of
Moroccan exports in relation to the average share of world
exports which has grown (Figure 12). Another interesting point
is that even though this Moroccan export intensity index has also
increased in the case of Turkey and especially of Egypt it was
higher throughout the period in relation to sub-Saharan African
countries. It must also be stressed that, while the share of
Moroccan exports intended for the sub-Saharan market is low, the
value of these exports multiplied by 6.8 between 2002 and 2013,
whereas total Moroccan exports multiplied by 2.8 over the same
period.
Source: UN Comtrade Database, via WITS. Calculations made using TradeSift software.

33A f r i c a n D e v e l o p m e n t B a n k
Analysis of Morocco’s Trade Policy : Impact of Morocco’s Tariff Policyon its Position as a Hub for the Rest of Africa
If this flow is disaggregated at sector level, 33% of Moroccan
exports to sub-Saharan African are agricultural products
and live animals (Figures 13 a, b and c). This share has
remained fairly stable compared to 1993, since it was 30%.
These are followed by petroleum products (which rose from a
very low percentage in 1993 to 16% in 2013), chemical products
(which rose from 9% in 1993 to 15% in 2013, manufactured
goods (which rose from 6% in 1993 to 14% in 2013) and ma-
chinery and transport equipment whose share plummeted be-
tween 1993 and 2013 from 41% to 12%. On the other hand,
exports to the Egyptian market (Figure 13b) are largely dominated
by machinery and transport equipment (86% in 2013) and the
share of manufactured goods and that of agriculture fell. As in
the case of Egypt, machinery and transport equipment occupy
a significant position in Moroccan exports to the Turkish market
(57% in 2013). Chemical products, on the other hand, have
dropped very sharply: they represented 86% of Moroccan
exports to Turkey in 193 whereas in 2013, they only represented
12%.
If the overall trend of the structure of Morocco’s exports is
compared to that of exports to sub-Saharan Africa by Egypt
and Turkey, a salient feature is the very strong growth in the
machinery and transport equipment sector (Figure 13d),
which is quite clear in the case of exports to Egypt and Turkey
but which is not at all the case of exports to the sub-Saharan
market. It was also observed that there was a reduction in the
share of agricultural products (which did not occur either in the
case of sub-Saharan Africa or in the case of Turkey) and in the
share of other manufactured products (which also occurs in the
case of sub-Saharan Africa). Chemical products, on the other
hand, lost 3 percentage points while their share in Moroccan
exports to Turkey collapsed.
This first sector breakdown at 1-digit of Moroccan exports
consequently shows that there are major differences not
only in the structure of exports to sub-Saharan countries
compared to exports made to Egypt and Turkey but also the
way in which these structures have evolved.
0.000
0.500
1.000
1.500
2.000
2.500
3.000
1993 1994199519961997199819992000 20012002 2003 2004 2005 2006 20072008 20092010 20112012 2013
Egypt Sub-Saharan Africa Turkey
Figure 12: Trend of the Moroccan Export Intensity Index in Relationto Sub-Saharan African, Egypt and Turkey

34 A f r i c a n D e v e l o p m e n t B a n k
Analysis of Morocco’s Trade Policy : Impact of Morocco’s Tariff Policyon its Position as a Hub for the Rest of Africa
0.00%5.00%10.00%15.00%20.00%25.00%30.00%35.00%40.00%45.00%
1993
2013
Figure 13 a: Shares of Moroccan exports to sub-Saharan Africa in 1993 and 2013by major 1-digit sectors
Source: UN Comtrade Database, via WITS. Calculations made using TradeSift software.
1993
2013
0.00%10.00%20.00%30.00%40.00%50.00%60.00%70.00%80.00%90.00%100.00%
Figure 13 b: Shares of Moroccan exports to Egypt in 1993 and 2013by major 1-digit sectors
Source: UN Comtrade Database, via WITS.

35A f r i c a n D e v e l o p m e n t B a n k
Analysis of Morocco’s Trade Policy : Impact of Morocco’s Tariff Policyon its Position as a Hub for the Rest of Africa
1993
2013
0.00%10.00%20.00%30.00%40.00%50.00%60.00%70.00%80.00%90.00%100.00%
Figure 13 c: Shares of Moroccan Exports to Turkey in 1993 and 2013by major 1-digit sectors
Source: UN Comtrade Database, via WITS. Calculations made using TradeSift software.
1993
2013
0.00%
5.00%
10.00%
15.00%
20.00%
25.00%
30.00%
Figure 13 d: Shares of Moroccan exports in 1993 and 2013by major 1-digit sectors
Source: UN Comtrade Database, via WITS. Calculations made using TradeSift software.

36 A f r i c a n D e v e l o p m e n t B a n k
Analysis of Morocco’s Trade Policy : Impact of Morocco’s Tariff Policyon its Position as a Hub for the Rest of Africa
It was found that the degree of trade concentration is much
higher in the case of Egypt and Turkey than in sub-Saharan
African and European countries (Table 6). In identifying the share
of the 5 main 3-digit sectors in Moroccan exports to Egypt, the
EU, sub-Saharan Africa and Turkey, it was noted that Moroccan
exports to the Egyptian and Turkish markets were largely
dominated by passenger motor vehicles (781). The 5 sectors
whose shares in Moroccan exports to sub-Saharan Africa were
highest in 2013 were petroleum products (15.4% compared to 0%
in 1993), fishery products (14% compared to 27.4% in 1993),
fertilizer (9.8% compared to 1.8% in 1993), semolina and flour
(5.9% compared to 0% in 1993) and electrical equipment (5%
compared to 0.02% in 1993). The only one among the 5 main
sectors identified for the other 3 countries is fisheries (037), which
is only found in the case of Egypt where it only represents 2.6% of
Moroccan exports to that country.
Egypt
Product Code Product Name 1993 2013
781 Passenger motor vehicles 85.51
642 Paper and paper-board, pre-cut 2.96
037 Fish, prepared or preserved 10.79 2.61
673 Flat-rolled iron or steel 13.05 1.21
098 Edible products and preparations 0.00 0.93
Total 23.84 93.22
EU27
773 Equipment for distribution of electricity 2.08 14.83
842 Women’s, girls’ clothing 2.70 10.10
781 Passenger motor vehicles 0.00 8.11
054 Vegetables 4.39 5.58
845 Other textile apparel 11.43 5.15
Total 20.59 43.77
SSA
334 Petroleum products 0.00 15.14
037 Fish, prepared or preserved 27.41 14.13
562 Fertilizer 1.77 9.79
046 Semolina and flour 5.93
773 Equipment for distribution of electricity 0.02 5.01
Total 29.20 50.00
Turkey
781 Passenger motor vehicles 52.79
272 Fertilizer 4.80 12.72
522 Inorganic chemical products 39.59 11.83
081 Animal feedstuffs 0.00 5.19
842 Women’s and girls’ clothing 1.80
Total 44.39 84.32
Table 6: Shares of Moroccan exports to Egypt, EU, sub-Saharan Africa and Turkeyfor the 5 main 3-digit (SITC Rev 3) sectors in 2013
Source: UN Comtrade Database, via WITS. Calculations made using TradeSift software.

37A f r i c a n D e v e l o p m e n t B a n k
Analysis of Morocco’s Trade Policy : Impact of Morocco’s Tariff Policyon its Position as a Hub for the Rest of Africa
The trend, over the past 20 years, of the trade intensity index
for the key sectors for which the shares of Moroccan exports
to sub-Saharan Africa are highest is presented in Figure 14.
The intensity index in the oil sector fluctuates widely because of
the variation in oil prices. It is, moreover, the only sector along with
that of chemical products which sometimes fell below 1 during the
period under consideration. All the other sectors, i.e. agricultural
products, machinery and transport equipment and manufactured
goods have a Moroccan export intensity index greater than 1. It
was, however, noted that, while that intensity remained greater
than 1, Morocco’s exporter position in the machinery and
transport equipment sector with respect to sub-Saharan Africa
had, on average, deteriorated. Indeed, the index had fallen over
the period under consideration. Furthermore, a comparison for
the same sectors, of the trade intensity indices with those of the 2
most important partners in the South for Morocco (i.e. Egypt and
Turkey), shows that only in the machinery and transport equipment
sector was the intensity index for Moroccan exports to sub-
Saharan African countries lower than that of the other 2 countries
(Table 7).
165 of the 215 industries17 presented over the period (1993-
95 and 2011-13), have a trade intensity index greater than 1
and which has increased in the case of 104 of them. These
104 industries represented 58% of Moroccan exports to sub-
Saharan Africa in 2013 while in 1993, they only represented
42.8%. These same industries represented 6.8% of Moroccan
exports to Egypt, 10.1% to Turkey and 34.4% of Morocco’s total
exports to the rest of the world. It was also observed that, as a
result, in those sectors where Moroccan exports to sub-Saharan
Africa are fairly well placed in relation to the rest of the world, their
shares to Turkey and Egypt fluctuated widely and followed a
downward trend, while their share to the rest to the entire world
rose even though far less significantly than for the share of
Moroccan exports to sub-Saharan Africa. This is clearly shown in
Figure 15.
0.000
2.000
6.000
4.000
8.000
10.000
12.000
14.000
16.000
18.000
20.000
1993 1994 1995 1996 1997 1998 1999 2000 2001 2002 2003 2004 2005 2006 2007 2008 2009 2010 2011 2012 2013
Food and Animal ProductsFuelChemical Products
Manufactured Products
Machines, Transport Equipment
Figure 14: Trade intensity of Moroccan exports to sub-Saharan Africafor the 5 main sectors
17 (3-digit, SITC Rev3).

38 A f r i c a n D e v e l o p m e n t B a n k
Analysis of Morocco’s Trade Policy : Impact of Morocco’s Tariff Policyon its Position as a Hub for the Rest of Africa
Egypt sub-Saharan Africa Turkey
Sector 1993 2013 1993 2013 1993 2013
Food and live animals 0.04 0.33 2.07 3.11 0.00 1.13
Commodities excluding gasoline 0.20 0.11 0.91 2.18 0.79 1.76
Mineral fuels and lubricants 0.02 0.00 0.00 7.24 0.00 0.00
Chemical products 0.01 0.16 0.85 2.80 5.92 0.87
Manufactured products 0.01 1.30 1.65 5.48 0.68 0.97
Machinery and transport equipment 0.71 10.20 14.55 1.36 0.00 3.75
* The calculations were made by aggregating flows of (SITC Rev3) 3-digit exports.
Source: UN Comtrade Database, via WITS. Calculations made using TradeSift software.
Table 7: Comparison of Moroccan export intensity indices vis-a-vis sub-SaharanAfrica and those of Egypt and Turkey in 1993 and 2013*
0.00%
10.00%
20.00%
30.00%
40.00%
50.00%
60.00%
70.00%
1993
1994
1995
1996
1997
1998
1999
2000
2001
2002
2003
2004
2005
2006
2007
2008
2009
2010
2011
2012
2013
Egypt Sub-Saharan AfricaTurkey World
Figure 15: Shares of Moroccan exports by country for products whose intensity indiceshave risen vis-a-vis sub-Saharan Africa

39A f r i c a n D e v e l o p m e n t B a n k
Analysis of Morocco’s Trade Policy : Impact of Morocco’s Tariff Policyon its Position as a Hub for the Rest of Africa
The 10 products whose Moroccan export intensity
index vis-a-vis sub-Saharan Africa had risen most steeply
alone represent 47% of Moroccan exports to the sub-
Saharan market (Table 8). This reveals a fairly high
concentration of these exports on a relatively limited number of
products.
V.3. MOROCCO’S IMPORTANCE TO AFRICA
In order to have an overall idea of Morocco’s importance to
Africa, it is necessary to analyse the role played by products from
sub-Saharan Africa in Moroccan imports. Trade with sub-Saharan
African countries will then be considered in order to assess the size of
exports to the Moroccan market and the position of imports from Morocco.
Indeed, even though the share of sub-Saharan Africa in
Moroccan imports is low (1% in 2013) and has deteriorated over
the past 20 years (the highest share was 5% in 1997), a low market
share could conceal a strong positioning of Moroccan products in
sub-Saharan Africa compared to the world average (Figure 15).
On the other hand, in the case of Moroccan imports, it was
observed that the low share from sub-Saharan Africa is
concomitant with increasing difficulties experienced by
sub-Saharan products in entering the Moroccan market
compared to all other world partners. The Moroccan import
intensity index vis-a-vis sub-Saharan has been less than 1 since
2006 and has deteriorated steadily since 1997, when it reached
3.5 (Figure 16). It was also noted that, at the same time, the
intensity indices for Moroccan imports vis-a-vis Egypt and Turkey
have trended steadily upwards, in particular from 1999 in the case
of Egypt (the index rose from 1.2 in 1993 to 6.5 in 2013) and from
2001 in the case of Turkey (the index rose from 1 in 1993 to about
4.2 in 2013).
Product Product Names Trade Intensity Index Share
334 Petroleum Products 4.48 15.14%
562 Fertilizer 1.54 9.79%
046 Semolina and Flour 5.25 5.93%
773 Equipment for Distribution of Electricity 1.63 5.01%
642 Paper and paper board, pre-cut 22.29 3.80%
034 Fish, fresh or frozen 3.90 3.01%
554 Soap and cleaners 16.89 1.36%
421 Vegetable oils and fats 10.27 1.17%
542 Medicaments 5.71 0.94%
691 Metallic structures 13.91 0.93%
Total 47.09%
Table 8: Shares of Moroccan exports to sub-Saharan Africa for the 10 products whosetrade intensity indices have risen most steeply
Source: UN Comtrade Database, via WITS. Calculations made using TradeSift software.

The share of Moroccan imports in all sub-Saharan African
countries and the share of their exports to the Moroccan
market are low. Sub-Saharan products exported to Morocco
barely represented 0.05% of total exports and that share has fallen
since 1998 when it stood at about 0.36% (Figure 17). While imports
from Morocco have risen over the past 20 years, in 2013, they only
represented 0.26% of sub-Saharan Africa’s imports (compared to
0.07% in 1993). A similar observation was made when sub-
Saharan Africa was broken down by country. For all countries,
the share of Moroccan products in their imports is very low. It
sometimes exceeded only 1% in the case of Cote d’Ivoire, Senegal
and Ghana.
The very low share of sub-Saharan exports to Morocco could
be explained by the small size of its market, which is not the
case. In order to control this size effect, the trade intensity index is
once again calculated and more specifically, the intensity index of
sub-Saharan exports vis-a-vis Morocco and of their main export
markets, which are the sub-Saharan African countries themselves
(to the tune of 24.5% of all exports), China (8.16% of exports) and
the United States (6.3%). This export intensity index has tended to
decline or, at best, remains almost stable not only vis-a-vis Morocco
but also vis-a-vis China and the USA (Figure 18). For these 3
countries, sub-Saharan export intensity indices were less than 1 in
2013. On the other hand, a very sharp increase in the sub-Saharan
trade intensity index was observed, up from a little over 7 in 1993
to over 14.5 in 2013.
At sector level, the classification of the sub-Saharan products
most frequently exported to Morocco (Table 11) ranks the
following products highest : coal (15.8% of exports), coffee
(13.6%), animal feeds (11.2%) and spices (6.2%). The 31
sectors listed in Table 9, in descending order, according to their
intensity index in 2013, shows first that there is no link between
their share in the exports and the level of the index. The main sector
for African exports to Morocco (coal, Sector 321 in the SITC Rev3
classification) which represented a 15.8% share in 2013 has an
intensity index of only 1.11, meaning that it was exported more to
other countries than to Morocco. It was also noted that 18 products
exported in 2013 were not exported in 93, which shows that the
composition of African exports to Morocco altered considerably
during that period.
40 A f r i c a n D e v e l o p m e n t B a n k
Analysis of Morocco’s Trade Policy : Impact of Morocco’s Tariff Policyon its Position as a Hub for the Rest of Africa
1993
1994
1995
1996
1997
1998
1999
2000
2001
2002
2003
2004
2005
2006
2007
2008
2009
2010
2011
2012
2013
0.000
1.000
2.000
3.000
4.000
5.000
6.000
7.000
8.000
9.000Egypt EU27
Sub-Saharan Africa
TurkeyUSA
Figure 16: Trend of the intensity index for Moroccan products vis-à-vis sub-Saharan Africa, Egypt and Turkey
Source: UN Comtrade Database, via WITS. Calculations made using TradeSift software.

41A f r i c a n D e v e l o p m e n t B a n k
Analysis of Morocco’s Trade Policy : Impact of Morocco’s Tariff Policyon its Position as a Hub for the Rest of Africa
1993
1994
1995
1996
1997
1998
1999
2000
2001
2002
2003
2004
2005
2006
2007
2008
2009
2010
2011
2012
2013
2014
0.000
2.000
4.000
6.000
8.000
10.000
12.000
14.000
16.000
China Morocco Sub-Saharan Africa USA
Figure 18: The trend of the sub-Saharan Export Intensity Index vis-a-vis Moroccoand its main export markets
Source: UN Comtrade Database, via WITS. Calculations made using TradeSift software.
1993
1994
1995
1996
1997
1998
1999
2000
2001
2002
2003
2004
2005
2006
2007
2008
2009
2010
2011
2012
2013
0.00%
0.05%
0.10%
0.15%
0.20%
0.25%
0.30%
0.35%
0.40%
Imports
Exports
Figure 17: Morocco’s share in sub-Saharan Africa’s exports and imports
Source: UN Comtrade Database, via WITS. Calculations made using TradeSift software.

42 A f r i c a n D e v e l o p m e n t B a n k
Analysis of Morocco’s Trade Policy : Impact of Morocco’s Tariff Policyon its Position as a Hub for the Rest of Africa
Code Name 1993 2013
Exports ExportsShare
TII Exports ExportsShare
ExportsRank
TII
272 Fertilizer 1,091.93 0.75 28 29.89
265 Vegetable textile fibres 135.84 0.61 2.72 3,261.04 2.25 12 17.48
046 Semolina and Flour 1,234.80 0.85 23 17.03
422 Vegetable Fats and Oils 3,658.62 2.52 11 7.16
037 Fish, prepared or preserved 0.00 0.00 0.00 2,138.37 1.47 15 6.59
075 Spices 151.85 0.68 0.53 8,937.91 6.16 4 5.76
071 Coffee 16.99 0.08 0.04 19,684.21 13.57 2 4.49
081 Animal feedstuffs 257.29 1.15 4.47 16,237.19 11.19 3 4.46
288 Non-ferrous waste, scrap 85.76 0.06 69 4.15
748 Transmission shafts 3.58 0.02 0.14 926.39 0.64 29 3.25
764 Telecommunications equipment 19.72 0.09 0.21 2,300.95 1.59 14 3.21
575 Other plastic, primary form 42.17 0.19 0.60 5,912.42 4.07 6 3.18
679 Tubes, pipes. etc., iron and steel 0.00 0.00 0.00 2,538.25 1.75 13 3.16
525 Radio-active materials 18.75 0.01 95 3.15
621 Materials of rubber 324.33 0.22 45 2.40
571 Polymers of ethylene 1,158.16 0.80 25 2.32
532 Synthetic tanning materials 91.79 0.41 0.40 1,213.00 0.84 24 2.22
598 Chemical products 0.00 0.00 0.00 1,832.76 1.26 16 2.13
034 Fish, fresh or frozen 0.00 0.00 0.00 1,495.55 1.03 18 2.08
874 Measure, control instruments 1,301.50 0.90 22 1.99
634 Veneers and plywood 0.00 0.00 0.00 1,705.45 1.18 17 1.79
737 Metalworking machinery 212.85 0.15 49 1.77
264 Jute and other textile bast fibres 1,096.18 0.76 27 1.63
658 Textile articles 0.00 0.00 0.00 684.42 0.47 35 1.61
269 Worn clothing, textile articles 339.00 0.23 43 1.45
522 Inorganic chemical products 151.13 0.67 0.07 6,764.34 4.66 5 1.42
515 Organic, inorganic compounds 53.58 0.04 76 1.16
321 Coal, not agglomerated 497.27 2.22 0.23 22,908.76 15.79 1 1.11
716 Rotating electrical plant 637.83 0.44 37 1.10
744 Mechanical handling equipment 1,308.62 0.90 21 1.05
058 Fruit preserved, prepared 15.14 0.07 0.10 290.12 0.20 47 1.04
Source: UN Comtrade Database, via WITS. Calculations made using TradeSift software.
Table 9: Intensity Index of sub-Saharan exports vis-a-vis Morocco for the 31 main sectors

VI. IDENTIFICATION OF THE ROLE OF MOROCCO’S TARIFFPOLICY IN ITS POSITION AS A HUB FOR AFRICA
VI.1. EMPIRICAL METHODOLOGY
This empirical section has a dual objective. First, it is
necessary to determine whether Morocco’s trade policy
has had an impact on its position as a hub vis-a-vis African
countries and, second, to analyse whether a reduction in
customs duties between Morocco and the African countries
could provide an opportunity to intensify their trade flows. It is
worth recalling that Morocco’s tariff policy has consisted in
significantly reducing its tariffs, on the one hand, by lowering its
MFN duties and on the other, by ratifying free-trade agreements
which has resulted in the establishment of preferential tariffs. The
most significant agreements over the period under considerations
are the Association Agreement with the EU which entered into force
in 200018, the Free-Trade Agreement with the USA established
in 2006 and the bilateral and multilateral agreements with the
Mediterranean countries (Algeria, Egypt, Israel, Jordan, Lebanon,
Tunisia and Turkey), which resulted in a more recent reduction in
tariffs. In the econometric analysis, Morocco’s tariff policy will be
one of the explanatory variables of interest. It may be taken into
consideration either by the customs duties applied by Morocco
according to the country of origin of imports, or by the date of entry
into force of the agreements (official or effective), or by the trend of
European, American and Mediterranean Customs duties.
The most appropriate methodology for resolving this type of
problem is to use a gravity model which has the advantage of
being able to take into account the economic importance of
countries, their distance, their cultural, linguistic proximity or
even the existence of a common border. This methodology is
presented in Annex.
VI.2. RESULTS
First of all, the foregoing analysis showed that according to its
economic definition, Morocco was not in a hub situation vis-à-vis
other African countries and that the situation concerning customs
duties both in Morocco and in the sub-Saharan countries was
not, as it stood, favourable to such a positioning. Everything,
therefore, suggests that Morocco’s tariff policy did not result in any
intensification of trade flows with the African countries. That is what
the econometric study must confirm or refute here.
The variable to be explained is alternatively Moroccan imports
by origin and by sector at 3-digits (the first 2 results tables)
and Moroccan exports by destination and by 3-digit sector.
For each of these variables, the first Table only concerns variations
in existing flows (i.e. the intensive margin), since zero flows are
treated as missing and the second table not only takes into
consideration the variation in existing flows but also the creation or
end of flows by sector and by partners (i.e. the intensive and
extensive margin), the missing flows having been replaced by
zeros19.
As might be expected, the reduction of customs duties applied
by Morocco led to an increase in all Moroccan imports (Tables
10 and 11). The coefficient associated with Moroccan customs
duties (denoted as Morocco Tariffs) is, in fact, still negative and very
significant. The establishment of bilateral free-trade agreements
(denoted as FTA-Bilateral) also had a positive impact on imports.
As regards multilateral free-trade agreements (denoted FTA
Bilateral), and since their implications in the case of Morocco are
lower than those of bilateral agreements, there is also a positive
43A f r i c a n D e v e l o p m e n t B a n k
Analysis of Morocco’s Trade Policy : Impact of Morocco’s Tariff Policyon its Position as a Hub for the Rest of Africa
18 It was shown that according to the TRAINs database, the effective date of establishment of preferential tariffs on imports from the EU was 2005.19 It should be noted that from an economic standpoint, it is more rigorous and accurate to take into account non-existing flows by replacing them by zeros insofar as itmakes it possible to integrate in regressions, input and output data, i.e. the case where for a given partner and sector we go from 0 in t, to the presence of flows in t+1,or from the existence of a flow in t and its disappearance in t+1.

44 A f r i c a n D e v e l o p m e n t B a n k
Analysis of Morocco’s Trade Policy : Impact of Morocco’s Tariff Policyon its Position as a Hub for the Rest of Africa
impact on imports but the significance of the coefficients almost
completely disappears if both the intensive and extensive margins
are considered (Table 11). Concerning gravity variables, the only
ones which can remain when the fixed effects are integrated in the
regression are population and GDP per capita (the other gravity
variables are then contained in the fixed effects). As may be
expected, the coefficients associated with these 2 variables are
always positive, and very significant for GDP per capita. On the
other hand, the coefficient associated with populations is significant
only in PPML regressions for columns (4) and (5).
However, goods from sub-Saharan Africa are twice as sensitive
to variations in customs duties as goods from all the other
countries. In columns (2) of Tables 10 and 11, the aim is to assess
more accurately the impact of a reduction in customs duties applied
by Morocco to imports from sub-Saharan Africa, through the inter-
action between tariffs and 2 distinct groups of countries (Africans
and non-African). It was noted that the coefficient associated with
the group of sub-Saharan African countries was at least double that
associated with all the other countries: when customs duties fall by
1%, imports of sub-Saharan countries increase by almost 0.4%
while imports from the other countries rise by about 0.2% at best.
This means that if Moroccan tariffs fall, for example, by 50%, the
increase in imports related to this reduction in customs duties would
be 20% for imports from the sub-Saharan African countries and only
10% for imports from all the other countries.
To the extent that the average level of customs duties applied
by Morocco to sub-Saharan products is 12%, Moroccan decision-
makers may also use the reduction in tariffs to intensify imports
from Africa.
However, a reduction in tariffs on European, American and
Mediterranean products has either reduced existing Moroccan
imports from sub-Saharan countries (see Table 10, where only
the intensive margin is taken into account ) or has no impact
on sub-Saharan imports (see Table 11, where both the intensive
and extensive margins are taken into account). In columns (3),
(4) and (5), the impact of reduction in customs duties applied to
imports from the EU (column (3)), the United States (column 4) and
the Mediterranean countries (column (5)), on Moroccan imports from
sub-Saharan Africa is tested. As a result, while the 78%20 reduction
in customs duties applied by Morocco to sub-Saharan imports
has played a positive role in terms of imports from these African
countries, on the other hand, the even steeper reduction in customs
duties applied by Morocco to imports from the EU, USA and
Mediterranean countries (respectively 98%, 94% and 96%) have
had at best no impact on these same imports from sub-Saharan
Africa. It is even likely that following the reduction of tariffs, diversion
effects may have occurred to the detriment of sub-Saharan
countries.
As shown in the previous section, the reduction in customs
duties applied to exports from Morocco has played a positive
role in exports. The sign of the coefficient associated with customs
duties applied by Morocco’s partners is, in fact, as expected and is
very significant in the different configurations, which means that a
reduction in customs duties applied by its partners has increased
Moroccan exports21. The establishment of bilateral free-trade
agreements has also favoured Moroccan exports while multilateral
agreements have had no impact, for the same reasons as those
raised above. Finally, it is the size of the population of the economies
rather than their wealth, as measured by GDP per capita, which has
impacted positively on Moroccan exports. Since the vast majority
of Moroccan exports were intended for a few rich EU countries
and that the rechannelling of exports towards major new markets
had been observed such as, for example, Brazil, the result is not
very surprising.
As in the case of imports, in column (2) of Tables A12 and A13,
the differentiated impact on Morocco’s exports of a reduction
in Moroccan customs duties applied, on the one hand, to sub-
Saharan imports and, on the other, to all other countries was
tested. In the 2 Tables, the coefficient associated with tariffs applied
to sub-Saharan imports is negative which means that the reduction
would have contributed to an increase in Moroccan exports but that
coefficient is only significant in cases where the intensive margin is
taken into account (Table 12).
20 The reductions in customs duties applied by Morocco to the different groups of partners are calculated in Table 2 of volume 1 of this study.21 In the previous section, the coefficient associated with customs duties was negative but slightly significant or sometimes insignificant. However, the results obtained inthe separate parts cannot be compared insofar as the regressions differ. In the previous part, customs duties are those for all partners for each 3-digit industry whereas,in this part, in view of its set objective, the variables have been broken down by partners. These regressions, therefore, contain the customs duties applied by each ofMorocco’s partners by 3-digit industry. Consequently, while they remain consistent, it is normal to obtain slightly different results.

On the other hand, the results which appear in column (5) of
Tables A12 and A13 show that the reduction in customs duties
applied by Morocco to Mediterranean imports would have
contributed to a reduction in Moroccan exports to Africa as
well as to all the other destinations apart from the Mediter-
ranean countries. In columns (3), (4) and (5), the aim is to isolate
the impact of the reduction in customs duties applied by Morocco
to European, American and Mediterranean imports, on Moroccan
exports to sub-Saharan African countries. For columns (3) and (4),
Table A12 (where only existing exports are taken into account)
shows that the tariff reduction applied to Moroccan exports to
Africa would have increased Morocco’s exports to Africa. However,
this result is not confirmed in Table A13 (where not only existing
exports are taken into account but also flow inputs and outputs).
It is, thus, possible that to address the constraints imposed by
the rules of origin and, thereby, benefit from preferential tariffs
or exemptions from customs duties, the Mediterranean partner
countries purchased more products from Morocco. Morocco’s
tariff policy vis-a-vis the Mediterranean countries has probably
contributed to the rechannelling of exports to these same countries.
The impact of customs duties applied by sub-Saharan countries
to Moroccan exports was observed. It was noted that the
coefficient obtained was negative and significant which shows
that a reduction in tariffs applied by sub-Saharan African
countries has had a positive impact on Moroccan exports
(column (6)). The coefficient obtained was between about 0.1
and slightly above 0.2, which means that a 50% reduction in
sub-Saharan tariffs on Moroccan imports would for all countries
increase Moroccan exports by 5% to 10%.
Irrespective of the economic community concerned a reduction
in the customs duties of African countries will always have
a positive impact on Moroccan exports. The sensitivity of
Moroccan exports to customs duties applied by each of Africa’s
4 main regional economic communities, namely the Common
Market for Eastern and Southern Africa (COMESA), the East
African Community (EAC), the Economic Community of Central
African States (ECCAS) and the Economic Community of West
African States (ECOWAS) was analysed (Table 14). Crossing
the customs duties applied by Morocco’s partners to its exports
(denoted Tarifs_Export) with alternatively the 4 groups of
countries (COMESA, EAC, ECCAS and ECOWAS), isolated the
specific impact of the tariffs of each of these economic communities
on Moroccan exports. It was observed that the coefficients
obtained were always negative and significant. The highest
coefficient concerns the East African Community (EAC). Its
absolute value was about 0.8, which means that if the EAC
countries reduce their customs duties, for example, by half,
Moroccan exports could rise by 40%. The EAC is followed the
Economic Community of Central African States (ECCAS), with a
coefficient, in absolute value, of between 0.4 and 0.5 and the
Common Market for Eastern and Southern Africa (COMESA),
with a coefficient of about 0.3. In the case of these 2 groups
of countries, if customs duties are reduced by half, Moroccan
exports would rise by 23% and 15% respectively. Finally, the
lowest coefficient is the one relating to the Economic Community
of West African States (ECOWAS), since it is, in terms of absolute
value, slightly less than 0.1, which means that a 50% drop in
tariffs imposed by this group of countries would increase Moroccan
exports by about 5%.
45A f r i c a n D e v e l o p m e n t B a n k
Analysis of Morocco’s Trade Policy : Impact of Morocco’s Tariff Policyon its Position as a Hub for the Rest of Africa

VII. INTERPRETING THE RESULTS AND DETERMINING THEIR
CONTRIBUTION IN TERMS OF ECONOMIC POLICIES?
A s to whether Morocco’s tariff policy has had an impact
on exports to sub-Saharan Africa, it can be said that: i)
firstly, the reduction in customs duties applied to sub-Saharan
products has not boosted exports to these countries; ii) secondly,
the reduction in tariffs applied to products from the EU and United
States does not appear to have had any impact on these exports
intended for the African market; and iii) lastly, the reduction in
customs duties applied to products from the Mediterranean has,
on the other hand, had a negative impact on Moroccan exports to
sub-Saharan African countries.
Indeed, all the bilateral and multilateral agreements signed by
Morocco do not position the country as a regional hub (in the
economic sense of the term) vis-à-vis sub-Saharan African
countries. Insofar as the United States has not signed any free
trade agreement with Africa’s sub-Saharan countries, Morocco
could assume a hub position if it established one or more multi-
lateral or multilateral free-trade agreements with the sub-Saharan
countries. Moreover, if the Pan-Arab Free Trade Area (PAFTA) was
effective, it would provide Morocco with an opportunity to position
itself as a hub involving a larger number of countries, i.e. to have
as spokes on the one hand, the USA and all the PAFTA countries
and, on the other, the EU, USA and all the PAFTA countries that do
not have free-trade agreements with the EU.
The econometric results thus confirm what the descriptive analysis
suggests, i.e. that the Tariff policy pursued by Morocco has been
unable to intensify trade flows between Morocco and sub-Saharan
Africa.
It has, on the other hand, been shown that goods from sub-
Saharan Africa were more sensitive to Morocco’s tariff policy
than goods from the rest of the world. If Morocco halves its
tariffs, sub-Saharan imports could rise by 20% (compared to 10%
for imports from the rest of the world). Consequently, Moroccan
decision-makers may, if they so wish, use the tariff reduction to
intensify imports from Africa.
Similarly, it was also shown that Moroccan exports to sub-
Saharan Africa could be boosted by the reduction in customs
duties applied by the African countries. A 50% reduction in tariffs
applied by all sub-Saharan countries would result in a 5% to 10%
increase in Moroccan exports.
Morocco has signed bilateral and multilateral agreements with
many partners but virtually no effective ones with the sub-
Saharan African countries. The reduction in customs duties
applied to these countries has, therefore, followed the down-
ward trend of MNF tariffs under the WTO. Even though this
reduction was significant (it will be recalled that these customs
duties applied by Morocco to imports from sub-Saharan countries
fell, on average, from 50% in 93 to about 12% in 2012), the average
rate of tariffs at present remains at a higher level than the average
customs duties applied to imports from countries with which
|Morocco has signed free trade agreements (namely, 1% for
European imports, 4% for European imports and 3% for the
Mediterranean countries and the average tariff rate applied to all
imports was 5%).
For their part, sub-Saharan countries maintained their customs
duties virtually unchanged between 2001 (as a reminder, prior
to 2001, the tariffs were not updated in the case of some countries)
and 2012 and, on average, the tariffs applied to imports from
Morocco were about 15%, i.e. overall 3 points above the
average applied to European or American imports.
From the standpoint of economic policy, the most interesting result
that the empirical tests highlighted is that a reduction in customs
duties applied by Morocco to imports from sub-Saharan Africa will
have a positive impact on Moroccan exports and, reciprocally, a
46 A f r i c a n D e v e l o p m e n t B a n k
Analysis of Morocco’s Trade Policy : Impact of Morocco’s Tariff Policyon its Position as a Hub for the Rest of Africa

reduction in customs duties applied by the countries of sub-
Saharan Africa will have a positive impact on Moroccan exports.
In terms of recommendations, this report, therefore, draws
attention to the fact that:
• A reduction in customs duties remains a trade policy tool that
could effectively boost bilateral trade flows with a positive
impact for both parties; and
• In order to optimize the recent initiatives taken to stimulate and
bolster trade between Morocco and its African partners, it will
rapidly become essential to prioritize the negotiation of tariff
policies applied by both sides.
47A f r i c a n D e v e l o p m e n t B a n k
Analysis of Morocco’s Trade Policy : Impact of Morocco’s Tariff Policyon its Position as a Hub for the Rest of Africa

ANNEXES

49A f r i c a n D e v e l o p m e n t B a n k
Analysis of Morocco’s Trade Policy : Impact of Morocco’s Tariff Policyon its Competitiveness
In Section III.3.2, it was shown that the average customs duties applied by Morocco to imports from sub-Saharan
Africa was, in 2012, higher than that of customs duties
applied by Morocco to imports from sub-Saharan Africa.
Tables A3 and A4 show that this difference of about 9 percentage
points is due both to the fact that the products imported by
Morocco from Mediterranean countries are very different from
products imported from sub-Saharan Africa and the fact that for
identical products, customs duties applied by Morocco to imports
from sub-Saharan African countries are higher than those applied
to products from Mediterranean countries. Indeed, Table A3
considers the 100 main products imported by Egypt, Tunisia,
Turkey and sub-Saharan Africa countries in 2012 (which represent
between 88% and 98% of total imports depending on the country)
and indicated the number of 3-digit products imported by a couple
of partners. It shows that all the sub-Saharan countries imported
15 similar products with Egypt, 18 with Tunisia and 11 with Turkey
which shows that the structure of goods imported by Morocco is
different from that of goods from the Mediterranean countries.
Moreover, in the case of the products imported by Morocco both
from a Mediterranean country and at least one sub-Saharan
African country, average customs duties applied by Morocco were
compared (Tables A4a, b and c). It was noted that, in fact, for a
given product, the average customs duties applied to imports
from sub-Saharan was generally higher than the duty applied to
a Mediterranean country.
ANNEX 1. THE DIFFERENCE IN CUSTOMS DUTIES BETWEEN PRODUCTS FROM MEDITER-RANEAN COUNTRIES AND PRODUCTS FROM SUB-SAHARAN AFRICA
Share represented by the 100 main productsimported by Morocco
Number of identical products (at 3-digits) imported by Morocco and by at least 2 partners
Egypt Sub-SaharanAfrica
Tunisia Turkey
Egypt 93% 15 20 22
Sub-Saharan Africa 98% 15 18 11
Tunisia 96% 20 18 23
Turkey 88% 22 11 23
Source: UN Comtrade Database, via WITS. Calculations made using TradeSift software.
Table A3: Number of Similar Products imported by Morocco and by at least 2 Partners in 2012

50 A f r i c a n D e v e l o p m e n t B a n k
Analysis of Morocco’s Trade Policy : Impact of Morocco’s Tariff Policyon its Position as a Hub for the Rest of Africa
Product Names Product Code(SITCRev3)
Egypt Sub-SaharanAfrica
Veneers, plywood, plywood sheets 634 0.06 8.5
Spices 075 0 5.36
Polymers of ethylene 571 0 7.5
Petroleum oils, crude 333 0 2.5
Pigments, paints, varnishes 533 0 2.5
Other plastic, primary form 575 0.11 2.5
Miscellaneous chemical products 598 0.07 2.5
Manufactures of base metal 699 0 14.7
Heating and cooling equipment 741 0 12.3
Fruit, fresh or dried 057 0 37.4
Fruit, vegetable juices 059 3 34.4
Edible products and preparation 098 3.09 41.5
Articles of plastics 893 0.01 11.1
Animal or vegetable oils or fats, processed 431 3.38 20.3
Animal feedstuffs 081 0 5
Table A4: Comparison of Customs Duties applied by Morocco to Imports from MediterraneanCountries and sub-Saharan African countries
a) For the 15 products imported both from Egypt and Sub-Saharan Countries
Source: UN Comtrade Database, via WITS. Calculations made using TradeSift software.
Source: UN Comtrade Database, via WITS. Calculations made using TradeSift software.
Product Names Product Code(SITCRev3)
Turkey Sub-SaharanAfrica
Perfumery, cosmetics, etc. 553 2.5 2.5
Passenger motor vehicles 781 5.64 12
Other textile apparel 845 7.26 20
Other machinery, equipment for specialized industries 728 0.32 4.4
Manufacture of base metals 699 5.69 14.7
Inorganic chemical products 522 1.09 2.5
Heating and cooling equipment 741 1.2 5.5
Motor vehicles for the transport of goods 782 4.83 9
Equipment for distribution of electricity 773 3.25 3.4
Electrical apparatus for electrical circuits 772 4.7 15.7
Plastic articles 893 4.61 11.1
b) For the 11 products that are imported both from Turkey and the Sub-Saharan African Countries

51A f r i c a n D e v e l o p m e n t B a n k
Analysis of Morocco’s Trade Policy : Impact of Morocco’s Tariff Policyon its Position as a Hub for the Rest of Africa
Product Names Product Code(SITCRev3)
Tunisia Sub-SaharanAfrica
Transmission shafts 748 0 10.5
Taps, cocks, valves, etc. 747 0 12.3
Spices 075 0 5.4
Rotating electrical plant 716 0 1.9
Pigments, paints, varnishes 533 0 2.5
Perfumery, cosmetics, etc. 553 0 2.5
Other textile apparel 845 0.83 20
Metal salts and peroxysalts of inorganic acids, etc. 523 0 2.5
Medicaments 542 0 3
Measure, control instruments 874 0 2.3
Manufacture of base metals, etc. 699 0.14 14.7
Heating and cooling equipment 741 0 5.5
Fruit, fresh or dried 057 0 37.4
Equipment for distribution of electricity 773 0 13.4
Electrical apparatus for electrical circuits 772 0.57 15.7
Edible products and preparations 98 1.96 41.5
Plastic articles 893 0.01 11.1
Animal or vegetable oils and fats, processed 431 0 20.3
c) For the 18 products imported both from Tunisia and Sub-Saharan African Countries
Source: UN Comtrade Database, via WITS. Calculations made using TradeSift software.

52 A f r i c a n D e v e l o p m e n t B a n k
Analysis of Morocco’s Trade Policy : Impact of Morocco’s Tariff Policyon its Position as a Hub for the Rest of Africa
ANNEX 2. EMPIRICAL MODEL – MOROCCO, A HUB FOR AFRICA
This gravity model was tested using panel data over the 1993-2013 period. The general form of the equation used is as follows:
With i, the partner country, j, the 3-digit industry and t, the year.
denotes the trade flow between Morocco and each of its partners i by industry j in year t. These trade flows are either Moroccan
exports or imports.
corresponds to all the gravity variables, namely the population, GDP per capita, distance, existence of a common language,
common borders, etc.
are customs duties applied by Morocco to imports from partner i, by industry j (at 3-digits) in year t-1, with tariffs lagging by
one period. is a vector of dummy variables which takes into account the establishment of a free-trade agreement between
Morocco and one of its partners. To determine the effective date of application of these agreements, either the official or effective date of
entry into force may be taken, i.e. the first year in which preferential tariffs appear. Where trade flows are represented by Moroccan exports,
to these variables will be added customs duties applied by each partner i to their imports from Morocco, in industry j (at 3-digits)
with a one-period lag, denoted . Finally, fixed effects are integrated, (i) by destination , which takes into account all the
characteristics of the partner countries which do not change over time and which are difficult to observe or measure, and (ii) by industry , thus
taking into account all the invariable sector characteristics over time. By introducing the year-fixed effect , cyclical effects affecting all
industries in an identical manner are taken into account22.
As in the previous part, trade flows are obtained from the Comtrade (UNStats) database and customs duties from TRAINS both of which
are accessible by the WITS (World Bank) interface.
This type of estimation raises two methodological issues. The first is the risk of endogeneity between trade flows and customs duties, the
risk of reverse causality (exports or imports could explain the level and variation of tariffs). Given the context in which Morocco’s tariff
policy has been implemented (drop in MFN tariffs under WTO negotiations, establishment of preferential customs duties mainly under
free-trade agreements with the EU, USA and some Mediterranean countries spurred by the PAFTA), it is unlikely that the Moroccan industrial
lobbies could have greatly influenced the pace of tariff dismantling in the sectors. The empirical analysis does however address this problem
of endogeneity as Fernandes did (2007), on the one hand, by delaying customs duties by one period and, on the other, by controlling,
(2) FMaroc,i, j,t = 0 + 1GMaroc,i + 2TarifMaroci, j ,t 1 + 3 ALEMaroc,i + i + j + t + Maroc,i,i,t
22 In countries where the reduction of customs duties was uniform irrespective of the sector as, for example in Chile, the tariff variable is equivalent to a year-fixed effect(see Pavcnik’s paper, 2002). In the case of Morocco, customs duties fell at very different rates depending on the sector (as shown in Table 8 in the previous section) andon the origin of imports. It should also be noted that the reduction of customs duties applied by partner countries to Moroccan exports was also different depending onthe sector (see Table 9 Part II) and on the partner. This dual level of differentiation of annual customs duties (by industry and by export or import partner) is a far cry fromthe case where tariffs could be assimilated to a year-fixed effect.
FMaroc,i, j,tFMaroc,i, j,tFMaroc,i, j,t
TarifMaroci, j,t 1TarifMaroci, j,t 1TarifMaroci, j,t 1ALEMaroc,iALEMaroc,iALEMaroc,i
GMaroc,iGMaroc,iGMaroc,i
TarifExportsi,Maroc, j ,t 1TarifExportsi,Maroc, j ,t 1TarifExportsi,Maroc, j ,t 1 i
j
t

53A f r i c a n D e v e l o p m e n t B a n k
Analysis of Morocco’s Trade Policy : Impact of Morocco’s Tariff Policyon its Position as a Hub for the Rest of Africa
through industry fixed effects, unobservable characteristics such as the power of sector-specific lobbies in order to mitigate the possible
risk of having industries capable of influencing economic policy decisions, in particular, those concerning Morocco’s trade policy23.
The second methodological problem specific to this type of estimation is linked to the way in which these cases are considered where for
a given partner or industry (at 3-digit) export or import flows do not exist throughout the period. There are two options, either to leave
these missing cases by carrying out estimations using the OLC (ordinary least squares) method24 using unbalanced panel data, which
boils down to taking into account only variations in existing flows, that is, what is called the intensive margin or taking the 0s into account
by a carrying out PPML (Poisson pseudo-maximum likelihood)25 regressions which makes it possible to test the impacts of tariff policy
both on the intensive margin (variation in existing flows) and extensive margins (creation or disappearance of flows). In this study, this
methodological problem was addressed by making estimations using the two methods alternatively (i.e. without taking into account the
0s and by taking them into account).
23 It may also be assumed that the problem of endogeneity also arises with the free-trade agreements. However, few arguments support the idea that the industriallobbies are responsible for the establishment of most of these agreements especially as one of the most important of them, the Association Agreement with the EU wasadopted under the Barcelona Round. Its content is the outcome of negotiations with the EU. Similarly, it is difficult to imagine that the Agreement with the USA was theresult of pressure by a few Moroccan industrial sectors. The risk of having a problem of endogeneity between the establishment of free-trade agreements and tradeflows, according to the estimates of this analysis, is very low and was not even considered.24 The OLS method is the standard way of carrying out regressions. It consists in estimating the log-linear version of an equation (i.e. to used logged variables). Thuswhere there are zero flows, the use of this method is tantamount to eliminating them or considering them as missing.25 This method of estimation proposed by Sentos and Tenreyro (2006), treats zero flows by using the Poisson pseudo-maximum likelihood estimator. This method improvesthe reliability of the results obtained.

54 A f r i c a n D e v e l o p m e n t B a n k
Analysis of Morocco’s Trade Policy : Impact of Morocco’s Tariff Policyon its Position as a Hub for the Rest of Africa
ANNEX 3. ECONOMETRIC RESULTS
Dependent Variable Imports
(1) (2) (3) (4) (5)
Morocco Tariffs-0.2037***(0.0145)
-0.2013***(0.0144)
-0.2351***(0.0155)
-0.1960***(0.0155)
Bilateral FTA0.5561***(0.0441)
0.5633***(0.0441)
0.5437***(0.0446)
0.4269***(0.0440)
0.4029***(0.0437)
Multilateral FTA0.2841***(0.0620)
0.2943***(0.0622)
0.2792***(0.0624)
0.1995***(0.0635)
0.1939***(0.0645)
Population0.1302(0.1522)
0.0961(0.1519)
0.1799(0.1514)
0.3078**(0.1527)
0.4621***(0.1546)
GDP per capita0.8957***(0.0803)
0.8916***(0.0803)
0.9004***(0.0814)
1.0138***(0.0815)
0.9635***(0.0831)
Morocco Tariffs * Non-African countries-0.1963***(0.0146)
Morocco Tariffs * African countries-0.3889***(0.0548)
Morocco Tariffs _EU * Non-African countries0.0066(0.0146)
Morocco Tariffs _EU * African countries0.2014**(0.0842)
Morocco Tariffs _USA * Non-African countries0.1878***(0.0160)
Morocco Tariffs _USA * African countries0.1931***(0.0638)
Morocco Tariffs _Med * Non-African countries-0.0248*(0.0142)
Morocco Tariffs _Med * African countries0.1117*(0.0635)
Constant-3.9278(2.7676)
-2.7870(2.7646)
-5.3659*(2.7708)
-8.0091***(2.7879)
-10.3250***(2.8411)
ObservationsR2_within
118,6680.396
118,6680.397
118,6070.396
115,1100.405
111,0860.409
Table A10: Tariff policy and hub position vis-à-vis sub-Saharan African countries: Impact on existing Moroccan imports (intensive margin) from sub-Saharan countries
Source: The estimations include 3-digit industry and destination effects as well as year-dummy variables. The standard deviations in brackets are clustered at the sector-year
level.
* means that the coefficient is significant at 10%, ** at 5% and *** à 1%.

55A f r i c a n D e v e l o p m e n t B a n k
Analysis of Morocco’s Trade Policy : Impact of Morocco’s Tariff Policyon its Position as a Hub for the Rest of Africa
Dependent Variable Imports
(1) (2) (3) (4) (5)
Morocco Tariffs-0.1066***(0.0262)
-0.1256***(0.0248)
-0.0837***(0.0289)
Bilateral FTA0.3260***(0.0792)
0.3305***(0.0795)
0.3188***(0.0818)
0.1657**(0.0829)
Multilateral FTA0.0662(0.1153)
0.0770(0.1147)
0.1371(0.1117)
0.1559(0.1074)
Population0.3226(0.3921)
0.2921(0.3923)
0.3689(0.3643)
0.9867**(0.4128)
GDP per capita1.0022***(0.1623)
0.9954***(0.1626)
0.6106***(0.1547)
1.0721***(0.1722)
Morocco Tariffs * Non-African countries-0.1013***(0.0265)
Morocco Tariffs * African countries-0.4691***(0.0843)
Morocco Tariffs _EU * Non-African countries-0.3067***(0.0575)
Morocco Tariffs _EU * African countries-0.1859(0.1665)
Morocco Tariffs _USA * Non-African countries0.0759***(0.0283)
Morocco Tariffs _USA * African countries0.0666(0.1168)
Morocco Tariffs _Med * Non-African countries0.0257(0.0413)
Morocco Tariffs _Med * African countries0.0344(0.1075)
Constant-6.1738*(3.4370)
-4.7206(3.4427)
-3.6056(3.2304)
-13.8620***(3.5467)
-12.2293***(3.6546)
ObservationsR2_within
178,4100.214
178,4100.214
178,3110.274
172,2460.205
166,3450.215
Table A11: Tariff policy and hub position vis-à-vis sub-Saharan African countries: Impact on the intensive and extensive margins of Moroccan imports from sub-Saharan countries
Source: The estimations include 3-digit industry and destination effects as well as year-dummy variables. The standard deviations in brackets are clustered at the sector-year
level.
* means that the coefficient is significant at 10%, ** at 5% and *** à 1%.

56 A f r i c a n D e v e l o p m e n t B a n k
Analysis of Morocco’s Trade Policy : Impact of Morocco’s Tariff Policyon its Position as a Hub for the Rest of Africa
Dependent Variable Exports
(1) (2) (3) (4) (5) (6)
Morocco Tariffs-0.1678***(0.0560)
-0.0955(0.0584)
-0.0029(0.0627)
-0.2313***(0.0603)
-0.1644***(0.0560)
Export tariffs-0.1504***(0.0159)
-0.1532***(0.0158)
-0.1455***(0.0160)
-0.1527***(0.0163)
-0.1420***(0.0163)
Bilateral FTA0.3840***(0.0644)
0.4122***(0.0650)
0.4427***(0.0657)
0.3985***(0.0685)
0.4254***(0.0679)
0.3739***(0.0644)
Multilateral FTA-0.0822(0.0744)
-0.0436(0.0760)
-0.0568(0.0760)
-0.0886(0.0790)
-0.1381*(0.0793)
-0.0728(0.0746)
Population0.3956(0.2445)
0.1119(0.2525)
0.1303(0.2502)
0.2128(0.2575)
0.0980(0.2578)
0.4072*(0.2440)
GDP per capita-0.1771(0.1558)
-0.1660(0.1557)
-0.2699*(0.1522)
-0.1482(0.1664)
-0.2059(0.1607)
-0.1697(0.1558)
Tariffs_Exports * African countries-0.1271***(0.0176)
Tariffs_Exports * African countries-0.2452***(0.0321)
Morocco_Tariffs * Non-African countries-0.1277**(0.0574)
Morocco_Tariffs * African countries-0.3227***(0.0698)
Morocco_Tariffs _EU * Non-African countries-0.1048***(0.0297)
Morocco_Tariffs _EU * African countries-0.1806***(0.0551)
Morocco_Tariffs _USA * Non-African countries-0.0652***(0.0240)
Morocco_Tariffs _USA * African countries-0.1334***(0.0436)
Morocco_Tariffs _Med * Non-African countries0.1688***(0.0235)
Morocco_Tariffs _Med * African countries0.0660*(0.0342)
Constant-4.1366(4.3378)
0.9993(4.4908)
1.1383(4.4304)
-1.5267(4.5972)
1.0222(4.5551)
-4.0148(4.3283)
ObservationsR-squared
68,6750.416
68,6750.417
68,6750.417
65,9020.409
65,8340.409
68,6750.417
Table A12: Tariff policy and hub position vis-a-vis sub-Saharan African countries:Impact on Existing Moroccan Exports (intensive margin)
Source: The estimations include 3-digit industry and destination effects as well as year-dummy variables. The standard deviations in brackets are clustered at the sector-year
level.
* means that the coefficient is significant at 10%, ** at 5% and *** à 1%.

57A f r i c a n D e v e l o p m e n t B a n k
Analysis of Morocco’s Trade Policy : Impact of Morocco’s Tariff Policyon its Position as a Hub for the Rest of Africa
Dependent Variable Exports
(1) (2) (3) (4) (5) (6)
Morocco Tariffs-0.2446***(0.0778)
-0.0634(0.0838)
-0.2415**(0.1003)
-0.2887***(0.0935)
-0.2478***(0.0778)
Export tariffs-0.2790***(0.0387)
-0.2806***(0.0391)
-0.2185***(0.0399)
-0.3211***(0.0403)
-0.2824***(0.0439)
Bilateral FTA0.5507***(0.1736)
0.5459***(0.1739)
0.7498***(0.1986)
0.2855(0.1748)
0.6135***(0.2052)
0.5524***(0.1738)
Multilateral FTA-0.0329(0.2071)
-0.0358(0.2075)
-0.0634(0.2221)
-0.2424(0.2121)
-0.1012(0.2391)
-0.0363(0.2071)
Population3.2169***(0.6333)
3.3582***(0.6548)
3.3446***(0.6676)
2.8498***(0.7246)
3.7456***(0.7263)
3.2359***(0.6424)
GDP per capita0.4233(0.4490)
0.4138(0.4476)
-0.0763(0.4328)
0.0556(0.5208)
0.3465(0.4848)
0.4187(0.4486)
Tariffs_Exports * African countries-0.2922***(0.0408)
Tariffs_Exports * African countries-0.0960**(0.0478)
Morocco_Tariffs * Non-African countries-0.2490***(0.0776)
Morocco_Tariffs * African countries-0.0729(0.1189)
Morocco_Tariffs _EU * Non-African countries-0.5044***(0.0722)
Morocco_Tariffs _EU * African countries0.0806(0.0996)
Morocco_Tariffs _USA * Non-African countries0.1004***(0.0361)
Morocco_Tariffs _USA * African countries0.0741(0.0860)
Morocco_Tariffs _Med * Non-African countries0.1146***(0.0370)
Morocco_Tariffs _Med * African countries0.3213***(0.0737)
Constant-31.4962***(6.1453)
-32.9384***(6.3610)
-30.3662***(6.2208)
-26.4549***(7.0474)
-35.2401***(7.0219)
-32.2030***(6.2558)
ObservationsR-squared
204,1470.372
204,1470.371
204,1420.399
194,0270.380
188,0500.382
204,1470.371
Table A13: Tariff policy and hub position vis-a-vis sub-Saharan African countries: Impact on intensive and extensive margin of Moroccan exports
Source: The estimations include 3-digit industry and destination effects as well as year-dummy variables. The standard deviations in brackets are clustered at the sector-year
level.
* means that the coefficient is significant at 10%, ** at 5% and *** à 1%.

58 A f r i c a n D e v e l o p m e n t B a n k
Analysis of Morocco’s Trade Policy : Impact of Morocco’s Tariff Policyon its Position as a Hub for the Rest of Africa
Dependent Variable Total Exports
(1) (2) (3) (4)
Morocco Tariffs-0.1628***(0.0560)
-0.1654***(0.0560)
-0.1640***(0.0560)
-0.1643***(0.0560)
Export tariffs
Bilateral FTA0.3762***(0.0644)
0.3861***(0.0643)
0.3772***(0.0643)
0.3772***(0.0645)
Multilateral FTA-0.0699(0.0746)
-0.0679(0.0745)
-0.0698(0.0746)
-0.0761(0.0745)
Population0.4049*(0.2441)
0.3734(0.2441)
0.3958(0.2442)
0.4080*(0.2441)
GDP per capita-0.1668(0.1556)
-0.1539(0.1558)
-0.1660(0.1557)
-0.1659(0.1562)
Export_ Tariffs * EAC-0.8350***(0.1562)
Export_Tariffs * African countries other than EAC-0.2230***(0.0325)
Export_Tariffs * Non-African countries-0.1268***(0.0176)
Export_ Tariffs * ECOWAS-0.0948***(0.0454)
Export_Tariffs * African countries other than ECOWAS-0.4260***(0.0420)
Export_Tariffs * Non-African countries-0.1287***(0.0176)
Export_ Tariffs *ECCAS-0.4640***(0.0843)
Export_Tariffs * African countries other than ECCAS-0.2223***(0.0327)
Export_Tariffs * Non-African countries-0.1283***(0.0176)
Export_ Tariffs *COMESA-0.2767***(0.0477)
Export_Tariffs * African countries other than COMESA-0.2404***(0.0324)
Export_Tariffs * Non-African countries-0.1237***(0.0182)
Constant-4.0839(4.3287)
-2.8782(4.3347)
-3.9450(4.3271)
-3.9314(4.3182)
ObservationsR-squared
68,6750.417
68,6750.417
68,6750.417
68,6750.417
Table A14: Impact of customs duties applied by the Main African Economic Communitieson existing Moroccan exports (intensive margin)**
Source: The estimations include 3-digit industry and destination effects as well as year-dummy variables. The standard deviations in brackets are clustered at the sector-year
level.
* means that the coefficient is significant at 10%, ** at 5% and *** à 1%.


60A f r i c a n D e v e l o p m e n t B a n k
Analysis of Morocco’s Trade Policy : Impact of Morocco’s Tariff Policyon its Position as a Hub for the Rest of Africa
Design and layoutAfrican Development BankYasso creation : Hela ChaouachiE-mail : [email protected]

www.afdb.org