analysis of new atmospheric aerosol particles formation; case study of seasonal variability of numbe
DESCRIPTION
http://www.seipub.org/des/paperInfo.aspx?ID=9699 Measurements of concentration of gaseous pollutants have been performed since 1996 and aerosol particulate matter PM10 since 2007 at Belsk Observatory, the rural site in Poland. Simultaneously operated in 2009 Scanning Mobility Particle Sizer (SMPS) spectrometer provided information on particle number concentration and size distribution in the range of 10.4 to 467 nm. The information related to concentration of gaseous pollutants and particulate matter with a diameter below 10 m (PM10) describes well condition of the atmosphere at sampling site. To describe processes of nucleation and accumulation of aerosol particles the sources of ultrafine particles data obtained in SMPS measurements for the year of 2009 were investigated in terms of annual, weekly and diurnal cycles. The sampling site was influenced by local anthropogenic sources, such as traffic and domestic heating. The size distribution and number concentration of particlTRANSCRIPT

Development in Earth Science Volume 1 Issue 1, September 2013 www.seipub.org/des
11
Analysis of New Atmospheric Aerosol Particles Formation; Case Study of Seasonal Variability of Number Concentration in Rural Region of Poland in 2009 Janusz Jarosławski1, Barbara Kopcewicz2, Aleksander Pietruczuk3, Jerzy Podgórski4 and Izabela Pawlak*5
Institute of Geophysics, Polish Academy of Sciences 64 Księcia Janusza, 01-452 Warsaw, Poland. [email protected]; [email protected]; [email protected]; [email protected], *[email protected]
Abstract
Measurements of concentration of gaseous pollutants have been performed since 1996 and aerosol particulate matter PM10 since 2007 at Belsk Observatory, the rural site in Poland. Simultaneously operated in 2009 Scanning Mobility Particle Sizer (SMPS) spectrometer provided information on particle number concentration and size distribution in the range of 10.4 to 467 nm. The information related to concentration of gaseous pollutants and particulate matter with a diameter below 10 µm (PM10) describes well condition of the atmosphere at sampling site. To describe processes of nucleation and accumulation of aerosol particles the sources of ultrafine particles data obtained in SMPS measurements for the year of 2009 were investigated in terms of annual, weekly and diurnal cycles. The sampling site was influenced by local anthropogenic sources, such as traffic and domestic heating. The size distribution and number concentration of particles varied with season. The largest values of number concentration were observed for particles in the ultra fine size range (nucleation and Aitken particles) for months with large values of the transparency index G/G0 suggesting that solar radiation has a substantial influence on new particle formation during photochemical gas-to-particle conversion.
Keywords
Air Pollution; Atmospheric Aerosol; Gas-To-Particle Conversion
Introduction
In the recent years, the subject of regulation of particulate substances in ambient air has become an important issue in pollution control resulting from a significant role of atmospheric aerosol played in interactions with atmospheric radiation, participation in chemical reactions and cloud formation processes (e.g., Charlson, 1969; Stevens and Feingold, 2009; Lohmann and Feichter, 2005). For the last decades attention has been paid to the concentration of
respirable suspended particulate matter (PM10 and PM2.5) due to its potentially hampering health effect (e.g., Stieb et al., 2002; Nemmar et al., 2003). However, some studies (e.g., Schwartz et al., 1996; Ferin et al., 1991; Donaldson et al., 1998; Nel, 2005; Pope et al., 2002; Pope and Dockery, 2006) suggest that some ultra fine particles can penetrate directly into the lung tissue and may have a much greater physiological impact than fine and coarse aerosol particles of the same composition. This is the reason that the structure and number size distribution, beside the total mass concentration of suspended particles, is an important subject of environmental studies (e.g., Kulmala et al., 2004; Holmes, 2007; Van Dingenen et al., 2004). The complete information on concentration of particulate matter and gaseous pollutants, the size distribution as well as the physical and chemical properties of the atmospheric aerosol are useful for the effective emission control. However, an increasing number of theoretical and experimental studies describe the condition of ambient air mostly at urban or industrial sites (e.g., Shi et al., 2001; Wehner and Wiedensohler, 2003; Charron and Harrison, 2003; Hussein et al., 2004; Imhof et al., 2006; Kerminen et al., 2007; Wang et al., 2010; Řimnáčová, et al., 2011; Lonati et al., 2011; Shen et al., 2011). There is insufficient information on rural regions representing different environments and climates. Such studies could be very useful to describe chemical and physical processes observed in the atmosphere and which would not be overlapped by severe industrial pollution. Some important information on the atmospheric aerosol properties in Europe has been provided during several European projects such as PARFORCE on the marine environments (O’Dowd et al., 2002), BIOFOR for biogenic aerosol production (Kulmala et al., 2001). The

www.seipub.org/des Development in Earth Science Volume 1 Issue 1, September 2013
12
EUSAAR (European Supersites for Atmospheric Aerosol Research) project of the Sixth Frame work Programme of the European Commission (Philippin, et al., 2009) and the EUCAARI (European Integrated project on Aerosol Cloud Climate and Air Quality Interactions) (Manninen et al., 2010) were realized with mobility particle size spectrometers which have been used to study the spatial and temporal distribution of atmospheric aerosol in the particle size range important for global climate by absorption and scattering of radiation (Haywood and Boucher, 2000), for human health and by acting as cloud condensation nuclei (Lohmann and Feichter, 2005). Influence of meteorological parameters and solar UV-radiation on nucleation processes observed in a background location (forest area) was discussed by Boy and Kulmala (2002). Asmi et al. (2011) measured aerosol particle number concentrations and number size distribution at 24 European field monitoring sites. Unfortunately, great part of Central Europe was disregard in these studies, including Poland and countries east of Poland. The aim of this work is to fulfill the gap of information which can widen our knowledge on the formation of new aerosol particles, in particular, at rural site.
In this study results of the ground-based measurements were presented at Geophysical Observatory of the Institute of Geophysics of the Polish Academy of Sciences at Belsk (52oN, 21oE). Sampling site was nearby a local road with light traffic, close to orchards on one side and coniferous forest on the other. The area is characterized by a low local emission (Observatory facilities and dispersed rural houses) sometime affected by a long range transport. From an air quality point of view, the measurement site at Belsk can be considered as a rural background station.
The aerosol particle size distributions were measured with a Scanning Mobility Particle Sizer (SMPS). Information on the concentration of fine and ultra fine aerosol particles and their diurnal and seasonal changes are essential for determination of their sources and on understanding the mechanism of their creation. Additionally, concentration levels of NO2, NO, NOx, CO, O3, SO2 and PM10 were continuously registered by automatic monitors of the station. The current work presents mass concentration of gaseous pollutants for the period of 1996–2009 and year 2009 series of PM10 mass concentration. These data describe the sampling site and help understanding physical and chemical processes observed at this study.
The aim of this work is to describe the atmospheric
particle number size distribution observed at Belsk as a function of time of day, season and global solar radiation and determine the conditions on new particle formation and size evolution.
Experimental Details
The inlets for aerosol and trace gas measurements were mounted on the roof of the Laboratory building at 8 m above the ground level. The instruments were operated inside the building at room temperature conditions. The trace gas measurements were performed using the following instruments: Monitor Europe model ML9810 (ozone-UV absorption), ML9850 (sulfur dioxide-UV fluorescence), ML9830 (carbon monoxide-IR absorption) and API Model 200AU for nitric oxide, nitrogen dioxide and NOx (chemiluminescence). The API Model 200AU instrument is designed to detect the low level of nitric oxide, which is important for the measurements performed in the background sites like Belsk station. Data were reported as hour averages. Measurements of PM10 mass concentrations were performed using TEOM Series 1400 a Ambient Particulate Monitor equipped with accounting FDMS module for semi volatile compounds. Measurements have been performed using standard quality assurance procedures. Estimated uncertainty is within the limits established in EU directions concerning air quality measurements.
The Scanning Mobility Particle Sizer (SMPS) the TSI model 3034 spectrometer was used to determine the number, surface area and volume size distribution of submicrometer airborne particles. The SMPS accounted particles in 54 size fractions from 10.4 to 467 nm (median values of size fraction).
In the current work, the focus is placed on the analysis of weekly, diurnal, and seasonal variations of the aerosol number of concentrations in relation to solar radiation. In this case, clearness index G/G0, where G0 is extraterrestrial global radiation and G is daily global radiation on a horizontal surface in the entire spectral range (pyranometer CM-11, Kipp & Zonen), was determined.
Results and Discussion
Seasonal, Diurnal and Weekly Patterns in the Concentra-tion of PM10 and Gaseous Pollutants
To describe the sampling site at Belsk, the time series of O3, NO2, CO and SO2 monthly averaged concentrations in

Development in Earth Science Volume 1 Issue 1, September 2013 www.seipub.org/des
13
the 1996–2009 sampling period are presented in Figure 1. The monthly data have been smoothed using the LOWESS technique in order to reveal possible long-term changes in the concentration of individual pollutants which exhibit different long-term behavior. Levels of surface ozone concentration reveal a maximum around year 2004 and decrease since that time. There are no significant changes in the concentration levels of SO2 since 1999, while concentration of NO2
continuously rises since that time. The set of CO data is incomplete in the 1990s and one should not conclude the long-term changes, however, it seems clear that some decrease in CO concentration occurs.
Hourly mass concentrations of atmospheric particulate matter with an aerodynamic diameter smaller than or equal to 10 µm (PM10), the measurements of which have been started in December 2007, were continuously monitored in 2008 and 2009.
19961997
19981999
20002001
20022003
20042005
20062007
20082009
Year
20
40
60
80
100
O3
[µg/
m3 ]
a
19961997
19981999
20002001
20022003
20042005
20062007
20082009
Year
0
10
20
30
40
SO
2 [µ
g/m
3 ]
b
19961997
19981999
20002001
20022003
20042005
20062007
20082009
Year
5
10
15
20
25
NO
2 [µ
g/m
3 ]
c
19961997
19981999
20002001
20022003
20042005
20062007
20082009
Year
200
400
600
CO
[µg/
m3 ]
d
FIGURE 1 MONTHLY AVERAGED CONCENTRATION FOR 1996
– 2009 TIME SERIES OF O3 (a), SO2 (b), NO2 (c) AND CO (d)
The PM10 and gaseous pollutants monthly averaged mass concentrations observed in 2009 at Belsk sampling station are presented in Table 1 in which the annual mean concentrations of the pollutants calculated for weekdays, as well as for weekends (Saturdays and Sundays) are also shown. The monthly averaged weekend SO2, CO, NOx and PM10 concentrations were lower than the corresponding values for weekdays. Probably, the road situated about 3 km from sampling site with truck traffic in weekdays had larger influence than expected on atmospheric pollution. The differences between the weekends and weekdays pollutant concentrations, except for NOx with 34% change, had no statistical significance. Where wd and Sa-Su are weekdays and weekends annual mean concentrations, respectively. Concentrations are expressed in µg/m3.
TABLE 1 MONTHLY AVERAGED PM10 AND GASEOUS POLLUTANTS CONCENTRATION IN 2009.
Month SO2 O3 NO2 CO NOx PM10 G/G0 Jan 15.77 33.10 19.25 584.29 21.99 52.02 0.34 Feb 8.75 47.17 10.76 463.92 12.07 35.65 0.32
March 0.79 62.80 8.20 375.66 8.49 31.34 0.33 April 6.79 88.21 12.30 327.99 12.52 42.51 0.61 May 4.10 79.87 5.70 221.67 6.23 23.18 0.51 June 4.52 63.26 6.18 198.39 6.88 21.10 0.42 July 3.89 65.95 5.97 183.56 9.05 25.30 0.51 Aug 4.27 58.82 7.63 222.29 8.23 24.64 0.55 Sept 4.94 50.46 9.60 192.51 10.75 32.76 0.53 Oct 4.26 26.14 10.45 315.05 12.41 27.55 0.29 Nov 6.32 21.99 14.51 402.64 17.22 36.10 0.28 Dec 8.59 28.45 13.14 420.66 15.02 36.27 0.22
Mean 6.61 52.18 10.31 325.72 11.74 32.37 Wd 6.71 52.66 10.78 325.94 12.25 32.33
Sa-Su 6.15 51.48 8.83 321.49 8.30 31.96
The correlation matrix for the annual mean mass concentrations of gaseous pollutants and PM10 during the sampling period in 2009 is shown in Table 2. Additionally, correlation coefficients between PM10
and gaseous pollutants both for the annual mean and seasonal mean (summer and winter) concentrations were calculated. The PM10 mass concentration was correlated with SO2, CO, NO2 and NOx–correlation coefficients for entire year were 0.88, 0.83, 0.92 and 0.88, respectively. The relation was different for summer season (June, July, August) when a large correlation coefficient was observed only for NO2 and NOx (0.70 and 0.72, respectively). The large positive correlation coefficients for CO and SO2 (0.93 and 0.80, respectively) were observed in winter season (December, January, February) which suggests that local and possible long-range transport of debris connected with domestic heating was the main source of these pollutants. The concentration of NO2 and NOx are mostly associated with car exhaust emissions. Their influence on PM10 concentration was significant during entire 2009 year. In this case the positive correlation coefficients for NO2 and NOx in winter season (0.84 and 0.77, respectively) were only somewhat larger than those in summer season.
The examples of relations between PM10 and NOx monthly averaged diurnal plots of simultaneously measured mass concentrations in April 2009 are presented in Figure 2. The local time (LT) is GMT + 2 hours in period of April to end of October, in rest of the year LT is GMT + 1 hour. The morning rush hour peak is seen both in NOx plots and, about 1-2 h later, in PM10 mass concentration. The time delay was similar to that observed by Weber and McMurry (1996). This trend was observed for all gaseous pollutants which suggests re-suspension as a main source of coarse

www.seipub.org/des Development in Earth Science Volume 1 Issue 1, September 2013
14
particles. After the morning peak, the concentration of PM10 and NOx decreases rapidly. It can be explained by mixing within the boundary layer and sink of NOx in photochemical reactions, which leads to O3
production.
TABLE 2 CORRELATION MATRIX FOR THE ANNUALLY MEAN PM10 AND GASEOUS POLLUTANTS MASS CONCENTRATIONS FOR WHOLE 2009 YEAR
AND SEPARATELY, FOR SUMMER AND WINTER SEASONS.
2009 Variables
SO2 O3 NO NO2 CO NOx PM10
SO2 1.00 -0.37 0.54 0.84 0.90 0.81 0.88 O3 -0.37 1.00 -0.85 -0.60 -0.53 -0.67 -0.31
NO 0.54 -0.85 1.00 0.82 0.72 0.87 0.59 NO2 0.84 -0.60 0.82 1.00 0.86 0.98 0.92 CO 0.90 -0.53 0.72 0.86 1.00 0.83 0.83 NOx 0.81 -0.67 0.87 0.98 0.83 1.00 0.88 PM10 0.88 -0.31 0.59 0.92 0.83 0.88 1.00
PM10 in Summer
0.03 -0.51 0.15 0.70 0.06 0.72
PM10 in Winter
0.80 -0.13 -0.13 0.84 0.93 0.77
1 2 3 4 5 6 7 8 9 10 11 12 13 14 15 16 17 18 19 20 21 22 23 24
GMT
2500
3500
4500
5500
6500
Num
ber c
once
tratio
n [cm
-3] F
S ⇓
and
D p ⇑
1 2 3 4 5 6 7 8 9 10 11 12 13 14 15 16 17 18 19 20 21 22 23 24
5
7
9
11
13
15
17
19
21
NOx [µ
g/m
3 ]
34
36
38
40
42
44
46
48
50
52
54
PM10 [µg/m3]
0
200
400
600
800
1000
1200
1400 April 2009
Full Spectrum(FS)NOx/4/2009PM10/4/2009Dp = 10.4 nm
FIGURE 2 MONTHLY AVERAGED DIURNAL VARIATION OF
MASS CONCENTRATION OF PM10, NOx AND PARTICLE NUMBER CONCENTRATION (FRACTION WITH Dp = 10.4 nm)
AND PARTICLE NUMBER CONCENTRATION AVERAGED OVER ALL FRACTIONS OF THE SPECTRUM (10.4 nm – 469.8 nm)
MEASURED BY SMPS IN APRIL 2009.
The monthly averaged diurnal plots of PM10 and NOx in 2009 are presented in Figure 3. The morning and evening peaks of mass concentration of NOx and only slightly shifted in time mass concentration of PM10 which were observed in all seasons suggest the presence of local sources and production of the particular aerosol. Large concentration of PM10
observed in cold season can be explained by domestic heating. However, spring maxima in PM10 mass concentration in 2009 are probably related to the long-range transport of pollution created during seasonal biomass burning in Belarus, Ukraine and Russia. This interpretation is supported by results of aerosol optical thickness (AOT) and the LIDAR measurements (Jarosławski and Pietruczuk, 2010; Pietruczuk and Chaikowsky, 2012) in which a significant increase of
registered (AOT) was found during episode with elevated PM10 concentrations in Belsk.
Hour
10
20
30
40
50
60
70
PM10
[µg/
m3 ]
1 2 3 4 5 6 7 8 9 10 11 12 13 14 15 16 17 18 19 20 21 22 23 24
2
7
12
17
22
27
NOx [µ
g/m
3 ]PM10NOxSMPS(10.4 - 467 nm)2009
Jan Feb March April May June July Aug Sept Oct Nov Dec
Number concentration [cm-3]
12 12 12 12 12 12 12 12 12 12 12 12
1000
2000
3000
4000
5000
6000
7000
FIGURE 3 SEASONAL PATTERN OF DIURNAL VARIATIONS OF
MASS CONCENTRATION OF PM10, NOx AND PARTICLE NUMBER CONCENTRATION AVERAGED OVER ALL
FRACTIONS OF THE SPECTRUM (10.4 – 469.8 nm) MEASURED BY SMPS IN 2009.
Aerosol Size Distribution
The hourly averaged particle number concentration measured by the SMPS for each month in 2009 is shown in Figure 4. The number concentration is expressed by size distribution function dN(Dp)/logDp) in the size range from Dp = 10.4 nm to 469.8 nm, where Dp is a mobility particle diameter and a median value of each of 54 size fractions. Diurnal profiles of the number concentrations are different for each month. The largest, with the sharp rise, hourly mean number concentration, averaged over entire size range, was observed in summer months (June–September) around noon and early afternoon corresponding to the annual and daily maximum of solar radiation levels. Figure 5 presents seasonal variation of aerosol number concentration in three different aerosol size ranges: nucleation (10.4– 30.5 nm) (Fig. 5a), Aitken particles (32.8–103.7 nm) (Fig. 5b) and accumulation (111.4–469.8 nm) (Fig. 5c). Larger concentration of nucleation mode particles in summer months was observed around midday. The continuous move of the maximum into afternoon and evening hours connected at the same time with transition of the observed maximum from particles in nucleation mode through Aitken particles to particles in accumulation mode indicates more recently formed particles at sampling site rather than outer sources of pollution. Similar daily cycle, but with smaller values of maxima, was observed in spring and autumn. The evening maxima observed in the whole year is the effect of accumulation process. In winter, additionally, evening peaks observed can be explained by the domestic

Development in Earth Science Volume 1 Issue 1, September 2013 www.seipub.org/des
15
heating.
1 2 3 4 5 6 7 8 9 10 11 12 13 14 15 16 17 18 19 20 21 22 23 24
GMT
1000
2000
3000
4000
5000
6000
7000
Num
ber c
once
ntra
tion
[cm
-3]
1 2 3 4 5 6 7 8 9 10 11 12 13 14 15 16 17 18 19 20 21 22 23 24
1
2
3
4
5
6
7
8
9
101/20092/20093/20094/20095/20096/20097/20098/20099/200910/200911/200912/2009
FIGURE 4 SEASONAL VARIATIONS OF THE DIURNAL
PROFILES OF THE HOURLY AVERAGED PARTICLE NUMBER CONCENTRATION IN THE SIZE RANGE FROM 10.4 TO 469.8 nm
MEASURED BY THE SMPS IN 2009.
1 2 3 4 5 6 7 8 9 10 11 12 13 14 15 16 17 18 19 20 21 22 23 24
GMT
0
1000
2000
3000
4000
5000
6000
7000
8000
9000
10000
Numb
er co
ncen
tratio
n [cm
-3 ]
1 2 3 4 5 6 7 8 9 10 11 12 13 14 15 16 17 18 19 20 21 22 23 24
1
2
3
4
5
6
7
8
9
10Dp = 10.4 - 30.5 nm
Spring/2009Summer/2009Autumn/2009Winter /2008-2009
a
1 2 3 4 5 6 7 8 9 10 11 12 13 14 15 16 17 18 19 20 21 22 23 24
GMT
2000
3000
4000
5000
6000
7000
8000
Numb
er co
ncen
tratio
n [cm
-3]
1 2 3 4 5 6 7 8 9 10 11 12 13 14 15 16 17 18 19 20 21 22 23 24
1
2
3
4
5
6
7
8
9
10Dp = 32.8 - 103.7 nm
Spring/2009Summer/2009Autumn/2009Winter /2008-2009
b
1 2 3 4 5 6 7 8 9 10 11 12 13 14 15 16 17 18 19 20 21 22 23 24
GMT
1500
1700
1900
2100
2300
2500
2700
2900
3100
3300
3500
3700
Numb
er co
ncen
tratio
n [cm
-3]
1 2 3 4 5 6 7 8 9 10 11 12 13 14 15 16 17 18 19 20 21 22 23 24
1
2
3
4
5
6
7
8
9
10Dp = 111.4 - 469.8 nm
Spring/2009Summer/2009Autumn/2009Winter /2008-2009
c
FIGURE 5 DIURNAL PROFILES OF PARTICLE NUMBER
CONCENTRATION IN NUCLEATION, AITKEN AND ACCUMULATION SIZE RANGE, (FIG. 5a, FIG.5b AND FIg.5c,
RESPECTIVELY) AVERAGED OVER SPRING, SUMMER, AUTUMN AND WINTER SEASONS IN 2009.
The examples of monthly averaged diurnal plots of number concentration of particles for specified size fractions from nucleation, Aitken and accumulation mode for January and August 2009 are presented in Figure 6a and Figure 6b, respectively. In January, constant level of number concentration of the smallest particles (10.4 nm) in nucleation size range was observed during 24 hours. Small increase of number concentration of particles in size range 19.8–58.3 nm was observed at late morning suggesting the beginning of a process of new particles formation. The process was limited to couple of hours and the constant level of number concentration of Aitken particles for each size range at midday hours was observed. The number concentration of particles for each size range smoothly was increased at late afternoon and evening as a result of accumulation.
1 2 3 4 5 6 7 8 9 10 11 12 13 14 15 16 17 18 19 20 21 22 23 24
GMT
0
1000
2000
3000
4000
5000
6000
7000
8000
9000
10000Nu
mber
conc
entra
tion [
cm-3
]
1 2 3 4 5 6 7 8 9 10 11 12 13 14 15 16 17 18 19 20 21 22 23 24
1
2
3
4
5
6
7
8
9
10January 200910.4 nm
19.8 nm21.3 nm43.7 nm58.3 nm67.3 nm83.5 nm103.7 nm198.1 nm469.8 nm
Median value of size fraction →a
LT=GMT+1
1 2 3 4 5 6 7 8 9 10 11 12 13 14 15 16 17 18 19 20 21 22 23 24
GMT
0
2000
4000
6000
8000
10000
12000
14000
Numb
er co
ncen
tratio
n [cm
-3]
1 2 3 4 5 6 7 8 9 10 11 12 13 14 15 16 17 18 19 20 21 22 23 24
1
2
3
4
5
6
7
8
9
10August 200910.4 nm19.8 nm21.3 nm43.7 nm58.3 nm67.3 nm83.5 nm103.7 nm198.1 nm469.8 nm
Median value of size fraction
LT=GMT+2
b
FIGURE 6 THE HOURLY AVERAGED PARTICLE NUMBER
CONCENTRATION FOR SELECTED SIZE FRACTIONS, MEASURED IN JANUARY (FIG.6a) AND AUGUST 2009 (FIG.6b).
The processes of new particles formation in warm season was much more dynamic. The largest values of number concentrations were observed for particles in nucleation size range (10.4–21.3 nm) at near midday in August 2009 (Fig. 6b). The data suggest that solar radiation has a substantial influence on the number of particles whose origin is the photochemical gas-to-particle conversion. It is a main source of atmospheric particles both in nucleation and Aitken particles mode in warm season.
A similar relation between number concentration and

www.seipub.org/des Development in Earth Science Volume 1 Issue 1, September 2013
16
solar radiation results from data is presented in Figure 7 and Figure 8. Figure 7 shows the monthly averaged particle size distribution for each month of 2009. Results indicate that the size distribution and number concentration vary with season. The largest values of number concentration were observed for particles in the ultra fine size range (nucleation and Aitken particles) for months with large values of the transparency index G/G0 (Tab. 1). Additionally, in the period between June and September, the sharp increase in number concentration for particles of size fraction with median value of 10.4 nm was observed which suggests that large global radiation, defined by large values of G/G0 index, could trigger more efficient photochemical reactions.
101 1028 9 2 3 4 5 6 7 8 9 2 3 4 5 6
Dp [nm]
0
1000
2000
3000
4000
5000
6000
7000
Num
ber c
once
ntra
tion
[cm-3
]
1 2 3 4 5 6 7 8 9 10 11 12 13 14 15 16 17 18 19 20 21 22 23 24
1
2
3
4
5
6
7
8
9
101/20092/20093/20094/20095/20096/20097/20098/20099/200910/200911/200912/2009
FIGURE 7 SEASONAL VARIATIONS OF THE PARTICLE
NUMBER SIZE DISTRIBUTION IN 2009.
For cold season position of maxima of particle number concentration was shifted to the coarse size range (>100 nm). The values of maxima in winter are lower than those in summer with exception observed in January 2009 when the number concentration was similar to that observed in warm season. The difference between January and rest of winter months can be explained by extremely large anthropogenic pollution observed at sampling site (Tab. 1.)
The monthly averaged particle size distribution measured with SMPS at various periods of a day in summer and winter months (January, August, December 2009) is shown in Figure 8. In January 2009 (Fig. 8a) maximum of concentration appeared in the evening for particles with the diameter size of about 100 nm. In December 2009 (Fig. 8c), aerosol particle size distribution was bimodal with one maximum for aerosol particles with diameter of about 30 nm (at 6 to 10a.m) and second one (main) for aerosol particles with diameter of about 100 nm (at evening hours). This difference between the values of maxima and the shape of the size distribution for January and
December was related most probably to the extremely large concentrations of CO, SO2, NOx and PM10 in January 2009 (Tab. 1). This kind of pollution, related to domestic heating and/or to transport of anthropogenic pollution from other region, could overlap the influence of local conditions (mostly traffic) on the formation of new particles in photochemical processes. In December 2009, when the level of gaseous pollutants was much lower than that in January 2009, the influence of local events such as domestic heating and local traffic was observed (Fig. 8c). It is probably the origin of both maxima in number concentration spectrum. The increase of NOx mass concentration, which usually is observed in the morning as a product of morning traffic could explain at least partially production of new particles at that time. The afternoon traffic and domestic heating could explain the late afternoon maximum. As it was seen already in Figure 3 that variations of mass concentration of PM10 in cold season were correlated with mass concentration of NOx shifted in time for 1-2 hours which suggests the common source of the aerosol particles produced at sampling site, not transported from more polluted regions. The largest number concentrations of particles measured in the entire size range (10.4–467 nm) were usually correlated with the maxima of PM10 and gaseous pollutants related to domestic heating, which suggests also such events as a main source of ultra fine particles in cold season.
101 1028 9 2 3 4 5 6 7 8 9 2 3 4 5 6
Dp [nm]
0
1000
2000
3000
4000
5000
6000
7000
8000
9000
10000
Num
ber c
once
ntra
tion
[cm-3
]
1 2 3 4 5 6 7 8 9 10 11 12 13 14 15 16 17 18 19 20 21 22 23 24
1
2
3
4
5
6
7
8
9
106810111213141820
GMT January 2009
LT=GMT+1
a
101 1028 9 2 3 4 5 6 7 8 9 2 3 4 5 6
Dp [nm]
0
2000
4000
6000
8000
10000
12000
14000
16000
Num
ber c
once
ntra
tion
[cm-3
]
1 2 3 4 5 6 7 8 9 10 11 12 13 14 15 16 17 18 19 20 21 22 23 24
1
2
3
4
5
6
7
8
9
10
68101112131418202224
GMT
August 2009
b
LT=GMT+2

Development in Earth Science Volume 1 Issue 1, September 2013 www.seipub.org/des
17
101 1028 9 2 3 4 5 6 7 8 9 2 3 4 5 6
Dp [nm]
0
1000
2000
3000
4000
5000
Conc
entra
tion
[cm-3
]
1 2 3 4 5 6 7 8 9 10 11 12 13 14 15 16 17 18 19 20 21 22 23 24
1
2
3
4
5
6
7
8
9
10
6810111213141820
GMT
December 2009
c
LT=GMT+1
FIGURE 8 THE TIME EVOLUTION OF THE AEROSOL SIZE
SPECTRUM AVERAGED OVER TOTAL FRACTIONS OF THE SPECTRUM MEASURED BY SMPS (10.4 – 469.8 nm) IN JANUARY,
AUGUST AND DECEMBER 2009.
The extremely large maxima of number concentration of particles in the entire size range measured with SMPS were observed in summer months (Fig. 3). The values of maxima of number concentration, time of their appearance (midday) and diurnal evolution suggest a different source of ultra fine particles at sampling site.
Figure 8b shows that values of maxima of number concentration measured in August were larger than those in previously discussed months and were observed at early afternoon for ultra fine particles with diameter of about 10.4 nm. A significant increase of number concentration of particles with Dp = 10.4 nm, as seen in Figure 7 and Figure 8b, suggests that processes of formation and growth of particles started earlier and comprised the nucleated particles smaller than 10 nm and sharp cut-off at size distribution at 10.4 nm is determined by the low size detection limit of the SMPS instrument used. Some elevated number concentrations of sub-10.4 nm particles were produced in specific atmospheric conditions at sampling site and were observed after some particle growth occurred. Figure 8 presents diurnal variations of number size distribution which strongly depend on the observation time. This effect is also visible in Figure 9a and Figure 9b which show time evolution of aerosol size spectra for specific weekend day in August 2009 with large (70%) and small (13%) transparency index, respectively. For a day with large transparency index (Fig. 9a), a maximum of number concentration is observed for particles in the nucleation size range and is six time larger than for a day with small transparency index (Fig. 9b).
A large transparency index suggests the conventional explanation of the production of aerosol particles through photochemical oxidation and partitioning. In
January, on similar weekend days with large (46%) and small (13%) transparency index (Fig.10a and Fig. 10b, respectively) time evolution of aerosol spectra were somewhat different than in August. The maximum values of number concentration in January were smaller than in August and appeared in the evening hours. In the day with small transparency index the maximum of number concentration of particles in accumulation size range was observed. In the day with large transparency index maximum of number concentration of particles in the Aitken size range was observed. The fact that it was observed in the evening hours excludes any relation to transparency index and indicates more recently injected particles from the local source of anthropogenic pollution (domestic heating). The above analysis suggests that the source and mechanism of production of aerosol particles in nucleation size range is different for both discussed months.
101 1028 9 2 3 4 5 6 7 8 9 2 3 4 5 6
Dp [nm]
0
10000
20000
30000
40000
50000
60000
Num
ber c
once
ntra
tion
[cm-3
]
1 2 3 4 5 6 7 8 9 10 11 12 13 14 15 16 17 18 19 20 21 22 23 24
1
2
3
4
5
6
7
8
9
10
6810111213141820
GMT
16 August 2009
LT=GMT+2
aG/Go = 70%
101 1028 9 2 3 4 5 6 7 8 9 2 3 4 5 6
Dp [nm]
0
1000
2000
3000
4000
5000
6000
7000
8000
9000
10000
Num
ber c
once
ntra
tion
[cm-3
]
1 2 3 4 5 6 7 8 9 10 11 12 13 14 15 16 17 18 19 20 21 22 23 24
1
2
3
4
5
6
7
8
9
106810111213141820
GMT 29 August 2009
LT=GMT+2
bG/Go=13%
FIGURE 9 THE TIME EVOLUTION OF THE AEROSOL SIZE
SPECTRUM AVERAGED OVER TOTAL FRACTIONS OF THE SPECTRUM MEASURED BY SMPS (10.4 – 469.8 nm) ON THE DAY
WITH LARGE AND SMALL G/G0 INDEX (FIG.9a AND FIG. 9b, RESPECTIVELY) IN AUGUST 2009.
In the current analysis, the presence of primary and secondary organic aerosol in the atmosphere, especially that the sampling station was in close vicinity to the coniferous forest, should be taken into account. Such measurements were, however, not performed. The fact that the increase of number
www.seipub.org/des Development in Earth Science Volume 1 Issue 1, September 2013
18
concentration of aerosol particles was observed when G/G0 index was large (summer months and midday hours) suggests that at least part of the measured aerosol was a secondary aerosol formed by in-situ chemical reactions of their volatile organic compound precursors. The maxima of concentration curves for Aitken particles which appear shortly after appearance of maximum of concentration of particles in nucleation range indicate a local particle source rather than a long-range transport.
101 1028 9 2 3 4 5 6 7 8 9 2 3 4 5 6
Dp [nm]
0
2000
4000
6000
8000
10000
12000
14000
Num
ber c
once
ntra
tion
[cm-3
]
1 2 3 4 5 6 7 8 9 10 11 12 13 14 15 16 17 18 19 20 21 22 23 24
1
2
3
4
5
6
7
8
9
106810111213141820
GMT 3 January 2009
LT=GMT+1
aG/Go=46%
101 1028 9 2 3 4 5 6 7 8 9 2 3 4 5 6
Dp [nm]
0
1000
2000
3000
4000
5000
6000
7000
8000
9000
10000
Num
ber c
once
ntra
tion
[cm-3
]
1 2 3 4 5 6 7 8 9 10 11 12 13 14 15 16 17 18 19 20 21 22 23 24
1
2
3
4
5
6
7
8
9
106810111213141820
GMT 10 January 2009
LT=GMT+1
bG/Go=13%
FIGURE 10 THE TIME EVOLUTION OF THE AEROSOL SIZE SPECTRUM AVERAGED OVER TOTAL FRACTIONS OF THE
SPECTRUM MEASURED BY SMPS (10.4 – 469.8 nm) ON THE DAY WITH LARGE AND SMALL G/G0 INDEX (FIG.9a AND FIG. 9b,
RESPECTIVELY) IN JANUARY 2009.
In winter, when coniferous trees are in a quiescent state and the natural emission of hydrocarbons is usually smaller than the summer values, the formation of new aerosol particles through photochemical oxidation process was limited. Therefore the nucleation peak around noon and early afternoon was not observed (Fig. 6a). Concentration of aerosol particles in the nucleation mode and coarse fraction was small and fairly stable during the entire days. Maxima in size distribution curves were observed for Aitken particles (size range of 20 to 100 nm) during early morning or late afternoon, at the time of intensive anthropogenic production of all kinds of pollution related to traffic and domestic heating.
101 1028 9 2 3 4 5 6 7 8 9 2 3 4 5 6
Dp [nm]
0
1000
2000
3000
4000
5000
6000
7000
Num
ber c
once
ntra
tion
[cm-3
]
1 2 3 4 5 6 7 8 9 10 11 12 13 14 15 16 17 18 19 20 21 22 23 24
1
2
3
4
5
6
7
8
9
10weekendsweekdays
January 2009
a
101 1028 9 2 3 4 5 6 7 8 9 2 3 4 5 6
Dp [nm]
0
1000
2000
3000
4000
5000
6000
7000
8000
Num
ber c
once
ntra
tion
[cm-3
]
1 2 3 4 5 6 7 8 9 10 11 12 13 14 15 16 17 18 19 20 21 22 23 24
1
2
3
4
5
6
7
8
9
10weekendsweekdays
April 2009
b
101 1028 9 2 3 4 5 6 7 8 9 2 3 4 5 6
Dp [nm]
0
1000
2000
3000
4000
5000
6000
7000
8000
Num
ber c
once
ntra
tion
[cm-3
]
1 2 3 4 5 6 7 8 9 10 11 12 13 14 15 16 17 18 19 20 21 22 23 24
1
2
3
4
5
6
7
8
9
10weekendsweekdays
August 2009
c
FIGURE 11 MONTHLY AVERAGED PARTICLE NUMBER CONCENTRATION IN WEEKDAYS AND WEEKENDS IN
JANUARY, APRIL AND AUGUST 2009 (FIG. 11a, FIG.11b AND FIG.11c, RESPECTIVELY).
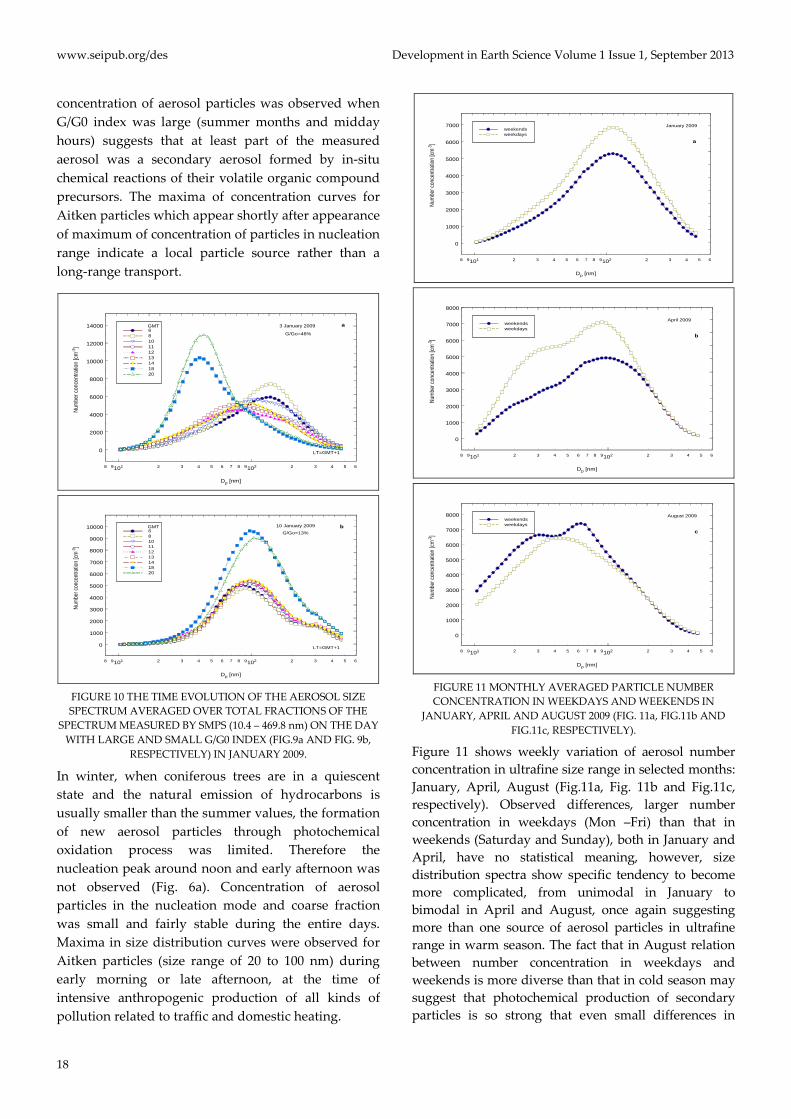
Figure 11 shows weekly variation of aerosol number concentration in ultrafine size range in selected months: January, April, August (Fig.11a, Fig. 11b and Fig.11c, respectively). Observed differences, larger number concentration in weekdays (Mon –Fri) than that in weekends (Saturday and Sunday), both in January and April, have no statistical meaning, however, size distribution spectra show specific tendency to become more complicated, from unimodal in January to bimodal in April and August, once again suggesting more than one source of aerosol particles in ultrafine range in warm season. The fact that in August relation between number concentration in weekdays and weekends is more diverse than that in cold season may suggest that photochemical production of secondary particles is so strong that even small differences in

Development in Earth Science Volume 1 Issue 1, September 2013 www.seipub.org/des
19
radiation at individual days can screen the effect of other sources of anthropogenic pollution observed mostly in weekdays. Usually, a weekly cycle in number concentration was observed for sampling sites close to sources of anthropogenic pollution (Rodriguez et al., 2007). In our case such situation was observed mainly in cold season (Fig.11a) when traffic contribution was large enough and photochemical processes much weaker than in summer months.
Conclusions
Simultaneous measurements of gaseous and suspended particulate matter have been performed at Belsk Observatory and hourly mean concentration values of NO2, NOx, O3, SO2 from 1996 to 2009 and PM10 mass concentration for the year 2009 were investigated in terms of annual, weekly and diurnal cycles. Analysis of the concentration data of individual pollutants exhibits their different long-term behavior. The surface ozone concentration has a maximum around year 2003 and decreases since that time. The concentration of SO2 was largest in 1996, decreased significantly during next three years, and since 1999 no further changes were observed. The concentration of NO2 continuously increased since 1999, which could be related to the increase of road traffic. The set of CO data is incomplete in the 1990s and one should not conclude the long-term changes, however, it seems that concentration of CO decreases. This is a very positive effect for environment. The information which concerns concentration of gaseous pollutants and PM10 describes well the condition of the atmosphere at sampling site and is useful in the analysis of data obtained in the measurements of number concentration of the aerosol particles in the entire size range from 10.4 nm to 469.8 nm and their size distribution. To describe processes of nucleation and accumulation of aerosol particles the sources of ultrafine particles, data obtained with SMPS measurements for the year of 2009 were investigated in terms of annual, weekly and diurnal cycles.
The total suspended particles and PM10 concentration in the ambient air is affected by various meteorological factors such as relative humidity, wind velocity, wind direction and global radiation. In the current studies, analysis was limited to monthly medium values, both for particle number concentration and pollutant mass concentrations, therefore the only parameter used in the discussion was the solar radiation. Presented measurements have shown that month of increased new particles formation followed by an increase of
transparency index G/G0. The presence or absence of cloud cover is the main factor during nucleation and accumulation processes in the atmosphere. Also a diurnal pattern of size distribution of particles supports the significance of global radiation for the formation of aerosol particles. The increase in PM10 concentration which occurred about 2 hours after an increase in NOx concentration was also observed. This time delay was similar to that observed by Weber et al. (1997) and was estimated as the time required for the particles growth to the observable size.
Comparison of data obtained in the current study with data presented by Asmi et al. (2011) suggests that annual mean values of number size distribution at Belsk are similar to that obtained at Melpitz (MPZ Central Europe station) and support their conclusion about a relatively stable number size distribution over Central Europe. However, the seasonal number size distribution observed at Belsk is rather similar to that observed in Harwell (HWL Western Europe station). In all three sampling sites, maximum values of number concentration were observed in the sequence: summer, spring, autumn, winter, however, position of the maximum for particles in the size range of 60 -100 nm in case of Melpitz was similar for each season. For Harwell and Belsk sampling stations appearance of the maximum of number concentration was considerably different for each season and shifted in the direction of particles in nucleation range. Mean size distributions of particles measured at Belsk and Harwell show, especially in summer and spring, bimodal behavior associated with different aerosol formation mechanisms. In cold season, the number concentration and size distribution of particles measured with SMPS at Belsk were influenced by local anthropogenic sources such as traffic and domestic heating, which depends on season. Such behavior was also observed both in gaseous pollution and particulate matter measurements. However, in warm season, in days with large radiation index, photochemical processes, most probably related to biogenic aerosol, were dominating.
Possibility of a significant role of the organic substances in aerosol production observed at Belsk Observatory during periods with large transparency index requires further studies.
ACKNOWLEDGEMENTS
This work was partially supported from the State Inspectorate for Environment Protection in Poland, under Contract No. 48/2010/F and by the Ministry of

www.seipub.org/des Development in Earth Science Volume 1 Issue 1, September 2013
20
Science and Higher Education (Poland), Grant 0381/B/PO1/2009/36.
REFERENCES
Asmi, A., Wiedensohler, A., Laj, P., Fjaeraa, A.-M., Sellegri,
K.,Birmili, W., Weingartner, E., Baltensperger, U., Zdimal,
V., Zikova, N., Putaud, J.-P., Marinoni, A., Tunved, P.,
Hansson, H.-C., Fiebig, M., Kivekäs, N., Lihavainen, H.,
Asmi, E., Ulevicius, V., Aalto, P.P., Swietlicki, E.,
Kristensson, A., Mihalopoulos, N., Kalivitis, N., Kalapov,
I., Kiss, G., de Leeuw, G., Henzing, B., Harrison, R.M.,
Beddows, D., O'Dowd, C., Jennings, S.G., Flentje, H.,
Weinhold, K., Meinhardt, F., Ries, L., Kulmala, M. 2011.
Number size distributions and seasonality of submicron
particles in Europe 2008–2009. Atmospheric Chemistry
and Physics 11, 5505-5538.
Boy, M., Kulmala, M. 2002. Nucleation events in the
continental boundary layer: Influence of physical and
meteorological parameters. Atmospheric Chemistry and
Physics 2, 1-16.
Charlson, R. J., 1969. Atmospheric visibility related to
aerosol mass concentration: review. Environmental
Science & Technology 3, 913-918.
Charron, A., Harrison, R. M. 2003. Primary particle
formation from vehicle emissions during exhaust
dilution in the roadside atmosphere. Atmospheric
Environment 37, 4109-4119.
Donaldson, K., Li, X.Y., MacNee, W. 1998. Ultrafine
(nanometer) particle mediated lung injury. Journal of
Aerosol Science 29, 553-560.
Ferin, J., Oberdörster, G., Soderholm, S.C., Gelein, R. 1991.
Pulmonary tissue access of ultrafine particles. Journal of
Aerosol Medicine 4, 57-68.
Haywood, J.M., Boucher, O. 2000. Estimates of the direct and
indirect radiative forcing due to tropospheric aerosols: a
review. Reviews of Geophysics 38, 513-543.
Holmes, N.S. 2007. A review of particle formation events
and growth in the atmosphere in the various
environments and discussion of mechanistic implications.
Atmospheric Environment 41, 2183-2201.
Hussein, T., Puustinen, A., Aalto, P.P., Mäkelä, J.M., Hämeri,
K., Kulmala, M. 2004. Urban aerosol number size
distributions. Atmospheric Chemistry and Physics 4,
391-411.
Imhof, D., Weingartner, E., Prévôt, A.S.H., Ordóñez, C.,
Kurtenbach, R., Wiesen, P., Rodler, J., Sturm, P., McCrae,
I., Ekström, M., Baltensperger, U. 2006. Aerosol and NOx
emission factors and submicron particle number size
distributions in two road tunnels with different traffic
regimes. Atmospheric Chemistry and Physics 6, 2215-
2230.
Jarosławski, J., Pietruczuk, A. 2010. On the origin of seasonal
variation of aerosol optical thickness in UV range over
Belsk, Poland. Acta Geophysica 58, 1134-1146.
Kerminen, V.-M., Pakkanen, T.A., Mäkelä, T., Hillamo, R. E.,
Sillanpää, M., Rönkkö, T., Virtanen, A., Keskinen, J.,
Pirjola, L., Hussein, T., Hämeri, K. 2007. Development of
particle number size distribution near a major road in
Helsinki during an episodic inversion situation.
Atmospheric Environment 41, 1759-1767.
Kulmala, M., Hämeri, K., Aalto, P.P., Mäkelä, J.M.,Pirjola, L.,
Nilsson, E. D., Buzorius, G., Rannik, Ü., Dal Maso, M.,
Seidl, W., Hoffman, T., Janson, R., Hansson, H.-C,
Viisanen, Y., Laaksonen, A., O'Dowd, C.D. 2001.
Overview of the international project on biogenic aerosol
formation in the boreal forest (BIOFOR). Tellus B 53, 324-
343.
Kulmala, M., Vehkamäki, H., Petäjä, T., Dal Maso, M., Lauri,
A., Kerminen, V.-M., Birmili, W., McMurry, P.H. 2004.
Formation and growth rates of ultrafine atmospheric
particles: a review of observations. Journal of Aerosol
Science 35, 143-174.
Lohmann, U., Feichter, J. 2005. Global indirect aerosol effects:
a review. Atmospheric Chemistry and Physics 5, 715-737.
Lonati, G., Crippa, M., Gianelle, V., Van Dingenen, R. 2011.
Daily patterns of the multi-modal structure of the
particle number size distribution in Milan, Italy.
Atmospheric Environment 45, 2434-2442.
Manninen, H. E., Nieminen, T., Asmi, E., Gagné, S.,
Häkkinen, S., Lehtipalo, K., Aalto, P., Vana, M., Mirme,
A., Mirme, S., Hõrrak, U., Plass-Dülmer, C., Stange, G.,
Kiss, G., Hoffer, A., Törő, N., Moerman, M., Henzing, B.,
de Leeuw, G., Brinkenberg, M., Kouvarakis, G.N.,
Bougiatioti, A., Mihalopoulos, N., O'Dowd, C., Ceburnis,
D., Arneth, A., Svenningsson, B., Swietlicki, E., Tarozzi,
L., Decesari, S., Facchini, M. C., Birmili, W., Sonntag, A.,

Development in Earth Science Volume 1 Issue 1, September 2013 www.seipub.org/des
21
Wiedensohler, A., Boulon, J., Sellegri, K., Laj, P., Gysel,
M., Bukowiecki, N., Weingartner, E., Wehrle, G.,
Laaksonen, A., Hamed, A., Joutsensaari, J., Petäjä, T.,
Kerminen, V.-M., Kulmala, M. 2010. EUCAARI ion
spectrometer measurements at 12 European sites –
analysis of new particle formation events. Atmospheric
Chemistry and Physics 10, 7907-7927.
Nel, A. 2005. Air pollution-related illness: effects of particles.
Science 308, 804–805.
Nemmar, A., Hoet, P.H.M., Dinsdale, D., Vermylen, J.,
Hoylaerts, M.F., Nemery, B. 2003. Diesel exhaust
particles in lung acutely enhance experimental
peripheral thrombosis. Circulation 107, 1202-1208.
O’Dowd, C.D., Hämeri, K., Mäkelä, J., Pirjola, L., Kulmala,
M., Jennings, S., Berresheim, H., Hansson, H.-C., de
Leeuw, G., Kunz, G., Allen, A., Hewitt, C., Jackson, A.,
Viisanen, Y., Hoffmann, T. 2002. A dedicated study of
New Particle formation and Fate in the Costal
Environment (PARFORCE): Overview of objectives and
achievements. Journal of Geophysical Research 107, 8108.
Philippin, S., Laj, P., Putaud, J.-P., Wiedensohler, A., de
Leeuw, G., Fjaeraa, A.M., Platt, U., Baltensperger, U.,
Fiebig, M. 2009. EUSAAR – An Unprecedented Network
of Aerosol Observation in Europe. Journal of Aerosol
Research 24, 78-83.
Pietruczuk, A., Chaikovsky, A. 2012. Variability of Aerosol
Properties during the 2007 – 2010 Spring Seasons over
Central Europe. Acta Geophysica 60, 1238–1358.
Pope, C. A., Burnett, R.T., Thun, M.J., Calle, E.E., Krewski,
D., Ito, K., Thurston, G.D. 2002. Lung cancer,
cardiopulmonary mortality and long term exposure to
fine particulate air pollution. Journal of the American
Medical Association 287, 1132-1141.
Pope, C. A., Dockery, D. W. 2006. Health effects of fine
particulate air pollution. Journal of Air and Management
Association 56, 709-742.
Řimnáčová, D., Ždímal, V., Schwarz, J., Smolík, J., Řimnáč,
M. 2011. Atmospheric aerosols in suburb of Prague: The
dynamics of particle size distributions. Atmospheric
Research 101, 539-552.
Rodríguez, S., Van Dingenen, R., Putaud, J.-P., Dell’Acqua,
A., Pey, J., Querol, X., Alastuey, A., Chenery, S., Ho, K.-F.,
Harrison, R., Tardivo, R., Scarnato, B., Gemelli, V. 2007.
A study on the relationship between mass concentrations,
chemistry and number size distribution of urban fine
aerosols in Milan, Barcelona and London. Atmospheric
Chemistry and Physics 7, 2217–2232.
Schwartz, J., Dockery, D.W., Neas, L.M. 1996. Is daily
mortality associated specifically with fine particles?
Journal of Air and Management Association 46, 927-939.
Shen, X.J., Sun, J.Y., Zhang, Y. M., Wehner, B., Nowak, A.,
Tuch, T., Zhang, X.C., Wang, T. T., Zhou, H. G., Zhang, X.
L., Dong, F., Birmili, W., Wiedensohler, A. 2011. First
long-term study of particle number size distributions
and new particle formation events of regional aerosol in
the North China Plain. Atmospheric Chemistry and
Physics, 11, 1565-1580.
Shi, J. P., Evans, D.E., Khan, A.A., Harrison, R. M. 2001.
Sources and concentration of nanoparticles (<10nm
diameter) in the urban atmosphere. Atmospheric
Environment 35, 1193-1202.
Stevens, J. and Feingold, G., 2009. Untangling aerosol effects
on clouds and precipitation in buffered system. Nature
461, 607-613.
Stieb, D.M., Judek, S. Burnett, R.T. 2002. Meta-analysis of
time series studies of air pollution and mortality: effect of
gases and particles and their influence of cause of death,
age and season. Journal of Air and Management
Association 52, 470-487.
Van Dingenen, R., Raes, F., Putaud, J.-P., Baltensperger, U.,
Charron, A., Facchini, M.-C., Decesari, S., Fuzzi, S.,
Gehrig, R., Hansson, H.-C., Harrison, R.M., Hüglin, C.,
Jones, A.M., Laj, P., Lorbeer, G., Maenhaut, W., Palmgren,
F., Querol, X., Rodriguez, S., Schneider, J., ten Brink, H.,
Tunved, P., Kjetil, Tørseth, K., Wehner, B., Weingartner,
E., Wiedensohler, A., Wåhlin, P. 2004. A European
aerosol phenomenology--1: physical characteristics of
particulate matter at kerbside, urban, rural and
background sites in Europe. Atmospheric Environment
38, 2561-2577
Wang, F., Costabileb, F., Li, H., Fang, D., Alligrini, I. 2010.
Measurements of ultrafine particle size distribution near
Rome. Atmospheric Research 98, 69-77.
Weber, R.J., McMurry P.H. 1996. Fine particle size
distribution measurements at Mauna Loa Observatory,
Hawaii. Journal of Geophysics Research 101, 14767-14775.

www.seipub.org/des Development in Earth Science Volume 1 Issue 1, September 2013
22
Weber, R.J., Marti, J.J., McMurry, P.H., Eisele, F.L., Tanner,
D.J., Jefferson, A. 1997. Measurements of new particle
formation and ultrafine particle growth rates at a clean
continental site. Journal of Geophysics Research 102,
4375-4385.
Wehner, B., Wiedensohler, A. 2003. Long term measurements
of submicrometer urban aerosols: statistical analysis for
correlations with meteorological conditions and trace
gases. Atmospheric Chemistry and Physics 3, 867-879.