analysis of organic acids in fruit juices by hplc and uv
TRANSCRIPT
Author:
Wilhad M. Reuter
PerkinElmer, Inc. Shelton, CT
Liquid Chromatography
Introduction In food, organic acids, such as malic, ascorbic and citric acids, originate from natural biochemical processes or are added as preservatives, acidulants and/
or stabilizers. Organic acids contribute to the sensory properties of foods and beverages by providing both taste and aroma. In particular, citric acid is widely used in soft drinks to provide the sour citrus taste.
The monitoring of these organic acids is essential for quality control during the processing of juices and related products, as well as for evaluating juice authenticity and purity. In addition, the use of organic acids in foods and beverages is regulated in many countries, though regulations vary widely.1
This application note presents a simple and robust HPLC method for the analysis of organic acids typically found in store-bought fruit juices. The method conditions and performance data, including repeatability and linearity, are provided.
Analysis of Organic Acids in Fruit Juices by HPLC and UV Detection
A P P L I C A T I O N N O T E

2
Experimental
Hardware/SoftwareA PerkinElmer Altus™ HPLC system was used, including the A-10 Solvent/Sample Manager, A-10 column heater and A-10 UV detector (PerkinElmer, Shelton, CT, USA). A PerkinElmer Brownlee™ Validated Aqueous C18 5 µm, 4.6 x 250-mm column was used for all analyses (PerkinElmer, Shelton, CT, USA). All instrument control, analysis, and data processing was performed via Waters® Empower® 3 Chromatography Data Software (CDS).
Method ParametersThe HPLC method parameters are shown in Table 1.
Solvents, Standards and SamplesThe water, used for both solvent and diluent, was HPLC-grade. For buffering the mobile phase and adjusting the pH to 2.4, both monobasic potassium phosphate and phosphoric acid were used, obtained from Sigma Aldrich®, Inc (Allentown, PA).
An organic acid standard kit (part # 47264) was obtained from Sigma Aldrich®, Inc. Of the included organic acids, the following were used for this application: oxalic acid, tartaric acid, quinic acid, malic acid, ascorbic acid, shikimic acid, citric acid, succinic acid and fumaric acid. Additionally, acetic acid was added as a standard, which was also obtained from Sigma Aldrich®, Inc.
A stock standard was prepared containing the 10 organic acids indicated above. Individual concentrations varied depending on the individual organic acid’s UV absorptivity and expected highest concentration in fruit juices. The concentration, in ppm, of each organic acid in the stock standard solution is presented in Table 2.
For calibration purposes, five levels were prepared via serial dilution of the stock standard, using water as diluent.
Commercial fruit juices, including grape juice, orange juice, apple juice and cranberry juice, were obtained from a local store. These were diluted 9:1 with HPLC-grade water, filtered and then injected.
The buffered mobile phase and all standards and samples were first filtered through 0.45 µm filters before injection.
Results and Discussion
Figure 1 shows the chromatogram of a standard mixture of the 10 organic acids, all separated in under eight minutes.
As shown in Figure 2, the chromatographic repeatability of 10 replicates of the standard mix demonstrates exceptional reproducibility. The average retention time (RT) %RSD for all 10 analytes was 0.08 %.
Table 1. HPLC Method Parameters.
HPLC Conditions
Column: PerkinElmer Brownlee Validated Aqueous C18, 5 µm, 4.6 x 250-mm (Part # N9303549)
Mobile Phase: Isocratic; 25-mM K-phosphate buffer; pH 2.4Analysis Time: 8.0 min.; wash/equilibration time = 6.0 minFlow Rate: 1.5 mL/min. (~3000 psi; 200 bar)Oven Temp.: 30 ºCUV Detection: Wavelength: 210 nmInjection Volume: 20 µLSampling (Data) Rate: 5 pts./sec
Table 2. Concentrations (ppm) of organic acids in the stock standard solution.
Oxalic Tartaric Quinic Malic Ascorbic Shikimic Acetic Citric Succinic Fumaric
141 543 1002 640 160 21 1005 962 608 81
Figure 1. Chromatogram of organic acid standard mix; UV at 210 nm.
AU
0.00
0.02
0.04
0.06
0.08
0.10
0.12
Minutes0.00 1.00 2.00 3.00 4.00 5.00 6.00 7.00 8.00
Oxa
lic
Tarta
ricQ
uini
c
Mal
ic Asco
rbic
Shik
imic
Acet
ic
Citri
c
Succ
inic
Fum
aric

3
Figure 2. Overlay of 10 replicates of organic acid standard mix.
Minutes
0.00 1.00 2.00 3.00 4.00 5.00 6.00 7.00 8.00
Figure 3. Linearity plots for malic, ascorbic, shikimic and citric acids; UV at 210 nm.
Area
-2.0x10 5
0.0
2.0x10 5
4.0x10 5
6.0x10 5
8.0x10 5
1.0x10 6
Conc. (ppm)0.00 20.00 40.00 60.00 80.00 100.00 120.00 140.00 160.00
absorbic
Area
-100000
0
100000
200000
300000
400000
500000
Conc. (ppm)0.00 100.00 200.00 300.00 400.00 500.00 600.00
malic
shikimic
Area
0
200000
400000
600000
800000
Conc. (ppm)0.00 2.00 4.00 6.00 8.00 10.00 12.00 14.00 16.00 18.00 20.00
shikimic
Area
-2.0x10 5
0.0
2.0x10 5
4.0x10 5
6.0x10 5
8.0x10 5
1.0x10 6
Conc. (ppm)0.00 200.00 400.00 600.00 800.00
Area
-2.0x10 5
0.0
2.0x10 5
4.0x10 5
6.0x10 5
8.0x10 5
1.0x10 6
Conc. (ppm)0.00 20.00 40.00 60.00 80.00 100.00 120.00 140.00 160.00
absorbic
Area
-100000
0
100000
200000
300000
400000
500000
Conc. (ppm)0.00 100.00 200.00 300.00 400.00 500.00 600.00
malic
shikimic
Area
0
200000
400000
600000
800000
Conc. (ppm)0.00 2.00 4.00 6.00 8.00 10.00 12.00 14.00 16.00 18.00 20.00
shikimic
Area
-2.0x10 5
0.0
2.0x10 5
4.0x10 5
6.0x10 5
8.0x10 5
1.0x10 6
Conc. (ppm)0.00 200.00 400.00 600.00 800.00
R2 = 0.99989 R2 = 0.99987
R2 = 0.99986 R2 = 0.99991
Malic Acid Ascorbic Acid
Shikimic Acid Citric Acid
Figure 3 presents examples of the linearity plots for four of the organic acids. These four, as well as the other six organic acids, all resulted in R2 values > 0.999.
4
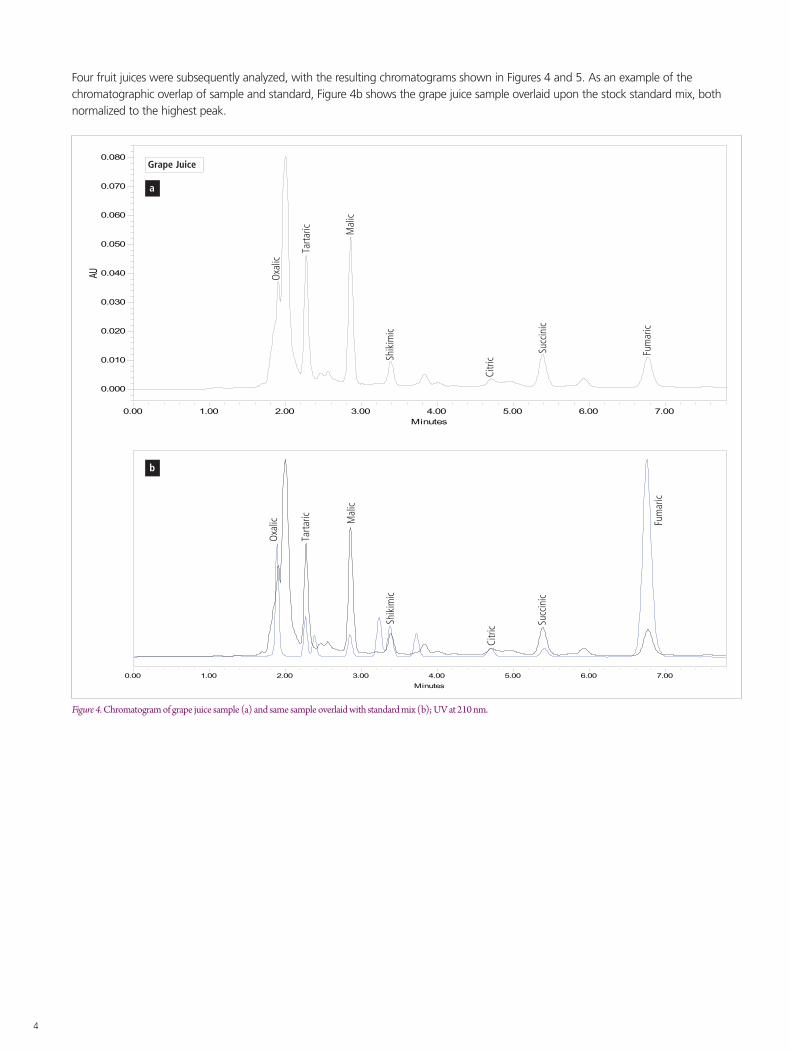
Four fruit juices were subsequently analyzed, with the resulting chromatograms shown in Figures 4 and 5. As an example of the chromatographic overlap of sample and standard, Figure 4b shows the grape juice sample overlaid upon the stock standard mix, both normalized to the highest peak.
Figure 4. Chromatogram of grape juice sample (a) and same sample overlaid with standard mix (b); UV at 210 nm.
AU
0.000
0.010
0.020
0.030
0.040
0.050
0.060
0.070
0.080
Minutes0.00 1.00 2.00 3.00 4.00 5.00 6.00 7.00
Minutes0.00 1.00 2.00 3.00 4.00 5.00 6.00 7.00
Oxa
lic
Tarta
ric Mal
ic
Shik
imic
Citri
c Succ
inic
Fum
aric
Oxa
lic
Tarta
ric Mal
ic
Shik
imic
Citri
c
Succ
inic
Fum
aric
Grape Juice
a
b

5
Qui
nic
Asco
rbic
Figure 5. Chromatograms of orange, apple and cranberry juice samples, with identified organic acids; UV at 210 nm.
AU
0.000
0.010
0.020
0.030
0.040
0.050
0.060
0.070
0.080
0.090
0.100
0.110
Minutes
0.00 1.00 2.00 3.00 4.00 5.00 6.00 7.00
AU
0.000
0.010
0.020
0.030
0.040
0.050
0.060
0.070
0.080
0.090
0.100
Minutes
0.00 1.00 2.00 3.00 4.00 5.00 6.00 7.00
AU
0.000
0.010
0.020
0.030
0.040
0.050
Minutes
0.00 1.00 2.00 3.00 4.00 5.00 6.00 7.00
Mal
ic
Shik
imic
Citri
c
Mal
ic
Shik
imic
Citri
c
Fum
aric
Orange Juice
Apple Juice
Cranberry Juice
Oxa
lic
Mal
ic
Shik
imic
Citri
c
Fum
aric
Asco
rbic
Asco
rbic
For a complete listing of our global offices, visit www.perkinelmer.com/ContactUs
Copyright ©2015, PerkinElmer, Inc. All rights reserved. PerkinElmer® is a registered trademark of PerkinElmer, Inc. All other trademarks are the property of their respective owners. 012299_01 PKI
PerkinElmer, Inc. 940 Winter Street Waltham, MA 02451 USA P: (800) 762-4000 or (+1) 203-925-4602www.perkinelmer.com
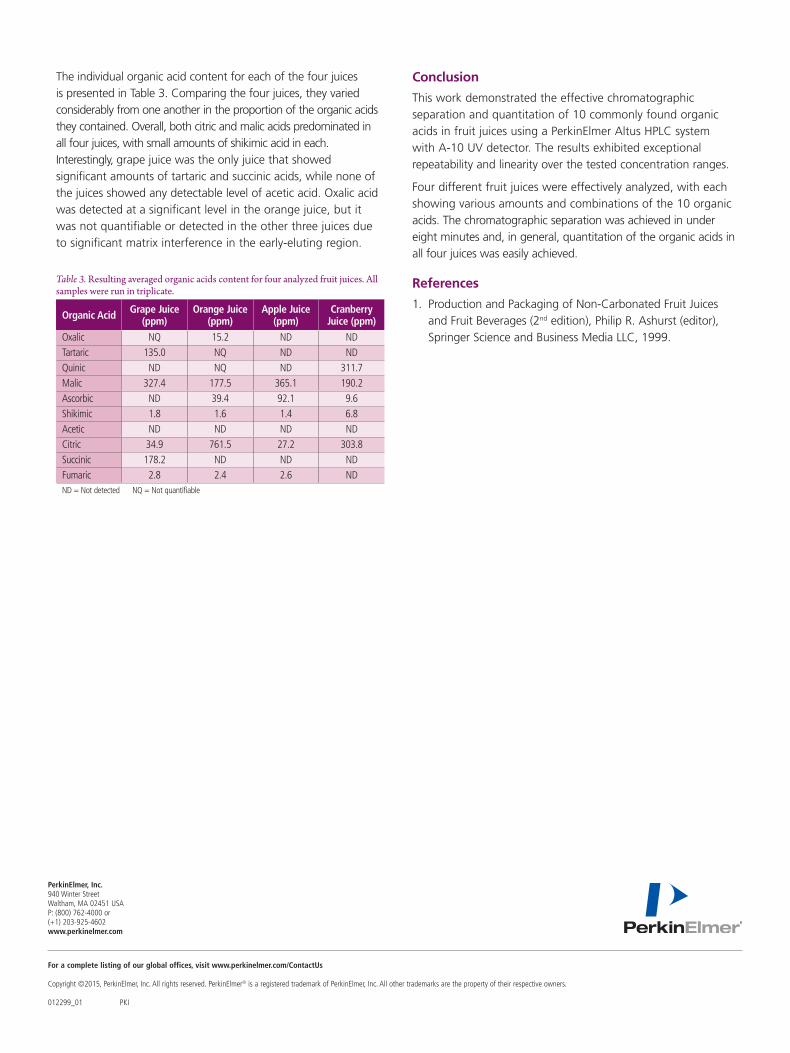
The individual organic acid content for each of the four juices is presented in Table 3. Comparing the four juices, they varied considerably from one another in the proportion of the organic acids they contained. Overall, both citric and malic acids predominated in all four juices, with small amounts of shikimic acid in each. Interestingly, grape juice was the only juice that showed significant amounts of tartaric and succinic acids, while none of the juices showed any detectable level of acetic acid. Oxalic acid was detected at a significant level in the orange juice, but it was not quantifiable or detected in the other three juices due to significant matrix interference in the early-eluting region.
Conclusion
This work demonstrated the effective chromatographic separation and quantitation of 10 commonly found organic acids in fruit juices using a PerkinElmer Altus HPLC system with A-10 UV detector. The results exhibited exceptional repeatability and linearity over the tested concentration ranges.
Four different fruit juices were effectively analyzed, with each showing various amounts and combinations of the 10 organic acids. The chromatographic separation was achieved in under eight minutes and, in general, quantitation of the organic acids in all four juices was easily achieved.
References
1. Production and Packaging of Non-Carbonated Fruit Juices and Fruit Beverages (2nd edition), Philip R. Ashurst (editor), Springer Science and Business Media LLC, 1999.
Table 3. Resulting averaged organic acids content for four analyzed fruit juices. All samples were run in triplicate.
Organic Acid Grape Juice (ppm)
Orange Juice (ppm)
Apple Juice (ppm)
Cranberry Juice (ppm)
Oxalic NQ 15.2 ND NDTartaric 135.0 NQ ND NDQuinic ND NQ ND 311.7Malic 327.4 177.5 365.1 190.2Ascorbic ND 39.4 92.1 9.6Shikimic 1.8 1.6 1.4 6.8Acetic ND ND ND NDCitric 34.9 761.5 27.2 303.8Succinic 178.2 ND ND NDFumaric 2.8 2.4 2.6 NDND = Not detected NQ = Not quantifiable