analysis of polarimetric terahertz imaging for non ...cbaird/windmartinthesispresjan2016.pdf ·...
TRANSCRIPT

Learning with PurposeLearning with Purpose
Analysis of Polarimetric Terahertz Imaging for Non-Destructive
Detection of Subsurface Defects in Wind Turbine Blades
By Robert W. Martin
Thesis Advisor: Dr. Christopher Baird
Committee MembersDr. Thomas Goyette
Dr. Christopher Niezrecki
Dr. Viktor Podolskiy

Learning with Purpose
Introduction
Methodology
• Theory
• Samples and Radar Ranges
Results
• Composite ISAR Images
• Quantitative Evaluation
Future Work
Conclusions
Literature Cited
OutlineOutline

Learning with Purpose
IntroductionIntroduction
Learning with Purpose
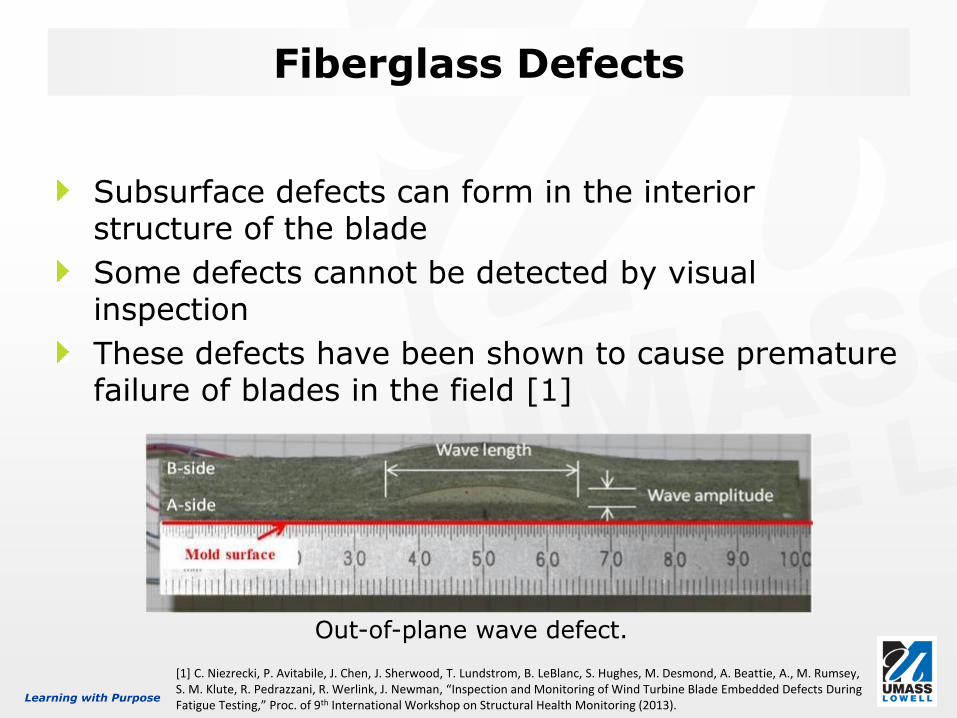
Subsurface defects can form in the interior structure of the blade
Some defects cannot be detected by visual inspection
These defects have been shown to cause premature failure of blades in the field [1]
Fiberglass DefectsFiberglass Defects
Out-of-plane wave defect.
[1] C. Niezrecki, P. Avitabile, J. Chen, J. Sherwood, T. Lundstrom, B. LeBlanc, S. Hughes, M. Desmond, A. Beattie, A., M. Rumsey, S. M. Klute, R. Pedrazzani, R. Werlink, J. Newman, “Inspection and Monitoring of Wind Turbine Blade Embedded Defects During Fatigue Testing,” Proc. of 9th International Workshop on Structural Health Monitoring (2013).
Learning with Purpose
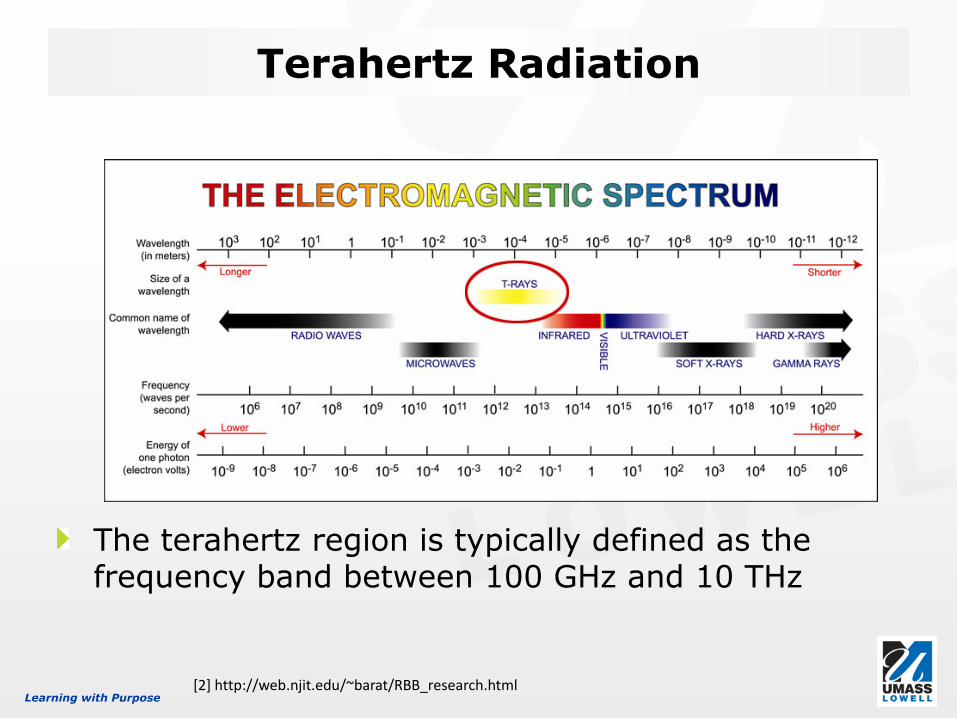
The terahertz region is typically defined as the frequency band between 100 GHz and 10 THz
Terahertz RadiationTerahertz Radiation
[2] http://web.njit.edu/~barat/RBB_research.html

Learning with Purpose
Previous investigations have indicated that terahertz radiation can detect subsurface defects in composite fiberglass
Both terahertz time domain spectroscopy (TDS) and frequency modulated continuous wave (FMCW) techniques have been used to test fiberglass materials for defects
Previous investigations have not included collection of fully polarimetric scattering data
Prior WorkPrior Work

Learning with Purpose
MethodologyMethodology

Learning with Purpose
Radar (Scattering) cross section (σ)
Radar Cross SectionRadar Cross Section
Scattering of polarized radiation can be described using the Sinclair matrix

Learning with Purpose
The Sinclair matrix can be diagonalized and meaningful parameters can be extracted
Euler ParametersEuler Parameters
The parameters m, γ, τ, ψ, and ν are known as the
Euler Parameters

Learning with Purpose
Euler ParametersEuler Parameters
The four angle parameters that contain phenomenological information about the scattering object
Learning with Purpose
Synthetic Aperture RadarSynthetic Aperture Radar
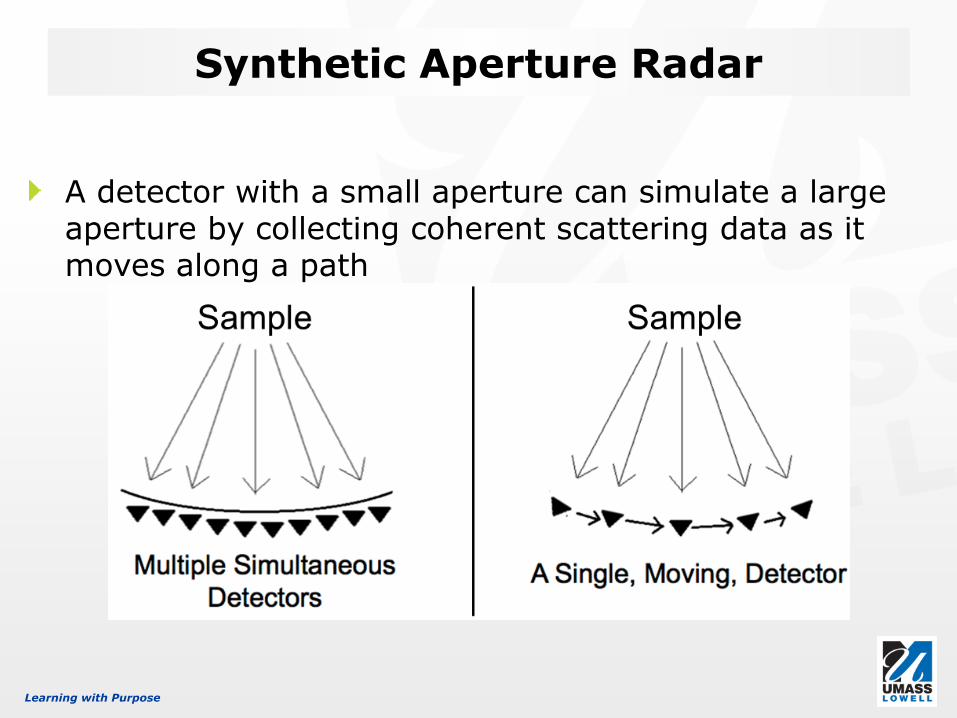
A detector with a small aperture can simulate a large aperture by collecting coherent scattering data as it moves along a path

Learning with Purpose
Alternatively, a small detector can collect scattering data while the sample is rotated to achieve the same effect
Inverse Synthetic Aperture RadarInverse Synthetic Aperture Radar
Data collected as a function of frequency and angle azimuth can be Fourier Transformed to an image in range and crossrange

Learning with Purpose
Image Back RotationImage Back Rotation
Learning with Purpose
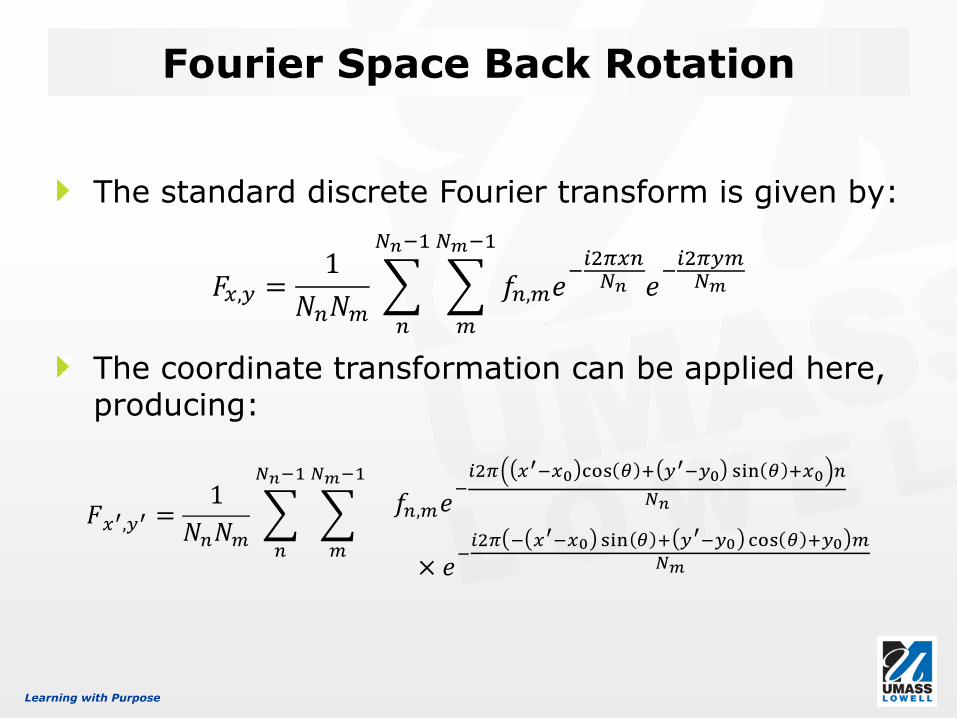
The standard discrete Fourier transform is given by:
The coordinate transformation can be applied here, producing:
Fourier Space Back RotationFourier Space Back Rotation

Learning with Purpose
After back-rotation, the pixels from different ISAR images can be averaged to produce and single composite ISAR image
Composite ImagesComposite Images

Learning with Purpose
Pixels within each user defined region are compared to quantify contrast
Quantitative EvaluationQuantitative Evaluation

Learning with Purpose
Defect imaging score
= 0.928
Defect imaging score
= 0.184
Histogram Scoring MethodHistogram Scoring Method

Learning with Purpose
Sample 1 contains out-of-plane wave defects and resin-dry patches.
Fiberglass Sample 1Fiberglass Sample 1

Learning with Purpose
Sample 2 contains microballoons, mold and grease inserts, and voids in an adhesive layer
Fiberglass Sample 2Fiberglass Sample 2

Learning with Purpose
Sample 3 contains two kinds of out-of-plane wave defects and a thickness variation
Fiberglass Sample 3Fiberglass Sample 3

Learning with Purpose
Sample 4 contains three out-of-plane wave defects
Fiberglass Sample 4Fiberglass Sample 4
Learning with Purpose
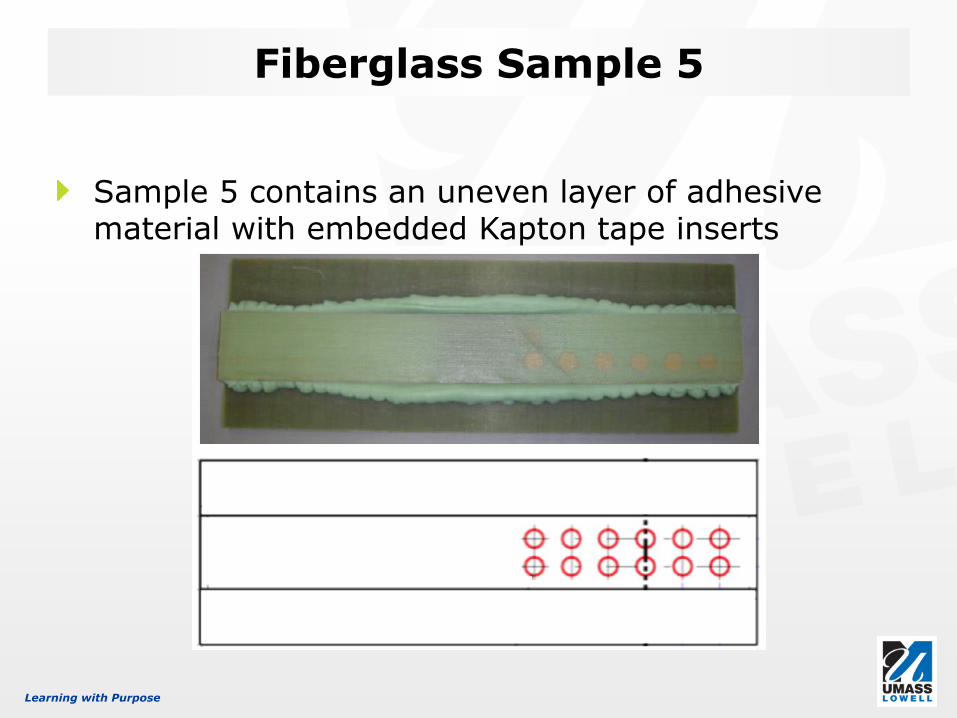
Sample 5 contains an uneven layer of adhesive material with embedded Kapton tape inserts
Fiberglass Sample 5Fiberglass Sample 5

Learning with Purpose
Sample 6 (similar to sample 1) contains out-of-plane wave defects and resin dry patches
The sample also contains an unintentional surface defect
Fiberglass Sample 6Fiberglass Sample 6
Learning with Purpose
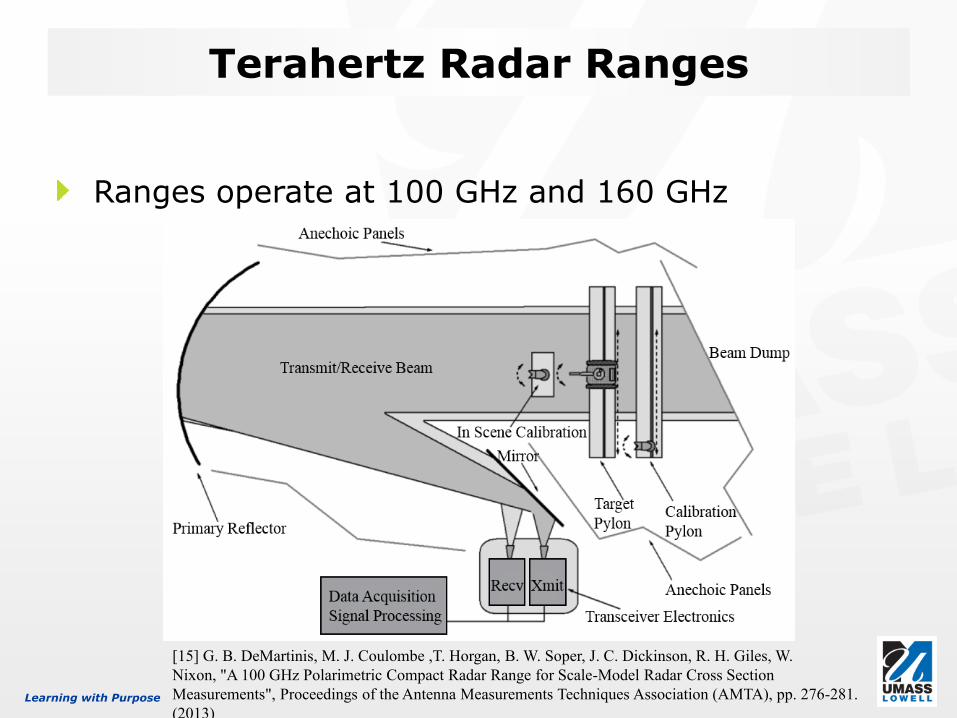
Ranges operate at 100 GHz and 160 GHz
Terahertz Radar RangesTerahertz Radar Ranges
[15] G. B. DeMartinis, M. J. Coulombe ,T. Horgan, B. W. Soper, J. C. Dickinson, R. H. Giles, W.
Nixon, "A 100 GHz Polarimetric Compact Radar Range for Scale-Model Radar Cross Section
Measurements", Proceedings of the Antenna Measurements Techniques Association (AMTA), pp. 276-281.
(2013)

Learning with Purpose
ResultsResults

Learning with Purpose
0° azimuth, 25° elevation, 160 GHz
Single Azimuth ISAR ImagesSingle Azimuth ISAR Images
Single Azimuth HH ISAR Image of Sample 1

Learning with Purpose
360 images composited, 25° elevation, 160 GHz
Composite ISAR ImagesComposite ISAR Images
Composite HH ISAR Image of Sample 1

Learning with Purpose
360 images composited, 25° elevation, 160 GHz
Composite ISAR ImagesComposite ISAR Images
Composite HH ISAR Image of Sample 2

Learning with Purpose
360 images composited, 30° elevation, 100 GHz
Composite ISAR ImagesComposite ISAR Images
Composite HH ISAR Image of Sample 3

Learning with Purpose
360 images composited, 30° elevation, 100 GHz
Composite ISAR ImagesComposite ISAR Images
Composite m parameter ISAR image of Sample 3

Learning with Purpose
Composite ISAR ImagesComposite ISAR Images
Composite angular Euler parameter ISAR images
ν
parameter
τ
parameter
ψ
parameter
γ
parameter

Learning with Purpose
360 images composited, 100 GHz
Composite ISAR ImagesComposite ISAR ImagesComposite m parameter ISAR images at other
elevations
45° elevation 60° elevation

Learning with Purpose
360 images composited, 100 GHz
Back-Rotation Algorithm AnalysisBack-Rotation Algorithm AnalysisComposite m parameter ISAR image using Fourier
space back-rotation
Fourier Space Rotation
Normal Space
Rotation

Learning with Purpose
360 images composited, 30° elevation, 100 GHz
Composite ISAR ImagesComposite ISAR Images
Sample 4 composite m parameter ISAR image

Learning with Purpose
360 images composited, 30° elevation, 100 GHz
Composite ISAR ImagesComposite ISAR Images
Sample 5 composite m parameter ISAR image
Learning with Purpose
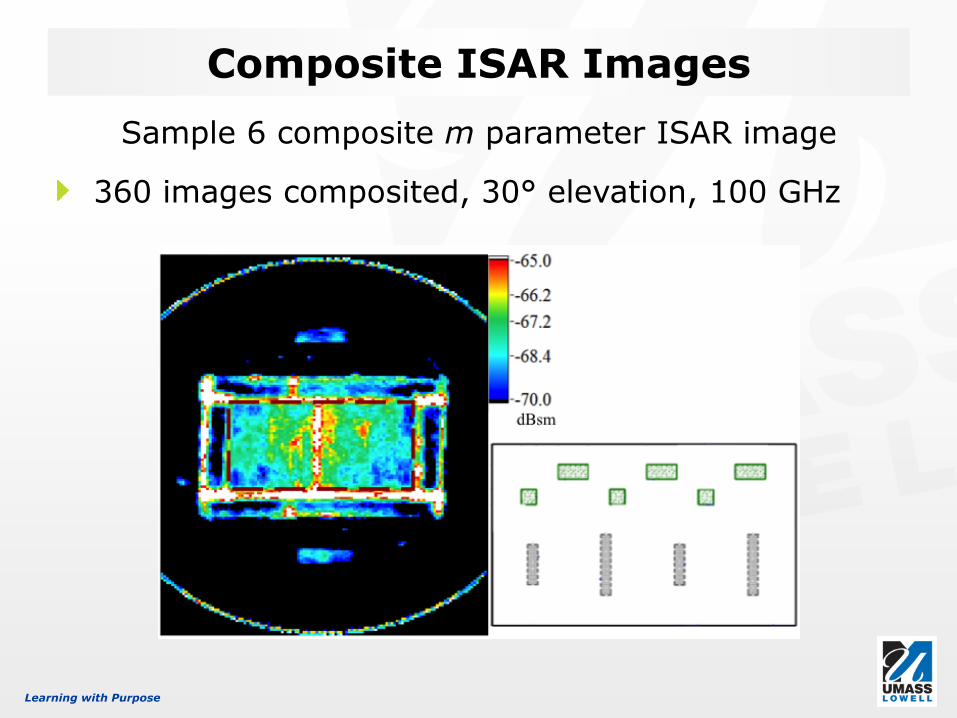
360 images composited, 30° elevation, 100 GHz
Composite ISAR ImagesComposite ISAR Images
Sample 6 composite m parameter ISAR image

Learning with Purpose
Quantitative EvaluationQuantitative Evaluation
Defect Imaging Scores for a defect in Sample 3
ISAR image type defect
imaging
score
HH polarization RCS 0.715
HV polarization RCS 0.619
VH polarization RCS 0.640
VV polarization RCS 0.635
m Euler parameter 0.532
γ Euler parameter 0.864
τ Euler parameter 0.910
ψ Euler parameter 0.828
υ Euler parameter 0.636

Learning with Purpose
The scores for this defect were determined using different numbers of ISAR images in the composite
Parameter OptimizationParameter Optimization
Number of ISAR images in composite

Learning with Purpose
This process was repeated for multiple defects
The defect imaging scores for each of these defects were averaged together
Parameter OptimizationParameter Optimization
Multiple defects averaged together

Learning with Purpose
Parameter OptimizationParameter Optimization
Average defect imaging scores for multiple defects
ISAR image type defect
imaging
score
HH polarization RCS 0.706
HV polarization RCS 0.679
VH polarization RCS 0.683
VV polarization RCS 0.595
m Euler parameter 0.562
γ Euler parameter 0.850
τ Euler parameter 0.804
ψ Euler parameter 0.748
υ Euler parameter 0.722

Learning with Purpose
Parameter OptimizationParameter Optimization
Effect of Balance Parameter on defect region

Learning with Purpose
Parameter OptimizationParameter Optimization
Effect of balance parameter in non-defect region

Learning with Purpose
Parameter OptimizationParameter Optimization
Difference between balance parameter plots

Learning with Purpose
Different Compositing MethodsDifferent Compositing Methods
compositing method A B C D E F G H
HH polarization RCS 0.706 0.648 0.689 0.737 0.729 0.649 0.642 0.647
HV polarization RCS 0.679 0.631 0.631 0.665 0.686 0.617 0.619 0.608
VH polarization RCS 0.683 0.643 0.637 0.663 0.681 0.632 0.635 0.619
VV polarization RCS 0.595 0.604 0.586 0.632 0.675 0.598 0.605 0.591
m Euler parameter 0.562 0.527 0.580 0.632 0.684 0.529 0.530 0.526
γ Euler parameter 0.850 0.882 0.842 0.809 0.798 0.857 0.856 0.874
τ Euler parameter 0.804 0.748 0.788 0.785 0.804 0.797 0.790 0.808
ψ Euler parameter 0.748 0.704 0.690 0.673 0.605 0.780 0.740 0.742
υ Euler parameter 0.722 0.687 0.724 0.739 0.721 0.702 0.696 0.697
method A mean of all pixels above the threshold for each range/crossrange cell method B median of all pixels above the threshold for each range/crossrange cell
method C include brightest 50% of pixels above the threshold for each range/crossrange cell
method D include brightest 25% of pixels above the threshold for each range/crossrange cell
method E include brightest 10% of pixels above the threshold for each range/crossrange cell
method F exclude brightest 10% of pixels above the threshold for each range/crossrange cell
method G exclude brightest 20% of pixels above the threshold for each range/crossrange cell
method H exclude brightest and dimmest 10% of pixels above the threshold for each range/crossrange cell

Learning with Purpose
360 images composited, median image composition method
Combining the Optimum ParametersCombining the Optimum Parameters
Composite m parameter ISAR image of Sample 3
Learning with Purpose
Continue to apply the technique to different fiberglass defects and other wind turbine blade structures
Investigate the benefits of other SAR techniques, such as interferometric ISAR (IFISAR), az-el scans, and full 3D ISAR
Take full advantage of the electromagnetic characteristics of the sample materials
Investigate other polarimetric transformations
Future WorkFuture Work
Learning with Purpose
Terahertz radiation has been proven capable of detection subsurface defects in fiberglass materials.
The image compositing algorithm offers significant improvements in defect detection over traditional single-azimuth ISAR images.
The Euler m parameter has been shown to produce the best contrast between defect and defect free-regions
ConclusionsConclusions

Learning with Purpose
1. C. Niezrecki, P. Avitabile, J. Chen, J. Sherwood, T. Lundstrom, B. LeBlanc, S. Hughes, M. Desmond, A. Beattie, A., M. Rumsey, S. M. Klute,
R. Pedrazzani, R. Werlink, J. Newman, “Inspection and Monitoring of Wind Turbine Blade Embedded Defects During Fatigue Testing,” Proc. of
9th International Workshop on Structural Health Monitoring (2013).
2. http://web.njit.edu/~barat/RBB_research.html
3. B. LeBlanc, C. Niezrecki, P. Avitabile, J. Chen, J. Sherwood, “Damage Detection and Full Surface Characterization of a Wind Turbine Blade
Using Three-Dimensional Digital Image Correlation,” Structural Health Monitoring, 12, 430-439, (2013).
4. D. Roach, S. Neidigk, T. Rice, R. Duvall, J. Paquette, “Blade Reliability Collaborative: Development and Evaluation of Nondestructive
Inspection Methods for Wind Turbine Blades,” Sandia National Labs, Sandia Report SAND2014-16965 (2014).
5. E. Cristofani, F. Friederich, S. Wohnsiedler, C. Matheis, J. Jonuscheit, M. Vendewal, R. Beigang, “Nondestructive Testing Potential Evaluation
of a Terahertz Frequency-Modulated Continuous-Wave Imager for Composite Materials Inspection,” Optical Engineering 53(3), 031211 (2014).
6. M. Vandewal, E. Cristofani, A. Brook, W. Vleugels, F. Ospald, R. Beigang, S. Wohnsiedler, C. Matheis, J. Jonuscheit, J. P. Guillet, B. Recur,
P. Mounaix, I. Manek Honninger, P. Venegas, I. Lopez, R. Martinez, Y. Sternburg, “Structural Health Monitoring using a Scanning THz System,”
38th International Conference on Infrared, Millimeter, and Terahertz Waves, 6665870 (2013).
7. R. Osplad, W. Zouaghi, R. Beigang, C. Matheis, J. Jonuscheit, B. Recur, J. P. Guillet, P. Mounaix, W. Vleugels, P. V. Bosom, L. V. Gonzalez,
I. Lopez, R. M. Edo, “Aeronautic composite material inspection with a terahertz time-domain spectroscopy system,” Optical Engineering 53(3),
031208 (2014).
8. F. Friederich, E. Cristofani, C. Matheis, J. Jonuscheit, R. Beigang, M. Vandewal, “Continuous Wave Terahertz Inspection of Glass Fiber
Reinforced Plastics with Semi-automatic 3D Image Processing for Enhanced Defect Detection,” IEEE International Microwave Symposium,
6848486 (2014).
9. J. W. Park, K. H. Im, I. Y. Yang, S. K. Kim, S. J. Kang, Y. T. Cho, J. A. Jung, D. K. Hsu, “Terahertz Radiation NDE of Composite Materials
for Wind Turbine Applications,” International Journal of Precision Engineering and Manufacturing 15(6), 1247-1254 (2014).
10. D. J. Barnard, C. P. Chiou, Presented on the Iowa State University Center for Nondestructive Evaluation Website
https://www.cnde.iastate.edu/research-areas/terahertz-imaging/wind-energy Retrieved September 2014 (Unpublished).
11. E. F. Knott, J. F. Shaeffer, M. T. Tuley, Radar Cross Section, 2nd Ed. (Artech House, Boston, 1993).
12. C. S. Baird, “Design and Analysis of an Euler Transformation Algorithm Applied to Full-Polarimetric ISAR Imagery,” PhD dissertation, STL,
University of Massachusetts Lowell, 2007.
13. J. D. Jackson, Classical Electrodynamics, 3rd Ed. (John Wiley & Sons, New York, 1999).
14. D. L. Mensa, High Resolution Cross–Section Imaging (Artech House, Boston, 1991).
15. G. B. DeMartinis, M. J. Coulombe ,T. Horgan, B. W. Soper, J. C. Dickinson, R. H. Giles, W. Nixon, "A 100 GHz Polarimetric Compact
Radar Range for Scale-Model Radar Cross Section Measurements", Proceedings of the Antenna Measurements Techniques Association (AMTA),
pp. 276-281. (2013)
Literature CitedLiterature Cited

Learning with Purpose
Dr. Christopher Baird
Dr. Christopher Niezrecki
The WINDSTAR IAB
Sandia National Laboratories
TPI Composites Inc.
Submillimeter-Wave Technology Laboratory
• Tom Horgan, Larry Horgan, and Lucy Deroeck
• Dr. Robert Giles, Jason Dickinson, Dr. Tom Goyette, and Michael Coulombe
AcknowledgmentsAcknowledgments

Learning with Purpose
Questions?Questions?