analysis of regulatory compliance costs: part ii
TRANSCRIPT

Analysis of Regulatory Compliance Costs: Part II
Several factors influence the vitality and competitiveness of Canadian businesses. A key factor is the regulatory and administrative environment in which they operate. Business owners have long been concerned by the amount of government paperwork they have to complete and the number of administrative tasks they have to perform. The concern is that excessive paperwork unnecessarily steals time away from core value-added activities — producing and selling goods and services — and, ultimately, leads to higher operating costs. In essence, these additional costs function like a form of tax. Consumers bear a portion of the cost in the form of higher prices; businesses bear a portion in the form of lower profits for owners and lower wages for employees. This is in addition to the cost incurred by the regulatory agencies themselves (the cost of developing, administering and enforcing the regulations), which also translates into costs for taxpayers. It is important to note
that, although regulations are costly, they generate
benefits as well. Regulations protect
the health and safety of Canadian citizens.
They preserve the quality of the environment and
facilitate efficient operation of competitive markets.
Table of ContentsHighlights ........................................................3Paperwork Time Burden ...................................................... 3Costs of Paperwork Compliance ......................................... 3Paperwork Simplification ..................................................... 3
Background .....................................................4Findings ..........................................................5Analysis of Regulatory Compliance Costs: Part I — A Brief Review ..................................5Difficulties of Measuring Burden .......................................... 6
Paperwork Time Burden ................................6Total and Average Paperwork Time Burden ........................ 6Relationship between Time Burden and Quantity of Paperwork ......................................................... 8Economic Impact — Productivity Drag ................................ 9
Monetary Costs of Paperwork Compliance ...10Paperwork Compliance Costs ........................................... 10Calculating Paperwork Compliance Costs ........................ 11Total Compliance Costs ..................................................... 11Trend Analysis of Total Compliance Cost Data by Regulatory Requirement.................................................... 12 Average Compliance Costs ............................................... 13 Differences between Companies of Different Sizes .......... 14 Average Costs per Employee ............................................ 14 Cautionary Note.................................................................15
Paperwork Simplification.............................15Responsibilities of Regulators ........................................... 17Economy-Wide Impact of Successful Paperwork Burden Reduction Initiatives .......................................................... 17
Conclusions ..................................................18
Paperwork time burden, costs of paperwork compliance and paperwork simplification
December 2010

2 Analysis of Regulatory Compliance Costs 33Part II
They protect ownership rights and enforce contractual agreements. Regulations also support proper functioning of the fiscal system. The paperwork requirements that accompany tax reporting, for instance, are a necessary device used by government to ensure proper collection and use of taxes. Without this reporting, the government could not conduct its fiscal responsibilities effectively.
When discussing regulatory reform and paperwork burden reduction, therefore, the objective should not be to eliminate regulations and reporting requirements completely. Rather the issue should be to determine the right balance of regulation and paperwork reporting that produces the desired benefits for society while limiting costs. Unfortunately,
determining the right balance is quite complex because the answer is largely embedded in a value judgment.
This report, therefore, does not attempt to determine what the proper balance is. It does, however, showcase a variety of information on regulatory compliance activities and highlight statistics on the time and cost burden of paperwork compliance on small and medium-sized enterprises (SMEs). This research should help government investigate, within an objective framework, whether the amount of paperwork imposed on businesses is excessive, bring to light various implications related to SME paperwork and help policy-makers develop initiatives to reduce compliance costs.

2 Analysis of Regulatory Compliance Costs 33Part II
Small and medium-sized enterprises •included in the survey target population spent approximately 10.4 million hours in 2008 complying with the 12 regulations covered in the survey. This equates to an average annual time burden of 18 hours per establishment. The total and average paperwork time burden declined moderately between 2005 and 2008, with the total paperwork time burden dropping by 8 percent and the average paperwork time burden dropping by 15.4 percent.There were consistent declines in the •paperwork time burden between 2005 and 2008 across regions, most notably in Ontario, British Columbia and the Atlantic provinces. In addition, the paperwork time burden declined for almost all regulations and across all industries. Survey results show that regulatory paperwork •still imposes a burden on SMEs and acts as a drag on labour productivity.
Costs of Paperwork ComplianceSMEs reported spending $1.09 billion in •2005 complying with the 12 regulations covered in the survey and $1.17 billion in 2008. This equates to an increase in nominal cost of approximately 7.3 percent. However, after considering the effects of inflation and the net increase in the number of new businesses in operation, adjusted real costs decreased by approximately 2.8 percent from 2005 levels.
Analysis shows that, in nominal terms, •average costs decreased only slightly between 2005 and 2008 from $2008 to $1982. After removing the effects of inflation, average real costs decreased by approximately 7.9 percent.The disproportionate impact of regulatory •compliance costs on smaller firms observed in 2005, and recorded in various other studies, was reconfirmed in 2008 statistics. Businesses with 1–4 employees, for instance, spent twice as much per employee on compliance as businesses with 5–19 employees ($657 and $313 respectively). Similarly, businesses with 5–19 employees spent twice as much per employee on compliance as businesses with 20–99 employees ($155) and four times as much as businesses with 100–499 employees ($74).
Paperwork SimplificationStatistics Canada asked respondents to •identify what they would “most” like to see improved about each of the 12 regulations covered in the survey. The majority of businesses reported that 11 of the 12 regulations were fine the way they were. However, at least a quarter of the businesses still felt that some paperwork simplification was necessary.
Highlights
Paperwork Time Burden

4 Analysis of Regulatory Compliance Costs 55Part II
Mandated by the federal government in 2005, Statistics Canada in partnership with Industry Canada created the Survey of Regulatory Compliance Costs to help government collect information on the cost and nature of the paperwork burden imposed on SMEs and to track changes in that burden over time. Survey results should help policy-makers identify problem areas for reform and develop initiatives to streamline the quantity and complexity of paperwork requirements. The survey was designed to support government efforts to develop quantitative evidence-based approaches for assessing the efficiency of the country’s regulatory system. Survey results investigate the relationship between paperwork burden and types of paperwork, region of operation and industry sector. In total, over 30 000 SMEs
were chosen to participate in the survey. The results were extrapolated to a target population of approximately 685 000 SMEs covering five sectors — manufacturing; retail trade; professional, scientific and technical services; accommodation and food services; and other services — and representing approximately 30 percent of the 2.3 million business establishments in Canada. Respondents answered questions regarding their paperwork experiences, including the volume of submissions, the complexity of forms, whether the paperwork was completed internally or externally, whether it was completed manually or electronically, the amount of time spent completing the paperwork, the cost and whether government efforts helped save businesses time and/or money.
Background

4 Analysis of Regulatory Compliance Costs 55Part II
FindingsThis section presents and studies the data received from survey respondents regarding their paperwork activities during the 2008 reporting period. Major areas of analysis surround the paperwork time burden, the cost burden, paperwork complexity and paperwork simplification. The report is organized into the following sections:
Analysis of Regulatory Compliance Costs: •Part I — A Brief Review
Difficulties of Measuring Burden –Paperwork Time Burden•
Total and Average Paperwork –Time BurdenRelationship between Time Burden and –Quantity of PaperworkEconomic Impact — Productivity Drag –
Monetary Costs of Paperwork Compliance•Paperwork Compliance Costs –Calculating Paperwork Compliance Costs –Total Compliance Costs –Trend Analysis of Total Compliance –Cost Data by Regulatory RequirementAverage Compliance Costs –Differences between Companies of –Different SizesAverage Costs per Employee –Cautionary Note –
Paperwork Simplification•Responsibilities of Regulators –Economy-Wide Impact of Successful –Paperwork Burden Reduction Initiatives
Conclusions•
Analysis of Regulatory Compliance Costs: Part I — A Brief Review The primary purpose of the Survey of Regulatory Compliance Costs is to quantify the paperwork burden imposed on Canada’s SMEs and to track changes in that burden over time. In Analysis of Regulatory Compliance Costs: Part I (April 2010), the paperwork burden was measured in terms of the total and average number of claims and forms prepared by SMEs. Survey results revealed that for the 12 regulations covered in the survey, 16 110 772 submissions were prepared in 2008 by the 685 000 SMEs included in the survey population (Figure 1). This suggests that, since 2005, the quantity of paperwork has decreased by approximately 8 percent, which, on average, translates into approximately three fewer submissions per business. Payroll remittances, sales tax submissions, Records of Employment (ROEs) and corporate tax instalments remained the major sources of the paperwork burden faced by SMEs. SMEs prepared and submitted over 5 million payroll remittances (averaging 12 per business), over 3.6 million sales tax submissions (averaging six per business), almost 1.7 million ROEs (averaging four per business) and 1 737 607 corporate tax instalments (averaging three per business).Survey results also revealed regional differences in the quantity of paperwork prepared by businesses. The average number of submissions per business ranged from a high of 29 in Quebec to a low of 23 in Ontario. A positive relationship exists between the quantity of paperwork and the workforce size as well. The difference in the number of claims and forms submitted by non-employer businesses and employer businesses is quite large. The average number of submissions per business increases from 7 to 25 when the business grows from zero employees to 1–4 employees. A business with 5–19 employees submits, on average, 40 submissions per year, while a business with 100–499 employees submits, on average, 162 submissions per year. The survey also confirmed that, based on the average number

6 Analysis of Regulatory Compliance Costs 77Part II
Quantifying paperwork burden is a challenging task, particularly because there is no precise definition of what constitutes burden. While the total and average number of claims and forms prepared by SMEs is an important component of the paperwork compliance process, and whose measurement is critical for developing a solid understanding of all dimensions of paperwork burden, it does not provide the best measure of burden per se.
The reason is that the quantity of paperwork prepared by SMEs does not necessarily reflect the actual amount of time and money spent by SMEs to comply with regulations. Consider, for example, a small retail store operating in Quebec that spends two hours a month filling out three claims/forms. Consider another comparable retail store operating in Ontario that spends one hour a month filling out three claims/forms. The number of claims/forms prepared by these two businesses is the
same but, for whatever reason (e.g., difference in complexity of forms), the total hours worked in Quebec is one hour more than the total hours worked in Ontario. Ultimately, what matters most to businesses is not the number of claims and forms they have to prepare, but the amount of time and money they have to spend filling them out. Consequently, paperwork burden is best measured in terms of time and cost rather than in terms of numbers of submissions.
Paperwork Time BurdenTotal and Average Paperwork Time BurdenTo measure paperwork time burden, Statistics Canada asked SMEs to estimate the amount of time spent by internal staff to prepare submissions for the 12 regulations covered in the survey. This included time spent to retrieve and review information, complete forms,
of submissions, paperwork is disproportionately burdensome to labour-intensive businesses. Manufacturing businesses, for instance, prepare
and submit almost twice as many submissions (37) as businesses in the professional, scientific and technical services industry (19).
Figure 1: Total and Average Number of Claims and Forms Submitted, 2005 and 2008
Source: Industry Canada calculations; and Statistics Canada, Survey of Regulatory Compliance Costs, 2005 and 2008.
0
2 250
4 500
6 750
9 000
11 250
13 500
15 750
18 000
20082005Year
Tota
l Sub
mis
sion
s
0
5
10
15
20
25
30
20082005Year
Sub
mis
sion
s pe
r Bus
ines
s
(thousand)
Difficulties of Measuring Burden

6 Analysis of Regulatory Compliance Costs 77Part II
submit forms, deal with follow-up, train staff to handle compliance activities, and meet and communicate with service professionals.
In total, SMEs included in the survey target population spent approximately 10.4 million hours in 2008 complying with the 12 regulations, an average annual time burden of 18 hours per establishment. The total and average paperwork time burden declined moderately between 2005 and 2008, with the total paperwork time burden dropping by 8 percent and the average paperwork time burden dropping by 15.4 percent.1
Many SMEs combined their internal resources with external service provider assistance (accountants, payroll service providers, etc.) to comply with paperwork. The statistics mentioned above reflect only the time spent on
compliance by internal staff and business owners. The time spent on compliance by external service providers is not included.
Except for payroll remittances, the average time spent on compliance decreased or remained the same between 2005 and 2008 (Table 1). For federal/provincial business income tax filing, the average compliance time in 2008 was almost half what it was in 2005. A possible explanation for the decrease is that, within the last three years, a growing percentage of businesses have started preparing their income tax claims and forms electronically rather than manually, which may have provided businesses with considerable savings in terms of both preparation and processing time.
Table 1: Total Time and Average Time per Business Spent on Compliance, by Regulation, 2005 and 2008
Source: Statistics Canada, Survey of Regulatory Compliance Costs, 2005 and 2008.
Regulation
Total Time (hours) Average Time (hours)
2005 2008 2005 2008Payroll Remittances 2 682 816 2 851 008 10 11
Record of Employment 659 328 504 192 4 4
T4 Summary / Individual T4 (including RL forms in Quebec) 537 216 402 432 3 2
Workers’ Compensation Remittances 462 144 445 056 3 3
Workers’ Compensation Claims 145 920 85 440 3 2
Federal/Provincial Business Income Tax Filing 1 704 000 1 023 744 10 6
Federal/Provincial Sales Tax 3 469 056 3 433 344 9 9
Corporate Tax Instalments 515 904 610 944 4 4
Corporate Registration 131 904 121 728 1 1
Mandatory Statistics Canada Surveys 526 656 513 792 3 3
Municipal Operating Licences and Permits 168 384 144 768 1 1
Provincial Operating Licences and Permits 223 488 219 648 2 2
All Regulations 11 227 008 10 356 096 21 18
The survey also captured changes in paperwork time burden for businesses of different sizes. Most of the decline highlighted above was concentrated among smaller enterprises. Non-employers (SMEs with zero employees) spent
five hours less on compliance, on average, in 2008 than in 2005 (12 hours in 2005 and 7 hours in 2008); SMEs with 1–4 employees spent three hours less (18 hours in 2005 and 15 hours in 2008) and there was no change in
1 The average paperwork time burden dropped because of a decrease in total paperwork time burden combined with a net increase in the number of new businesses in operation.

8 Analysis of Regulatory Compliance Costs 99Part II
the amount of time spent by SMEs with 5–19 employees (26 hours in both 2005 and 2008). SMEs with 20–99 employees spent two hours more on compliance, on average, in 2008 (42 hours) than in 2005 (40 hours), while SMEs with 100–499 employees spent 13 hours more, on average (67 hours in 2005 and 80 hours in 2008).
An analysis of paperwork time burden by region revealed that the average amount of time spent by SMEs complying with the 12 regulations decreased in all regions, most notably in Ontario, British Columbia and the Atlantic provinces (Figure 2).
Figure 2: Average Time Spent on Compliance per Establishment, by Region, 2005 and 2008
Source: Statistics Canada, Survey of Regulatory Compliance Costs, 2005 and 2008.
Aver
age
Tim
e (h
ours
)
0
5
10
15
20
25
30
20082005
PrairiesOntarioCanadaBritish ColumbiaQuebecAtlantic
24
21 2119
21
18
21
1820
16
2019
Although not shown above, there was a decline in paperwork time burden across industries as well. Businesses in the professional, scientific and technical services industry saw the largest decline (-21 percent), followed by manufacturing (-18 percent), retail trade (-9.6 percent), accommodation and food services (-8.4 percent) and other services (-8.2 percent).
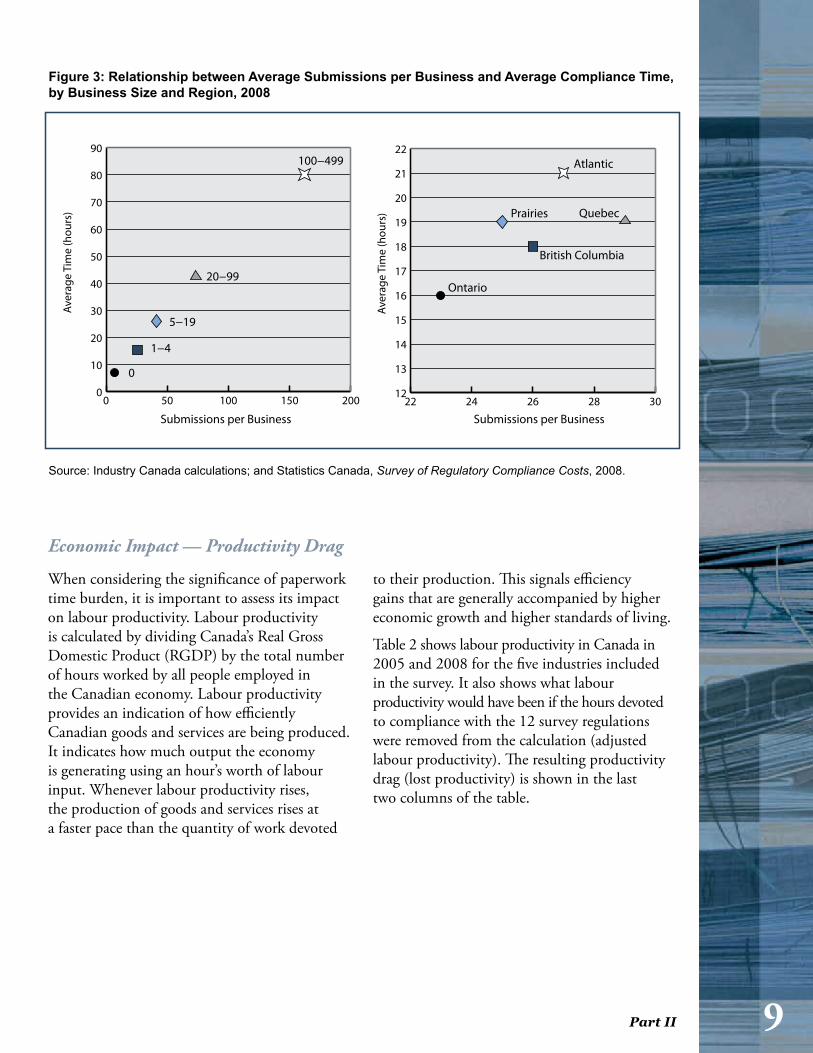
Relationship between Time Burden and Quantity of PaperworkFigure 3 illustrates the relationship between the average number of claims and forms submitted by businesses and the average compliance time by business size and region for 2008. The figure shows a positive relationship between business size, average compliance time and average number
of submissions. Businesses with zero employees submit, on average, seven submissions per year and spend seven hours complying, while businesses with 100–499 employees submit, on average, 162 submissions per year and spend 80 hours complying.
Figure 3 also highlights regional variations. Because businesses in Quebec prepare more submissions, on average, than businesses in other regions, it is reasonable to suspect that they would spend more time on compliance as well.2 However, the amount of time spent on compliance by businesses in Quebec seems comparable.
2 For many requirements in Quebec, including income taxes and T4 filing requirements, businesses must complete a provincial form that businesses in other regions are not required to complete.
8 Analysis of Regulatory Compliance Costs 99Part II
When considering the significance of paperwork time burden, it is important to assess its impact on labour productivity. Labour productivity is calculated by dividing Canada’s Real Gross Domestic Product (RGDP) by the total number of hours worked by all people employed in the Canadian economy. Labour productivity provides an indication of how efficiently Canadian goods and services are being produced. It indicates how much output the economy is generating using an hour’s worth of labour input. Whenever labour productivity rises, the production of goods and services rises at a faster pace than the quantity of work devoted
to their production. This signals efficiency gains that are generally accompanied by higher economic growth and higher standards of living.
Table 2 shows labour productivity in Canada in 2005 and 2008 for the five industries included in the survey. It also shows what labour productivity would have been if the hours devoted to compliance with the 12 survey regulations were removed from the calculation (adjusted labour productivity). The resulting productivity drag (lost productivity) is shown in the last two columns of the table.
Figure 3: Relationship between Average Submissions per Business and Average Compliance Time, by Business Size and Region, 2008
Source: Industry Canada calculations; and Statistics Canada, Survey of Regulatory Compliance Costs, 2008.
Submissions per Business
0 50 100 150 2000
10
20
30
40
50
60
70
80
90
Aver
age
Tim
e (h
ours
)
0
1−4
5−19
20−99
100−499
22 24 26 28 3012
13
14
15
16
17
18
19
20
21
22
Aver
age
Tim
e (h
ours
)
Submissions per Business
Ontario
Prairies
British Columbia
Atlantic
Quebec
Economic Impact — Productivity Drag

10 Analysis of Regulatory Compliance Costs 1111Part II
Table 2 demonstrates that labour productivity would have increased from $31.59/hour to $31.62/hour in 2005 and $31.85/hour to $31.88/hour in 2008 if SMEs did not have to devote so much of their time to regulatory compliance.3 In addition, labour productivity growth would have increased by approximately 11.5 percent, from 0.823 percent to 0.918 percent, if 2008 productivity drag were removed.
The importance of this measure is that it allows policy-makers to examine the effect of regulatory paperwork on labour productivity over time to determine whether it is progressing or declining relative to normal levels. For instance, an increasing trend in productivity drag relative to a 6- or 12-year moving average could signal that the paperwork burden is growing beyond normal levels and that corrective action is necessary.
3 A word of caution is necessary when interpreting these results. Some of the information gathered by businesses to comply with government paperwork provides useful information for management purposes and would be gathered anyway, even if the regulations did not exist. For instance, much of the information gathered for tax reporting is also necessary for financial reporting purposes. For this reason, productivity drag as calculated above, which shows the effect of removing from the calculation the total number of hours devoted to regulatory paperwork, might be overstated.
Monetary Costs of Paperwork CompliancePaperwork Compliance CostsIn general, there are two kinds of compliance costs — explicit and implicit. Explicit costs are those that require the actual payment of money, such as wages paid to owners and staff for time spent retrieving and reviewing information, completing forms, lodging submissions, dealing with follow-up, training staff to handle compliance activities, and meeting and communicating with service professionals. These costs can be easily identified and counted. Explicit costs can also include the cost of machinery, equipment and software used for compliance, and fees paid to service professionals. Implicit costs are less easily measurable than explicit costs. They reflect the cost of foregone opportunities, such as the cost of lost sales, and do not require the actual payment of money. The effort a business owner devotes to regulatory paperwork, rather than growing the company, is another example of an implicit cost.
For the purpose of this study, only explicit, measurable costs that business owners, managers and staff incurred to comply with paperwork and fees paid to external service providers to comply with paperwork on their behalf are included.
Table 2: Productivity Drag of Paperwork Time Burden, 2005 and 2008
Source: Industry Canada calculations; Statistics Canada, Survey of Regulatory Compliance Costs, 2005 and 2008; National Economic Accounts (GDP, Labour Productivity); and Business Register. Note: Labour productivity was calculated by dividing industry GDP by aggregate hours.
Industry
Labour Productivity ($/hour)
Adjusted Labour Productivity
($/hour)Productivity Drag
($/hour)
2005 2008 2005 2008 2005 2008Manufacturing 49.01 49.11 49.04 49.14 0.03 0.03
Retail Trade 21.13 24.11 21.15 24.13 0.02 0.02
Professional, Scientific and Technical Services 31.25 31.25 31.31 31.30 0.06 0.05
Accommodation and Food Services 15.26 15.62 15.27 15.63 0.01 0.01
Other Services 26.07 26.23 26.12 26.27 0.05 0.04
All Industries 31.59 31.85 31.62 31.88 0.03 0.03

10 Analysis of Regulatory Compliance Costs 1111Part II
Implicit costs, and explicit costs related to capital expenditures and the purchase of equipment and software, are not included. Although they have the potential to be quite sizeable, they have been excluded because they are less visible and less objectively measurable. Regarding capital expenditures, it can be challenging, in practice, to separate from a business’ total annual capital expenditures the amount spent on paperwork compliance. For instance, when a small business owner decides to buy a new computer to better manage compliance paperwork, even if this is its main function, he or she rarely uses the computer simply for this one task. Typically, the business owner would use the computer for a variety of other functions that are not directly related to compliance activities — word processing, email, bookkeeping. Consequently, if the computer is used 15 percent of the time to manage non-compliance-related activities, only 85 percent of the computer’s cost should be added to any measure of regulatory compliance costs. For many businesses, however, determining objectively what cost to attribute to compliance-related and non-compliance-related activities is extremely difficult, if not impossible. Lacking better insight, if the full costs were to be included, measures of regulatory compliance costs would grossly overstate the true cost of paperwork compliance.
Calculating Paperwork Compliance CostsPaperwork compliance costs were calculated in four steps:
Survey respondents were asked to report the 1. total number of claims and forms prepared and submitted to government to comply with the 12 regulations covered in the survey.Survey respondents were asked to estimate 2. the average amount of time spent internally to complete each submission. Annual estimates of the total and average hours spent on compliance were then calculated.Hourly wage rates and/or annual salaries paid to the persons responsible for doing the work were also reported and, subsequently, used to produce estimates of annual average internal compliance costs.
Survey respondents were asked to report 3. total fees paid to external service providers to comply with the 12 regulations.Estimates of total costs, average costs and 4. average costs per employee were then calculated by adding the internal and external costs together, weighting the results to reflect the nature of the compliance activities (internal versus external), significance of the regulatory area and structure of the business population in terms of region, size and industry sector.
The next few sections present various measures of paperwork compliance costs drawn from the survey results: total costs, average costs per business and average costs per employee. The analysis demonstrates how total compliance costs have decreased between 2005 and 2008, after considering the effects of both inflation and the net increase in the number of new businesses in operation. The decrease in the average annual cost per establishment will also be discussed, as will the disproportionate impact that paperwork compliance has on smaller firms.
Total Compliance CostsFigure 4 presents a bar graph of total nominal costs in 2005, total nominal costs in 2008 and adjusted total real costs in 2008. Adjusted total real costs in 2008 were calculated by correcting the 2008 figure downwards to reflect raw inflation between January 2006 and December 2008 and the net increase in the number of new businesses in operation.
From Figure 4, it is clear that the nominal cost of complying with the 12 regulations for the 685 000 SMEs included in the survey increased slightly between 2005 and 2008. In total, SMEs reported spending $1.09 billion in 2005 complying with the regulations and $1.17 billion in 2008, an increase in nominal cost of approximately 7.3 percent. After considering the effects of inflation, however, and the net increase in the number of new businesses in operation, total real costs in 2008 decreased by approximately 2.8 percent from 2005 levels.

12 Analysis of Regulatory Compliance Costs 1313Part II
Figure 4: Total Compliance Costs, 2005 and 2008
Source: Industry Canada calculations; and Statistics Canada, Survey of Regulatory Compliance Costs, 2005 and 2008.
Trend Analysis of Total Compliance Cost Data by Regulatory RequirementTable 3 contains trend data between 2005 and 2008 for key factors driving regulatory compliance costs, including average submissions per business, complexity of claims/forms, fees charged by external service providers and number of businesses impacted by the regulations.
On the whole, the average quantity of paperwork prepared by SMEs between 2005 and 2008 declined by approximately 11 percent. While three regulations remained the same, fewer Records of Employment and corporate tax instalments contributed significantly to the total decline in paperwork.
Table 3: Three-Year Trend Analysis of Factors Affecting Regulatory Compliance Costs, 2005–2008
Source: Industry Canada calculations; and Statistics Canada, Survey of Regulatory Compliance Costs, 2005 and 2008. Note: ↑ = up, ↓ = down and ↔ = flat. * Up/down trend reflects change of 10 percent or greater. ** Reflects opinion of the majority. *** Up/down trend reflects change of 5 percent or greater.
0.98
1.00
1.02
1.04
1.06
1.08
1.10
1.12
1.14
1.16
1.18
Adjusted TotalReal Costs
2008
TotalNominal Costs
2008
TotalNominal Costs
2005
Tota
l Cos
ts
($ billions)
Regulation
Average Submissions
per Business *
Complexity of Claims/Forms **
Average Service Provider
Cost ***
Number of Businesses Impacted ***
Total Nominal Costs ***
Payroll Remittances ↓ ↔ ↔ ↔ ↑
Record of Employment ↓ ↔ ↓ ↔ ↓
T4 Summary / Individual T4 (including RL forms in Quebec) ↔ ↔ ↔ ↓ ↑
Workers’ Compensation Remittances ↓ ↔ ↓ ↔ ↓
Workers’ Compensation Claims ↓ ↔ ↓ ↓ ↓
Federal/Provincial Business Income Tax Filing ↔ ↔ ↑ ↑ ↑
Federal/Provincial Sales Tax ↓ ↔ ↔ ↑ ↑
Corporate Tax Instalments ↓ ↔ ↓ ↑ ↑
Corporate Registration ↔ ↔ ↓ ↑ ↑
Mandatory Statistics Canada Surveys ↓ ↔ ↓ ↑ ↓
Municipal Operating Licences and Permits ↓ ↔ ↓ ↑ ↓
Provincial Operating Licences and Permits ↓ ↔ ↓ ↑ ↑
All Regulations ↓ ↔ ↔ ↑ ↑
12 Analysis of Regulatory Compliance Costs 1313Part II
The trend analysis also revealed a lack of change in the complexity of individual claims and forms between 2005 and 2008. Overall, the majority of SMEs reported that for each of the 12 regulations covered in the survey, the effort required to understand and fill out individual claims and forms was the same in 2008 as in 2005. Between 10 percent and 22 percent of businesses felt that the regulations were easier to comply with (this could be due to government efforts to improve and simplify claims and forms to make it easier for businesses to comply). For most regulations, less than 10 percent of businesses believed that claims and forms were more difficult to comply with. It seems unlikely, therefore, that this factor had a significant impact on costs.
Overall, the average service provider cost remained flat over the period (approximately $1920). This was not true for federal/provincial business income tax filing, however, which increased by 7.7 percent from $907 in 2005 to $977 in 2008.4
Since 2005, there has been a net increase in the number of new businesses in operation (more new businesses have started up than gone out of business). It is reasonable that this factor, combined with the effects of inflation, are the two key drivers behind the increase in nominal compliance costs. After removing the effects of both inflation and the net increase in the number of new businesses in operation, however, total compliance costs in 2008 actually decreased by approximately 2.8 percent.
4 A change in survey methodology between 2005 and 2008 could explain this finding. In 2005, businesses were only asked to report federal T1/T2 income tax filing. Because some provinces (e.g., Quebec and Alberta) have dual income tax reporting, in 2008 businesses were asked to report the cost of both federal and provincial income tax filing. The increase in costs, therefore, is partly attributable to this factor.
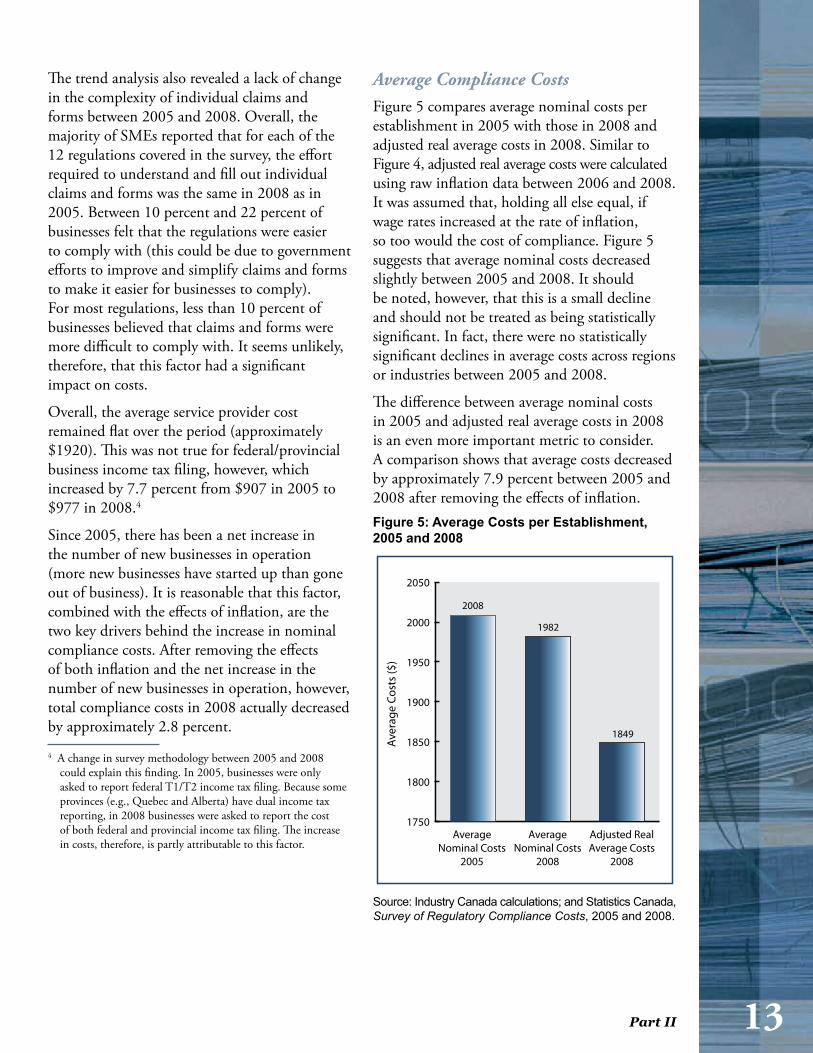
Average Compliance CostsFigure 5 compares average nominal costs per establishment in 2005 with those in 2008 and adjusted real average costs in 2008. Similar to Figure 4, adjusted real average costs were calculated using raw inflation data between 2006 and 2008. It was assumed that, holding all else equal, if wage rates increased at the rate of inflation, so too would the cost of compliance. Figure 5 suggests that average nominal costs decreased slightly between 2005 and 2008. It should be noted, however, that this is a small decline and should not be treated as being statistically significant. In fact, there were no statistically significant declines in average costs across regions or industries between 2005 and 2008.
The difference between average nominal costs in 2005 and adjusted real average costs in 2008 is an even more important metric to consider. A comparison shows that average costs decreased by approximately 7.9 percent between 2005 and 2008 after removing the effects of inflation.Figure 5: Average Costs per Establishment, 2005 and 2008
Source: Industry Canada calculations; and Statistics Canada, Survey of Regulatory Compliance Costs, 2005 and 2008.
1750
1800
1850
1900
1950
2000
2050
Adjusted RealAverage Costs
2008
AverageNominal Costs
2008
AverageNominal Costs
2005
Aver
age
Cost
s ($
)
2008
1982
1849

14 Analysis of Regulatory Compliance Costs 1515Part II
Figure 6: Average Nominal Costs per Business, by Size of Business, 2005 and 2008
Source: Statistics Canada, Survey of Regulatory Compliance Costs, 2005 and 2008.
Another dimension of regulatory compliance costs, “average cost per employee,” is presented in Figure 7. The inverse relationship between cost and number of employees reconfirms the disproportionate impact that paperwork compliance has on smaller firms.5 Businesses with 1–4 employees, for instance, spent twice as much per employee on compliance as businesses with 5–19 employees ($657 and $313 respectively). Similarly, businesses with 5–19 employees spent twice as much per employee on compliance as businesses with 20–99 employees ($155) and four times as much as businesses with 100–499 employees ($74). Given the strong positive relationship between company revenues and numbers of employees, these data suggest that
regulatory compliance costs have a greater negative impact on the profitability of small firms than large firms.
Changes in nominal costs per employee between 2005 and 2008 can also be seen in Figure 7. Overall, costs per employee, for firms of all sizes, increased 29 percent from $218 in 2005 to $282 in 2008. This finding may be due to the strong influence of declining employment in the manufacturing sector over that period, which could have led to an increase in the calculation of cost per employee. After removing the effects of inflation, however, the number decreases slightly to 22 percent.
5 This is a well-documented relationship primarily explained by economies of scale. See Survey Briefing #2: Measuring the Costs of Red Tape for Small Business, November 2007, Industry Canada.
Aver
age
Cost
s pe
r Bus
ines
s ($
)
0
2 000
4 000
6 000
8 000
10 000
12 000
14 000
16 000
20082005
All Businesses100−49920−995−191−40
867 9141 378 1 372
2 406 2 802
4 987
6 095
14 649
11 975
2 008 1 982
Number of Employees
Differences between Companies of Different SizesAverage nominal costs per establishment varied among SMEs of different sizes. Average costs were lowest for non-employer businesses (zero employees) and highest for businesses with 100–499 employees (Figure 6). In 2008, SMEs with 20–99 employees spent twice as much as those with 5–19 employees and approximately 4.5 times as much as those with 1–4 employees.
Between 2005 and 2008, there were minor changes in average costs for non-employer businesses and businesses with 1–4 employees. Businesses with 20–99 employees saw the largest increase in costs (22 percent). Businesses with 100–499 employees saw the largest decrease in costs (18 percent). Because of the extreme variability in costs among businesses of this size, however, the decrease could not be shown to be statistically significant.
Average Costs per Employee

14 Analysis of Regulatory Compliance Costs 1515Part II
Figure 7: Average Nominal Costs per Employee, by Size of Business, 2005 and 2008
Source: Statistics Canada, Survey of Regulatory Compliance Costs, 2005 and 2008.
Cautionary NoteResults from the Statistics Canada survey need to be interpreted with a degree of caution. Given that findings are based on a sample of businesses and that these business were asked to recollect how much time was spent on compliance and costs incurred, the survey’s measures of total costs, average costs per business and average costs per employee should be viewed as estimates only. Survey results are also limited in their ability to represent the entire Canadian economy because the survey covered only 12 regulations as they apply to small and medium-sized enterprises (499 employees or less) and only five sectors (representing approximately 30 percent of all business establishments in Canada). In addition, the survey did not count explicit costs related to capital expenditures and did not measure implicit opportunity costs related to the impact of compliance on lost sales, investment and innovation.
Paperwork SimplificationMany government bodies in Canada treat paperwork burden reduction as a political priority. Although important, few governments collect detailed quantitative information on the cost of paperwork burden. Even fewer have information summarizing businesses’ recommendations on how to reduce the burden.
This lack of information constrains governments’ abilities to target their burden reduction efforts in those areas that could provide SMEs with the greatest relief. To develop a better understanding of what SMEs want changed, Statistics Canada asked respondents to identify what they would “most” like to see improved about each of the 12 regulations covered in the survey. Findings could be used to gain the political support necessary to advance burden reduction strategies.
For each of the regulations businesses complied with, respondents were presented with three simplification options: fewer reporting requests, simplified claims/forms or improved methods of electronic filing. Businesses could also report that “the regulation is fine the way it is.”
Aver
age
Cost
s pe
r Em
ploy
ee ($
)
0
200
400
600
800
1000
20082005
All Businesses100−49920−995−191−40
867914
628657
265313
124155
85 74
218282
Number of Employees

16 Analysis of Regulatory Compliance Costs 1717Part II
Table 4 presents the survey results. The majority of businesses reported that 11 of the 12 regulations were fine the way they were. However, at least a quarter of the businesses still felt that some paperwork simplification was necessary. Of the 12 regulations, SMEs were most critical of mandatory Statistics Canada surveys, with 31 percent of businesses wanting fewer reporting requests. SMEs were also quite critical of federal/provincial business income tax filing, with 27 percent indicating they would like claims/forms simplified. Conversely, the majority of SMEs stated that workers’ compensation remittances, corporate registration, and municipal and provincial operating licences and permits were fine the way they were (70 percent or more).
The record of employment was the most unsatisfactory employment-related regulation, with 22 percent of SMEs indicating they would like to see the claims/forms simplified and 17 percent indicating they would like to see improved methods of electronic filing. The number of reporting requests, however, does not appear to be a significant issue. For municipal and provincial operating licence and permit requirements, the number of reporting requests does not appear to be a significant issue either. Businesses were more interested in having claims/forms simplified or improved methods of electronic filing.
The survey showed only minor differences in businesses’ answers across size categories. In general, for record of employment, workers’ compensation claims, federal/provincial sales tax, corporate tax instalments, corporate registration, municipal
operating licences and permits, and provincial operating licences and permits, smaller businesses had a stronger desire for fewer reporting requests while larger businesses had a stronger desire for improved methods of electronic filing.
Table 4: What SMEs Would “Most” Like Improved about Each Regulation, 2008
Source: Statistics Canada, Survey of Regulatory Compliance Costs, 2008. Note: Rows might not add to 100 due to rounding.
Regulation
Fewer Reporting Requests
(%)
Simplified Claims/ Forms
(%)
Improved Methods of
Electronic Filing (%)
Regulation is Fine
the Way it is (%)
Payroll Remittances 17 7 13 63
Record of Employment 4 22 17 57
T4 Summary / Individual T4 (including RL forms in Quebec) 4 13 15 68
Workers’ Compensation Remittances 7 11 11 71
Workers’ Compensation Claims 6 20 11 62
Federal/Provincial Business Income Tax Filing 7 27 11 56
Federal/Provincial Sales Tax 10 14 13 64
Corporate Tax Instalments 13 10 11 66
Corporate Registration 6 12 11 70
Mandatory Statistics Canada Surveys 31 16 12 41
Municipal Operating Licences and Permits 8 12 11 70
Provincial Operating Licences and Permits 8 13 10 70

16 Analysis of Regulatory Compliance Costs 1717Part II
Responsibilities of RegulatorsConsulting with businesses regarding how to simplify regulations is one of the most effective ways in which governments can develop policies to advance burden reduction. Businesses deal intimately with the regulations. In general, findings from the survey suggest that most businesses consider the regulations fine the way they are; however, there is still room for improvement.
To supplement findings from the survey, further consultations should be conducted to investigate specific changes necessary to reduce the compliance burden. For instance, additional consultation should be conducted to determine:
The number of reporting requests that •businesses consider tolerable. How businesses would like claims and •forms simplified.How businesses would like electronic •methods of filing improved.
Findings from the Statistics Canada survey inform policy-makers in a general sense that these approaches are desirable areas for change. But there is still a need for deeper investigation to identify ways to translate these approaches into concrete government initiatives. This responsibility lies heavily with the regulators themselves.
Economy-Wide Impact of Successful Paperwork Burden Reduction InitiativesBased on findings from Analysis of Regulatory Compliance Costs: Part I, it is clear that businesses would reinvest a portion of whatever savings they obtain from successful burden reduction initiatives. Policy-makers need to recognize the potential for this reinvestment to stimulate economic activity, even if it achieves only a small reduction in regulatory compliance costs. The rationale is based on the premise that one’s business expenditures become the income of another. This triggers a multiplicative effect throughout the economy. For example, suppose that successful government burden reduction initiatives save businesses $100 million and 25 percent of this ($25 million) is reinvested into the businesses. This triggers $25 million in additional economic expenditures. These additional expenditures become the sales revenues for other businesses. Soon after those businesses have collected their $25 million, the economy starts to feel the amplification effects of the increase in income. Given the link between income and expenditures, these businesses will spend a proportion of their additional $25 million and start buying goods and services themselves. The end result is that economic expenditures will increase by considerably more than the initial reinvestment of $25 million.

18 Analysis of Regulatory Compliance Costs 1919Part II
The findings in this report demonstrate that regulatory paperwork still imposes significant costs on small and medium-sized enterprises. Information collected by Statistics Canada shows that regulatory paperwork acts as a drag on labour productivity. Data also confirm that smaller firms still bear a disproportionate part of the compliance burden. No attempts were made here to measure the benefits of regulation as they can be very difficult to quantify and generally accrue to society over long periods of time.
Although total nominal cost grew by approximately 7.3 percent between 2005 and 2008, after removing the effects of inflation and the net increase in the number of new businesses in operation, costs actually decreased by approximately 2.8 percent.
Average costs varied among businesses of different sizes. Overall, average real costs decreased by approximately 7.9 percent. Average costs were much higher for larger SMEs, but much smaller when measured on a per employee basis. Average costs per employee for businesses with 5–19 employees were four times those of businesses with 100–499 employees.
There were consistent declines in the paperwork time burden between 2005 and 2008 across regions, most notably in Ontario, British Columbia and the Atlantic provinces. In addition, the paperwork time burden declined for almost all regulations and across all industries.
The advice given by businesses regarding how to improve regulations varied by regulatory area. For most regulations, businesses felt they were fine the way they were. Regarding mandatory Statistics Canada surveys, however, 31 percent of businesses wanted fewer reporting requests, 16 percent simplified claims/forms and 12 percent improved methods of electronic filing. Businesses also wanted simplified claims/forms for income tax reporting.
Survey findings highlight the need for governments to put in place conditions for businesses and entrepreneurs to invest and thrive, which include taking measures to streamline regulatory paperwork requirements. For many businesses, dealing with government paperwork is still too time consuming and unnecessarily complex. The 2008 survey findings clearly show that there was a slight improvement in the paperwork burden facing SMEs, but they also clearly signal to governments that additional measures could be taken to further decrease compliance costs and, in so doing, make it easier for businesses to do business in Canada.
The Statistics Canada Survey of Regulatory Compliance Costs is a key component of governments’ efforts to understand and reduce the compliance burden for small businesses. It is an essential tool for policy-makers to help them identify key areas where measures are most needed to reduce the burden. Both businesses and governments benefit from a reduction in regulatory compliance costs as it speeds up business responsiveness, directs resources towards value-added activities, encourages competition, stimulates innovation and generally enhances the sense of entrepreneurship throughout the economy.
Conclusions

18 Analysis of Regulatory Compliance Costs 1919Part II
This paper was authored by Daniel Seens. Daniel is an economist who works in the research group of the Small Business and Tourism Branch of Industry Canada.
For additional copies of this publication, please contact:
Publishing and Depository Services Public Works and Government Services Canada Ottawa ON K1A 0S5
Telephone (toll-free): 1-800-635-7943 (Canada and U.S.) Telephone (local): 613-941-5995 TTY: 1-800-465-7735 Fax (toll-free): 1-800-565-7757 (Canada and U.S.) Fax (local): 613-954-5779 Email: [email protected] Website: www.publications.gc.ca
This publication is available upon request in accessible formats. Contact:
Multimedia Services Section Communications and Marketing Branch Industry Canada Room 441E, East Tower 235 Queen Street Ottawa ON K1A 0H5
Telephone: 613-995-8552 Fax: 613-954-6436 Email: [email protected]
This publication is also available online at www.reducingpaperburden.gc.ca/Survey.
Permission to Reproduce Except as otherwise specifically noted, the information in this publication may be reproduced, in part or in whole and by any means, without charge or further permission from Industry Canada, provided that due diligence is exercised in ensuring the accuracy of the information reproduced; that Industry Canada is identified as the source institution; and that the reproduction is not represented as an official version of the information reproduced, nor as having been made in affiliation with, or with the endorsement of, Industry Canada.
For permission to reproduce the information in this publication for commercial redistribution, please email [email protected].
Cat. No. Iu188-101/2-2010E-PDF ISSN 978-1-100-17576-8 60843
Aussi offert en français sous le titre : Analyse du coût de la conformité à la réglementation : Partie II – Temps requis pour la paperasserie, coût du respect des formalités administratives, décembre 2010
Part II