analysis of resource allocation in the south african
TRANSCRIPT

ANALYSIS OF
RESOURCE ALLOCATION
IN THE
SOUTH AFRICAN POLICE SERVICE
civilian secretariat
Department:Civilian Secretariat for Police ServiceREPUBLIC OF SOUTH AFRICA
for police serviceNATIONALDEVELOPMENTPLAN2030

Resourcing the police
for effective policing

TABLE OF CONTENTS
ANALYSIS OF RESOURCE ALLOCATION IN THE SOUTH AFRICAN POLICE SERVICE
i
1. INTRODUCTION 1
2. AIM AND OBJECTIVES OF THE STUDY 2
3. METHODOLOGY 3
4. LIMITATIONS OF THE STUDY 3
5. LEGISLATIVE FRAMEWORK GUIDING SAPS RESOURCE ALLOCATION 4
6. SAPS METHODS IN ALLOCATING HUMAN RESOURCES 4
6.1 Resource Allocation Guide 5
6.2 Theoretical Human Resource Requirements 5
7. COST OF SAPS HUMAN RESOURCES 9
8. LITERATURE REVIEW 12
8.1 New Zealand Police Resource Allocation Model 15
8.2 United States of America Police Resource Allocation Model 16
8.3 Ireland Police Resource Allocation Model 17
8.4 Australia Police Resource Allocation Model 18
8.5 United Kingdom Police Resource Allocation Model 18
8.6 Wales and England Police Resource Allocation Model 20
8.7 African Police Resource Allocation Model 20
9. STUDY FINDINGS 23
9.1 Discrepancies with the THRR, Fixed Establishment, and Actual
human resource allocation and the impact on policing 23
9.2 Challenges regarding input sheets 28
9.3 Vehicle allocation 30
9.4 Allocation of reservists 31
10. CONCLUSION 32
11. RECOMMENDATIONS 33
12. BIBLIOGRAPHY 35
13. Annexure A: Sampled police stations as per the nine provinces 39
14. Annexure B: Improving frontline policing: Towards a technologically
SMART policing approach 41

LIST OF FIGURES AND TABLES
Diagram 1: Practical implication of ideal, fixed and actual resource
allocation process 6
Diagram 2: National Central Command Centre 47
Graph 1: Fixed Establishment at Police Stations 11
Table 1: Depicting compensation of SAPS employees across all
salary levels 10
Table 2: Depicting post allocations for SAPS Act entry level
constables 26
ANALYSIS OF RESOURCE ALLOCATION IN THE SOUTH AFRICAN POLICE SERVICE
ii

APCOF .................................................................. African Policing Civilian Oversight Forum
CIO ........................................................................................... Crime Intelligence Officers
CSC ........................................................................................... Community Service Centre
MIC ................................................................................ Management Information Centre
MIO .............................................................................. Management Information Officers
MTEF ...................................................................... Medium Term Expenditure Framework
MTSF ............................................................................ Medium Term Strategic Framework
HREC ............................................................. Human Resource Establishment Committee
SIMC .................................................................. Station Information Management Centre
SIP ............................................................................................ Station Intelligence Profile
OD ....................................................................................... Organisational Development
OSD ............................................................................. Occupational Specific Dispensation
PCP ..................................................................................... Portfolio Committee on Police
PSC ........................................................................................... Public Service Commission
PHREC ............................................ Provincial Human Resource Establishment Committee
PFMA .................................................................................. Public Finance Management Act
PSA ........................................................................................................... Public Service Act
RAG ........................................................................................... Resource Allocation Guide
REP ....................................................................................... Resource Establishment Plan
SAPS ......................................................................................... South African Police Service
THRR ............................................................. Theoretical Human Resource Requirements
ACRONYMS
ANALYSIS OF RESOURCE ALLOCATION IN THE SOUTH AFRICAN POLICE SERVICE
iii

1. INTRODUCTION
Police service delivery across the country has been an issue for many years. Various
reasons can be postulated for the inefficiencies, but the challenge for the SAPS remains
the ability to balance resources with high levels of crimes, service delivery needs,
increasing expectations of the community, as well as budgetary constraints. Various
studies point directly to the poor allocation of resources.
An Inspections Report of the South African Police Service (SAPS) Detective Services
conducted by the Public Service Commission (PSC) in 2011 found that 70% of 33 police
stations visited did not have sufficient detective officers to undertake detective
activities. Successful and effective investigation of crime requires adequate detective
officers in all police stations and inadequate resource allocation negatively affects 1
general operations. Similar findings were highlighted by the Civilian Secretariat for
Police Service in 2014 during the development of a turnaround strategy for the 2Detective Service conducted.
An Independent Commission of Inquiry was established in 2012 with the mandate of
investigating police inefficiency and ineffectiveness in Khayelitsha. The Inquiry found
evidence of inequities in the distribution of police human resources and recommended
that the SAPS method of resource allocation be revised to address inequitable resource
allocation. Another recommendation placed special emphasis on the equitable
distribution of experienced personnel with specialist skills in the investigation of 3serious contact crimes.
The Portfolio Committee on Police in its report on Oversight visits to Police Stations in
Nyanga and Philippi in the Western Cape Province, on 31 October 2014, raised concerns
about staff shortages at these police stations. The Committee recommended that the
matter be addressed by the provincial management and additional staff be made 4available to the stations.
1 Public Service Commission. 2011. Consolidated Report on Inspec�ons of Detec�ve Services: Department of Police. [O] Available at: h�p://www.psc.gov.za/documents/2012/Police%20Report%20Complete.pdf. Accessed 9 March 2017 2 Civilian Secretariat for Police. 2014. Policy on enhancing the quality and func�oning of the SAPS detec�ve func�oning 3 Commission of Inquiry. 2014. Towards a safer Khayelitsha: Report of the Commission of Inquiry into Allega�ons of Police Inefficiency and a Breakdown in Rela�ons between SAPS and the Community of Khayelitsha. [O] Available at: h�p://www.khayelitshacommission.org.za/images/towards_khaye_docs/Khayelitsha_Commission_Report_WEB_FULL_TEXT_C.pdf. Accessed 10 March 2017 4 Report of the por�olio commi�ee on Police on O versight visits to police sta�ons in Nyanga and Philippi in the Western Cape Province, dated 31 October 2014. [O] Available at: h�ps://pmg.org.za/tabled-commi�ee-report/2126/. Accessed 10 March 2017
ANALYSIS OF RESOURCE ALLOCATION IN THE SOUTH AFRICAN POLICE SERVICE
1
The Portfolio Committee on Police once again in April 2016 wanted assertions from
SAPS management that necessary resources and human capital would be made
available to address historic resource imbalances, and that appropriate resource 5
allocation would be provided for fast growing new settlements.
A study conducted by the Department of Community Safety in KwaZulu Natal found
that there were serious discrepancies between the number of people actually at the
police stations and the provincial list of personnel strength at that station. This was
because in some cases people who were transferred to other stations were still 6reflected provincially as being present at the initial station despite the transfer.
In order to determine reasons for the insufficient police resourcing, a project was
identified and conducted in partnership with the Provincial Departments of
Community Safety/Provincial Secretariats. Police resourcing is also an area identified as
one of the policing priorities within the Medium Term Strategic Framework 2014-2019
(MTSF).
5 Report of the Por�olio Commi�ee on police on the 2016/17 budget vote 23, Annual Performance Plan and 2014-2019 Strategic Plan of the Department of Police (SAPS), dated 19 April 2016 6 KwaZulu Natal Department of Community Safety report on resource alloca�on
2. AIM AND OBJECTIVE OF THE STUDY
The aim of this study was to provide an analysis of police resource allocation at police
stations.
The objectives of the study included the following:
· To compare the allocation of human resources against the Fixed Establishment
(granted) at police stations to that proposed by the THRR (ideal)
· To identify problematic areas pertaining to input/audit sheets
· To determine the process for distributing human resources at Provincial level
· To identify the constraints that impact on the optimal utilization of human
resources
ANALYSIS OF RESOURCE ALLOCATION IN THE SOUTH AFRICAN POLICE SERVICE
2

3. METHODOLOGY
4. LIMITATIONS OF THE STUDY
The study used both qualitative and quantitative methodologies. The quantitative
method focused on data which was collected in a standardised manner at all nine
provinces. The qualitative method included interviews at police stations by means of a
standardized questionnaire to collect information regarding the THRR input sheets,
fixed establishments, duty lists, vehicles and reservists, at all sampled police stations in
all Provinces for the past five years.
The project was specific to the following:
7• Random sampling of police stations (6 stations in each province).
• Criteria for identifying 6 police stations: Rural/Urban and A, B and C police
stations
• Obtain station level allocation of human resources (ideal, granted and actual)
for verification of the information
• Determine if there are any arrangements for additional human resources (duty
arrangements/reservists) at police stations
• Conduct a comparison of international experiences against the ideal allocation
and the actual allocation
Structured interviews were held with the following stakeholders:
• SAPS National Organisational Development
• Provincial SAPS Resource Allocation Committee
• Police Station Management
The main focus on the study was on personnel allocation. However, there was also, to a
lesser extent a focus on vehicle allocations.
The geographical scope of the study in each province was limited to six police stations
due to capacity constraints; hence the results of the study cannot be generalized across
the provinces. The results however provide a snapshot and insight into the process of
resource allocation and distribution in the provinces.
7 See annexure A
ANALYSIS OF RESOURCE ALLOCATION IN THE SOUTH AFRICAN POLICE SERVICE
3

There was poor cooperation from some of the police stations; with the result that some
Provincial Departments of Community Safety had challenges accessing critical
information. There were also capacity constraints at Provincial Departments of
Community Safety which made data collection a challenge.
5. LEGISLATIVE FRAMEWORK GUIDING THE SAPS
RESOURCE ALLOCATION
6. THE SAPS METHODS IN ALLOCATING HUMAN RESOURCES
Resource allocations in the SAPS are directed by legislative frameworks. The list below
presents various frameworks that provide guidance for resource allocation:
· South African Police Service, 1995 (Act No. 68 of 1995)
· Constitution of the Republic of South Africa, 1996 (Act No. 108 of 1996)
· Public Finance Management Act, 1999 (No.1 of 1999)
· 2006 Regulation 20(2) (3) of the SAPS Employment Regulations
· 2014 SAPS 'Back to Basics' strategy
· Medium Term Strategic Framework (2014-2019)
· 2016 White Paper on Policing
· National Development Plan 2030
· Medium Term Expenditure Framework
Resource allocation refers to the assignment of human and physical resources to police
stations. Human resource establishment consists of staff appointed under the SAPS
Act (operational or functional) and staff appointed under the Public Service Act
(administrative or support).
Post 1994, the South African Police Service has undergone a series of strategic and
managerial reforms that were designed to improve core police service delivery,
operational transparency, and broader police transformation, in both rural and urban
areas. These reforms included a number of innovative policing programmes to change
from a reactive to a proactive method of service delivery, such as community oriented
policing, sector policing, and intelligence-led policing.
Based on a need to deal with crime efficiently and effectively, the SAPS formulated
models in order to allocate resources equitably. The models include the Mannekrag
Plan, the Resource Allocation Guide (RAG), the Resource Establishment Plan, and the
Theoretical Human Resource Requirement (THRR).
ANALYSIS OF RESOURCE ALLOCATION IN THE SOUTH AFRICAN POLICE SERVICE
4
The Mannekrag Plan was established after 1994 when the SAPS identified a need to
develop a resourcing strategy that would meet the policing demands of the time. It
focused on police station upgrades as and when funding was made available. In
1998/99 the RAG concept was formulated as a starting point. RAG became the Resource
Establishment Plan (REP) and was tested in 2004/5. The THHR process began in
2011/2012 and added more variables as adjustments were needed. In the public
service, every post must be established and graded for remuneration purposes.
The models that are discussed below include the RAG and the THHR.
6.1. Resource Allocation Guide
Certain aspects of police transformation promote new ways of using police resources
where new methodologies or strategies are developed to replace existing ones. The
SAPS has since 2004 utilised the RAG which is used as a tool to determine the ideal
human resource requirements at national, provincial and station level on an annual
basis, using a basket of variables/factors that are performance and non-performance
related. The core variables are related to the minimum service levels, business rules,
workload, internal functions and external factors. The allocation of the budget during
the Medium Term Expenditure Framework (MTEF) would dictate the number of
actual/granted resources (especially human resources) to be allocated at each level in
the police. However, as has been argued this method treats crime offences as static and 8it does not allow room for refinement in cases of fluctuations.
Due to criticisms on the RAG system, there has since been transformation from RAG to
THRR which is discussed below.
6.2. Theoretical Human Resource Requirement
In response to the challenges and criticisms of RAG, SAPS undertook a RAG review
which was subsequently replaced by the THRR model in 2011/12. RAG was regarded as
a 'guide' and some stations exceeded the guideline. With the THRR, posts are fixed as
per a post structure and determined by funding. Therefore, exceeding the fixed
establishment places other personnel outside the staff establishment.
8 Albrecht, J.F., & Das, D.K (ed). 2011. Effec�ve Crime Reduc�on Strategies: Interna�onal Perspec�ves. CRC Press
ANALYSIS OF RESOURCE ALLOCATION IN THE SOUTH AFRICAN POLICE SERVICE
5

The THRR of the SAPS is managed by a Human Resource Committee at SAPS Head
Office which is chaired by the National Commissioner and is known as the Human
Resource Establishment Committee (HREC). The allocation of personnel in SAPS is
broken down into business units and the HREC allocate staff to these different business
units. Each province is considered a business unit and receives their allocation as a
business unit. According to Section 11 of the SAPS Act, the National Commissioner of
Police is responsible for determining the fixed establishment of the Service as well as
the number of grading posts. The Provincial Commissioners, as per Section 12 of the
SAPS Act, have the delegated authority to distribute the allocated Fixed Establishment
within each of their provinces. Diagram 1 below depicts the process for resource
allocation.
Diagram 1: Practical implication of ideal, fixed and actual resource allocation
process
The SAPS Organisational Development component at national level determines the
THRR criteria or the 'ideal' post establishment, while the budget through the MTEF
determines the Fixed Establishment, as approved by National Treasury and the SAPS
Executive Committee. When the THRR figures are larger than the budget allocated for
policing for a specific year, the THRR cannot be implemented. The Fixed Establishment
principles determine the equitable allocation per province. The final number of funded
posts that are allocated forms part of the Fixed Establishment of the police. The THRR
determines the ideal number of personnel required, but due to budget constraints, the
current situation is that the SAPS is only able to fund approximately 60% of the
personnel number.
Practical Implication
HOW MUCHEMPLOYEESNEEDED TOEXECUTE TASKSWITHINSTRUCTURE
+ Criteria &Minimum
Requirements
• Inputs
• Strategies
• Policies
• Instruction
• Etc ....
Fixed EstablishmentGranting
TheoreticalRequirement/Demand
(Ideal)
MTEF
Source: SAPS Organisational Development
ANALYSIS OF RESOURCE ALLOCATION IN THE SOUTH AFRICAN POLICE SERVICE
6
The SAPS allocation of resources is based on a “theoretical” requirement which is
calculated based on the total time taken for all tasks that need to be done at a specific
station. All the station information is gathered and collated into the Input Management
Sheet at Station level by the Station Information Management Centre (SIMC). The THRR
input sheet is divided into internal and external environment factors. The external
factors comprise demographic factors which include population size; nature of the
population, population movement, size of the precinct, topographical features of the
environment, roads, transports, major infrastructure (for example dams), regular large
events, courts and educational facilities. It also requests information on the number of
gangs, registered and unregistered liquor outlets, firearm dealers and sellers and
registered firearm owners, shopping centres and tuck shops, among others. Basically,
the THRR attempts to consider all factors in the external environment that are likely to
affect policing.
The internal environment factors include station infrastructure: area size of the station
and various key facilities, rooms, community service centres, holding cells and toilets,
information on other service points such as satellite stations, and number of client
service centre activities such as registers in the SAPS environment entries.
Furthermore, the tool takes into consideration reported crime per police station, per
year. Finally, it accounts for the number of crime prevention activities. All these factors
are weighted and aggregated as per the actual input sheet to arrive at a theoretical
number.9
The SIMC then forwards the Input Sheet to the SAPS Provincial Office. The Provincial
Organisational Development Office validates and captures the information on the
Global Access Control System: THRR, and forwards this to the SAPS Organisational
Development office at national level. The national office calculates the THRR and the
level of the Station Commanders is determined according to the job weight range.
There are officially three categories of police stations; A–captain, B–Lt colonel, C1-
colonel and C2-brigadier. The category of police stations refers to the size and ranking
of each station, for example, a station with an A-Captain category consists of 90
personnel and below, and is managed by a Station Commissioner with the rank of a
Captain. The threshold for B-Lt Colonel is 180, whereas the C1-Colonel station has a
limit of 360 personnel, and the C2-Brigadier station has a minimum limit of 360
personnel. Categorisation of police stations is done via work studies conducted by the
national office of Organisational Development. Provincial Commissioners are not
authorised to change the category of a police station, or the rank of a Station
Commissioner with a higher graded salary level, as this will result in the station
9 Western Cape study on Police Resource Alloca�on. 2017.
ANALYSIS OF RESOURCE ALLOCATION IN THE SOUTH AFRICAN POLICE SERVICE
7
commissioner falling outside the post establishment. Provincial Commissioners, on
annual basis has been tasked to determine police stations projecting a re-grade, based
on a 3 year THRR comparison. This process affects the post establishment allocation of
respective stations and affects the MTEF allocations. In terms of Regulation 35 of the
SAPS Act, the Minister or National Commissioner may upgrade a police station
provided the required criterion is met.
At a provincial level, a Provincial Human Resource Establishment Committee (PHREC) is
established and chaired by the Provincial Commissioner. According to the THRR
process, data collection is the responsibility of police stations, and distribution of
resources in terms of the equitable distribution is the mandate of the Provincial
Commissioners, according to Section 12 of the SAPS Act. The provincial office calculates
their allocation of resources based on a crime threat analysis, provincial priorities, and
developments in their respective policing areas, and distributes resources accordingly.
Section 12 of the SAPS Act empowers Provincial Commissioners to re-deploy resources
to a particular police station, as long as the basic staff requirements of each station are
retained.
The THRR process also allows for stations to be declared “disadvantaged stations”
based on the stations input sheet. The decision to declare a station disadvantaged is
taken by the SAPS Head Office. The benefit of this classification allows disadvantaged
stations to be allocated additional personnel.
It should also be noted that specialised units at local level are excluded in the THRR
calculations due to their specialist function, although in issues of service delivery these
units are deployed to police stations. The purpose for the specialised units' exclusion
from the local level calculations is due to both its specialised nature and variables.
These specialised units are usually national and provincial competencies meaning that
the direct line of command lies with the national and provincial offices. However,
components of these specialized units might also assist with policing functions at a
particular precinct from time to time.
The THRR is currently in the monitoring and evaluation phase. It has recently received
much attention more particularly to address the need to make on-going assessments
and improvements in the allocation system.
ANALYSIS OF RESOURCE ALLOCATION IN THE SOUTH AFRICAN POLICE SERVICE
8
Budget allocation in the provinces is as follows:
Provinces receive their budget from the SAPS National Office for all policing
functions/activities to be performed in the Province. Provincial budgets are allocated
according the equitable share principle. SAPS allocate the money to the different
programmes. Baseline budgeting is done at provincial level and the province normally
receives an incremental of 1% or 2% on the previous year's budget. The Goods and
Services budget as well as monies for vehicles are allocated to provinces, while the
budget for salaries are centralized at National SAPS office. Additional posts that are
allocated to provinces are funded by the National SAPS through the compensation
budget.
Over the past five financial years (2010/11 to 2015/16) there has been a massive
increase in the SAPS budget. In 2010/11, SAPS received a budget of R54 billion and by
2015/16 this amount had risen to R77 billion. In 2010/11, SAPS employed a total of 193
892 employees. By 2015/16 this had increased by 0.4% to 194 730 . The vast majority of 10
the SAPS budget is allocated to compensation which constitutes 76.4% rendering
compensation pivotal to the SAPS performance. 11
To assess the role of budget allocations in the SAPS it is necessary to examine changing
employment profiles, salaries paid, and the impact of inflation. Between 2010/11 and
2015/16, there was a nominal increase of 43% in the SAPS budget. However, when the
impact of inflation is taken into account, the change in actual value of the SAPS budget is
far lower . In real terms the 2015/16 budget is only 9% greater than the 2010/11 12
budget.
Between 2010/11 and 2015/16 the average nominal earnings of the Lower Salary Levels
1-2 (Cleaners, grounds man, handyman, security guards, food service aids,
messengers) category rose from R21 000 to R87 000. This corresponds to an increase of
219%, after the impact of inflation has been factored in. Less marked increases are also
apparent for Salary Levels 3-5 (Level 5 includes constables under SAPS Act) and Highly
Skilled Production which are levels 6-8 (Sergeant, Warrant officer, Captain). Amongst
Salary Level 3-5 workers the average earnings increased by 68% and amongst Salary
Level 6-8 workers, there was an increase of 27%. There were slight declines in the real
7. COST OF SAPS HUMAN RESOURCES
10 SAPS Annual Report 2015/16. 11 The public service norm for compensa�on is 70%. 12 Defla�ng the 2015/16 budget by the CPI index value.
ANALYSIS OF RESOURCE ALLOCATION IN THE SOUTH AFRICAN POLICE SERVICE
9
value of Salary Levels 9-12 (Lieutenant Colonel, Colonel) workers and of Salary Levels
13-16 (Brigadier, Major General, Lieutenant General, and National Commissioner).
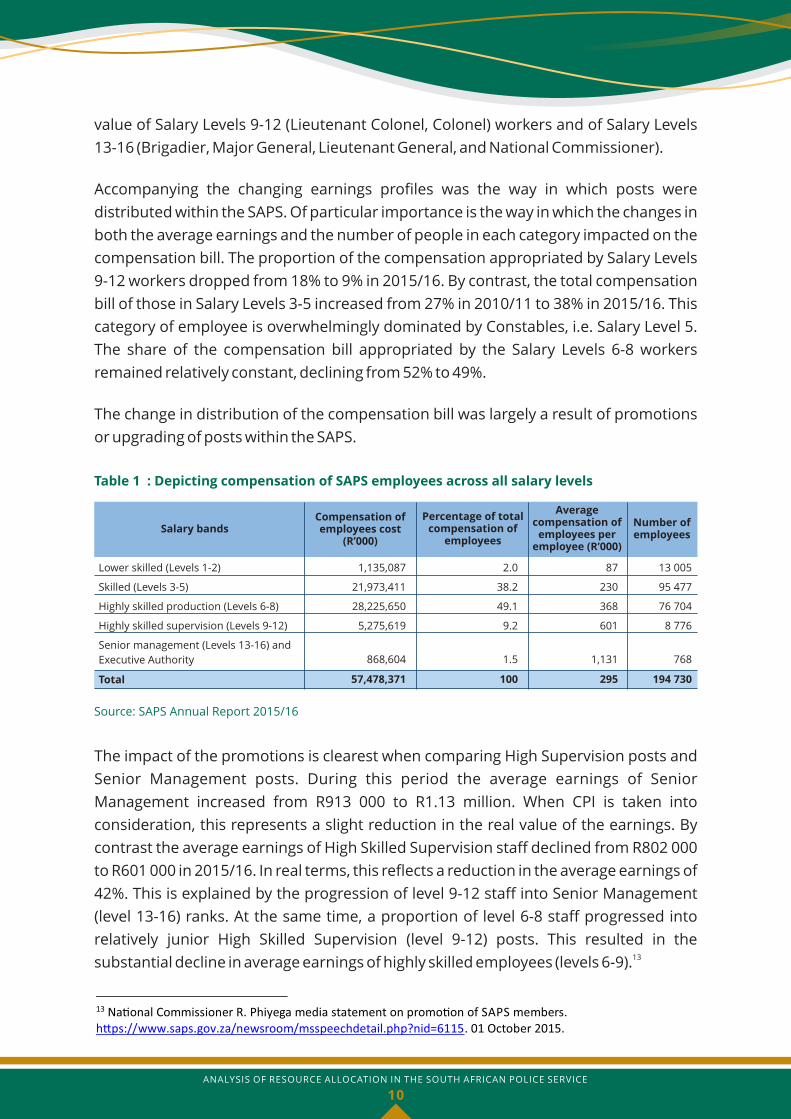
Accompanying the changing earnings profiles was the way in which posts were
distributed within the SAPS. Of particular importance is the way in which the changes in
both the average earnings and the number of people in each category impacted on the
compensation bill. The proportion of the compensation appropriated by Salary Levels
9-12 workers dropped from 18% to 9% in 2015/16. By contrast, the total compensation
bill of those in Salary Levels 3-5 increased from 27% in 2010/11 to 38% in 2015/16. This
category of employee is overwhelmingly dominated by Constables, i.e. Salary Level 5.
The share of the compensation bill appropriated by the Salary Levels 6-8 workers
remained relatively constant, declining from 52% to 49%.
The change in distribution of the compensation bill was largely a result of promotions
or upgrading of posts within the SAPS.
The impact of the promotions is clearest when comparing High Supervision posts and
Senior Management posts. During this period the average earnings of Senior
Management increased from R913 000 to R1.13 million. When CPI is taken into
consideration, this represents a slight reduction in the real value of the earnings. By
contrast the average earnings of High Skilled Supervision staff declined from R802 000
to R601 000 in 2015/16. In real terms, this reflects a reduction in the average earnings of
42%. This is explained by the progression of level 9-12 staff into Senior Management
(level 13-16) ranks. At the same time, a proportion of level 6-8 staff progressed into
relatively junior High Skilled Supervision (level 9-12) posts. This resulted in the
substantial decline in average earnings of highly skilled employees (levels 6-9).13
Table 1 : Depicting compensation of SAPS employees across all salary levels
Source: SAPS Annual Report 2015/16
Salary bands
Lower skilled (Levels 1-2) 1,135,087
21,973,411
28,225,650
5,275,619
2.0
38.2
49.1
9.2
87
230
368
601
13 005
95 477
76 704
8 776
868,604
57,478,371
1.5
100
1,131
295
768
194 730
Skilled (Levels 3-5)
Highly skilled production (Levels 6-8)
Highly skilled supervision (Levels 9-12)
Senior management (Levels 13-16) and
Executive Authority
Total
Number ofemployees
Averagecompensation of
employees peremployee (R’000)
Percentage of totalcompensation of
employees
Compensation ofemployees cost
(R’000)
13 Na�onal Commissioner R. Phiyega media statement on promo�on of SAPS members. h�ps://www.saps.gov.za/newsroom/msspeechdetail.php?nid=6115. 01 October 2015.
ANALYSIS OF RESOURCE ALLOCATION IN THE SOUTH AFRICAN POLICE SERVICE
10
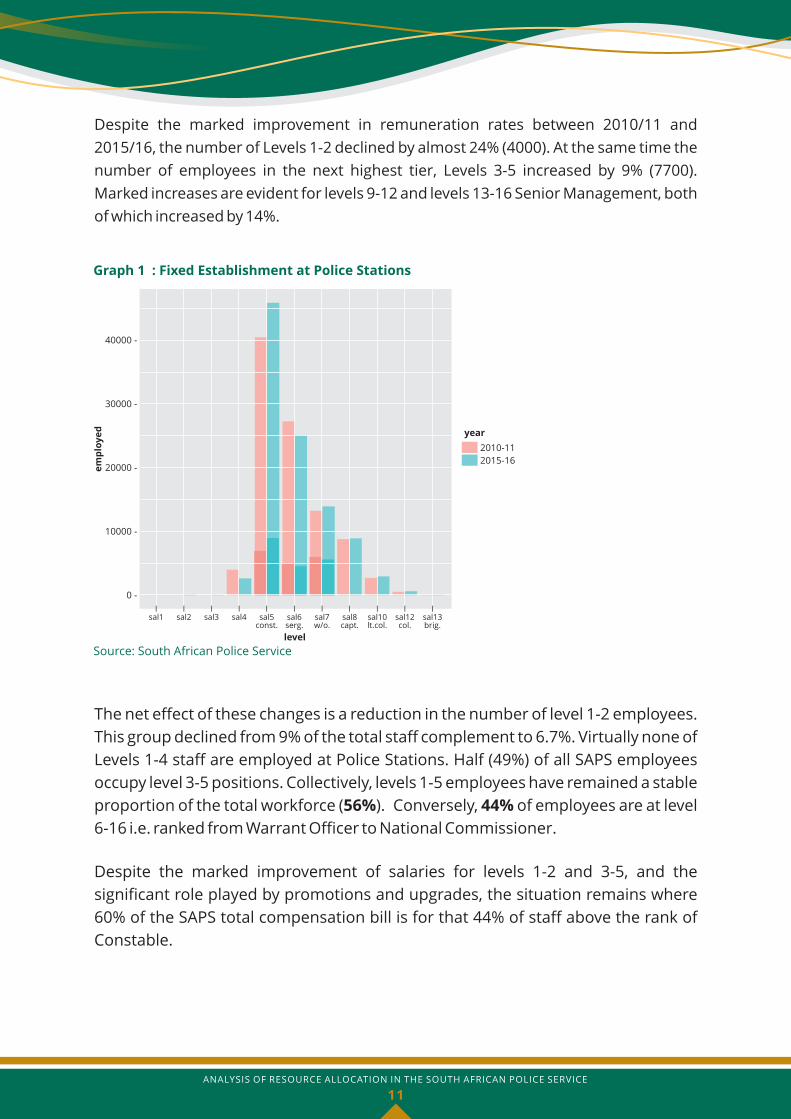
Despite the marked improvement in remuneration rates between 2010/11 and
2015/16, the number of Levels 1-2 declined by almost 24% (4000). At the same time the
number of employees in the next highest tier, Levels 3-5 increased by 9% (7700).
Marked increases are evident for levels 9-12 and levels 13-16 Senior Management, both
of which increased by 14%.
The net effect of these changes is a reduction in the number of level 1-2 employees.
This group declined from 9% of the total staff complement to 6.7%. Virtually none of
Levels 1-4 staff are employed at Police Stations. Half (49%) of all SAPS employees
occupy level 3-5 positions. Collectively, levels 1-5 employees have remained a stable
proportion of the total workforce (56%). Conversely, 44% of employees are at level
6-16 i.e. ranked from Warrant Officer to National Commissioner.
Despite the marked improvement of salaries for levels 1-2 and 3-5, and the
significant role played by promotions and upgrades, the situation remains where
60% of the SAPS total compensation bill is for that 44% of staff above the rank of
Constable.
Graph 1 : Fixed Establishment at Police Stations
Source: South African Police Service
40000 -
30000 -
20000 -
10000 -
0 -
lsal1
lsal2
lsal3
lsal4
lsal5
const.
lsal6serg.
lsal7w/o.
lsal8capt.
lsal10lt.col.
lsal12col.
lsal13brig.
level
year
2010-11
2015-16
em
plo
ye
d
ANALYSIS OF RESOURCE ALLOCATION IN THE SOUTH AFRICAN POLICE SERVICE
11
At the forefront of combating and preventing crime, making arrests, and securing
prosecutions are those employed under the SAPS Act and based at police stations.
Additional statistics made available by the SAPS indicate that only 60% of its entire
workforce is employed at police station level under the SAPS Act, with the balance being
employed at management, administrative and other support roles. If the analysis is
further restricted at only those at the frontline i.e. the SAPS Act employees below the
rank of Captain, then only 43% of the entire SAPS workforce are based at the frontline.
In summary, the following can be deduced from the above analysis:
· Despite the SAPS budget increasing by R23 billion between 2010/11 and 2015/16,
the increase amounts only to 9% when considering inflation.
· Levels 1-2 category salaries rose drastically in the period under review, indicating
SAPS management is making much progress in improving the conditions of
employment of lower level employees. However, these are a very small
proportion of the workforce and they are peripheral to police work
· Promotions and post progressions were high from lower to middle management.
· The proportion of the SAPS employees in non-supervisory roles at police stations
is 43%; this means that the vast majority of the SAPS employees are employed in
administrative and supervisory positions.
· Rebalancing of the SAPS resource allocation towards frontline services rather
than administration and management roles could markedly improve service
delivery within the existing budget constraints.
From the above discussion, it can be deduced that the process of the SAPS resource
allocation is complex and dependent on many variables. If the method of calculation is
disputed, the result is a flawed allocation system. Budgetary constraints as has been
determined are critical to the allocation process. Before attempting to answer the
question as to the process and whether a revision is required, and the request for a
larger budget to address the challenges to resource allocation; the question to ask is:
Whether more personnel equates to more effective policing?
It is worth looking at the evidence on the impact that increases or decreases in total
police officer numbers have on crime rates before looking in detail at how effective the
police are in reducing crime. According to Bradford and Levitt in Deshpande , the 14
evidence that additional numbers of police reduce crime rates is inconclusive, although
8. LITERATURE REVIEW
14 Law Enforcement Officer from Goa, India.
ANALYSIS OF RESOURCE ALLOCATION IN THE SOUTH AFRICAN POLICE SERVICE
12
17 Skogan and Frydl, (2004) 18 Ibid
the absence of any police presence, for e.g. at protest marches, has been shown to
increase crime. Some studies have suggested that increased police numbers may be
associated with lower property and other acquisitive crime, with one study suggesting 5that an estimated 10% increase in officers leads to a reduction of around 3% in crime ,
1
but the evidence of an association between police numbers and violent crime seems to 6
be more ambiguous . However, it should be taken into consideration that a baseline in 1
a country like South Africa is needed to determine the above, as it is very probable that
South Africa has a very low baseline. Additionally, this would also mean a 10% increase
is required in frontline workers, rather than an overall 10% increase across the board, or
an increase at supervisory levels.
Efforts to increase the speed of response to urgent incidents have also been shown to
have little impact on detection rates as the delay in calling the police tends to outweigh
any increase in the chances of catching the perpetrator that reduced response times 7
might achieve . In practice, it is difficult to separate the effect of increased numbers 1
from the actual work of officers.
Deshpande contends that with the rapidly changing socio-economic and technological
changes, as well as changes in patterns of crime and demands for security, drawing on
knowledge of effective, sustainable crime reduction practice, and developing multi-
agency problem-solving, community engagement approaches, to address issues in
micro-location hotspots is recommended.
Traditionally, police agencies have allocated resources in response to their operational
demands or requirements, with the majority of resources being distributed in response 8to political demands and public calls for service . It should also be taken into account
1
that this also depends on the country, and the kinds of issues that the country
confronts. In a low crime rate country, it might seem possible that more resources are
given over the response of public order policing. But in high crime countries, you would
expect a higher proportion in response to calls for investigation.
15 Levi�, S. 1997. Using Electoral Cycles in Police Hiring to Es�mate the Effect of Police on Crime. The American Economic Review, 87 (3): 270-290. 16 Bradford, B. 2011. Police numbers and crime rates – a rapid evidence review. [O] Available at: h�ps://www.jus�ceinspectorates.gov.uk/hmic/media/police-numbers-and-crime-rates-rapid-evidence-review-20110721.pdf. Accessed 16 March 2017
ANALYSIS OF RESOURCE ALLOCATION IN THE SOUTH AFRICAN POLICE SERVICE
13

The City of Bogota in Colombia was able to substantially reduce robbery rates by 75%
between 1996 and 2001. The success was mainly attributed to proper and SMART
policing methods that strengthened the intelligence and investigation units, and also
improved coordination. The success in reducing robbery rates was achieved without
increasing the number of police officers, rather investments were made targeting
police training, crime intelligence and investigations, as the units were then able to
increase their arrests and detention rates by over 500%.
The changing policing environment to a public 'service' ethos, with an emphasis on
accountability and the effective utilisation of available resources, has deemed the
historical methods of allocating personnel irrelevant. Where public demand for police
services is rising and increased expenditure on resources is not feasible, the issue of
managing and allocating resources becomes crucial.19
From the above, it can be deduced that more personnel does not necessarily equate
less crime, but more effective policing and better management of resources is critical
to effective policing and reduced crime levels. Therefore, it is significant for police
stations to be allocated resources in order to then be better positioned to police
effectively.
The following section provides a discussion around international and regional police
resource allocation models, and developments in relation to efficiently addressing
challenges of police resource allocation.
Internationally, in the absence of any objective means of quantifying the numbers of
police officers required to meet community needs, governments solely relied on ratio
of police officers to population in providing a determination of the overall number of
police officers required. However, relying on this ratio is deemed flawed as this only
measures what a community is prepared to spend on law enforcement rather than 20
what police resources it needs. More so, police workload cannot be measured by the 21total number of recorded crimes only.
ANALYSIS OF RESOURCE ALLOCATION IN THE SOUTH AFRICAN POLICE SERVICE
14
19 Skogan and Frydl, (2004) 20 CALEA Update. 2003. Measuring the Performance of Law Enforcement Agencies - Part 1 of a 2-Part ar�cle [O] Available at: h�p://www.calea.org/calea-update-magazine/issue-83/measuring-performance-law-enforcement-agencies-part-1of-2-oart-ar�cl. Accessed 23 March 2017 21 Garda Inspectorate: Promo�ng excellence and Accountability: Report of the Garda Síochána Inspectorate. [O] Available at: h�p://www.gsinsp.ie/en/GSINSP/48429%20Garda%20Inspectorate%20Resource%20Alloca�on%20Report%2009%20(Screen).pdf/Files/48429%20Garda%20Inspectorate%20Resource%20Alloca�on%20Report%2009%20(Screen).pdf. Accessed 9 March 2017
22 Heyer, G., Mitchell, M., Ganesh, S & Devery, C. 2007. An econometric method of alloca�ng police resources. Interna�onal Journal of Police Science & Management, 10(2): 192-213
It should also be noted that there is “limited information available on the methods used by 22
police agencies in allocating resources”. With that noted, available data on the resource
allocation models to police departments in various countries are discussed below:
8.1. New Zealand Police Resource Allocation Model
The New Zealand police department moved away from applying the traditional
resource allocation model which allocated resources to the total number of population
per area, to a focus on reducing high crime offences based on proactively dealing with
crime by directing resources to specific geographic areas with high crime or to specific
crimes. The Resource Allocation Model (RAM) was then introduced when the police
department realized that there were gaps with the way in which resources were
allocated as the processes were in no particular way addressing the problem of
escalating crime rates in New Zealand.
The RAM formula specifically took into consideration a total of nine variables in
informing resource allocation for the police to be better positioned in dealing with
crime. Socioeconomic, demographic and police-relevant variables are used to
determine the number of police officers per area, as compared to the allocation of
resources based on age group and population size, which has been another method
that New Zealand has been using. The six socioeconomic, socio-demographic and
police variables the formula accounts for are as follows:
· Age group of males
· Income
· Employment status
· Ethnicity
· Education
· Family related factors
· the number of incidents,
· the level of crime and
· the resolution rate
However, the challenge of balancing resources and services with budgetary constraints
and community desires remains.
ANALYSIS OF RESOURCE ALLOCATION IN THE SOUTH AFRICAN POLICE SERVICE
15

23 McCabe, J. 2012. An analysis of police department staffing: How many officers do you really need? A Review of 62 Police Agencies Analyzed by the ICMA / CPSM 24 Albrecht, J.F., & Das, D.K (ed). 2011. Effec�ve Crime Reduc�on Strategies: Interna�o nal Perspec�ves. CRC Press
8.2. United States of America Police Resource Allocation Model
The primary goal of police operations in the USA became crime reduction since the
professionalisation of the police functions in the early 20th century. The US has
subsequently made use of five common methods in determining human resource 23
demands; namely:
· Crime trends: This method became the benchmark for human resource
allocation in terms of police staffing, as the more crime was committed, more
police officers were hired in an effort to combat identified crimes. However, it has
been argued that this approach is inefficient to staffing because whenever the
police are unsuccessful at combating crime, the model would therefore call for
additional personnel in dealing with crime. Inversely, when the police are effective
at combating crime, fewer officers are thus deployed. Therefore the model was
developed on the basis of effectiveness whereby the police ratio was directly
dependent on their effectiveness in combating crime. Using this model
essentially provides motivations for poor performance and demotivation for
good performance . Furthermore, crime rates are predisposed by many other 24
dynamics other than solely the police response. Therefore, based on the
shortcomings of the model of resource allocation, using crime rates as a
benchmark to the number of staff an area is supposed to have, is no longer a
recommended approach as police departments are no longer applying the
model.
· Per-capita approach: In determining the total number of personnel required,
many departments made use of officer-to-population ratios. It was subsequently
argued that using this model in determining police staffing is ineffective and
unreliable.
· Minimum-manning levels: This was a predetermined approach to police staffing
informed by a minimum number of police officers required to ensure the
functionality of a police station. It was based on past practice, policy and
supervisory judgement
· Authorised/budgeted levels: Determining police staff for an area is solely
dependent on the budget a police department has received in providing policing
activities to various areas. Therefore, the model is simply developed on the
premise of the ability to afford as compared to community needs. This is a model
that fails to account for equitability in that specific communities' ability to pay
ANALYSIS OF RESOURCE ALLOCATION IN THE SOUTH AFRICAN POLICE SERVICE
16

taxes might be used to allocate resources more so making the model a politicised
one.
· Workload-based models: Workload based model is developed on the premise of
assessing demand and supply so as to close discrepancies. This approach relies
on an examination of calls for service received by a department, and these calls
are modelled to understand demand and supply. However, there are also
shortcomings with regard to this model in that it only considers calls made and in
turn runs the risks of recording physically reported calls. Regardless of its
shortcomings, workload-based model as compared to other models is believed to
be an accurate and reliable predictor of staff policing levels.
8.3. Ireland Police Resource Allocation Model
In Garda Síochána in Ireland, the allocation of police officers headquarters, national 25
units and the operational Garda divisions is determined by the Commissioner . The
Commissioners utilize the following elements in resource allocation:
· Crime levels;
· Demographic changes, and
· Factors relevant to security, such as time, geographical area, workloads.26
According to a study conducted by the Inspectorate on Irish police resource allocation,
there are case scenarios that can be applied in the process of efficiently allocating
services equitably, and they are inclusive of the following:
· Achievement of more balanced police officer workloads which will subsequently
lead to improved services and police safety;
· Adapting policy on allocation of police time, and
· Achieving closer alignment of police working times with patterns of demand for
police services.
It was also proposed that new systems were required in order to allocate resources
equitably; with the result that investment in modern technology investment was made
which included:
25 Garda Síochána Act 2005. [O] available at: h�p://www.irishstatutebook.ie/eli/2005/act/20/enacted/en/print . Accessed 9 March 2017 26 Garda Inspectorate: Promo�ng excellence and Accountability: Report of the Garda Síochána Inspectorate. [O] Available at: h�p://www.gsinsp.ie/en/GSINSP/48429%20Garda%20Inspectorate%20Resource%20Alloca�on%20Report%2009%20(Screen).pdf/Files/48429%20Garda%20Inspectorate%20Resource%20Alloca�on%20Report%2009%2 0(Screen).pdf. Accessed 9 March 2017
ANALYSIS OF RESOURCE ALLOCATION IN THE SOUTH AFRICAN POLICE SERVICE
17

· Computer Aided Dispatch system
· Resource Management System, and
· Demand Profiling Software
All the three above mentioned technologies and/or systems are used to explore the
demand for police services through providing an analysis on workload, deployment,
and response times.
8.4. Australia Police Resource Allocation Model
A New Zealand study researched the relationship between socioeconomic,
demographic and industry characteristics and the costs of delivering government
services in the area of law and order. These socioeconomic factors were inclusive of 27
income differentials, residential stability, youth of the population, employment status,
education, age, sex and family structure. The exercise took cognizance of the disparity
of resource allocation between Australian States, for example differences in the extent
of proactive and reactive policing.28
The results showed that, across Australia as a whole, police staffing distributions as
presently implemented by States, did not reflect relative needs relating to urbanisation,
disadvantaged tourism, or other factors. Instead they appeared to be simply a function
of the Australian State policy as determined by population size and historical factors. 29
Therefore, based on the findings, the Australian police force reconsidered their police
allocation model and focused more on socioeconomic, demographic and population
factors in their effort to effectively allocate resources.
8.5. United Kingdom Police Resource Allocation Model
In the United Kingdom, systems such as Computer Aided Systems, Records
Management System and Geospatial Information systems are used to guide
allocations of resources to the police through taking into account community
demands. The government has partnered with organisations to provide assistance in
maximising the use of information technology to develop sustainable police resourcing
models. The modeling tool is data driven and enables police departments to examine
areas of key importance such as neighbourhood crime, major crimes, protecting
vulnerable people, public protection unit, incident response teams, incident
management teams and force control room call takers.
27 McCabe, J. 2012. An analysis of police department staffing: How many officers do you really need? A Review of 62 Police Agencies Analyzed by the ICMA / CPSM 28 Ibid 29 Ibid
ANALYSIS OF RESOURCE ALLOCATION IN THE SOUTH AFRICAN POLICE SERVICE
18

It is equally significant for police to furnish valid and reliable data for resource models,
since “poor statistics” can be seen as a symptom of under-resourcing due to the
expenses involved in developing, monitoring and training authorities in data collection
systems”.30
In order for police departments to be better positioned to provide effective services to
communities, a sustainable model is required, which allows sectors to stimulate
potential changes to operational services, to understand the impact of any proposed
changes. This process is significant in that changes contribute to fluctuations that in
turn need to be evaluated in informing resource allocation in order to avoid under-
resourcing or over-resourcing areas in dealing with criminal offences. More so, the
model is supposed to be sustainable in addressing issues pertaining to supply and
demand needs through providing a detailed analysis on the impact of the following on
services:
· Reduced number of officers
· Changing crime types
· Skills profile
The demand tool allows police departments to understand demand, threat, risk and
harm, thus allowing them to prioritise in terms of service allocation to areas of greatest 31
priority. The demand and modeling tools, unlike traditional approaches of allocating
resources, is flexible in that it allows for adjustments taking into consideration the
overall demands based on data, viewing or changing model data or change of variables
as per a given scenario, and viewing of overall utilisation within the model for business
functions. The model covers the following components in resource allocation:
· Demand - total number of crimes
· Activity durations - time taken to investigate crime
· Resource abstractions - attending meetings or training
· Number of full-time employees
Due to the flexibility of the model, it is therefore possible for managers to make
adjustments and refinements where required since crime offences are not stable.
30 Hinton, M.S & Newburn, T. 2009. Introduc�on: policing developing democracies. In: Hinton, M.S & Newburn, T (eds.) Policing Developing Democracies. Routledge: Oxford, pp. 1-27. 31 Sopra Steria. Police Resource and Demand Modelling. Developing Sustainable resourcing models. [O] Available at: h�ps://www.soprasteria.co.uk/docs/librariesprovider41/Solu�on -Overview/sopra-steria---police-resource-and-demand-modelling.pdf?sfvrsn=2. Accessed 14 March 2017
ANALYSIS OF RESOURCE ALLOCATION IN THE SOUTH AFRICAN POLICE SERVICE
19
8.6. Wales and England Police Resource Allocation Model
Wales and England Police Forces are funded based on a two phase process. The first
phase involves the division of funds between different activities undertaken by the
police, and a portion of the total funding is also distributed taking into consideration
the population sparsity in addressing the specific needs of rural forces. The second
phase is to then divide funding for each of these workloads between all the local 32policing bodies. In order to do this, workload indicators which are based on socio-
economic and demographic indicators are calculated to estimate the number of
personnel for each police force. The formula consists of a basic amount per resident
and a basic amount for special events, and top-ups for the five key areas, sparsity and 33
area costs (which takes account for regional differences in costs).
The model was criticized for various reasons including the utilisation of outdated data
and a new Resource Allocation Model was proposed which was still in progress during
the time of writing this report. The new model is more simplified and transparent to
determine budget allocation at force level. Therefore, the new funding formula utilises 34
10 complex statistical regression models with the aim of distributing funding on the
basis of 'relative need' by using population data and a range of socio-economic
variables to estimate the 'expected workload' of each Police Force Agency, across a
range of crime and non-crime activities.
In summary, it is the responsibility of the Home Office to divide the total funding
available for that year's settlement between the five indicators based weightings and
therefore, a share for each indicator would be allocated between police forces based on
the proportion of each indicator within that police force area. The police force would
then get allocations for each of the five indicators based on its proportion of the Wales
and England total for that indicator. The police forces allocation would then be the sum
of the five sub-totals for each indicator.
8.7. African Police Resource Allocation Model
For resources to be efficiently allocated, adequate information is required. However,
many African countries are still experiencing challenges regarding their respective
information systems due to inadequate technological advances. This is a concerning
32 Ludwig, A & McLean, I. 2016. Principles of Police Funding in the UK. [O] Available at: h�p://ggcpp.nuff.ox.ac.uk/wp-content/uploads/2016/11/Working-paper-Funding-formula-final.pdf. Accessed 23 March 2017 33 Home Office (2015). Consulta�on on reform of police funding arrangements in England and Wales. London, Home Office. 34 See Home Office (2015).
ANALYSIS OF RESOURCE ALLOCATION IN THE SOUTH AFRICAN POLICE SERVICE
20

issue in that valid and reliable information provision is significant in informing decision
making. It is stated that “an information system which is tied to a map helps the police
commanders visualize the location of crime incidents which will also give them an
opportunity to access and process information quickly and be better positioned to 35allocate resources efficiently” . Crime mapping through the utilisation of GIS has
become a widespread approach in developed countries and this has subsequently 36 37
improved the services they render to the communities based on need analysis .
However, underdeveloped and developing countries are still lagging behind due to
slow advancement in technological operations.
It has been reported that there are many African continent based countries that are still
experiencing challenges regarding adequate management and allocation of resources
which subsequently negatively affects effective and efficient policing. Nigeria is still
faced with inadequate human resources to deliver the services to the communities 38
which are also coupled with mismanagement of resources . The Zambian Police
Department also applies uninformed criteria in resource allocation that is mostly 39guided by crime trends. This criterion does not allow for crime analysis prior to
resource allocation. In terms of available information system, a manual system is used
to record a case which is also time-consuming. Consequently, there is loss of 40
traceability, transparency and accountability . The challenges experienced by the
Zambian Police departments include lack of comprehensive crime analysis, lack of 41detailed data and lack of training and resources . More so, the Kenyan Police Force is
also faced with challenges in their function of delivering effective policing services as
required by law and expected by the public, and most of the police officers who were
interviewed for the study stated that the annual budgetary allocation of the Kenyan 42police is hardly enough to ensure that they discharge their duties effectively.
42
Omeje, J., & Githigaro, J.M. The Challenges of State Policing in Kenya. Peace and Conflict Review, [O] Available at: h�p://www.review.upeace.org/index.cfm?ejemplar=24&entrada=129. Accessed 13 March 2017
35 Katantamalundu, S.D. 2004. Developing a crime analysis informa�on s ystem for a police service in a developing country: The case of Zambia Police Service. [O] Available at: h�ps://www.itc.nl/library/Papers_2004/msc/upla/katantamalundu.pdf . Accessed 03 March 2017 36 Weir, R., & Bangs, M. 2007. The use of Geographic Informa�on System b y Crime Analysts in England and Wales. [O] Available at: h�p://citeseerx.ist.psu.edu/viewdoc/download?doi=10.1.1.97.4489&rep=rep1&type=pdf./ Accessed 14 March 2017 37 Balogun, M.J. 2003. Nigeria’s public service reform process: Human resources issues. [O] Available at: h�p://www.unpanl.un.org/intro/groups/public/documents/CAFRAD/UNPAN011072.pdf./ Accessed on 14 March 2016 38
Alemika, E. E. O. (1993). Criminology Criminal Jus�ce and Philosophy of Policing in Tamuno, T. N & Akano, A.O (Eds) Policing Nigeria: Past, Present and Future. Lagos: Malthouse Press Ltd. Pp. 30 -78. 39
(Katantamalundu, 2004). 40
Lyoko, G., Phiri, J., & Phiri, A. 2016. Integra�ng Biometrics into Police Informa�on Management System: A Case of Zambia Police. Interna�onal Journal of future computer and communica�on , 5(1): 1-7 41
See Katantamalundu, S.D. 2004
ANALYSIS OF RESOURCE ALLOCATION IN THE SOUTH AFRICAN POLICE SERVICE
21

In summary, it is evident by the above review that challenges pertaining to police
resource allocation are a global issue, and models guiding resource allocation are
continuously evolving.
The New Zealand model is based on national level resource allocation, similar to the
South African model. The rest of the models provide for local station level resource
adjustments, and are flexible as contexts differ. Most of the countires under review
utilise the workload and demographics variables in calculating police population.
For the SAPS, while the THRR is not without its challenges, the model has been
benchmarked internationally and is facing similar challenges as other police agencies.
The funding resource allocation model of England and Wales should be explored as an
option for South Africa given fiscal contraints. Currently, SAPS does resource allocation
at a national level based on various variables for human resource distribution.
Provinces then adjust these, and police stations are still without critical resources.
Going forward, SAPS should delegate resource allocation to cluster and police station
level, as police stations are best suited to make informed resource decisions due to
changing crime patterns, operational interventions, and accommodating changes in
shift times to make allowances for crime operations, amongst others. In this way,
cluster and station commanders are empowered and have the discretion to optimally
focus resources with an allocated budget, and at the same time be held accountable for
any failures. The discretion could extend to station commanders choosing to utilise
technology and more suitable vehicles rather than additional human resources and
more vehicles.
The blame for poor resourcing and poor station performance has always been
channeled to the national Organisational Development office, and vice versa.
The national model is to be revised to accommodate a Funding Allocation Model.
ANALYSIS OF RESOURCE ALLOCATION IN THE SOUTH AFRICAN POLICE SERVICE
22

9. STUDY FINDINGS
This section of the report provides the study findings taking into consideration the
following objectives:
· to provide an analysis of the allocation of resources at selected police stations by
comparing the allocation of human resources against the Fixed Establishment
(granted) at police stations to that proposed by the THRR (ideal);
· to identify problematic areas pertaining to input/audit sheets;
· to determine the process for distributing human resources at Provincial level;
and
· to identify the constraints that impact on the optimal utilization of human
resources.
As mentioned previously, only six stations per province were sampled for the study, and
the provincial results are not reflective as representing the whole of all the provinces, 43
nor generalizable to each of the provinces. It must be noted that many provinces have
provided comprehensive analyses on the study, but for purposes of the consolidated
report, key strategic issues have been highlighted.
The findings are structured according to the following thematic areas:
· Discrepancies with the THRR, Fixed Establishment, and Actual human resource
allocation
· Challenges regarding input sheets
· Vehicle allocation
· Reservists allocation
9.1. Discrepancies with the THRR, Fixed Establishment, and Actual human
resource allocation and the impact on policing
The process followed in resource allocation has been explained above. The following
were the provincial findings in relation to the THRR process:
· The Fixed Establishment is based on a 60% funding of the THRR total due to
budgetary constraints. All provinces experience variations in the allocation of the
THRR for SAPS members. In KwaZulu Natal, the fixed establishment was found to
be as low as 31% of the THRR, while a station in Nongoma receives a higher
proportion of 71% and 77%.
43 See Annexure A on list of police sta�ons sampled in each of the provinces.
ANALYSIS OF RESOURCE ALLOCATION IN THE SOUTH AFRICAN POLICE SERVICE
23
· In KwaZulu Natal, it could be argued that the THRR does attempt to address
questions of equitable resource distribution and transformation given that various
input items appear to target conditions of 'previous disadvantage', e.g. informal
settlements and unemployment, although it is not clear how these factors are
weighted.
· Due to the personnel strength of KwaZulu Natal, most stations appear to be
functioning on bare minimum levels, lacking even necessary resources to
implement the sector policing strategy. Despite the shortages, the Province has set
a baseline that all Captain Stations are required to have a minimum of 24 members
to staff shifts (i.e. a minimum of 6 per shift).
· In Gauteng, the provincial office of the SAPS has granted the police stations a
certain number of staff according to different ranks, however, the allocated number
becomes less at station level. Furthermore, the provincial office of the SAPS,
allocated a high number of staff that exceeded the granted number of staff for
police stations, according to the fixed establishment, RAG and the THRR.
· The KwaZulu Natal provincial office does not deviate from the fixed establishment
process, as demonstrated in 2011/12, due to the Province not having alternative
criteria which would justify any significant deviations. Western Cape also reported
that in the previous years, there were no deviations at the identified police stations
from the fixed establishment, however, this changed in the year 2016 wherein
deviations occurred due to additional posts and moving posts to priority stations.
North West province indicated it did not experience significant deviations.
· There are some variables on the THRR that do not make sense. For example in the
Western Cape, calculations are made according to the number of licenced liquor
outlets, the number of requests for licences, and the number of unlicensed
establishments that are closed down. However, there is no indicator for the number
of unlicenced liquor outlets. In the more informal areas which do not meet the
zoning bylaws, the number of licenced outlets may be more than four times as
many licenced outlets. A study conducted by the Medical Research Council in 2016
found that there were 170 licensed taverns and 750 unlicensed shebeens and 30 44umqombothi establishments. A similar pattern has been observed in other
township areas.
44 University of Cape Town. (2016). A mixed methods study of the nature and extent of the alcohol trade in Khayel�sha and community percep�ons. Dra� report. Western Cape, p. 68.
ANALYSIS OF RESOURCE ALLOCATION IN THE SOUTH AFRICAN POLICE SERVICE
24

The SAPS repeatedly draw links between the levels of alcohol use and abuse and
high levels of violence. Yet, the THRR does not include reference to one of the major
sources of alcohol in some communities which may vastly escalate the levels of
violence. The indicator of number of shebeens closed down is not an accurate
reflection of the problem. If the SAPS really wanted to impact on levels of violence
then it would need to develop a strategy to target unlicensed outlets, and it would
need to indicate the number of these outlets. The amount of time taken to respond
to policing unlicensed establishments is not factored into the THRR.
· Apart from crime statistics, it is unclear what other variables are used at provincial
level in determining priority stations for resource allocations.
· Provincial Commissioners retain the discretion to move personnel as per Section 12 45
(3) of the South African Police Service Act. This is based on a needs analysis as
determined by the Provincial Commissioner and the management team. The
redistribution of resources by Provincial Commissioners must however be within
the provincial budget parameters.
· In Mpumalanga and North West, stations indicated that they were still using the
RAG system which should have been replaced by the THRR. The RAG system is a
challenge because the number of resources which the Police Stations are to have
ideally has never been addressed due to budget constraints. Consequently, it has
been indicated by SAPS that RAG was phased out in 2011/12 and Station
Commanders were part of the evolutions process. In the previous three years, 46
Limpopo was not using the THRR for resource allocations.
· Despite the participation of police stations in KwaZulu Natal, Western Cape and,
North West in the THRR process, station members indicated they do not have faith
in the ability of the THRR to adequately resource the stations. Stations regarded the
THRR practice as not useful in curbing the challenge of adequate resource
allocation.
· All provinces felt that the THRR model has never been fully implemented, thus a
proper assessment of the model cannot be conducted.
· Some provinces such as North West and Free State reported that the actual post
establishment supersedes the fixed establishment until salary Level 7 due to
historical grade progressions. Thereafter it is post bound.
· There has been a drastic decrease for entry level constables for the Free State
Province from 2010/2011 to 2015/2016. Reasons provided by SAPS Provincial Office
for this sharp decrease is the fact that the Free State Province was overstaffed in
terms of its total Fixed Establishment and is currently in a stabilization phase where
it has to cut down to get to its actual numbers in terms of the Fixed Establishment.
45 South African Police Service Act 68 of 1995 46 Telephonic conversa�on with Limpopo Deputy Director: Research
ANALYSIS OF RESOURCE ALLOCATION IN THE SOUTH AFRICAN POLICE SERVICE
25

On the other hand, Northern Cape Police Service received on average year on year
more entry level police members. The figure below provides a national picture of
post allocations for Entry level Constables from 2010/11 to 2015/2016. The table
illustrates the decline in entry level constables with a sharp decline reflected in
2012/13, and a gradual increase since 2014/15.
Table 2: Depicting post allocations for SAPS Act entry level constables
Source: Northern Cape report 2017
Financial
years
2010/11
2011/12
2012/13
2013/14
2014/15
2015/16
Entry
level
Constables5091
4009
879
1348
2629
3493
· Provinces indicated that the ranking of stations are also questionable with low crime
areas ranked higher than high crime areas and vice versa.
· Due to inadequate PERSAL/PERSAP system updates, distribution of posts
verification is a challenge in that personnel movement is not recorded. For example,
a stations PERSAL/PERSAP system would reflect 20 personnel, but in actuality only
five warm bodies would be present. Additionally, the system does not reflect service
arrangements, casualties and temporary placements which are also detrimental.
· Due to shortages of resources to police other areas of need, the THRR does make a
consideration for the establishment of satellite stations or changes in station
boundaries, with minimum requirements. This is a challenge since the police are
not allocated additional human resources to staff new police stations or satellite
stations. Personnel are rather redeployed from one station to another station which
creates vacuums at other stations and on frontline service delivery.
· Furthermore, most of provinces indicated that duty arrangements reflect
member/s on the duty list, however, reflected member/s are not physically available
at the stations. More so, the findings in Mpumalanga reflect that the number of
days lost due to absenteeism is higher with fewer personnel as opposed to more
personnel.
· All provinces reported shortages of personnel within police stations and it was
reported by Mpumalanga that stations had personnel shortages that were vacant.
In all provinces, Stations have vacancies which have not been filled for long periods.
KwaZulu Natal and Western Cape had received additional operational posts in
September 2016. In Western Cape, there were also vacancies that had not been
filled and the filling of junior level posts process takes longer.
· More so, there was an increase in the total number of leave days despite personnel
shortage. Western Cape findings were that the allocation of the fixed
ANALYSIS OF RESOURCE ALLOCATION IN THE SOUTH AFRICAN POLICE SERVICE
26
establishment was not directly proportionate to the THRR and thus that the
sampled police stations have been under resourced for the past five years.
· In the same vein, transferring members from Station A to Station B results in
vacancies at Station A. In some instances of transfers, the budget allocated to the
post in Station C is transferred with the post to Station D. This means there is no
additional budget to refill the post at Station C which inevitably tempers with the
fixed establishment.
· Equally, building of new police stations not supported by additional budget results
in personnel having to be redeployed from other police stations, resulting in
vacancies at police stations. In North West, a new police station has been
completed but has not been capacitated for more than 3 years. It has been reported
that building inspections have to be conducted prior the operation of the police
station.
· It has also been reported that the police are increasingly conducting services other
than policing such as escorting ambulances and escorting suspects to courts,
councilors, medical patients, to mention but a few thereby increasing the police
workload. In Rural areas police provide other government services. Additionally, the
workload of other police personnel is increased as a result of extended duties that
have to be performed.
· Much time is also spent dropping off and fetching members from their homes.
Many senior managers also have drivers who are police members impacting
negatively on resourcing.
· It has also been reported by the Eastern and Western Cape that there are
misconstrued responsibilities at accidents where there are no victims. Thus based
on this, the burden of policing extends outside the ambit of the SAPS mandate. Non-
policing functions in different socio-economic settings are characterised by
environmental design factors and lack of infrastructure.
· Provincial priorities, for example, the sudden need to establish a specialised unit in
a particular police area to deal with specific crime will therefore require the
redeployment of personnel to the specialised unit subsequently disadvantaging
front line service delivery.
Despite the human resource shortfall presented above in all the provinces, the police
have to utilise what is available to render policing services to the different communities
and deal with the burden of policing per police precinct. Station Commanders have
limited scope in terms of dealing with the burden of policing. This is partly attributed to
police having to deal with non-police functions such as escort services which
subsequently contribute to the utilisation of the available resources for non-police
functions. The diversion of resources impacts on other functions like serving orders to
offenders in an area which lacks street addresses and visible policing.
ANALYSIS OF RESOURCE ALLOCATION IN THE SOUTH AFRICAN POLICE SERVICE
27
Other challenges that posed a challenge on policing, in Gauteng and North West for
example, include the geographical area of the police precinct, whereby seasonal influx
of harvest/migrant labour are not accounted for, roads in bad conditions, police and
vehicle attacks during community unrests, and management of leave as in some
instances, taken leave days are not recorded.
The other challenge relates to filling of vacant posts, which police stations have little
control over as it is a provincial competency. The filling of posts takes a long period
particularly junior level posts. Sector policing and other policing operations are also not
fully functional due to resource constraints.
47Resource constraints lower morale of personnel as they operate under difficult
conditions. The shortage of staff during shifts puts more strain on the officers on duty.
The result is that quality service delivery is being compromised.
9.2. Challenges regarding input sheets
The section sought to identify problematic areas pertaining to input/audit sheets and
relevant information. It is significant to note that in order for resources to be allocated
adequately and for the THRR to be successful, data accuracy is of utmost importance.
The findings in relation to information from police stations highlighted the following:
· In the Northern Cape, there is no standardised method of information
interpretation by the Station Commanders or MICs. Furthermore, due to bad filing
practices information is incorrect, unreliable and flawed at some stations. Station
Commanders were also not validating information on the input sheets. There were
however three stations who were doing fairly well in terms of managing the input
sheet.
· Crime Intelligence Officers (CIO) conducts crime statistics analysis and compiles
Station Intelligence Profiles (SIP). The CIOs function is to advise the Station
Commander on crime trends every 12 hours. CIOs and Management Information
Centres (MIC) must input data into the input sheet. In many stations the relevant
members are not trained or familiar with inputting information. It was also evident
from the Western Cape and Northern Cape report findings that none of the
sampled police stations had knowledge of the THRR system, let alone actual
involvement in determining the resource requirements for police stations. It was
only Management Information Officers (MIOs) and the station commanders who
were aware of the THRR process, and this was attributed to issues of compliance to
the Provincial office.
47 Gauteng report. 2017.
ANALYSIS OF RESOURCE ALLOCATION IN THE SOUTH AFRICAN POLICE SERVICE
28
· In the Free State, almost all stations were able to provide the THRR input sheets,
and at those Stations where input sheets were not available the information was
obtained from Provincial office. In cases where input sheets were available, the
integrity of some data was questionable. For example, at one station, police station
management indicated they had 226 smallholdings to police, while only 160
smallholdings were reflected on the input sheet.
· Record keeping was also a problem at most stations in most provinces, including
Gauteng. In some stations there were no hard copy records kept at the Registry, and
the failure of the station Information Technology equipment has resulted in loss of
data, which could not be retrieved due to a failure on the side of SITA. Free State
Station management was undergoing training on the completion of the input
management sheets, and input sheet data integrity verification process is
underway throughout the Province. Management also indicated that the Fixed
Establishment was in the process of being revised.
· Western Cape findings show that input sheet indicators did not always account
accurately for the distinctiveness of each police station. For instance, the input
sheet has a gang indicator which is weighted like any other indicator, but it falls
short of accounting for the frequency of gang violence, the size and nature of the
particular gangs, gang activities and more importantly, the impact of gangs in terms
of police resource allocation and distribution. Additionally, the input sheet fails to
account for time taken in responding to domestic violence cases, and areas without
home addresses. In some case, the Western Cape found that the same numbers
were being populated into input sheets year after year with no apparent changes
over the years. Findings in Western Cape showed that there was lack of data
governance, tight record management at the identified police stations; hence the
police stations could not provide certain data and information that was required.
Additionally, the manner in which the historical data was stored poses a challenge in
terms of accessibility of the information.
· In KwaZulu Natal, the population figures contained in the input sheets sometimes
differed from those in the SIP. The discrepancy is as a result of informal settlements
and illegal liquor trading which contributes to areas not being considered in the
calculations. Additionally, a discrepancy regarding the input sheet is the
requirement on the input sheet in relation to the number of unlicensed liquor
outlets, which may be imprecise due to the very nature of illegal liquor trading.
Similarly, the THRR input process provides a field for “tribal areas”. The assumption
is that “tribal areas” require special attention in resourcing, hence its inclusion in the
input sheets.
ANALYSIS OF RESOURCE ALLOCATION IN THE SOUTH AFRICAN POLICE SERVICE
29

· In Mpumalanga, most of the stations do not have the THRR input sheets and the
information provided was obtained from the Efficiency Index System. There were
many discrepancies regarding the information. All Stations sampled were unable to
provide the rate of absenteeism in terms of the Efficiency Index as compared to the
baseline.
· There were unclear formats of duty sheets with functions at the stations as per the
fixed establishment in Free State, Northern Cape, Eastern Cape and Western
Cape.
9.3. Vehicle allocation
In order for effective policing to be realised, the National approved norm of personnel
to vehicles is approximately 4.5:1. Findings from Mpumalanga, KwaZulu Natal, North
West, Eastern Cape, Northern Cape, Free State, Gauteng and Limpopo were that all
stations experience shortage of vehicles. The shortages were a result of vehicles being
boarded at garages or undergoing repairs, and yet these were still reflected on station
vehicle logs. However, in the Western Cape there was an indication that all sampled
stations were capacitated above their allocated granted threshold, but as with the
other provinces, the vehicles were not active or have mechanical problems.
The challenges outlined by the provinces were that the turnaround time to repair
vehicles was lengthy due to unqualified mechanics at state garages. Most of the
stations indicated that they were allocated vehicles that did not suit their policing
terrain, which in return hindered them from reaching other parts of their precincts.
Another impediment which impacts on policing is the transporting of members to and
from homes which contributes to resource shortage.
The findings from Northern Cape indicates that the shortages of vehicles at stations
are not taken into consideration with the allocation of vehicles, Priority Stations were
sometimes overlooked, the type and configuration of a vehicle is not considered when
allocating vehicles to certain geographical or topographical areas and vehicles were
being allocated without taking the purpose for which the vehicles will be used into
consideration. More so, according to the Northern Cape findings, the budget for
vehicles decreased over a 7-year period whilst the personnel increased by 12.77%.
Mpumalanga findings stipulate that there was no Fixed Establishment granted for
vehicles which subsequently made it a challenge to make comparisons between fixed
and actual allocations. Even though all the provinces encountered challenges with car
allocations, it was reported in the KwaZulu Natal that the provinces vehicle allocation
was significantly higher since 2011/12. However, regardless of the increase, KwaZulu
Natal police stations have reported that the vehicle listed by SAPS as being allocated to
ANALYSIS OF RESOURCE ALLOCATION IN THE SOUTH AFRICAN POLICE SERVICE
30
a particular station are at times different to what actually exists at that station.
It was reported by Gauteng that stations did not have satisfactory budget to purchase
suitable vehicles every financial year since the budget was always inadequate to meet
the requirements of vehicles at those particular stations. Therefore, stations opted for
cheaper and less appropriate vehicles to perform tasks.
Over and above the challenges faced, North West findings showed that police stations
were unable to provide complete information regarding vehicles, due to lack of proper
records management.
According to the above analyses the allocation of vehicles was not in line with the
increase of personnel in the Provinces.
9.4. Allocation of reservists
The value-add and contribution of reservists, although sporadic and intermittent, was
intended to alleviate the burden on permanent police members. Much of their
contribution was dependent on training provided, the service delivery ethos, and any
unique skills they could provide.
In Mpumalanga, there was a decline in the number of reservists because reservists did
not get stipends, or were unable to secure permanent positions in the SAPS.
Additionally, other reservists in the stations are not completely active. In KwaZulu
Natal, most stations had 3 or fewer reservists over the period under review. In the
Eastern Cape, reservists were not being used strategically, and the rural stations do
not have adequate reservists. In the Western Cape, the number of reservists in the
stations under review deceased between 2011/12 to 2015/16. In North West,
reservists' figures declined due to loss of interest and the implementation of the SAPS
National instruction 3 of 2014 which laid strict requirements for appointment of
reservist, with many being disqualified. In addition to a series of assessments that a
potential reservist must undergo, a reservist must possess a senior certificate (Grade
12), or proof that they have completed a SAQA accredited NQF level 4 qualification.
Based on the discussion above, the decline in reservists in many provinces was due to
the 2011/2012 directive which sanctioned a purification of reservists, wherein
reservists had to be verified. Thus based on the verification process findings, some
reservists were terminated due to criminal records. The general feeling was that
reservists do not complement stations and therefore, are not adding any value to
stations.
ANALYSIS OF RESOURCE ALLOCATION IN THE SOUTH AFRICAN POLICE SERVICE
31

10. CONCLUSION
Police strategies in the SAPS have undergone many changes in the past two decades,
coupled with challenges which have been stimulated by economic and community
expectations. SAPS resource allocation has been in the forefront of the challenges, as
demonstrated by this study.
The SAPS has over the years moved their method of allocating resources from RAG to
the THRR, in the hope that the constraints of allocating resources would be addressed.
The models and processes established have been developed over a considerable
period of time and clearly a great deal of thought and resources have been put into this
process.
The study findings demonstrate that the transition in the modeling approaches has had
minimal impact; the SAPS model for allocating resources is reliant on the availability of
a larger budget, accuracy of data from provinces and police stations, and is grounded
on the discretion of Provincial Commissioners, who rightfully tend to prioritise their
crime concerns. It should be emphasized that the THRR is used to determine the ideal
number of personnel, but in the end the SAPS budget and the MTEF determine the
number of posts that can be established. This situation according to discussions with
National Treasury and SAPS management will continue due to low fiscal growth.
The outcome of the THRR has not been subjected to any assessment as there is no
evidence of any police station being capacitated to the full prescription of the THRR
system, yet the model is meant to determine and allocate resources to police stations in
order to perform required tasks. In this context, it is evidently difficult to determine
whether the main problem lies with the THRR system - in the sense that the resources it
allocates do not meet the needs of the community and the burden of policing per police
station.
The international literature demonstrates that countries worldwide are experiencing
police resource challenges, with ineffective resourcing models being continually
revised. The international literature further demonstrates that more personnel does
not necessarily equate to less crime, but more effective policing and better
management of resources is critical to effective policing.
The study findings show that approximately 57% of the SAPS members are allocated to
administrative and management posts. Only 43% of the entire SAPS workforce is based
at the frontline at police stations.
ANALYSIS OF RESOURCE ALLOCATION IN THE SOUTH AFRICAN POLICE SERVICE
32

By all standards, the SAPS is one of the largest police services in the world, and as the
cost analysis indicates, it is highly bureaucratic and top heavy. These features point to
potential easy wins in terms of improving SAPS service delivery. For example, reducing
the levels of bureaucracy, requiring a lower level of administration, devolving decision
making, and flattening the hierarchical structure, will easily lead to a more cost effective
institution. Administrative functions such as currently undertaken by police members
employed under the SAPS Act must be reallocated to employees appointed under the
PSA Act. The new reliance on PSA Act employees will immediately be reflected in a new
balance between frontline members and other SAPS staff, such as in crime prevention
and visible policing.
11. RECOMMENDATIONS
The following short term recommendations are provided in dealing with resource
allocation in the SAPS:
· Given that the THRR allocations have never been implemented to its full potential,
10% of police stations across the country must be capacitated fully to determine the
value of the THRR. The performance of these stations must then be monitored on a
continuous basis over a period of three years to determine effectiveness.
· In order to address the imbalance of more management to fewer frontline
operational members, the administrative and management posts have to be re-
examined, as operational members are critical for service delivery
· An intensive investigation be undertaken to standardize and automate
administrative functions.
· Stations management should be actively involved in all the THRR processes to
better understand the THRR process and detailed training on the THRR must be
conducted with managers.
· The performance management system has to be reviewed to determine the
adequacy of the performance. For example, high crime reports should not be
regarded as poor police station performance.
· Alternative policies and strategies must be formulated and clearly outlined to
address the challenge of police having to play roles additional to their scope of work
which adds to the burden of policing.
· Police station management should be given the prerogative to recruit members and
fill vacant post according to their station needs, and based on merit.
· Reasons for the moratorium on reservists must be explored to deal with the issues.
The policy on Reservists must be implemented by the SAPS.
ANALYSIS OF RESOURCE ALLOCATION IN THE SOUTH AFRICAN POLICE SERVICE
33

· There must be standardization of data management processes and systems across
all police stations. Information management systems must be improved to allow
proper record keeping.
· There must be an ongoing monitoring of the input sheet to curb incorrect
information being populated .
· Station Commissioners must be assessed on the availability and correctness of
information on the THRR input sheets in order to enforce correctness of
information. Provincial Commissioners must come up with strategies to guide the
evaluation of Station Commissioners role in ascertaining that data captured is
correct.
· THRR input sheets should be revisited by National Organizational Development to
determine the relevance of some of the information that is captured on the input
sheets.
· A full comprehensive fleet management cost, performance and operational
efficiency audit be undertaken.
The mid to long term recommendations on resource allocation is to include the
following:
· The proposed recommended model for the future should be based on the Funding
Allocation Model as used by England and Wales. In this way, resource allocations at
station level could be determined by Cluster and Station Commanders, as per the
demands and requirements of each police station, based on proper assessments.
· Any new approach should be implemented alongside a Change Management
process to get the buy in of employees.
· In the absence of a fully adequate model for allocating resources, alternative
policing operating approaches for more effective policing must be executed by SAPS
(See Annexure B).
· The obligation to embrace SMART policing must reside and be driven by the Minister
of Police and the Provincial MECs for Safety.
ANALYSIS OF RESOURCE ALLOCATION IN THE SOUTH AFRICAN POLICE SERVICE
34

12. BIBLIOGRAPHY
Albrecht, J.F., & Das, D.K (ed). 2011. Effective Crime Reduction Strategies:
International Perspectives. CRC Press
Alemika, E. E. O. (1993). Criminology Criminal Justice and Philosophy of Policing in
Tamuno, T.N & Akano, A.O (Eds) Policing Nigeria: Past, Present and Future. Lagos:
Malthouse Press Ltd. Pp. 30-78.
Balogun, M.J. 2003. Nigeria's public service reform process: Human resources issues.
[O] Available at:
http://www.unpanl.un.org/intro/groups/public/documents/CAFRAD/UNPAN011072.p
df. Accessed on 14 March 2016
Bradford, B. 2011. Police numbers and crime rates – a rapid evidence review. [O]
Available at: https://www.justiceinspectorates.gov.uk/hmic/media/police-numbers-
and-crime-rates-rapid-evidence-review-20110721.pdf. Accessed 16 March 2017
Bright, C & Walker, J. Police. Resource Allocation. [O] Available at:
http://www.aic.gov.au/media_library/publications/proceedings/24/bright-walker.pdf.
Accessed on 14 March 2017
Carr-Hill, R. 2000. Developing a robust resource allocation formulae for police.
Policing and Society, 10: 235-261
Casady, T. 2011. Police Legitimacy and Predictive Policing. Geography and Public
Safety, 2(4): 1-16
Commission of Inquiry. 2014. Towards a safer Khayelitsha: Report of the Commission
of Inquiry into Allegations of Police Inefficiency and a Breakdown in Relations
between SAPS and the Community of Khayelitsha. [O] Available at:
http://www.khayelitshacommission.org.za/images/towards_khaye_docs/Khayelitsha_
Commission_Report_WEB_FULL_TEXT_C.pdf. Accessed 10 March 2017
COMPSTAT: Its origins, evolution, and future in law enforcement agencies. Bureau of
Justice Assistance. Police Executive Research Forum
Den Heyer, G. 2014. Examining Police Strategic Resource Allocation in a time of
austerity. Salus Journal, 2 (1), pp.63-79
ANALYSIS OF RESOURCE ALLOCATION IN THE SOUTH AFRICAN POLICE SERVICE
35

Fairness and Effectiveness in Policing: The Evidence Committee to Review Research
on Police Policy and Practices, Wesley Skogan and Kathleen Frydl, editors, National
Research Council
Fatih, D., & Bekir, C. 2015. Police use of technology to fight against crime. European
Scientific Journal, 11(10): 1857 – 7881
Garda Inspectorate: Promoting excellence and Accountability: Report of the Garda
Síochána Inspectorate. [O] Available at:
http://www.gsinsp.ie/en/GSINSP/48429%20Garda%20Inspectorate%20Resource%20
Allocation%20Report%2009%20(Screen).pdf/Files/48429%20Garda%20Inspectorate
%20Resource%20Allocation%20Report%2009%20(Screen).pdf./ Accessed 9 March
2017
Heyer, G., Mitchell, M., Ganesh, S & Devery, C. 2007. An econometric method of
allocating police resources. International Journal of Police Science & Management,
10(2): 192-213
Hinton, M.S & Newburn, T. 2009. Introduction: policing developing democracies. In:
Hinton, M.S & Newburn, T (eds.) Policing Developing Democracies. Routledge:
Oxford, pp. 1-27.
Holmes, Z. 2016. Why more police won't reduce crime. [O] Available at:
http://www.sydneycriminallawyers.com.au/blog/why-more-police-wont-reduce-
crime/. Accessed 16 March 2017
Kennedy, D.M. The Strategic Management of Police Resources.
Levitt, S. 1997. Using Electoral Cycles in Police Hiring to Estimate the Effect of Police
on Crime. The American Economic Review, 87 (3): 270-290.
Llorente, M.V., & A Rivas. 2005. Case Study Reduction of Crime in Bogota: A Decade
of Citizens' Security Policies. WorldBank: Washington DC
Martin-Roethele, C. 2013. Police Innovation: Enhancing Research and Analysis
Capacity through Smart Policing. Arizona State University
Matlala, R.L.G.2016. Defining e-policing and smart policing for law enforcement
agencies in Gauteng Province. The International Journal of Social Sciences and
Humanities Invention, 3(12): 3058-3070
ANALYSIS OF RESOURCE ALLOCATION IN THE SOUTH AFRICAN POLICE SERVICE
36

McCabe, J. 2012. An analysis of police department staffing: How many officers do
you really need? A Review of 62 Police Agencies Analyzed by the ICMA / CPSM
Mizoram Police. 2017. Crime and Criminal Tracking Network and System: An
initiative of Ministry of Home Affairs and National Crime Records Bureau
Government of India. [O] Available at:
http://egovreach.in/uploads/presentation/aizwal/DIG_CID_presentation.pdf./
Accessed 10 March 2017
National Research Council. 2004. Fairness and effectiveness in policing: The evidence.
Committee to review research on police policy and practices. Skogan, W & Frydl, K
(eds). Committee on Law and Justice, Division of Behavioural and Social Sciences and
Education: Washington, DC. The National Academic Press
Newham. G. 2009. Cops and robbers: a new approach. The Gauteng Aggravated
Robbery Strategy. [O] available at: . http://sayas.org.za/sacq/article/view/903/849
Accessed 10 March 2017
Newsroom Transcript. 2014. Transcript of Prime Minister Lee Hsien Loong's speech
at Smart Nation launch on 24 November. [O] Available at:
http://www.pmo.gov.sg/newsroom/transcript-prime-minister-lee-hsien-loongs-
speech-smart-nation-launch-24-november Accessed on 10 March 2017
Omeje, J., & Githigaro, J.M. The Challenges of State Policing in Kenya. Peace and
Conflict Review, [O] Available at:
http://www.review.upeace.org/index.cfm?ejemplar=24&entrada=129./ Accessed 13
March 2017
Pearsall, B. 2010. Predictive Policing: The Future of Law Enforcement? NIJ Journal,
266: 1-36
Public Service Commission. 2011. Consolidated Report on Inspections of Detective
Services: Department of Police. [O] Available at:
http://www.psc.gov.za/documents/2012/Police%20Report%20Complete.pdf.
Accessed 9 March 2017
Report of the portfolio committee on Police on Oversight visits to police stations in
Nyanga and Philippi in the Western Cape Province, dated 31 October 2014. [O]
Available at: . Accessed 10 March https://pmg.org.za/tabled-committee-report/2126/
2017
ANALYSIS OF RESOURCE ALLOCATION IN THE SOUTH AFRICAN POLICE SERVICE
37

Santos, R.B. 2013. Crime Analysis with Crime mapping (3rd ed). SAGE Publications:
London
Schwartz, G.J., Chunrink, W.J., & Stanz, K.J. 2007. Frontline police employees' social
construction of client service. SA Journal of Human Resource Management, 5 (3): 38-47
SMART Policing. A Proposed National Initiative. CNA Analysis and Solutions.
http://www.smartpolicinginitiative.com/sites/all/files/ta/SmartPolicingFinal.pdf
Sopra Steria. Police Resource and Demand Modelling. Developing Sustainable
resourcing models. [O] Available at:
https://www.soprasteria.co.uk/docs/librariesprovider41/Solution-Overview/sopra-
steria---police-resource-and-demand-modelling.pdf?sfvrsn=2./ Accessed 14 March
2017
Using ICT to Fight Crime - A Case of Africa Henry Osborn Quarshie MBA (MIS) pg.
Cyber law Lecturer regent university college of science & technology, Accra, Ghana
Weir, R., & Bangs, M. 2007. The use of Geographic Information System by Crime
Analysts in England and Wales. [O] Available at:
http://citeseerx.ist.psu.edu/viewdoc/download?doi=10.1.1.97.4489&rep=rep1&type=
pdf. Accessed 14 March 2017
Yüksel, Y. 2015. Police Culture and Change: The Case of Compstat In Police
Organizations. Selçuk Üniversitesi Sosyal Bilimler Enstitüsü Dergisi, 34: 107-121
ANALYSIS OF RESOURCE ALLOCATION IN THE SOUTH AFRICAN POLICE SERVICE
38

13. Annexure A: Sampled police stations as per the nine provinces
Western Cape Paarl East Colonel, Category C Mfuleni Colonel, Category C Manenberg Brigadier, Category C2 Nyanga Brigadier, C2 Prince Alfred Hamlet
Captain, Category A
Kleinmond police station
Captain, Category A
North West
Brits
C2
Sun City/Mogwase
B/ C1 Cyferskuil
A
Klerksdorp
C2 Wolmaraanstad
C1
Christiana
A
Vryburg
C1
Pudimoe
B
Reivilo
A
Mahikeng
C2
Motswedi
B
Nietverdiendt
A
Mpumalanga
Fernie Police Station
Captain, Category A
Embalenhle Police Station
Colonel, Category C
KwaMhlanga Police Station
Brigadier, Category C2
Hendrina Police Station
Captain, Category A
White River Police Station
Lieutenant Colonel, Category B
Schoemansdal Police Station
Lieutenant Colonel, Category B
Northern Cape
Kimberley Police Station
Brigadier
Kuruman Police Station
Brigadier
Roodepan Police Station
Colonel
Kakamas Police Station
Colonel
Modderrivier Police Station
Captain
Bathlaros Police Station
Captain
Free State
Heidedal Police Station
Urban
Kroonstad Police Station
Rural/Urban
Park Road Police Station Urban
Soutpan Police Station Rural
Tweespruit Police Station Rural
ANALYSIS OF RESOURCE ALLOCATION IN THE SOUTH AFRICAN POLICE SERVICE
39

Gauteng Welbekend Police Station Rural Enkangala Police Station Rural Randfontein Police Station
Rural
Pretoria Central Police station
Urban
Akasia
Police station
Urban
Loate
Police station
Urban
KwaZulu Natal Hlobane
Captain-
upgraded to Lt Col -
Sept 2016
Hluhluwe
Captain-
upgraded to Lt Col -
Sept 2016
Mondlo
Lt Col
Madadeni
Col
Osizweni
Col
Jozini
Col
Umlazi
Brigadier
Nongoma
Brigadier
Limpopo
Namakgale
Colonel Semi-urban
Thohoyandou
Brigadier Semi-urban
Tzaneen
Brigadier Semi-urban
Siloam
Lieutenant Colonel
Rural
Dennilton
Colonel
Rural
Marble Hall
L.T. Colonel Rural
Eastern Cape
New Brighton
Humewood
Motherwell
Ngangelizwe
Libode
Umthatha
ANALYSIS OF RESOURCE ALLOCATION IN THE SOUTH AFRICAN POLICE SERVICE
40

14. Annexure B: Improving frontline policing: Towards a technologically
SMART policing approach
The 2016 White Paper on Policing proposes an integrated approach to policing which is
geared amongst others, towards an optimal utilisation of public resources. Greater
emphasis must be placed on maximising the utilisation of law enforcement resources,
such as with Municipal Police Service (MPS), for effective and efficient policing. MPS are
well placed at municipal level to proactively address crimes through the rigorous
enforcement of their two mandates - traffic enforcement and by-law enforcement. By
ensuring that traffic laws and by-laws are observed, MPS will contribute to instilling a
culture of lawfulness. In this way MPS can effectively contribute to visible policing and
are in a position to observe violations of by-laws and petty and other crimes.
The partnership and coordination approach of the MPS and the SAPS will ensure a
greater impact on the prevention of criminality. The limited human capacity of the MPS
and the limitation on the crime prevention role will allow a greater focus on by law
enforcement and traffic enforcement, particularly given the legislative requirement
which states that traffic law enforcement may not be compromised in favour of the
other two mandates.
Moreover, a regulatory framework must be established for conferring of limited
investigative competencies for Metropolitan Police to conduct investigations for
preparation to submit to court. This is to include particular categories such as traffic
related matters, municipal by-laws, as well as crimes committed on and related to
municipal assets or environment, such as theft and tender irregularities, amongst
others. MPS may only detain suspects until the SAPS are able to take custody.
The above approach is directly in line with the 2014 SAPS 'Back to Basics Strategy',
which is a comprehensive, multi-disciplinary, and integrated, police safety plan
involving all force multipliers. One of the pillars of the SAPS back to basics strategy is
that targeted, informed deployment of operational resources be made by the SAPS to
ensure the optimal utilisation of the limited resources that the police have at their
disposal to ensure that they are applied to the maximum effect.
Modern information systems and computer technology are able to enhance the ability
of police agencies to allocate resources by identifying changes in crime patterns,
among others. However, in order to effectively manage high volumes of data, high
priority must be given to process of crime analysis and the application of real time
analytics. These systems usually result in the adoption of dashboard-type systems
which facilitate management decisions and resource deployment.
ANALYSIS OF RESOURCE ALLOCATION IN THE SOUTH AFRICAN POLICE SERVICE
41

These systems provide commanders with real-time access to current reports and
deployment patterns of resources. Modern systems rely heavily of Machine Learning
systems which may alleviate administrative tasks associated with report preparation
and speed up patterns of recognition analysis. The resulting reduction in
administrative workloads can contribute the redirection of human resources to
frontline tasks.
As it is evident that public sector budgets are, in real terms, shrinking, there is an urgent
need for more efficient policing. CompStat and related technologies can therefore help
to ensure that police resources are monitored and used effectively.
These technologies are widely used by emergency services and have increasingly been
adopted by the private sector in delivering efficient services. Modern taxi hailing
systems too routinely rely of real time monitoring of fleets, satellite based identification
of client locations, automated estimation of shortest routes between journey start and
end points, and even the seamless estimation of costs and billing of clients. All of these
are achieved with virtually no manual input of data or clerical staff. Bringing the same
technology to bear on the deployment of police resources will have a profound impact
on their efficiency and thus the number of resources required.
Police departments have been somewhat slower in embracing these technologies.
Despite this there has been a trend towards adopting intelligence-led policing
strategies or information-led policing strategies relying on analysis to guide decision-
making. More so, for SMART policing to be implemented successfully, technology is a
prerequisite, and an interdependent holistic relationship with communities is of
utmost importance.
Within the existing resource allocation, substantial improvements in service delivery
can be achieved by minimizing and streamlining the administrative burden carried out
by the SAPS. Currently with almost 57% of the SAPS employees occupied with
management, supervision and administration, only 43% are frontline operational
members based at stations. This ratio must, at the very least, be reversed, and the
technologies referred to above will eventually be instrumental in reaching that goal.
There are easy gains to be had by frontline operational police using devices that record
their location, as well as statements made by witnesses, photographs and even
fingerprints. While this technology can place key information in the hands of frontline
police (images of suspects, criminal records, ownership details of vehicles, addresses,
status of firearm licences, citizenship status, warrants, and others), their primary
impact can be to dramatically reduce downstream administration burden. This may
include the elimination (or substantial reduction) of manual data input, the
ANALYSIS OF RESOURCE ALLOCATION IN THE SOUTH AFRICAN POLICE SERVICE
42

classification and archiving of records, and others. The technology will simultaneously
facilitate the monitoring and management of frontline staff and oversight. Currently
poor crime and operational information management, including inaccurate recording
and collation of information, inadequate analysis and infrequent dissemination of
statistics affect the performance of the police service.
Generally the required technology is available off the shelf, is often low cost, or even
free. However, the integration of this technology into the existing system depends on
the creation of IT platforms and, more challenging, the adoption of new attitudes to the
integration of SMART technologies and the way in which managerial oversight is
exercised.
The key question is not how SMART technology can be deployed in crime prevention
but how can existing resources be better utilized, lead to higher prosecution rates,
better crime prevention, and ultimately more secure communities. One promising
answer is to streamline administration, management, and oversight by using SMART
technologies that are increasingly commonplace. These technologies can, at the very
least, free resources from administration and managerial tasks for deployment 'on the
frontline'.
The adoption of technologies and innovations has in the past been impeded by a
mindset of senior and middle level management, who have grappled to embrace off
the shelf technologies. The E-Docket system is an example of the inability of SAPS to
embrace innovation, or make efforts to get it right.
Small steps include the Namola Cellphone Application that has been implemented in
the Brooklyn Station precinct in Pretoria. With this application on a cellphone, one is
able to send information through about a crime in progress to a Namola system in the
police control room as well as in the police vehicles. The police can then pinpoint the
place of the incident immediately and the nearest vehicle will respond immediately.
The Memeza Community Safety Alarm System is holistic community based public
alarm system that is directly integrated with the SAPS, CPF and community structures. It
was designed to ensure that it is affordable enough to allow low income learners to link
with the SAPS. The system was developed specifically for the SAPS, based on SAPS
requirements and challenges. It improves front line service delivery to communities,
with the SAPS being able to track service levels with validated data. It enables
communities to immediately notify the SAPS of any crime, allowing SAPS to proactively
respond. Through the system, the SAPS are able to track and measure their own front
line delivery services with an “on scene” SAPS functionality, which allows the measuring
ANALYSIS OF RESOURCE ALLOCATION IN THE SOUTH AFRICAN POLICE SERVICE
43

of response times. The system works with a remote alarm. Pressing the panic button
allows the following:
• Produces a unique three-phase siren sound (designed at the request of
Business Against Crime) to alert the neighbourhood and Street Patrollers
• Flashes a red light to make easy identification of the house in distress
• Sends out alert SMS messages to the cell phones of the local Sector Police, Street
Watches, Patrollers as well as pre-selected family, neighbours and friends. No
limit to the number of respondents to be notified.
• The SMS includes the street address or land mark of the house where the alarm
has been activated.
• Intruders are scared away by the activation of the deafening sound and bright
red flashing light.
• Logs all crime statistics to a back end database for up to date reporting, audit
trail and accountability.
• Communicates with the Back End Management system, ensuring every incident
or activity linked with the actual unit, or customer is captured and stored. The
back end system provides access to real time, validated crime intelligence, linked
to the individual impacted, geographical area and data related to the crime.
Some farmers in the Eastern Free State are making use of Drone Technology to patrol
their farms. The SAPS do not have the manpower to patrol all of the farms every day.
Therefore farmers are utilizing drones fitted with cameras that are programmed to fly a
route via certain co-ordinates to patrol the farm borders. The farmer monitors the
fences through the camera fitted to the drone. Many farmers also make use of the
Marnet Radio System which is linked to the Police Station in order to enhance policing in
the area. During farm attacks communication is effectively facilitated with each other
and the Police.
The Neighborhood Watch system and Community Patrollers initiative are also ways to
compliment the SAPS establishment. Stations have entered into the social media arena
and most have social network platforms such as Facebook pages where the community
can ask questions or leave comments regarding station functioning.
Even though there have been minor technological advances in the policing sector, the
following hi-tech areas must be considered towards a new approach for policing in
South Africa.
ANALYSIS OF RESOURCE ALLOCATION IN THE SOUTH AFRICAN POLICE SERVICE
44
Strategically Managed Analysis and Research-driven Technology-based (SMART) 48
policing has been cited by policing experts as the new evolution in policing. SMART
policing uses technology, research, and analysis to support the strategic management
of police activities. It also provides for more efficient data collection, information
sharing, and data analysis. The primary goal of SMART policing is to improve overall
police performance through the more efficient use of police resources. SMART policing
has three primary components namely:
· Strategic Management: Strategic management begins with an assessment of
criminal activities, threats, and vulnerabilities. This assessment may include a gap
analysis or capabilities review of what was done and what should be done, and must
include strategic goals and objectives for improving police performance. Once this
step is complete specific practices, tools, and technologies are to be implemented
and deployed to support these goals and objectives. Forging community
partnerships and garnering public support for policing initiatives is critical.
Monitoring and assessing must be undertaken to measure effectiveness
· Analysis and Research: Research and the analysis of historical data and stats to
measure trends are important to synthesize data across various sources. With this,
management can make better decisions about resource allocation and
deployment.
· Technology: Recent advances in technology and tools can help police improve data
capturing, display and analysis, information sharing, and surveillance activities.
Tools such as the following are necessary to achieve strategic goals and support
data analysis:
- Intelligence software that uses a different type of data to drive deployment of
law enforcement assets.
- Internet communication programs for the enhancement of situational
awareness among police and community stakeholders .
- Linkage and networking software which is needed to fuse disparate
information.
- Electronic surveillance technologies that employ software capable of identifying
behavioral anomalies and facial features of suspects.
- Complaints management which enhances the management of operational staff
and
- Resource management which keeps record of areas that have resources and the
ways in which the resources are utilised. This system provides an ongoing
monitoring of resource utilisation.
48 Matlala, R.L.G.2016. Defining e-policing and smart policing for law enforcement agencies in Gauteng Province. The Interna�onal Journal of Social Sciences and Humani�es Inven�on, 3(12): 3058-3070
ANALYSIS OF RESOURCE ALLOCATION IN THE SOUTH AFRICAN POLICE SERVICE
45

Another form of SMART policing includes the Predictive Policing approach which
involves taking other forms of policing approaches and integrating them into one. In
essence, through predictive policing, data is sourced from dissimilar sources, analysed,
and then the results are used to anticipate, prevent and respond more effectively to
future crime. Predictive policing entails becoming less reactive. “The predictive vision
moves law enforcement from focusing on what happened to focusing on what will happen 50
and how to effectively deploy resources in front of crime, thereby changing outcomes”.
Predictive policing is not meant to replace already successful police techniques,
instead, it borrows from the principles of problem oriented policing, community
policing, evidence-based policing, intelligence-led policing and other proven policing
models; models already in use in South Africa. Current analytic tools and techniques
like hot spots, data mining, crime mapping, geospatial prediction and social network
analysis can be applied to a broad range of criminal justice problems. For instance, they
can be used to anticipate localized crime spikes, inform city and neighborhood 51
planning, and aid in police management decisions . Predictive policing can be used in
identifying hotspots and crime mapping, data mining, informing police deployment of
manpower, provision of statistics, geospatial prediction and social network analysis.
Through the approach of predictive policing, resources can be effectively managed and
allocated.
There is substantial research evidence that the more focused and specific the strategies
of the police, the more they are tailored to the problems they seek to address, the more 52
effective police will be in controlling crime and disorder. Research on police
effectiveness in addressing “hot spots,” has found that well-managed investigations
and crackdowns can suppress crime, deter its future reappearance, and avoid simply
displacing a similar number of crimes elsewhere. Discovering hot spots and tracking
the effectiveness of policing efforts against them has been facilitated by the
widespread adoption of new computer mapping and crime analysis technologies by
the police.
Computer Statistics (CompStat) is a performance management system that is used to
reduce crime and achieve police stations goals, and emphasises information-sharing,
responsibility and accountability, and improving effectiveness. It includes four
50Pearsall, B. 2010. Predic�ve Policing: The Future of Law Enforcement?. NIJ Journal, 266: 1-36 51 Casady, T. 2011. Police Legi�macy and Predic�ve Policing. Geography and Public Safety, 2(4): 1-16 52 Mar�n-Roethele, C. 2013. Police Innova�on: Enhancing Research and Analysis Capacity through Smart Policing. Arizona State University
ANALYSIS OF RESOURCE ALLOCATION IN THE SOUTH AFRICAN POLICE SERVICE
46
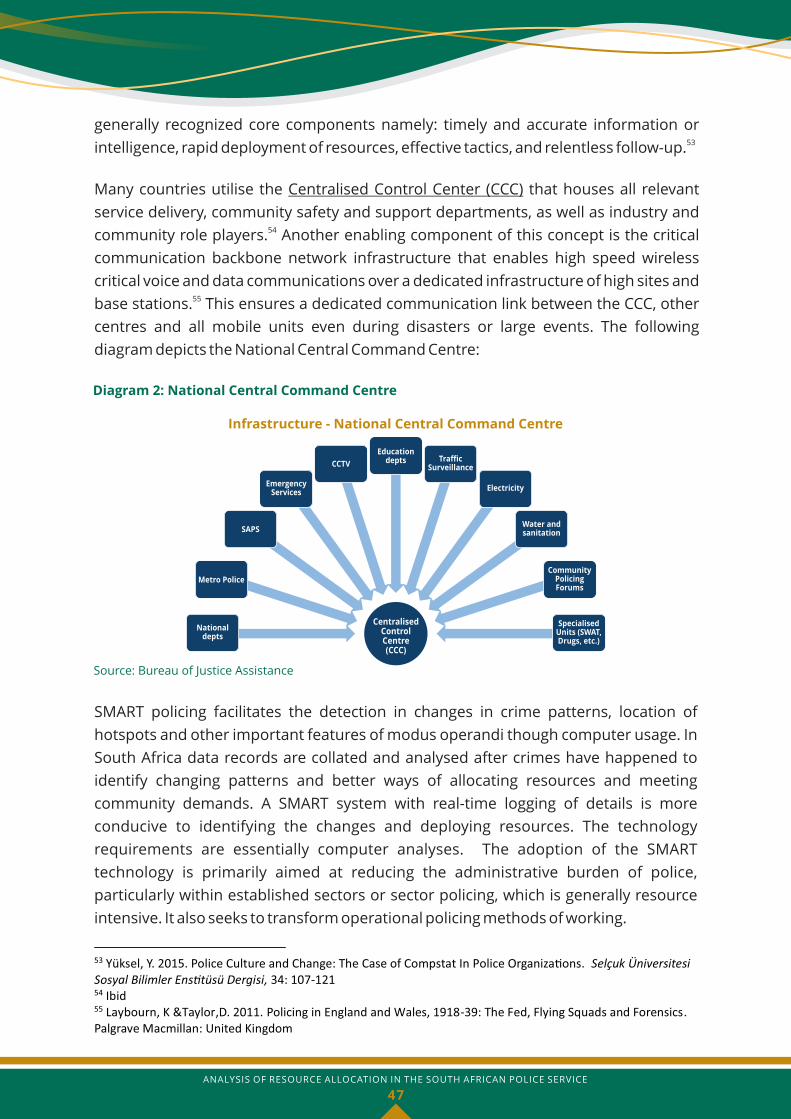
generally recognized core components namely: timely and accurate information or 53
intelligence, rapid deployment of resources, effective tactics, and relentless follow-up.
Many countries utilise the Centralised Control Center (CCC) that houses all relevant
service delivery, community safety and support departments, as well as industry and 54
community role players. Another enabling component of this concept is the critical
communication backbone network infrastructure that enables high speed wireless
critical voice and data communications over a dedicated infrastructure of high sites and 55base stations. This ensures a dedicated communication link between the CCC, other
centres and all mobile units even during disasters or large events. The following
diagram depicts the National Central Command Centre:
53 Yüksel, Y. 2015. Police Culture and Change: The Case of Compstat In Police Organiza�ons. Selçuk Üniversitesi Sosyal Bilimler Ens�tüsü Dergisi, 34: 107-121 54 Ibid 55 Laybourn, K &Taylor,D. 2011. Policing in England and Wales, 1918-39: The Fed, Flying Squads and Forensics. Palgrave Macmillan: United Kingdom
Diagram 2: National Central Command Centre
SMART policing facilitates the detection in changes in crime patterns, location of
hotspots and other important features of modus operandi though computer usage. In
South Africa data records are collated and analysed after crimes have happened to
identify changing patterns and better ways of allocating resources and meeting
community demands. A SMART system with real-time logging of details is more
conducive to identifying the changes and deploying resources. The technology
requirements are essentially computer analyses. The adoption of the SMART
technology is primarily aimed at reducing the administrative burden of police,
particularly within established sectors or sector policing, which is generally resource
intensive. It also seeks to transform operational policing methods of working.
Infrastructure - National Central Command Centre
Source: Bureau of Justice Assistance
TrafficSurveillance
Water andsanitationSAPS
Metro PoliceCommunity
PolicingForums
SpecialisedUnits (SWAT,Drugs, etc.)
CentralisedControlCentre(CCC)
Nationaldepts
ElectricityEmergency
Services
CCTV
Educationdepts
ANALYSIS OF RESOURCE ALLOCATION IN THE SOUTH AFRICAN POLICE SERVICE
47


Civilian Secretariat for Police Service
Head Office:
217 Pretorius Street
Van Erkom Building
Van Erkom Arcade
7th floor
Pretoria
Private Bag X922
Pretoria
South Africa, 0001
T: +27 (0) 12 393 2500/2/3
F: +27 (0) 12 393 2536/8
www.policesecretariat.gov.za