analysis of risk to north atlantic right whales … · ship strikes, the model can be ... according...
TRANSCRIPT

Submitted by:
Center for Coastal Studies 59 Commercial Street, P.O. Box 1036 Provincetown, Massachusetts 02657
(508) 487-3622
Analysis of Risk to North Atlantic Right
Whales (Eubalaena glacialis) from Shipping Traffic in Cape Cod Bay
Final Report
Owen C. Nichols1 and Hauke L. Kite-Powell2
Submitted to NOAA Fisheries Northeast Fisheries Science Center
NOAA Award No. NA03NMF4720489
February 2005
1Center for Coastal Studies 2Woods Hole Oceanographic Institution

i
Executive Summary
In an effort to provide a baseline assessment of risk to right whales from collisions with shipping traffic in Cape Cod Bay, a simple two-dimensional model was constructed to estimate the expected number of ship-whale encounters based on right whale density estimates and ship traffic data. Effort and sighting data from systematic aerial surveys of Cape Cod Bay from 1998 to 2002 were used to generate right whale density estimates (whales/km2) within 1.5-minute quadrats and over 2-week periods during the season of whale presence in the bay (December to mid-May). Traffic data for the same time periods were provided by the US Army Corps of Engineers (USACE) for vessels transiting the Cape Cod Canal and aggregated into routes based on origin/destination information. The data set includes vessels at or over 65’ length overall (LOA) of the following types: tanker, dry cargo or passenger, tug, tank barge, or dry cargo barge. Each entry includes the date, vessel type, origin, and destination. Commercial fishing vessel (≥65’ LOA) transit data were also obtained from USACE and analyzed separately from the data set described above, as destinations of the fishing vessels were usually unknown.
An average of seven vessel movements occurred per day in Cape Cod Bay, the highest
volume of which were bound to or from Boston (four) and ports in the northern Gulf of Maine route (two); 75% of the traffic was composed of tug-barge combinations. Large fishing vessels made approximately two additional transits per day. For each route and each two-week time period, the expected number of ship/whale encounters was calculated based on the passage of a known number of vessels through quadrats of estimated right whale density. The effective beam (width of the path “swept” by the vessels) was estimated based on vessel type. This calculation assumes that the whales are always at the surface and that neither whales nor vessels attempt to avoid collision. The model results suggest approximately 1.5 expected ship/whale encounters in Cape Cod Bay each year; Boston traffic contributes about 46% of this risk, and Gulf of Maine traffic contributes about 35%. Large commercial fishing vessel transits contribute an additional 0.4 expected encounters in Cape Cod Bay each year if assumed to follow the same route as Gulf of Maine traffic, generating a combined total of 1.9 encounters. Gulf of Maine traffic leads to a high proportion of expected encounters despite relatively low volume because it transects areas of higher whale density than other routes. It is important to note that this estimated encounter value does not imply that two ship strikes occur per year. To translate expected encounters into ship strikes, it is necessary to adjust for whale diving behavior and for evasive action taken by whales and/or vessels prior to a possible encounter. These adjustments are beyond the scope of this report due to a lack of data.
In order to assess potential management measures designed to reduce collision risk in
Cape Cod Bay, two specific rerouting proposals were incorporated into the simple model described above. Both involved shifting Boston, Gulf of Maine, and Provincetown traffic to a north-south route along the western side of Cape Cod Bay. Assuming that traffic volume remains the same, these rerouting measures would reduce the expected ship/whale encounters by about 60% on the Gulf of Maine route and by about 40% on the Provincetown and Boston routes. Across all routes, these measures result in a reduction of 37% to 45% in the overall ship/whale encounter risk for Cape Cod Canal traffic in Cape Cod Bay (from 1.5 encounters/year to about 0.9). If large fishing vessel traffic is included in the rerouting schemes, the overall expected annual encounter rate declines from a present value of 1.9 to 1.1, generating an additional reduction of 0.2 encounters/year involving fishing vessels.

ii
Table of Contents Executive Summary Acknowledgements Introduction Methods Aerial Survey Data
Sightings-Per-Unit-Effort (SPUE) Analysis Density Estimates Vessel Traffic Data Calculation of Expected Ship/Whale Encounters
Results and Discussion Right Whale SPUE and Density Estimates
Vessel Transits in Cape Cod Bay Expected Ship/Whale Encounters Effects of Re -Routing on Expected Ship/Whale Encounters
Summary Figures 1. Cape Cod Bay vessel traffic routes
2. Overall mean right whale SPUE (whales/1000 km of survey effort) in Cape Cod Bay, 1 December – 17 May, 1998 – 2002.
3a. Overall mean right whale SPUE (whales/1000 km of survey effort) in Cape Cod Bay by two-week period, 1 December – 22 February, 1998 – 2002. 3b. Overall mean right whale SPUE (whales/1000 km of survey effort) in Cape Cod Bay by two-week period, 23 February – 17 May, 1998 – 2002. 4. Estimated number of right whales in Cape Cod Bay based on density estimates. 5. Average daily Cape Cod Bay vessel transits by route. 6. Average daily Cape Cod Bay transits on the Boston route by vessel type. 7. Average daily Cape Cod Bay transits on the Gulf of Maine route by vessel type. 8. Representative plot of ship/whale encounter calculations. 9. Expected ship/whale encounters in Cape Cod Bay per two-week period. 10. Proposal A – Boston, Gulf of Maine, and Provincetown traffic rerouted due north from the Canal entrance to 42° N. 11. Proposal B – Boston, Gulf of Maine, and Provincetown traffic rerouted northwest from the Canal entrance.
Appendices A. Sample of Canal traffic data. B. Sample MATLAB routine used in model of ship/whale encounters. References
i iii 1 2 2 2 3 3 4 5 5 5 6 6 7 9 10 11 12 13 13 13 14 14 15 15 16 17 18 20

iii
Acknowledgements Funding for this study was provided by the NOAA Fisheries North Atlantic Right Whale Competitive Grant Program (NOAA award NA03NMF4720489). Vessel traffic data were provided by the US Army Corps of Engineers (USACE) Cape Cod Canal Field Office. Scott Barr, Bill Norman and Fran Donovan (USACE) deserve particular appreciation for making the data available for this project. Bob Kenney (University of Rhode Island) conducted analysis of aerial survey data. Bruce Russell (JS&A Environmental Services) and Pat Gerrior (NOAA Fisheries) provided helpful comments on drafts of this report and guidance on vessel traffic aspects. Aerial surveys were supported by the Massachusetts Division of Marine Fisheries (DMF) as part of the Commonwealth of Massachusetts Right Whale Conservation Plan; funding sources for the survey program include National Fish and Wildlife Foundation, NOAA Fisheries, Massachusetts Environmental Trust, and the Northeast Consortium. Special thanks are due to Dan McKiernan (DMF) for his continued support of the survey program and Moira Brown (New England Aquarium) for guidance throughout this project.

1
Introduction
The North Atlantic right whale (Eubalaena glacialis) is listed as “endangered” under the Endangered Species Act of 1973. The western Atlantic population was heavily exploited by whalers for several hundred years, and is considered today to be a small fraction of its original size (IWC 2001). An estimated 300-350 individuals remain and the population has not exhibited significant signs of recovery since studies began in the 1970’s (IWC 2001; Kraus et al. 2001). According to recent analyses, the reproductive rate has declined and calving interval has increased (Kraus et al. 2001), while estimates of survival probability have decreased (Caswell et al. 1999; Fujiwara and Caswell 2001). The latter studies suggest that a reduction of mortality may increase survival probability and reduce potential for extinction.
The leading known cause of right whale mortality is collision with ships (Knowlton and Kraus 2001). There have been 62 right whale deaths documented since 1970. Of those 62 mortalities, 21 (34%) were attributed to ship strikes, six (10%) were a result of entanglement in fixed fishing gear, 18 (29%) were adult and juveniles that died of unknown causes, and 17 (27%) were calves that died of neonatal or unknown natural causes (Knowlton and Kraus 2001; New England Aquarium unpublished data). Ship collisions account for more right whale mortalities than any other documented causes, and one half of the documented ship collision mortalities have been recorded in the 1990s. If the current rate of mortality from human activities is not reduced, Caswell et al. (1999) predict that the population could become extinct in less than 200 years.
Little is known of the underlying factors that cause right whales to be struck by
ships. Right whales move slowly and spend a large amount of time at or near the surface resting, feeding, nursing, and socializing. Mariners may have difficulty spotting right whales due to their dark coloration and their low profile when feeding at or beneath the surface, resting, or nursing. Although there is evidence to suggest that right whales should be able to hear approaching vessels, the whales do not always avoid vessels when foraging or socializing (Mayo et al. 2004; Nowacek et al. 2004).
Cape Cod Bay was designated a federal Critical Habitat for right whales in 1994 in
recognition of its seasonal importance as an area for feeding, socializing and as a nursery area for mothers and calves (Kraus and Kenney 1991). There is a moderate level of commercial shipping in the area, primarily tug and barge and tanker traffic through the Cape Cod Canal, one of three main routes into the Port of Boston. The whales’ behavior, set against the level of ship traffic in the region, make the right whale vulnerable to collisions with vessels in Cape Cod Bay. At least three right whale mortalities attributed to ship strikes have been documented near this area (Knowlton and Kraus 2001). This number of mortalities is a minimum count as not all carcasses are found and recovered. Until a better understanding of the factors that cause right whale ship strikes is reached, management strategies focusing on reduction of spatial and temporal co-occurrence of whales and ships are the best option for mitigation of mortality due to collisions. In this report, we provide a description of ship traffic patterns in Cape Cod Bay and compare the spatial and temporal distribution of the traffic with that of right whales to create a two-dimensional model in order to estimate the expected number of

2
ship/whale encounters. This model allows us to examine the potential effectiveness of proposed management measures that involve routing of traffic around areas of recurrent seasonal right whale concentrations. As more data is collected on the causative factors of ship strikes, the model can be refined to examine the effects of measures that are dependent on whale behavior (i.e. speed restrictions that would provide a whale with time to avoid an oncoming vessel).
Methods
Aerial Survey Data:
Aerial surveys were conducted from 1998 to 2002 during the period of right whale presence in Cape Cod Bay (December through May). Surveys were flown according to standardized protocols developed during the Cetacean and Turtle Assessment Program (CETAP 1982) and modified for the purpose of right whale detection for management purposes. The standard survey design consisted of fifteen east-west track lines flown at 1.5 nautical mile (nm) (2.8 km) intervals from the mainland to the Cape Cod Bay shoreline and an additional track line, 35 nm (64.8 km) in length, parallel to the outer coast of Cape Cod from the eastern end of the northernmost track line to east of Chatham, at an approximate distance of 3 nm (4.8 km) from shore. The entire survey (approximately 306 nm [567 km] of track line miles) was completed as often as conditions permitted (ca. 30 flights/season). A detailed summary of the Cape Cod Bay aerial survey methods is presented by Brown et al. (2002). Effort and sighting data from the surveys were entered into digital format using an interactive dBase program designed for compatibility with the NARWC database maintained at the University of Rhode Island (Kenney 2001). Sightings-Per-Unit-Effort (SPUE) Analysis:
In order to quantitatively assess right whale distribution without the potential bias that can be caused by uneven distribution of survey effort, we have used the sightings-per-unit-effort (SPUE) algorithm developed at URI (CETAP 1982; Kenney and Winn 1986; Winn et al. 1986; Kenney 1990; Hain et al. 1992; Shoop and Kenney 1992; Kraus et al. 1993). This method first quantifies survey effort as length of track line sampled, then expresses SPUE as animals sighted per standardized length of track.
The boundaries of the study area for this analysis were defined as from 42° 09’N
south to 41° 39’ N, and from 70° 00’ W west to 70° 39’ W. The study area was partitioned into 117 quadrats measuring 3 minutes of latitude (3 nm/5.6 km) by 3 minutes of longitude (2.2 nm/4.1 km, with quadrat width about 70 m wider at the southern edge of the study area than at the northern edge). Each quadrat was 23 km2 in area. Fourteen quadrats were completely over land, thus there were 103 quadrats available to be sampled.
Survey data are comprised of a chronological sequence of la titude/longitude
points that describe the path flown by the aircraft. Each successive pair of points describes a track segment, and the length of that segment (“effort”) can be computed analytically from the latitude and longitude data. For each survey, each track segment
3
was partitioned into smaller sections contained within the separate 3-minute quadrats. In order to standardize effort further, only segments completed with visibility at least 2 nm, sea state of Beaufort 3 or lower, aircraft altitude below 325 m (1066 ft), and observers on watch were included. Similarly, only right whales sighted under those defined valid effort conditions were included. Only sightings identified as “definite” or “probable” right whales were included in the analysis; sightings identified as “possible” right whales were eliminated.
The sampling season was defined as December through mid-May, and was
divided for analysis into twelve two-week periods (1 December – 17 May). Total effort and total right whales sighted within each quadrat were summed within periods and across years, then the number of whales sighted was divided by effort to generate the SPUE index, in units of whales sighted per 1,000 km of valid effort. Quadrats with less than 2 km of effort within a 2-week period were considered to have been inadequately sampled and were eliminated from further analyses. Density Estimates:
For the purpose of calculating density and encounter rates, a Kriging interpolation algorithm1 was used to estimate SPUE at twice the geographic resolution (1.5-minute quadrats). SPUE was then converted to density (whales/km2) assuming a 3 km effective survey swath as follows:
SPUE (whales/1000 km effort) density (whales/km2) = ----------------------------------------
survey swath (3 km) The effective survey swath for the Cape Cod Bay surveys has not been calculated; however, analyses of surveys conducted using similar protocols and an aircraft of the same type indicated effective swaths of 2.146 km and 4.202 km (Kenney et al. 1995). The assumed 3 km effective survey swath is close to the average value for the studies referenced above (3.174 km). A density value was assigned to each 1.5-minute quadrat for each two-week period. Vessel Traffic Data: Traffic data were obtained from the United States Army Corps of Engineers (USACE) for vessels transiting the Cape Cod Canal during the time periods covered by the aerial surveys. The USACE data set consists of individual vessel movements through the Canal. The data set includes vessels at or over 65’ length overall (LOA) of the following types: tanker, dry cargo or passenger, tug, tank barge, or dry cargo barge. Each entry includes the date, vessel type, origin, and destination. Commercial fishing vessel (≥65’ LOA) transit data were also obtained from USACE and analyzed separately from the data set described above, as destinations of the fishing vessels were usually
1 GLOBEC Kriging Software Package, Dezhang Chu, WHOI (ftp://globec.whoi.edu/pub/software/kriging/easy_krig/V)

4
unknown2. Military traffic was also excluded for security reasons, but is likely a miniscule component of the traffic that transits the Canal2. A Canal transit data entry for a tug followed by an entry for a barge with the same origin or destination was treated as a single transit by a tug-barge combination. A tug entry followed by something other than a barge entry is treated as a tug transit (see Appendix A for a sample of the USACE data set). Canal transits to and from Cape Cod Bay were aggregated into six routes based on destination/origin as indicated in the USACE data set. One endpoint of each route is the east end of the Cape Cod Canal (41.78° N, 70.48° W). Routes were composed of straight lines from the Canal to a specified destination/origin, with the exceptions of the “Boston” and “Plymouth/Duxbury” routes that angle around land masses to reach their respective destination/origins. The routes are defined as follows and displayed in Figure 1: Route Traffic to/from… Course (true) from CCCanal Boston Greater Boston area 45° to longitude 70.38° W, then
340° Gulf of Maine north of Cape Ann 25° Plymouth Plymouth/Duxbury and vicinity 355° to latitude 41.92° N, then
330° to latitude 42.00° N Provincetown Provincetown and anchorages 45° to latitude 42.03° N mid-Cape inner “elbow” region of CCBay 85° to longitude 70.05° W Cape Cod Bay unspecified locations in CCBay 45° to latitude 41.92° N Although the routes defined above are estimated and not based on actual vessel track data, the estimated tracks compare well with routes used by the Northeast Marine Pilots Association (provided courtesy of Pat Gerrior, NOAA Fisheries) and with vessel sighting data recorded during CCS aerial surveys (Brown et al. 2002). The average number of transits was computed (in either direction) along each route for each of the two-week time periods during the five-year period covered by the SPUE data (Dec. 1997 – May 2002). Calculation of Expected Ship/Whale Encounters: For each route and two-week period, the expected number of ship/whale encounters was calculated using a series of algorithms processed and plotted in MATLAB3 (Appendix B). The number of encounters is a value based on the passage of a known number of vessels through quadrats of estimated right whale density. The calculation moves a hypothetical vessel along the routes described above at 1 km intervals, and assumes a whale density for each interval corresponding to the 1.5-minute quadrat in which most of the interval lies. The number of expected ship/whale encounters for each 1 km segment was calculated as follows:
area of path “swept” by vessel (beam x 1 km) x right whale density (whales/ km2)
2 R. Scott Barr, USACE, pers. comm. 3 http://www.mathworks.com/
5
The effective beam (width of the path “swept” by the vessel) used in this calculation is 10m for a tug or large commercial fishing vessel, 15 m for a tug-barge and dry cargo or passenger vessel, and 20m for a tanker. This calculation assumes that the whales are always at the surface; that is, no allowance is made for whales being submerged and therefore out of range of a potential encounter. It also assumes no avoidance behavior on the part of either whale or vessel. For each route, the expected number of encounters was summed over the 1 km segments and then multiplied by the average number of transits for each vessel type during a two-week period. The expected numbers of encounters for each vessel type were summed to produce an estimated number of encounters by route for each two-week period. The values for each route were summed to generate a value for each two-week period. Finally, the values for the two-week periods were summed to produce an annual estimate of expected ship/whale encounters.
Results and Discussion Right Whale SPUE and Density Estimates:
An area of high-SPUE quadrats extended along the eastern side of the Bay from the south to the tip of the Cape (Figure 2). Distinct areas of lower SPUE values radiated out from the highest-value quadrats, and a gradient of decreasing SPUE value extended to the west. When separated into two-week periods pooled across all years of the study, SPUE values varied considerably. SPUE values were low in December and January, increased during February, exhibited two peaks in late February/early March and late March/early April, and declined to low values by the end of April and to zero by the first week of May. Kriged SPUE values (1.5 minute quadrats) for each of the two-week periods are displayed in Figures 3a – 3b. The area occupied by right whales expands and then contracts over the course of the season in the same fashion. An area of high SPUE in the western part of the bay during 20 Apr – 5 May (Figure 3b) was an artifact of a single near-shore sighting in 2001 that drew the aircraft slightly farther west of the end of the standard survey track (the area of the sighting was always within the view of the observers as the aircraft turned south between tracks, but as the aircraft itself did not usually travel all the way to the shoreline, low-effort quadrats were often generated on the fringes of the survey area). As the sighting and effort fell just inside a low-effort quadrat, the SPUE value was consequently high for that particular area and period.
A density value was calculated for each 1.5-minute quadrat during each two-week
period. In order to illustrate seasonal variation in the density estimates used to calculate expected ship/whale encounters, density was multiplied by quadrat area to generate a crude estimate of the number of right whales in Cape Cod Bay during each period (Figure 4). Vessel Transits in Cape Cod Bay:
Approximately seven large vessel transits occurred per day in Cape Cod Bay during the right whale season (Figure 5). About 75% of this traffic was composed of tug/barge combinations. Vessel type detail for the busiest routes – Boston (ca. four
6
transits/day) and Gulf of Maine (ca. two transits/day) – is displayed in Figures 6 and 7. In addition to the traffic described above, an estimated 300 fishing vessels (≥65’ LOA) passed through Cape Cod Bay to or from the Cape Cod Canal during the six-month period from December to May. Because the destinations of these vessels were not defined in the USACE data, we do not have explicit information about their origin or destination. For the purpose of this analysis, it was assumed that fishing vessel traffic was evenly distributed over the six-month period (ca. two transits/day), and that it followed the Gulf of Maine route through Cape Cod Bay. Expected Ship/Whale Encounters: A plot representing the ship/whale encounter calculations made in MATLAB is displayed in Figure 8. A vessel traffic route is shown over smoothed right whale SPUE for a single two-week period in order to visually represent the underlying density estimates used in the calculations. The expected number of ship/whale encounters during each two-week period is shown in Figure 9. Values are low in December and gradually increase through late January and early February. The number of expected encounters remains steady into early March followed by a slight drop that precedes the peak in late March/early April. By mid-April, the number of expected encounters begins to drop, reaching zero by the first week of May. The seasonal variation in expected encounters is primarily a function of the number of right whales in Cape Cod Bay, although the peak number of encounters is coincident with a westward expansion of the area occupied by the whales that overlaps with vessel traffic. The period values were summed to generate an estimate of 1.5 expected ship-whale encounters in Cape Cod Bay each year; Boston traffic contributes about 46% of this risk, and Gulf of Maine traffic contributes about 35%. Gulf of Maine traffic leads to a high proportion of expected encounters despite relatively low volume because it transects areas of higher whale density than other routes. Large commercial fishing vessel transits contribute an additional 0.4 expected ship/whale encounters in Cape Cod Bay each year, for a total of 1.9 encounters. It is important to note that this estimated encounter value does not imply that two ship strikes occur per year. To translate expected encounters into ship strikes, it is necessary to adjust for whale diving behavior (whales deep beneath the surface cannot be struck by vessels) and for evasive action taken by whales and/or vessels prior to a possible encounter. These adjustments are beyond the scope of this report due to a lack of data. Effects of Re-Routing on Expected Ship/Whale Encounters:
Two specific rerouting proposals were incorporated into the simple two-dimensional model described above. Proposal A was developed by the authors as a simple means of demonstrating that the expected number of ship-whale encounters could be reduced by routing traffic around areas of high SPUE. Proposal B was based on a draft routing option presented during a series of public meetings held to discuss the proposed ship strike reduction strategy currently under development by NOAA

7
Fisheries4. Both proposals involved shifting the Boston, Gulf of Maine, and Provincetown traffic to a north-south route along the western side of Cape Cod Bay. Under Proposal A (Figure 10), all traffic travels due north between the Canal entrance and latitude 42° N, and then proceeds along headings of approximately 330° (Boston), 35° (Gulf of Maine), or 90° (Provincetown). Under Proposal B (Figure 11), traffic on the Boston, Gulf of Maine, and Provincetown routes parallels the mainland shore on a north-northwest heading to latitude 42.15° N, with Provincetown traffic doubling back to the southeast (see Figure 3 for comparison with assumed present traffic routes).
The resulting changes in the expected encounter values are summarized in the table below. Assuming that traffic volume remains the same, these rerouting measures would reduce the expected ship-whale encounters by about 60% on the Gulf of Maine route and by about 40% on the Provincetown and Boston routes. Across all routes, these measures result in a reduction of 37% (Proposal A) to 45% (Proposal B) in the overall ship-whale encounter risk for Cape Cod Canal traffic in Cape Cod Bay (from 1.5 encounters/year to about 0.9). Proposal B would divert traffic considerably farther northwest from the center of Cape Cod Bay than Proposal A and consequently causes a slightly lower estimate of encounters. The number of encounters drops equally under both proposals on the Provincetown route, and more so under Proposal B on the Gulf of Maine and Boston routes. Note that this assessment assumes no rerouting of the traffic designated “Cape Cod Bay”, “Plymouth” or “mid-Cape” as origin/destination in the USACE data. route expected ship-whale encounters/year present Proposal A Proposal B Boston 0.71 0.44 0.38 Gulf of Maine 0.54 0.25 0.19 Provincetown 0.02 0.01 0.01 Cape Cod Bay 0.26 0.26 0.26 Plymouth/mid-Cape 0.02 0.02 0.02 total 1.55 0.98 0.86 If the fishing vessel traffic assumed to follow the Gulf of Maine route is included in the rerouting schemes, the overall expected annual encounter rate declines from a present value of 1.9 to 1.1 – an additional reduction of 0.2 encounters/year involving fishing vessels.
Summary The simple model outlined above provides a baseline estimate of ship/whale encounters with which potential management measures can be evaluated. Management strategies currently under consideration by NOAA Fisheries for Cape Cod Bay include routing measures and speed restrictions from 1 January through 30 April. The potential effects of speed restrictions are likely dependent on variables that are beyond the scope of this report (i.e. avoidance behavior by whales or vessels), and are thus not addressed herein. Routing existing vessel traffic away from known concentrations of right whales
4 P. Gerrior, NOAA Fisheries, Right Whale Ship Strike Strategy Stakeholder Meeting, 5 November 2004, New Bedford, MA.

8
will cause a quantifiable reduction of the potential number of ship/whale encounters. The rerouting proposals analyzed above would reduce the expected number of encounters by 37% to 45%. A slightly greater reduction in encounters could be achieved if large fishing vessels transiting the bay were rerouted in the same manner as other vessels.
It is important to note that there are numerous factors that must be taken into account by managers considering rerouting vessel traffic, including but not limited to: navigational safety, conflicts with other human activities such as fixed-gear fishing, and the potential economic effect of the greater distance traveled by vessels that are rerouted around whale concentrations. The above factors are beyond the scope of this report and consequently were not considered when rerouting options were selected for analysis.
The model presented here can be refined with additional data as it becomes
available. A better understanding of whale behavior would allow a more precise estimate of expected encounters. Knowledge of surface and dive times would allow calculation of detection probability in order to determine the effective survey swath to be used in density estimates. Surface and dive times and avoidance behavior could be incorporated into this model along with information on the response of vessels to an encounter to estimate the likelihood of a ship/whale encounter leading to a collision. Subsequent years of right whale and traffic data can be added to account for interannual variation in the spatiotemporal distribution of whales or vessels.

9
Figure 1. Cape Cod Bay vessel traffic routes. Note that “Cape Cod Bay” route is identical to the “Provincetown” route but ends in the center of the bay.
Figure produced using Fugawi Marine ENC, Northport Systems, and NOAA ENC Coastal Charts.

10
Figure 2. Overall mean right whale SPUE (whales/1000 km of survey effort) in Cape Cod Bay, 1 December – 17 May, 1998 – 2002.

11
Figure 3a. Overall mean right whale SPUE (whales/1000 km of survey effort) in Cape Cod Bay by two-week period, 1 December – 22 February, 1998 – 2002.

12
Figure 3b. Overall mean right whale SPUE (whales/1000 km of survey effort) in Cape Cod Bay by two-week period, 23 February – 17 May, 1998 – 2002.

13
Figure 4. Estimated number of right whales in Cape Cod Bay based on density estimates.
0
5
10
15
20
25
1Dec-14Dec
15Dec-28Dec
29Dec-11Jan
12Jan-25Jan
26Jan-8Feb
9Feb-22Feb
23Feb-8Mar
9Mar-22Mar
23Mar-5Apr
6Apr-19Apr
20Apr-3May
4May-17May
Figure 5. Average daily Cape Cod Bay vessel transits by route.
Average Daily Transits by Route to/from CCCanal
0
1
2
3
4
5
6
7
8
9
1Dec-14Dec
15Dec-28Dec
29Dec-11Jan
12Jan-25Jan
26Jan-8Feb
9Feb-22Feb
23Feb-8Mar
9Mar-22Mar
23Mar-5Apr
6Apr-19Apr
20Apr-3May
4May-17May
Cape Cod Baymid-CapePlymouth
ProvincetownGulf of MaineBoston
Figure 6. Average daily Cape Cod Bay transits on the Boston route by vessel type.
Average Daily Transits, CCCanal - Boston Route
0
1
2
3
4
5
6
1Dec-14Dec
15Dec-28Dec
29Dec-11Jan
12Jan-25Jan
26Jan-8Feb
9Feb-22Feb
23Feb-8Mar
9Mar-22Mar
23Mar-5Apr
6Apr-19Apr
20Apr-3May
4May-17May
dry/passtanker
tug-bargetug

14
Figure 7. Average daily Cape Cod Bay transits on the Gulf of Maine route by vessel type.
Average Daily Transits, CCCanal - G.o.Maine Route
0
0.5
1
1.5
2
2.5
1Dec-14Dec
15Dec-28Dec
29Dec-11Jan
12Jan-25Jan
26Jan-8Feb
9Feb-22Feb
23Feb-8Mar
9Mar-22Mar
23Mar-5Apr
6Apr-19Apr
20Apr-3May
4May-17May
dry/passtanker
tug-bargetug
Figure 8. Representative plot of ship/whale encounter calculations (Gulf of Maine route, 23 March – 5 April; the vessel traffic route is shown over smoothed right whale SPUE in order to visually represent the underlying density estimates used in the calculations).

15
Figure 9. Expected ship/whale encounters in Cape Cod Bay per two-week period.
Expected Vessel-Whale Encounters per 2-Week Period, by Route
0.00
0.05
0.10
0.15
0.20
0.25
0.30
0.35
0.40
1Dec-14Dec
15Dec-28Dec
29Dec-11Jan
12Jan-25Jan
26Jan-8Feb
9Feb-22Feb
23Feb-8Mar
9Mar-22Mar
23Mar-5Apr
6Apr-19Apr
20Apr-3May
4May-17May
Cape Cod Baymid-CapePlymouth
ProvincetownGulf of MaineBoston
Figure 10. Proposal A – Boston, Gulf of Maine, and Provincetown traffic rerouted due north from the Canal entrance to 42° N.
Figure produced using Fugawi Marine ENC, Northport Systems, and NOAA ENC Coastal Charts.

16
Figure 11. Proposal B – Boston, Gulf of Maine, and Provincetown traffic rerouted northwest from the Canal entrance.
Figure produced by NOAA Fisheries, courtesy of P. Gerrior.
17
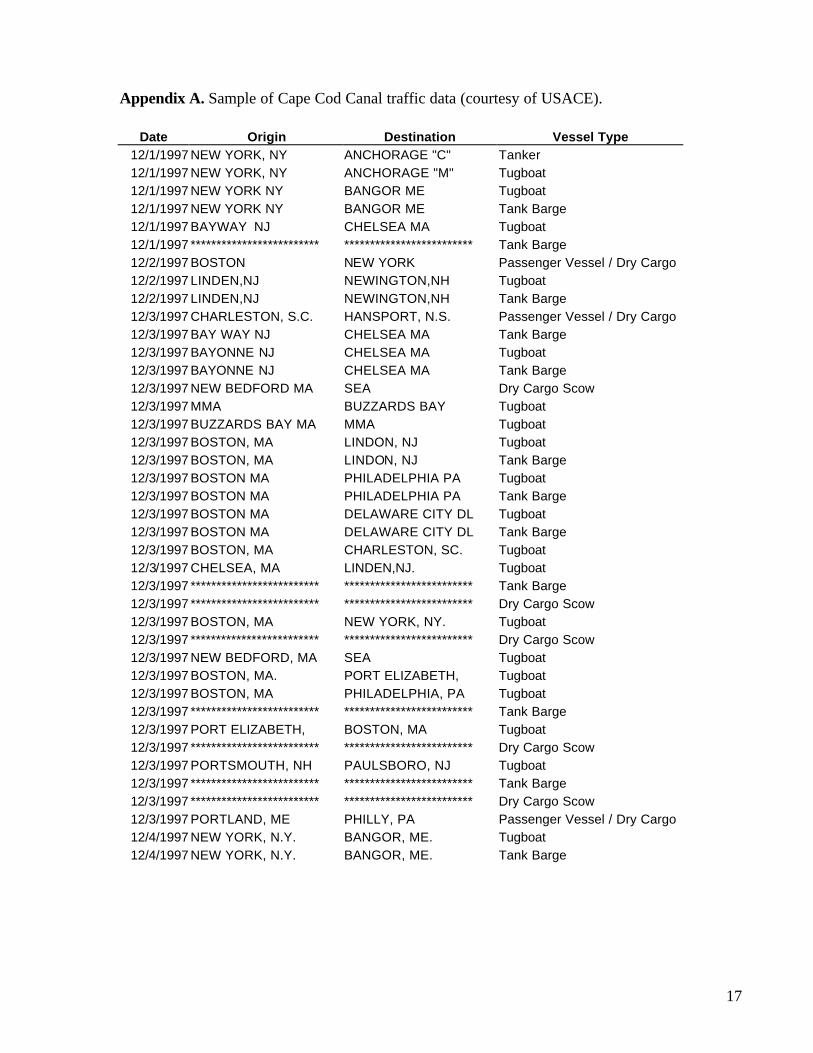
Appendix A. Sample of Cape Cod Canal traffic data (courtesy of USACE).
Date Origin Destination Vessel Type 12/1/1997 NEW YORK, NY ANCHORAGE "C" Tanker 12/1/1997 NEW YORK, NY ANCHORAGE "M" Tugboat 12/1/1997 NEW YORK NY BANGOR ME Tugboat 12/1/1997 NEW YORK NY BANGOR ME Tank Barge 12/1/1997 BAYWAY NJ CHELSEA MA Tugboat 12/1/1997 ************************* ************************* Tank Barge 12/2/1997 BOSTON NEW YORK Passenger Vessel / Dry Cargo 12/2/1997 LINDEN,NJ NEWINGTON,NH Tugboat 12/2/1997 LINDEN,NJ NEWINGTON,NH Tank Barge 12/3/1997 CHARLESTON, S.C. HANSPORT, N.S. Passenger Vessel / Dry Cargo 12/3/1997 BAY WAY NJ CHELSEA MA Tank Barge 12/3/1997 BAYONNE NJ CHELSEA MA Tugboat 12/3/1997 BAYONNE NJ CHELSEA MA Tank Barge 12/3/1997 NEW BEDFORD MA SEA Dry Cargo Scow 12/3/1997 MMA BUZZARDS BAY Tugboat 12/3/1997 BUZZARDS BAY MA MMA Tugboat 12/3/1997 BOSTON, MA LINDON, NJ Tugboat 12/3/1997 BOSTON, MA LINDON, NJ Tank Barge 12/3/1997 BOSTON MA PHILADELPHIA PA Tugboat 12/3/1997 BOSTON MA PHILADELPHIA PA Tank Barge 12/3/1997 BOSTON MA DELAWARE CITY DL Tugboat 12/3/1997 BOSTON MA DELAWARE CITY DL Tank Barge 12/3/1997 BOSTON, MA CHARLESTON, SC. Tugboat 12/3/1997 CHELSEA, MA LINDEN,NJ. Tugboat 12/3/1997 ************************* ************************* Tank Barge 12/3/1997 ************************* ************************* Dry Cargo Scow 12/3/1997 BOSTON, MA NEW YORK, NY. Tugboat 12/3/1997 ************************* ************************* Dry Cargo Scow 12/3/1997 NEW BEDFORD, MA SEA Tugboat 12/3/1997 BOSTON, MA. PORT ELIZABETH, Tugboat 12/3/1997 BOSTON, MA PHILADELPHIA, PA Tugboat 12/3/1997 ************************* ************************* Tank Barge 12/3/1997 PORT ELIZABETH, BOSTON, MA Tugboat 12/3/1997 ************************* ************************* Dry Cargo Scow 12/3/1997 PORTSMOUTH, NH PAULSBORO, NJ Tugboat 12/3/1997 ************************* ************************* Tank Barge 12/3/1997 ************************* ************************* Dry Cargo Scow 12/3/1997 PORTLAND, ME PHILLY, PA Passenger Vessel / Dry Cargo 12/4/1997 NEW YORK, N.Y. BANGOR, ME. Tugboat 12/4/1997 NEW YORK, N.Y. BANGOR, ME. Tank Barge

18
Appendix B. Sample MATLAB routine used in model of ship/whale encounters. % Boston route, revised to lie further east load spue09.mat; wlat = data.out.krig.Yg; wlon = data.out.krig.Xg; spue = data.out.krig.Cg; spue(spue<0) = 0.; slat = 41.78; slon = -70.48; course = 45; kmstep = 1; swathfrac = 1; maxlat = max(max(wlat)); minlat = min(min(wlat)); maxlon = max(max(wlon)); minlon = min(min(wlon)); % Boston maxlon = -70.38; fprintf('maxlat: %f', maxlat) fprintf('\nminlat: %f', minlat) fprintf('\nmaxlon: %f', maxlon) fprintf('\nminlon: %f', minlon) figure axesm('mercator','MapLatLimit',[41.7 42.1],'MapLonLimit',[-70.7 -70]) framem('on') gridm('on') colormap(jet) pcolorm(wlat,wlon,spue) set(gca,'CLim',[0 150]) shading interp; colorbar displaym(usahi('statepatch')) cumenc = 0.; steps = 0; course = course / 57.2958; latadj = kmstep / 111.12; lonadj = kmstep / 83.22; dims = size(wlat); dim = dims(1) * dims(2); while (slat<maxlat) & (slat>minlat) & (slon<maxlon) & (slon>minlon) steps = steps + 1; slat = slat + (cos(course) * latadj); slon = slon + (sin(course) * lonadj); plotm(slat, slon,'-ok','MarkerSize',5); sdist = (slat - wlat(1))^2 + (slon - wlon(1))^2; si = 1; for i = 2:dim ndist = (slat - wlat(i))^2 + (slon - wlon(i))^2; if sdist > ndist sdist = ndist; si = i; else end end

19
cumenc = cumenc + spue(si) * kmstep * swathfrac; end course = 340. / 57.2958; maxlon = -70.; while (slat<maxlat) & (slat>minlat) & (slon<maxlon) & (slon>minlon) steps = steps + 1; slat = slat + (cos(course) * latadj); slon = slon + (sin(course) * lonadj); plotm(slat, slon,'-ok','MarkerSize',5); sdist = (slat - wlat(1))^2 + (slon - wlon(1))^2; si = 1; for i = 2:dim ndist = (slat - wlat(i))^2 + (slon - wlon(i))^2; if sdist > ndist sdist = ndist; si = i; else end end cumenc = cumenc + spue(si) * kmstep * swathfrac; end fprintf('\n\nsteps: %f', steps); fprintf('\nencounters: %f', cumenc/1000); fprintf('\nswath fraction: %f', swathfrac)
20
References
Brown, M.W., O.C. Nichols, M.K. Marx, and J.N. Ciano. 2002. Surveillance of North Atlantic Right Whales in Cape Cod Bay and Adjacent Waters – 2002. Chapter One in Surveillance, Monitoring, and Management of North Atlantic Right Whales in Cape Cod Bay and Adjacent Waters – 2002. Final report to the Division of Marine Fisheries, Commonwealth of Massachusetts. Center for Coastal Studies, September 2002. Caswell, H., M. Fujiwara, and S. Brault. 1999. Declining survival probability threatens the North Atlantic right whale. Proceedings of the National Academy of Science 96:3308-3313. Cetacean and Turtle Assessment Program (CeTAP). 1982. A characterization of marine mammals and turtles in the mid- and north Atlantic areas of the U.S. outer continental shelf. Final Report of the Cetacean and Turtle Assessment Program to the U.S. Dept. of Interior under Contract AA551-CT8-48. H.E. Winn, Scientific Director. Fujiwara M. and H. Caswell. 2001. Demography of the endangered North Atlantic right whale. Nature 414: 537-541. International Whaling Commission (IWC). 2001. Report of the workshop on status and trends of western North Atlantic right whales. Journal of Cetacean Research and Management (Special Issue 2): 61-87. Kenney, R.D. 2001. The North Atlantic Right Whale Consortium databases. Maritimes 43(2): 3-5. Kenney, R.D., H.E. Winn, and M.C. Macaulay. 1995. Cetaceans in the Great South Channel, 1979-1989: Right whale (Eubalaena glacialis). Continental Shelf Research 15: 385-414. Knowlton A.R. and S.D. Kraus. 2001. Mortality and serious injury of Northern right whales (Eubalaena glacialis) in the western North Atlantic. Journal of Cetacean Research and Management (Special Issue 2): 193-208. Kraus, S.D., P.K. Hamilton, R.D. Kenney, A.R. Knowlton, and C.K. Slay. 2001. Reproductive parameters of the North Atlantic right whale. Journal of Cetacean Research and Management (Special Issue 2): 231-236. Kraus, S.D. and R.D. Kenney. 1991. Information on right whales (Eubalaena glacialis) in three proposed critical habitats in United States waters of the western North Atlantic Ocean. Final report to the U.S. Marine Mammal Commission, contract numbers T-75133740 and T-75133753. Washington, D.C. 65 pp. Mayo, C.A., O.C. Nichols, M.K. Bessinger, M.K. Marx, C.L. Browning, and M.W. Brown. 2004. Surveillance, monitoring and management of North Atlantic right whales in Cape Cod Bay and adjacent waters – 2004. Final report submitted to the Division of Marine Fisheries, Commonwealth of Massachusetts. December 2004. Nowacek, D.P., M.P. Johnson, and P.L. Tyack. 2004. North Atlantic right whales (Eubalaena glacialis) ignore ships but respond to alerting stimuli. Proceedings of the Royal Society of London B – Biological Sciences 271: 227-231.