analysis of rna-seq data - university of hong...
TRANSCRIPT
Analysis of RNA-seq DataFeb 8, 2017
Peikai CHEN (PHD)
Outline
• What is RNA-seq?• What can RNA-seq do?• How is RNA-seq measured?• How to process RNA-seq data: the basics• How to visualize and diagnose your RNA-seq data?• How to analyze RNA-seq?• What are getting trendy in RNA-seq field?• Summary
What is RNA-seq?A way of measuring the transcriptome in high-throughput
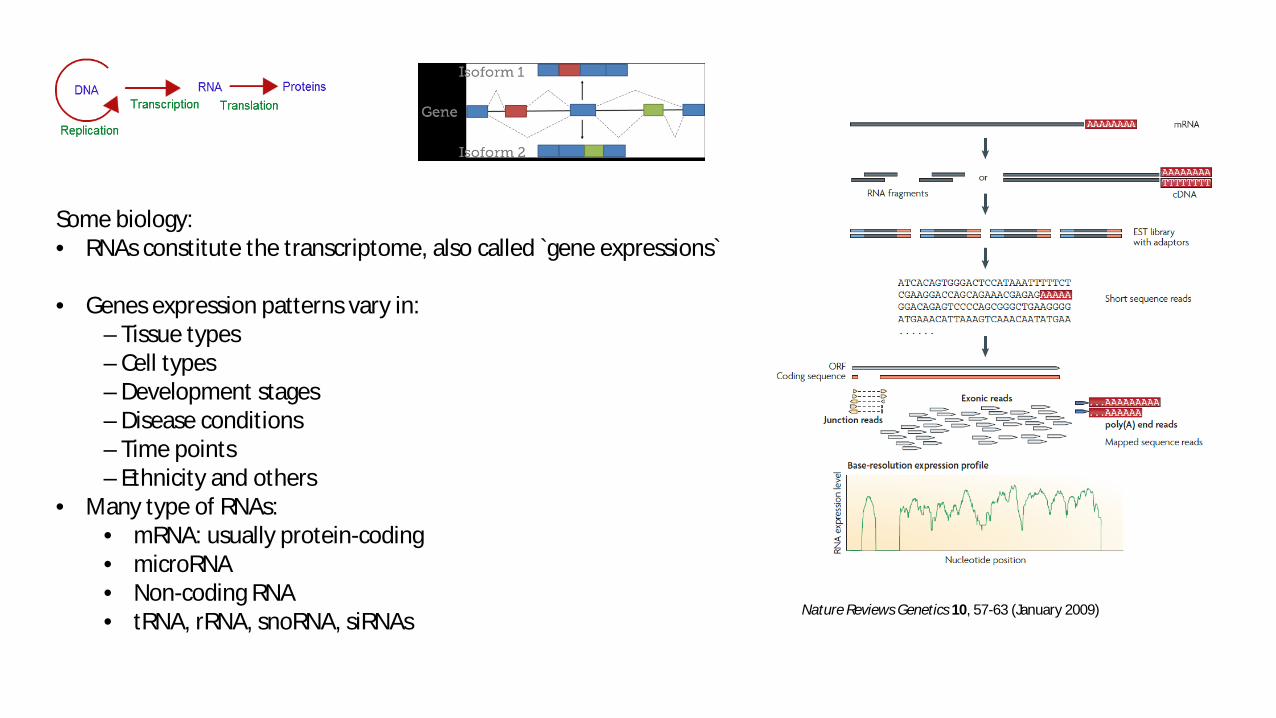
Nature Reviews Genetics 10, 57-63 (January 2009)
Some biology:• RNAs constitute the transcriptome, also called `gene expressions`
• Genes expression patterns vary in:– Tissue types– Cell types– Development stages– Disease conditions– Time points– Ethnicity and others
• Many type of RNAs:• mRNA: usually protein-coding• microRNA• Non-coding RNA• tRNA, rRNA, snoRNA, siRNAs
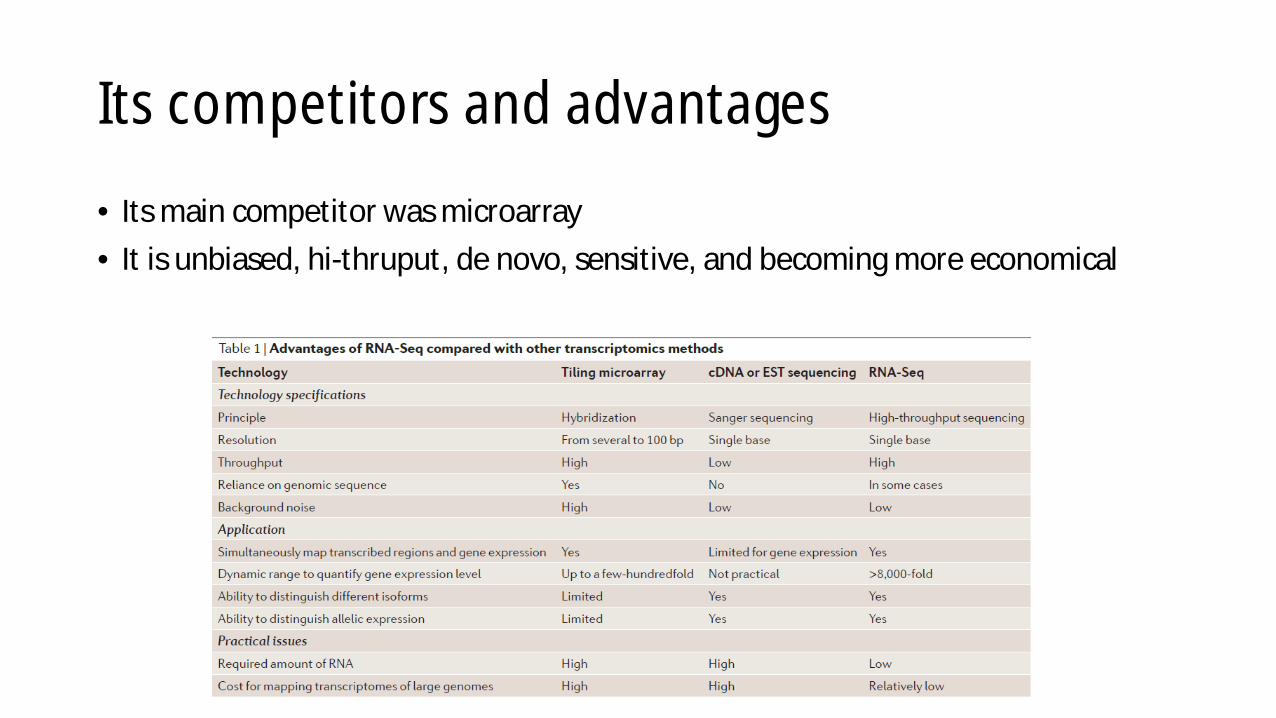
Its competitors and advantages
• Its main competitor was microarray• It is unbiased, hi-thruput, de novo, sensitive, and becoming more economical
What can RNA-seq do?To the least, quantify expression values of genes; but much more
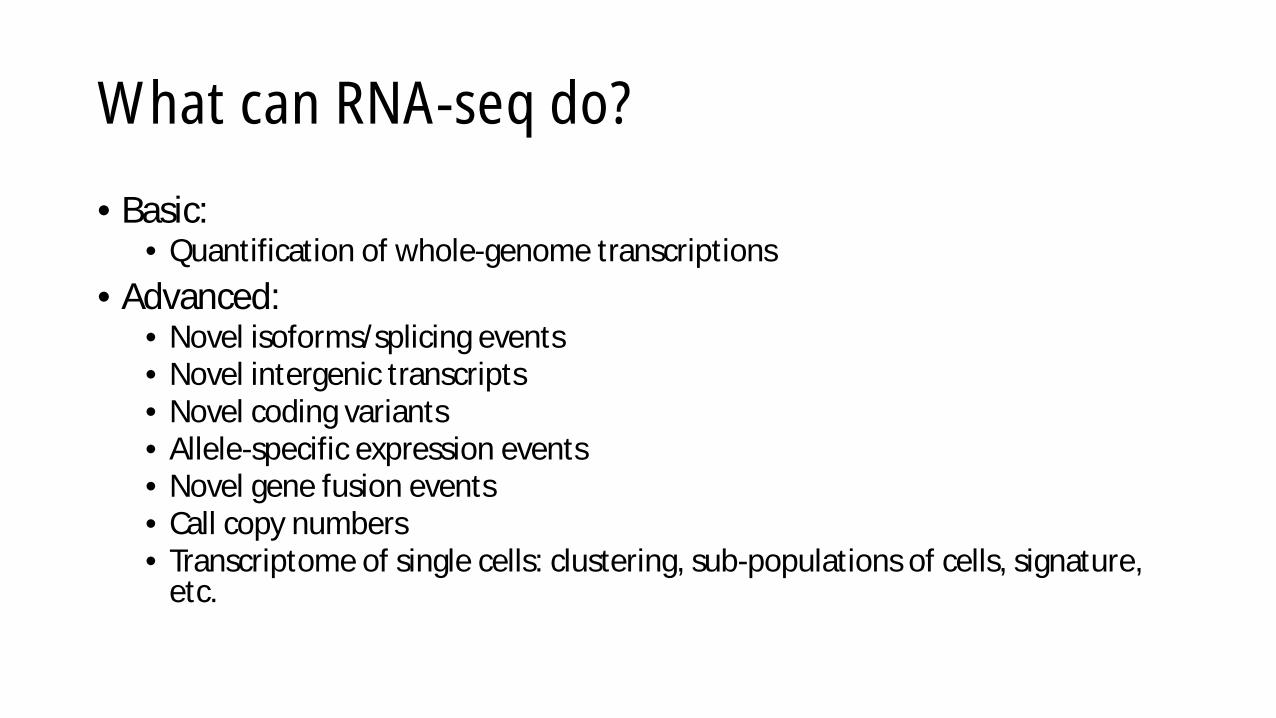
What can RNA-seq do?
• Basic:• Quantification of whole-genome transcriptions
• Advanced:• Novel isoforms/splicing events• Novel intergenic transcripts• Novel coding variants• Allele-specific expression events• Novel gene fusion events• Call copy numbers• Transcriptome of single cells: clustering, sub-populations of cells, signature,
etc.
How is RNA-seq measured?
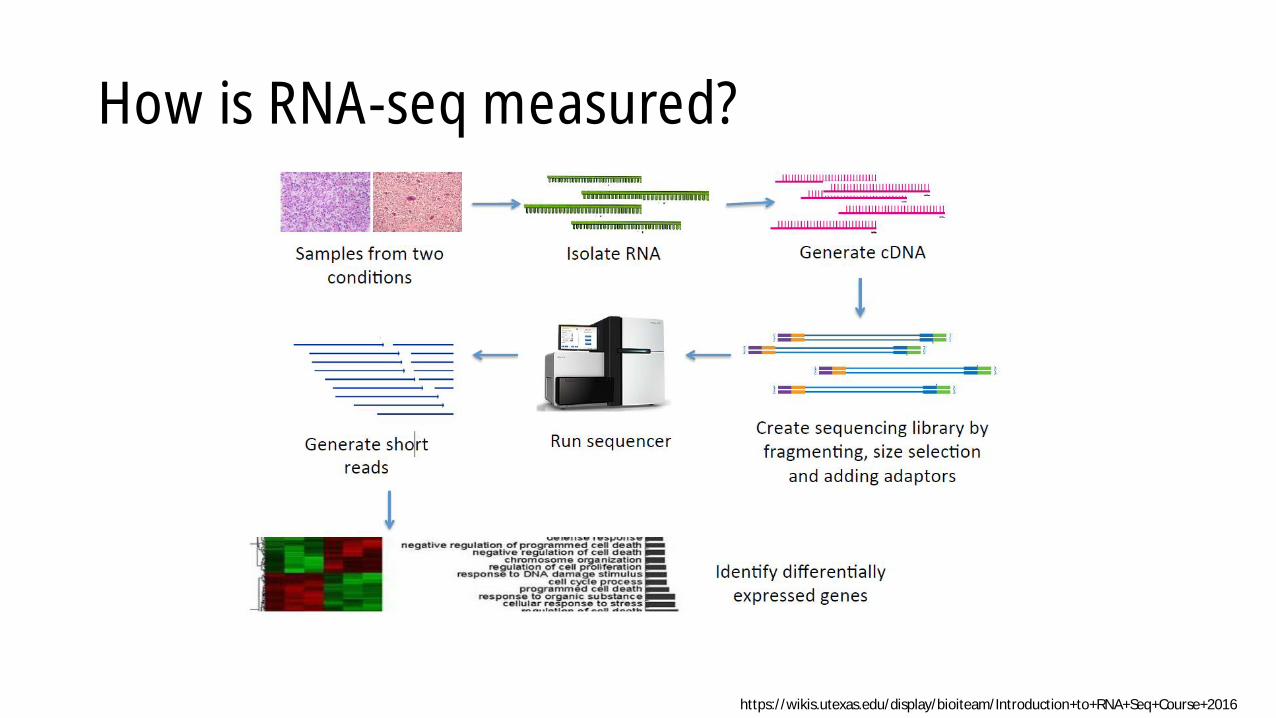
How is RNA-seq measured?
https://wikis.utexas.edu/display/bioiteam/Introduction+to+RNA+Seq+Course+2016
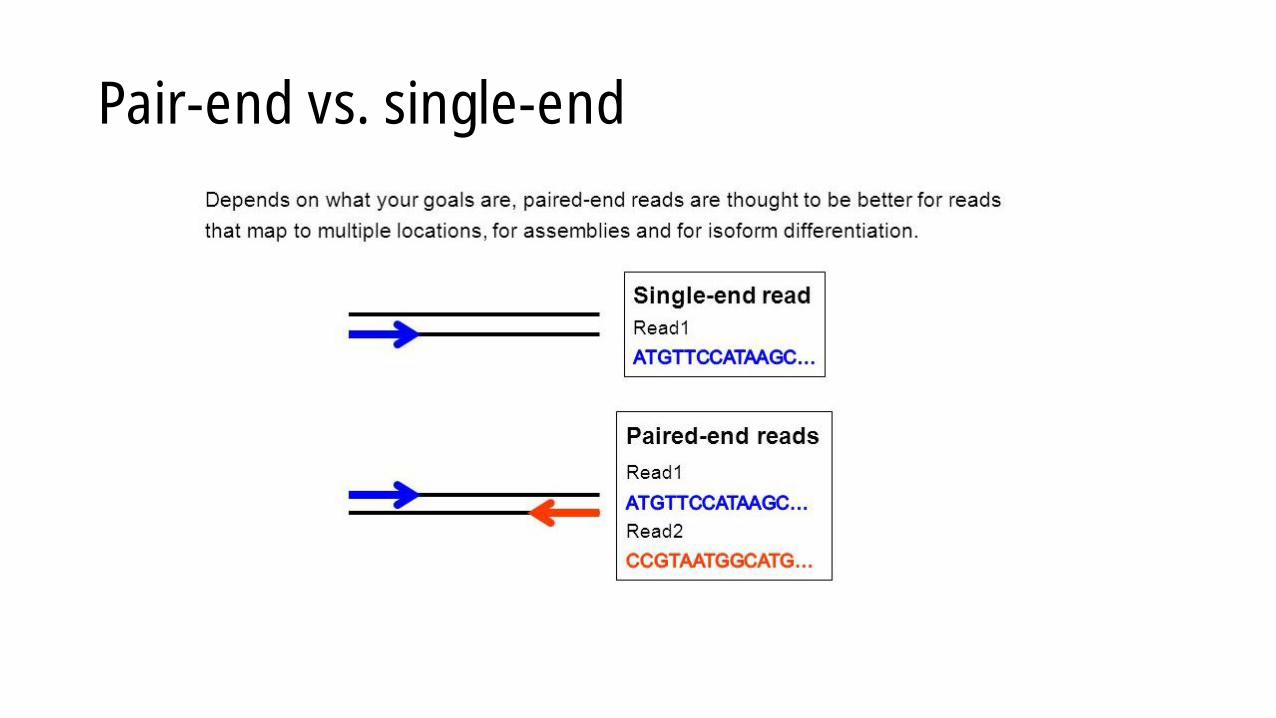
Pair-end vs. single-end
How to process RNA-seq DataThe basics
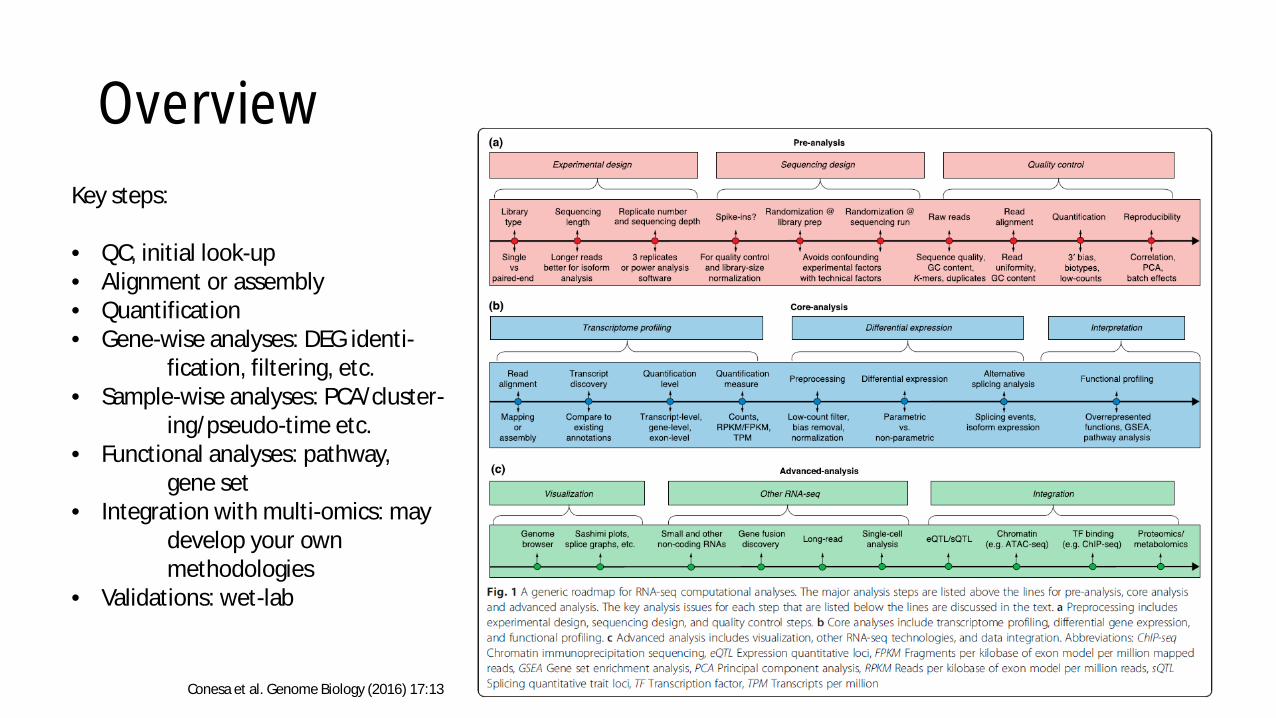
Overview
Conesa et al. Genome Biology (2016) 17:13
Key steps:
• QC, initial look-up• Alignment or assembly• Quantification• Gene-wise analyses: DEG identi-
fication, filtering, etc.• Sample-wise analyses: PCA/cluster-
ing/pseudo-time etc.• Functional analyses: pathway,
gene set• Integration with multi-omics: may
develop your ownmethodologies
• Validations: wet-lab
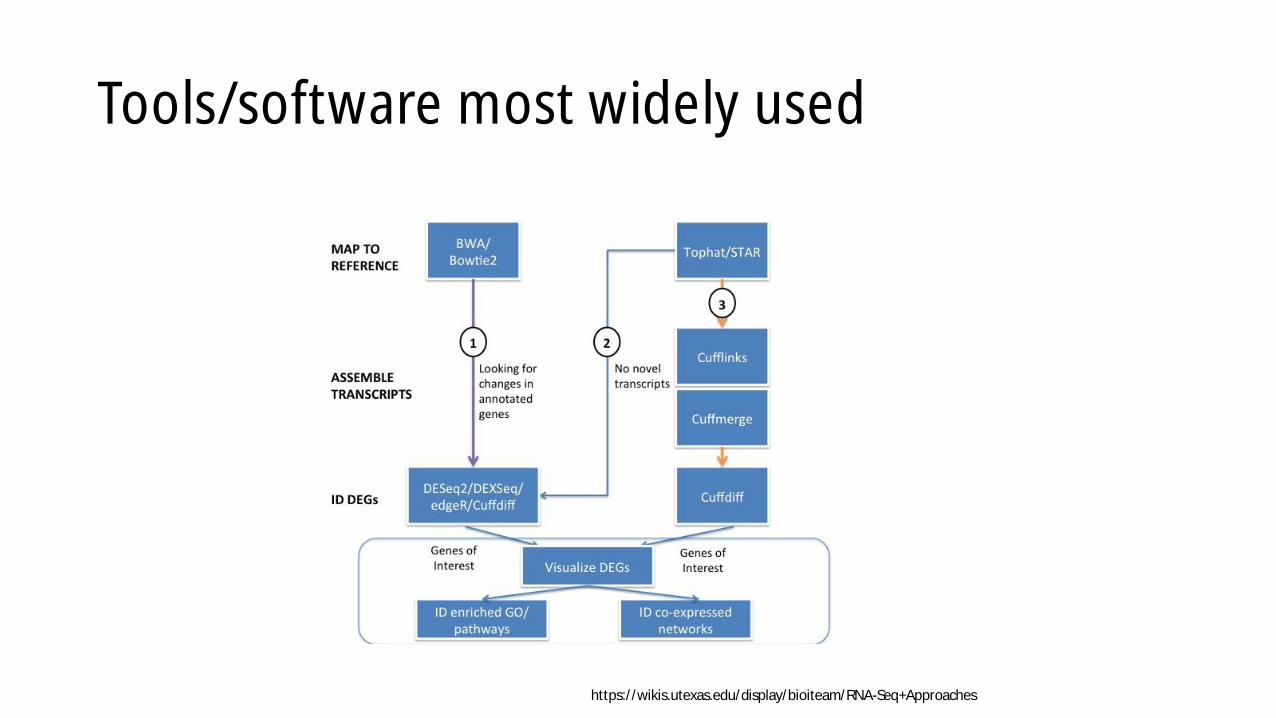
Tools/software most widely used
https://wikis.utexas.edu/display/bioiteam/RNA-Seq+Approaches
Step 1: look at your input data
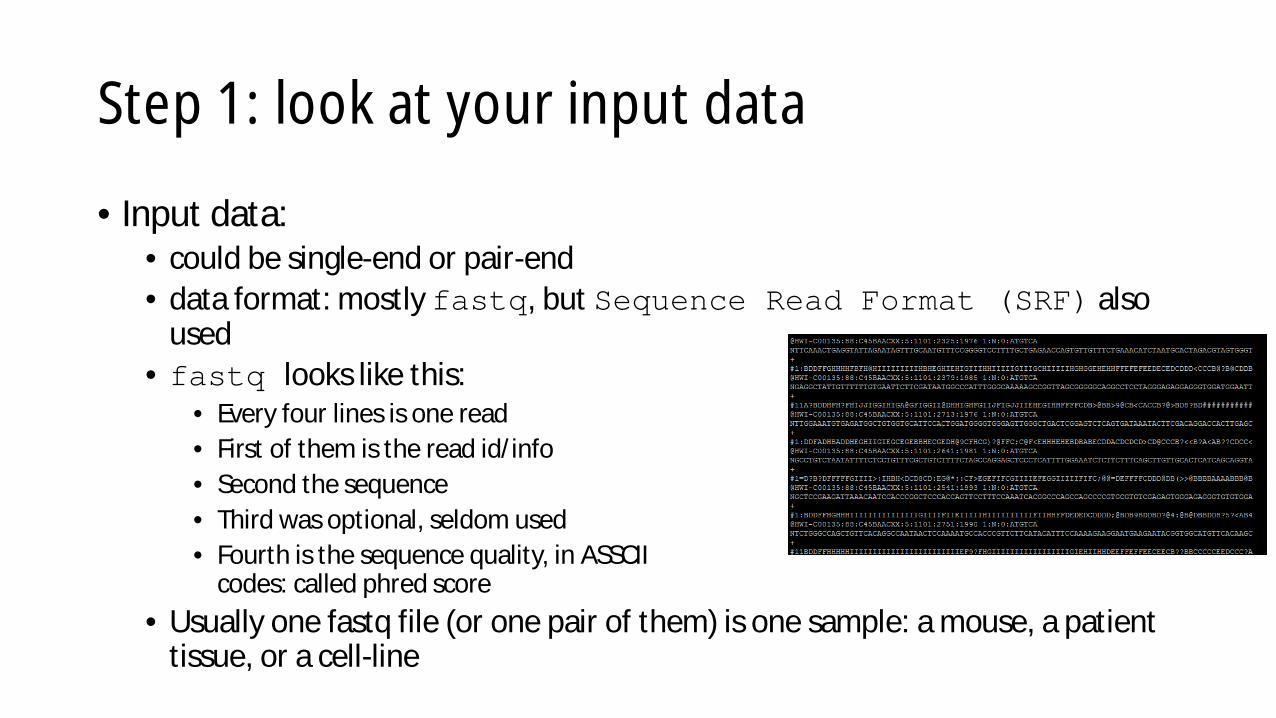
• Input data:• could be single-end or pair-end• data format: mostly fastq, but Sequence Read Format (SRF) also
used• fastq looks like this:
• Every four lines is one read• First of them is the read id/info• Second the sequence• Third was optional, seldom used• Fourth is the sequence quality, in ASSCII
codes: called phred score• Usually one fastq file (or one pair of them) is one sample: a mouse, a patient
tissue, or a cell-line
Step 1: look at your input data
• If you have N samples, you will have:• 1N fastq files, if single-end• 2N, if pair-end
• At this stage, your data has not been aligned, and you don’t know:• each read’s coordinate• If a read is from your target transcriptome, or contamination• a read’s quality• the whole file’s quality
• QC is thus needed, and FastQC was frequently used
Step 2: do some read-level QC
• By looking at FASTQC report, you can check that• The average quality per read• That per position (usually the leading/tail reads are lower in qual)• The GC contents (if it looks naturally occurring)• Any repetitive elements (might be linker/adapter/barcodes)
• If one or some of your fastq files fail too many QC criteria: might wantto filter them from further analyses
• Go to FASTQC report examples
Step 3: alignment/assembly
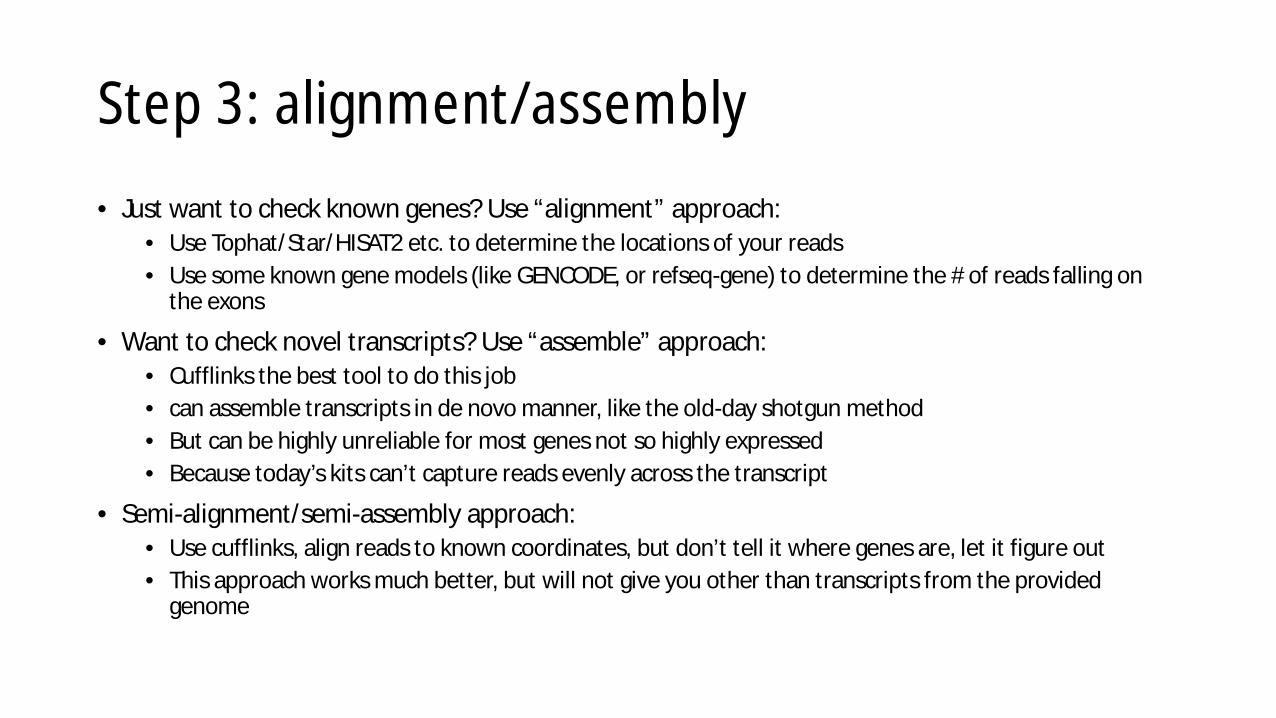
• Just want to check known genes? Use “alignment” approach:• Use Tophat/Star/HISAT2 etc. to determine the locations of your reads• Use some known gene models (like GENCODE, or refseq-gene) to determine the # of reads falling on
the exons
• Want to check novel transcripts? Use “assemble” approach:• Cufflinks the best tool to do this job• can assemble transcripts in de novo manner, like the old-day shotgun method• But can be highly unreliable for most genes not so highly expressed• Because today’s kits can’t capture reads evenly across the transcript
• Semi-alignment/semi-assembly approach:• Use cufflinks, align reads to known coordinates, but don’t tell it where genes are, let it figure out• This approach works much better, but will not give you other than transcripts from the provided
genome
Step 3: alignment/assembly
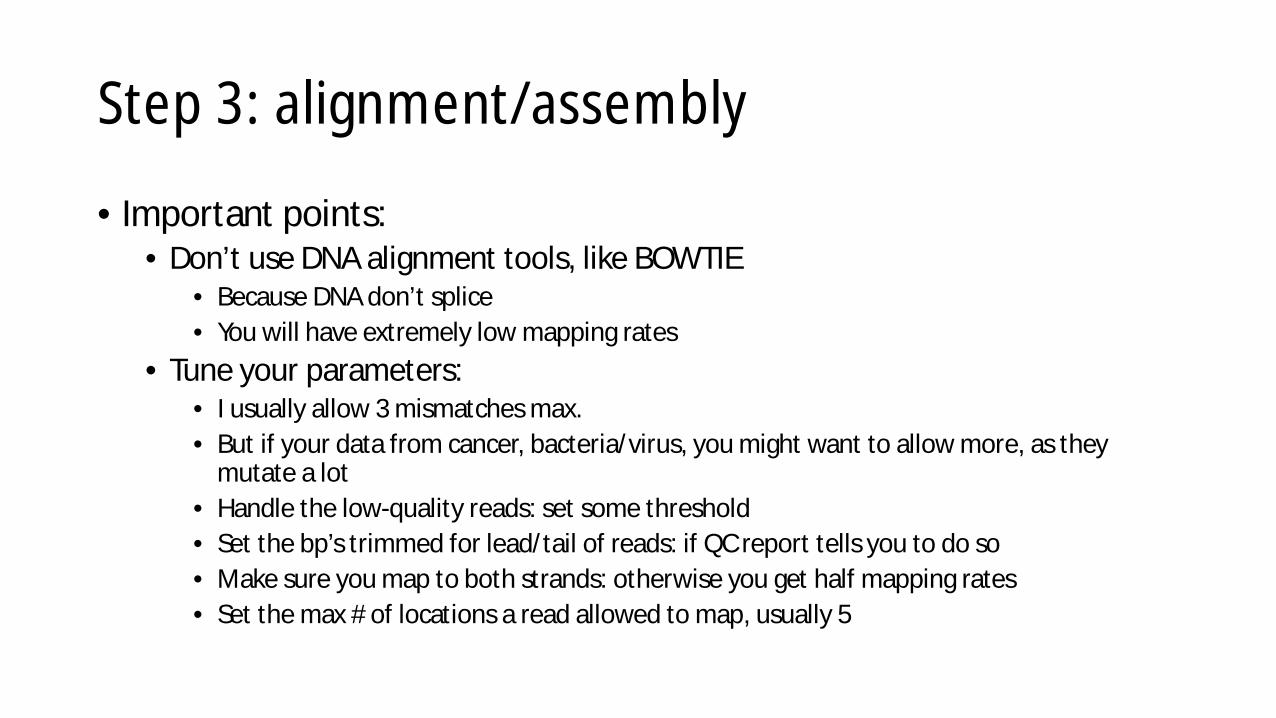
• Important points:• Don’t use DNA alignment tools, like BOWTIE
• Because DNA don’t splice• You will have extremely low mapping rates
• Tune your parameters:• I usually allow 3 mismatches max.• But if your data from cancer, bacteria/virus, you might want to allow more, as they
mutate a lot• Handle the low-quality reads: set some threshold• Set the bp’s trimmed for lead/tail of reads: if QC report tells you to do so• Make sure you map to both strands: otherwise you get half mapping rates• Set the max # of locations a read allowed to map, usually 5
Step 3: alignment/assembly
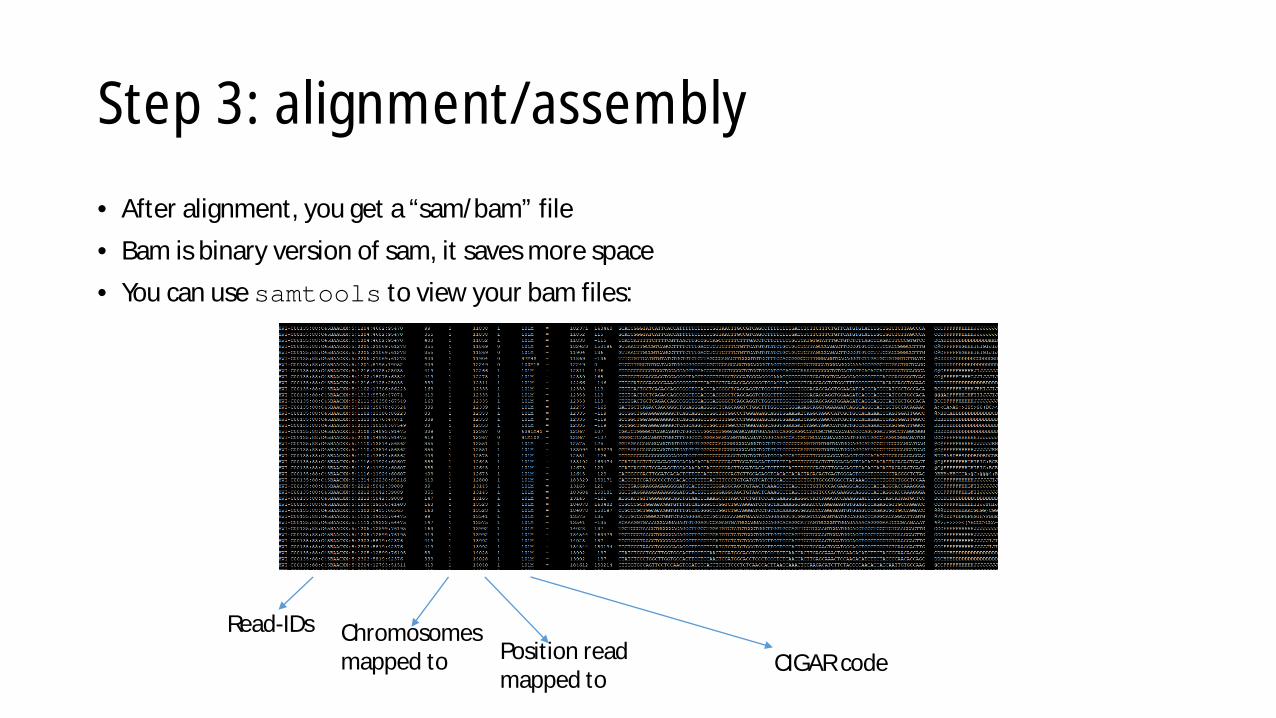
• After alignment, you get a “sam/bam” file• Bam is binary version of sam, it saves more space• You can use samtools to view your bam files:
Read-IDs Chromosomesmapped to Position read
mapped toCIGAR code
Step 3: alignment/assembly – check youralignment rates, and alignment structure
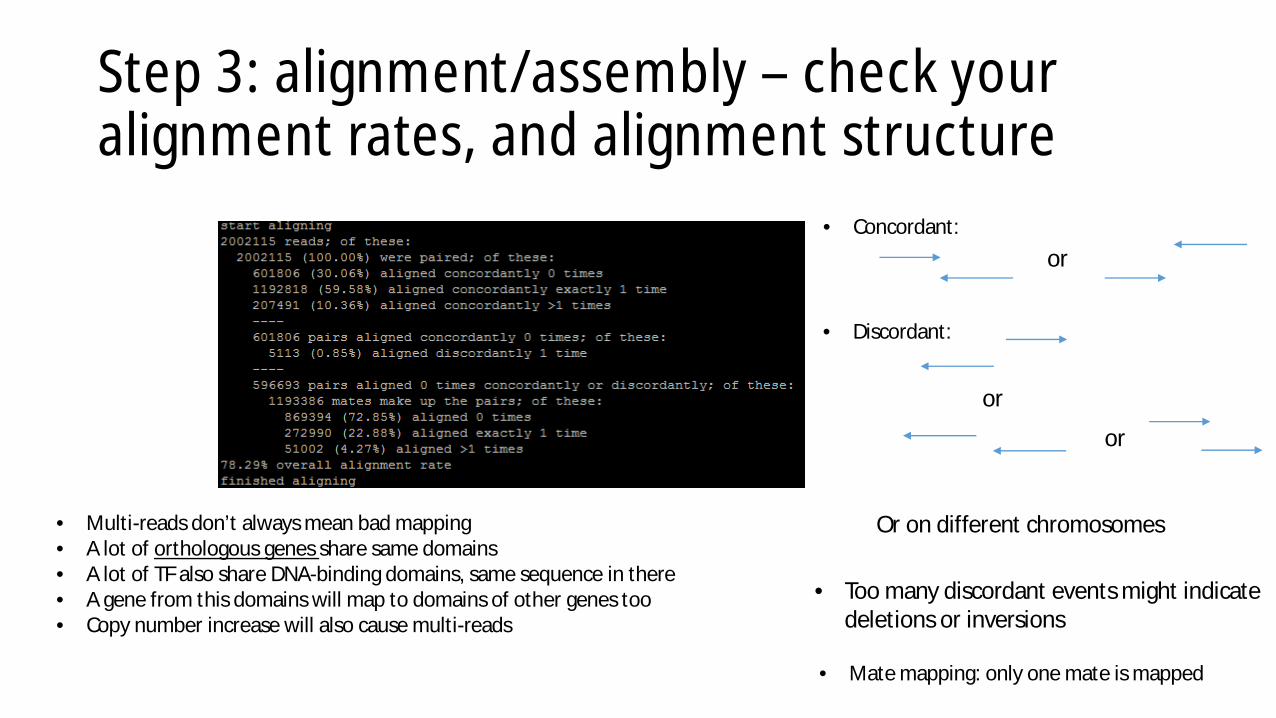
• Multi-reads don’t always mean bad mapping• A lot of orthologous genes share same domains• A lot of TF also share DNA-binding domains, same sequence in there• A gene from this domains will map to domains of other genes too• Copy number increase will also cause multi-reads
• Concordant:
• Mate mapping: only one mate is mapped
or
or
or
Or on different chromosomes
• Discordant:
• Too many discordant events might indicatedeletions or inversions
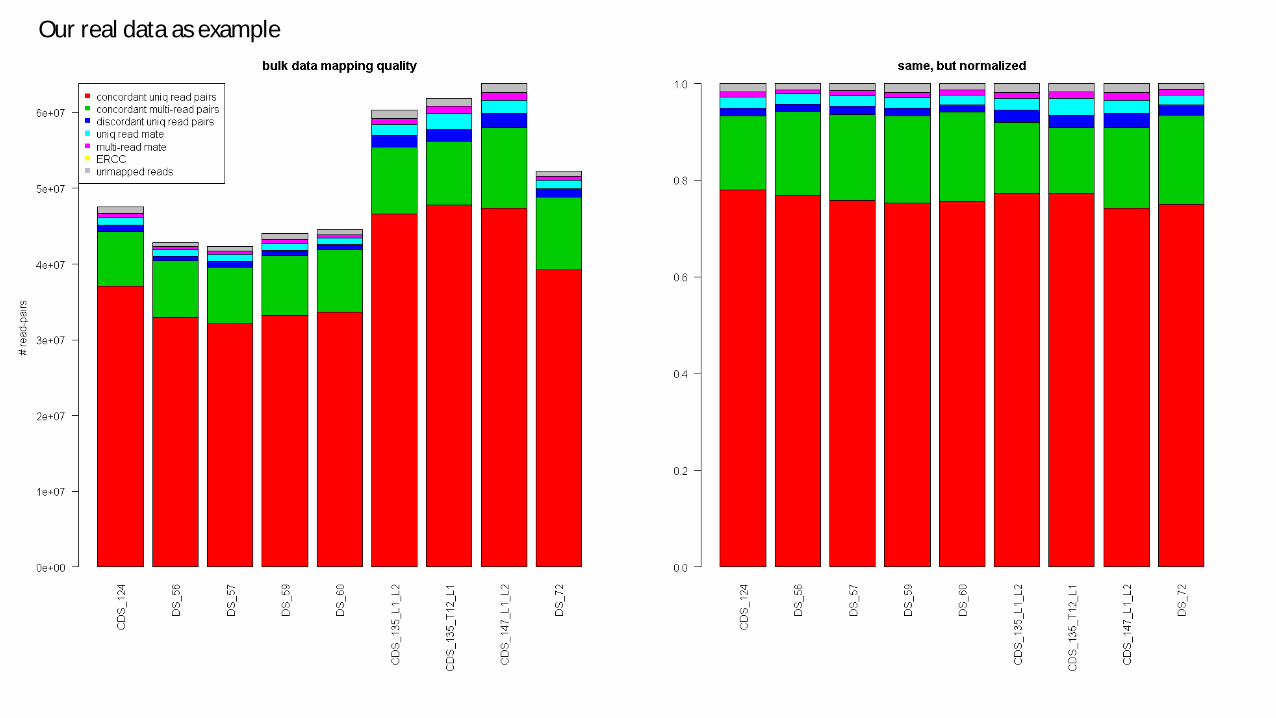
Our real data as example
Step 3: alignment/assembly – what else?
• You can:• output your splice sites• check read distributions across different chromosomes• Most importantly, check the unaligned reads (they can be set to store in
separate output files):• BLAST them against all other genomes• Particularly bacteria/virus• Or align them to some spike-in sequences (like ERCC)• In all, make sure these reads are unaligned not because you set the wrong parameters,
and understand their sources• Visualize your alignment outputs:
• use UCSC browser, or• Broad Inst. IGV (recommended)
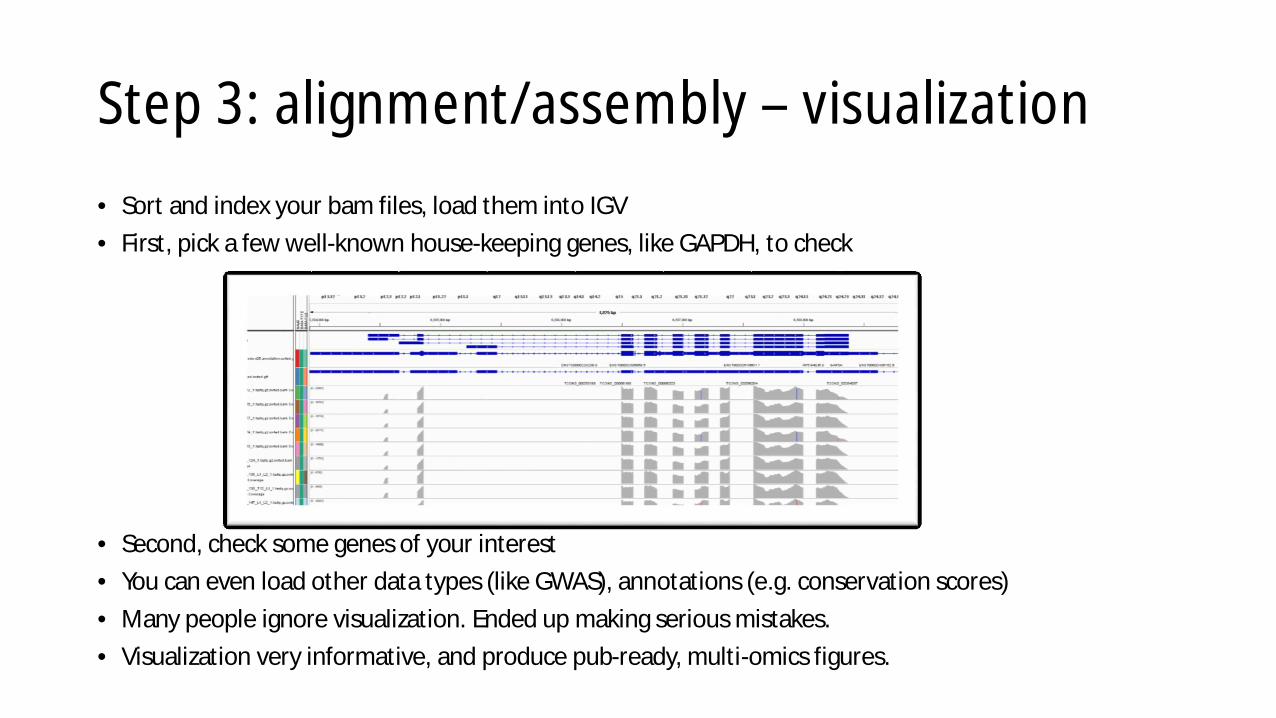
Step 3: alignment/assembly – visualization
• Sort and index your bam files, load them into IGV• First, pick a few well-known house-keeping genes, like GAPDH, to check
• Second, check some genes of your interest• You can even load other data types (like GWAS), annotations (e.g. conservation scores)• Many people ignore visualization. Ended up making serious mistakes.• Visualization very informative, and produce pub-ready, multi-omics figures.
Step4: quantification
• Concept simple: gene model + bam files àexpression tables• Tools:
• Raw read counts: use HTSeq-count or featureCount• Normalized read counts (i.e. FPKM): use RSEM or cufflinks
• Important notes:• Make sure same versions of genomes are used. Don’t use HG37 of gene
model with HG38 of bam files.• Don’t convert between raw-read counts and FPKM
• What else:• Check the genic vs. non-genic read ratios• Generally genic should be ~80%
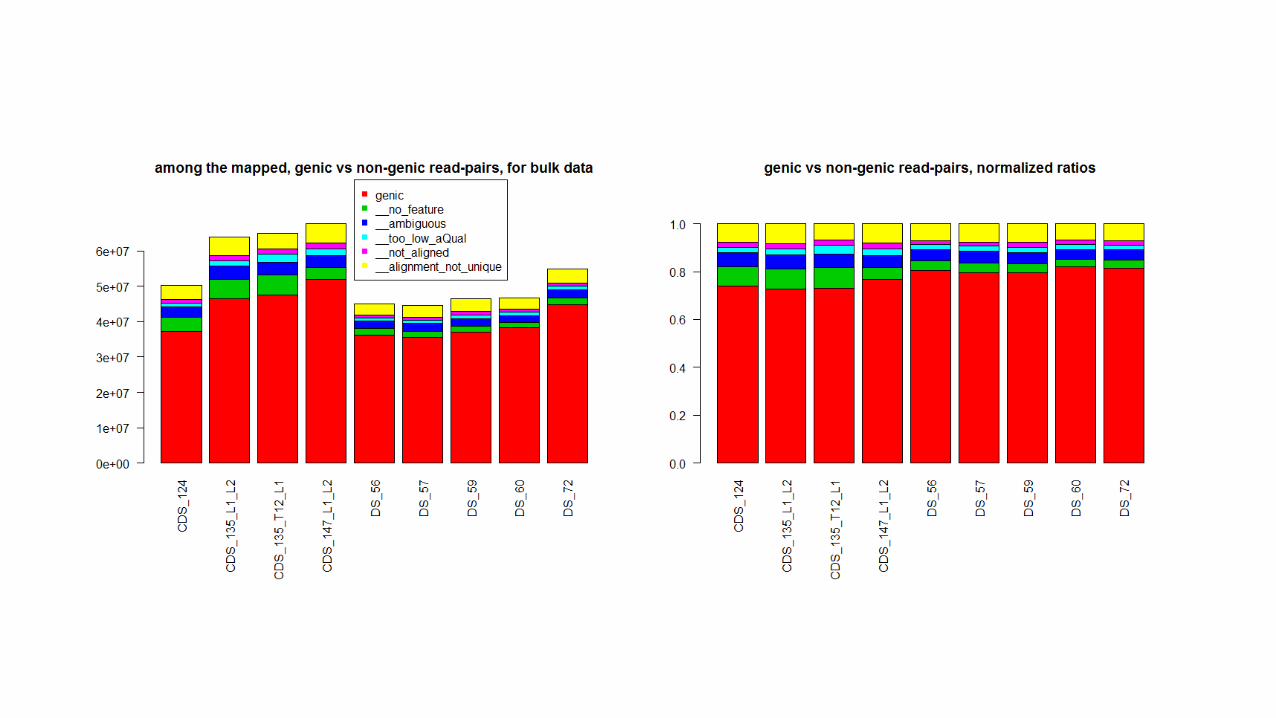
Step5: normalization
• Some simple facts:• The raw read counts tend to be Poissonian/negative-binomial• Variance proportional to mean• Log scale was used• A pseudo-count was usually added to genes, to avoid log(0)• Sometimes TPM (transcript per million) was used: different bio assumptions• Min expression level set: many use FPKM=1 as minimum acceptable evidence of
expression, could be wrong, depends on library sizes• Genes w too few expressed samples: excluded• Same for samples
• Further normalization tricks:• Quantile normalization• Variance stability normalization
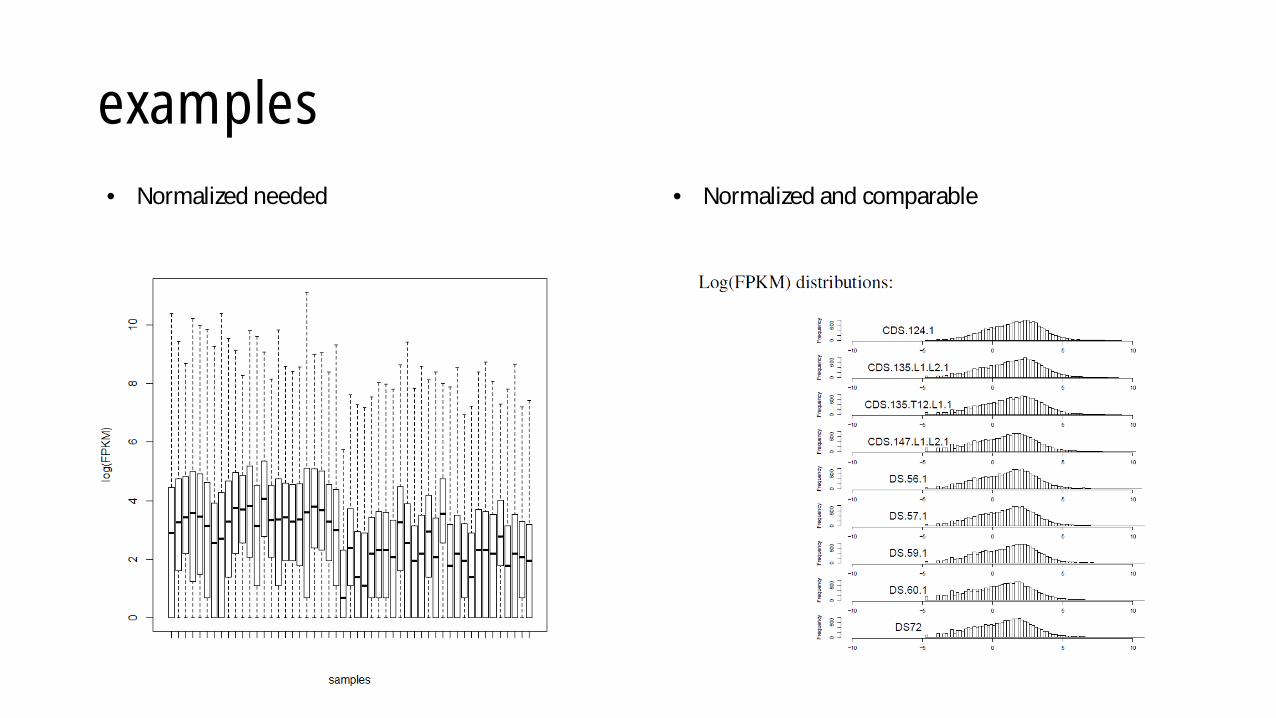
examples• Normalized and comparable• Normalized needed
How to analyze RNA-seq?Clustering, DEGs, signature/marker, pathways
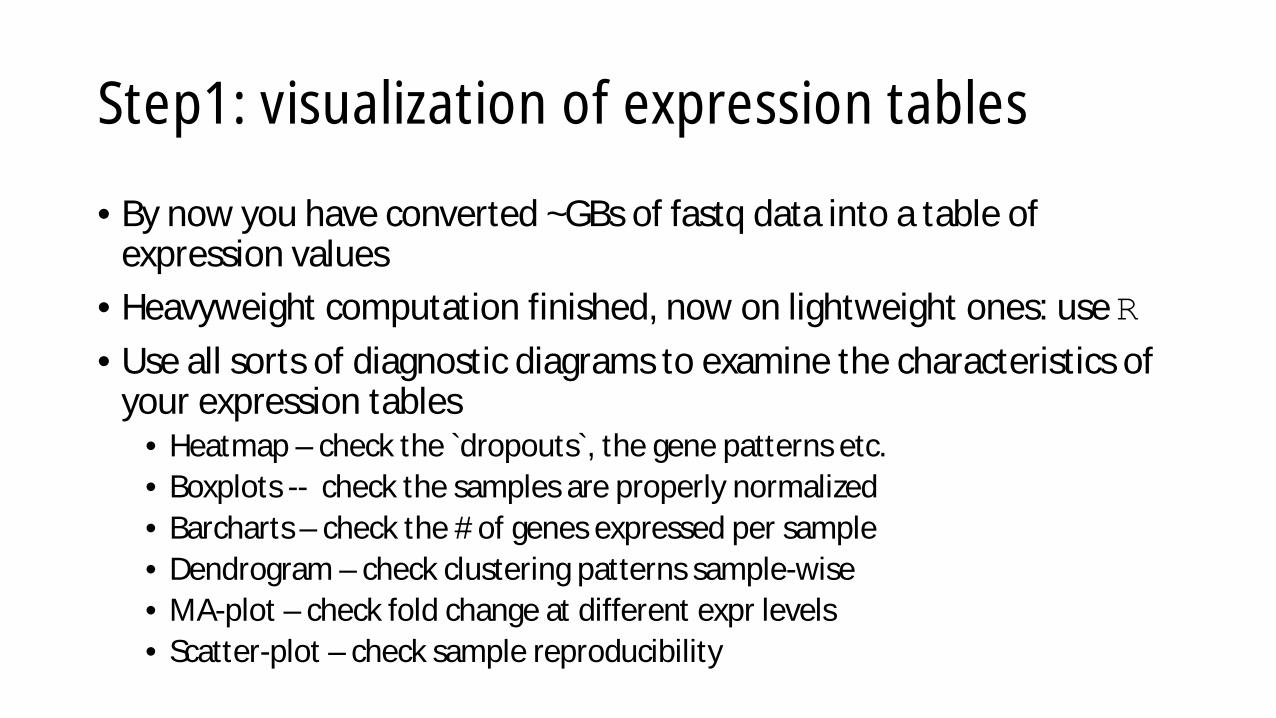
Step1: visualization of expression tables
• By now you have converted ~GBs of fastq data into a table ofexpression values
• Heavyweight computation finished, now on lightweight ones: use R• Use all sorts of diagnostic diagrams to examine the characteristics of
your expression tables• Heatmap – check the `dropouts`, the gene patterns etc.• Boxplots -- check the samples are properly normalized• Barcharts – check the # of genes expressed per sample• Dendrogram – check clustering patterns sample-wise• MA-plot – check fold change at different expr levels• Scatter-plot – check sample reproducibility
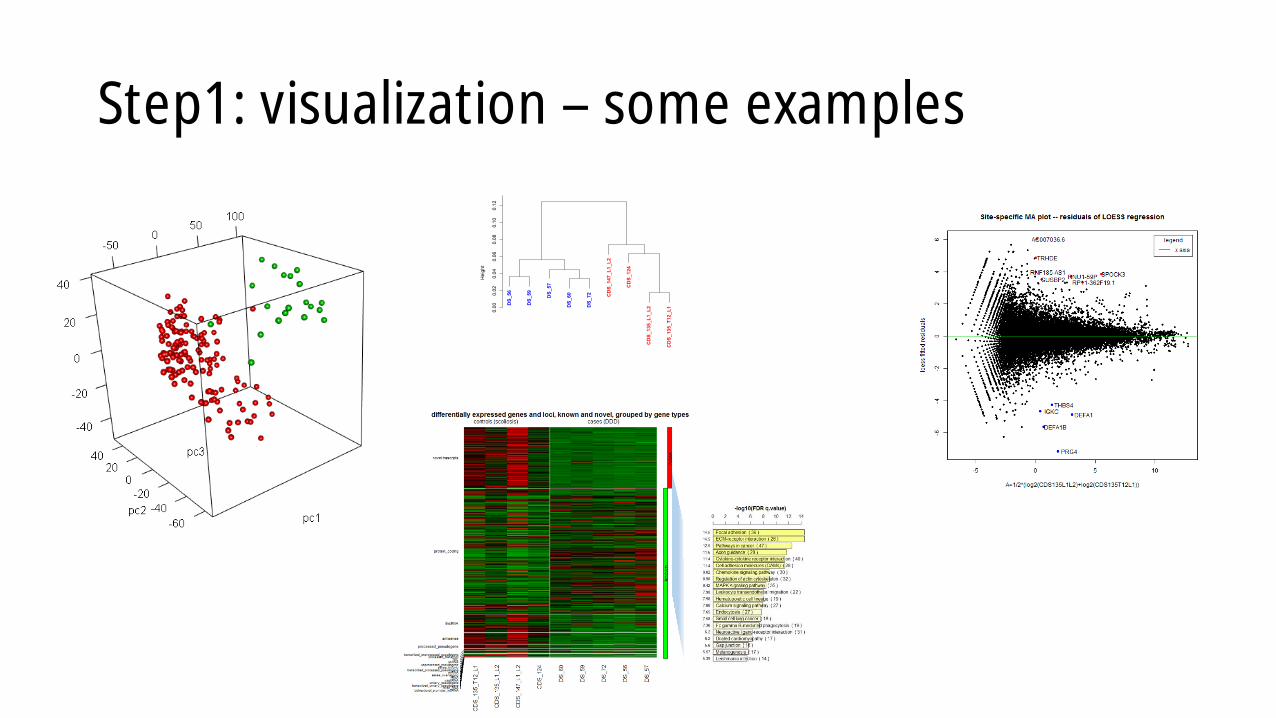
Step1: visualization – some examples
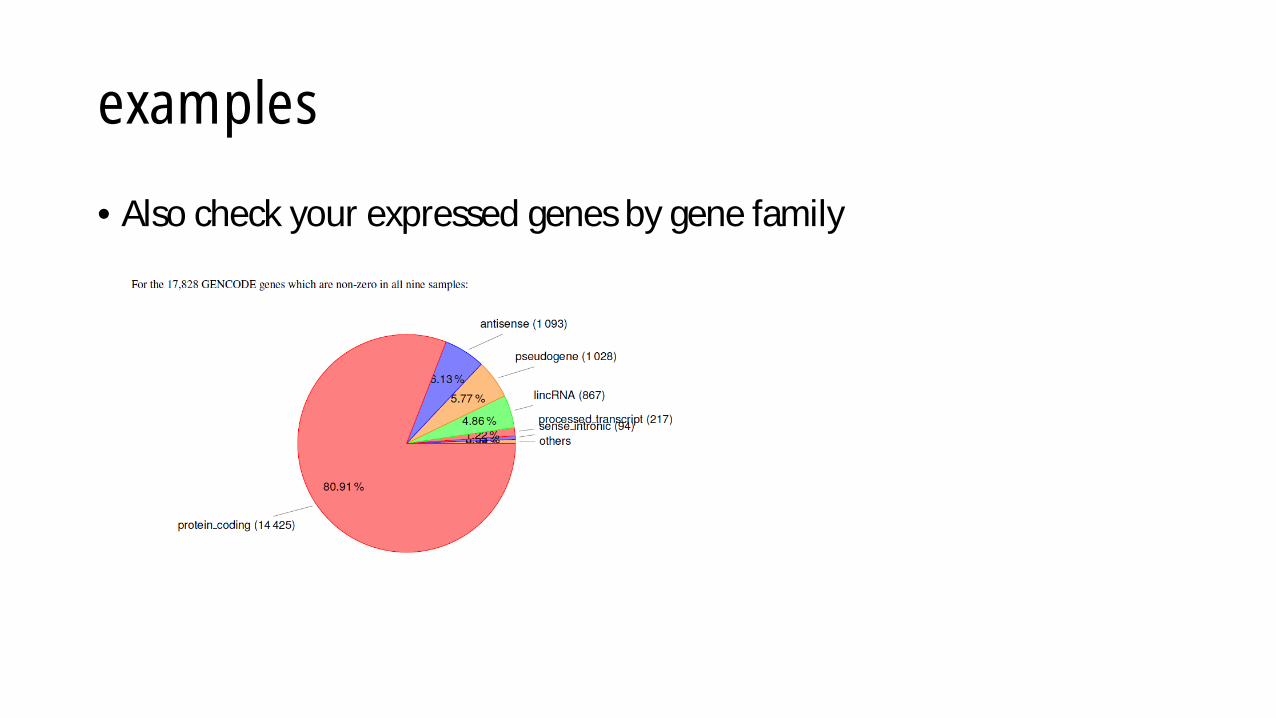
examples
• Also check your expressed genes by gene family
Step2: identification of `DEGs`
• DEGs==differentially expressed genes, thought be most biologicallyimportant in most studies
• Tools to detect them:• DESEQ – need raw-read counts as inputs, bio-duplicates required• edgeR – deal with FPKM• Cuff-diff – directly compare at the bam-file level!• Limma– if you log your FPKM, you can use limma too• scDE – if your samples are single cells
• In case no duplicate is available:• Use hard threshold holding: a threshold for fold-change, say at least 10 fold change
to consider differentially expressed• Some statistical tests: Kal’s test of 1999, but it inflates p-values a lot!
Step3: functional analyses
• Pathway/GO term/gene-set enrichment:• IPA• DAVID• GSEA (recommended, really simple to use; credible results; comprehensive)
• Important notes:• Don’t use too many nor too few genes• Too many (>2,000), you are bound to get some pathways, but not really
biologically relevant• Too few (say <10), you will get nothing• Be careful with GO term analysis: tend to give too many positives
Step3: functional analyses
• Integrate with other omics data: GWAS, chipseq• Comparing with data of a different species, e.g. human vs mouse• Molecular validations: knock-down, knock-out and knock-in
What is trendy?Single cell RNA-seq, non-coding RNAs, eRNAs …
• Single cell RNAseq data:• Offer unprecedented resolution of cellular heterogeneity• Can identify subpopulations, establish their lineage, and identify their signature
genes• Many old techniques don’t apply, new tools are quickly being developed• Emerging tech with challenges: unstable qualities, huge dropout rates
• Non-coding RNAs:• Intergenic transcripts• Don’t occur a lot in major cell types• Lowly expressed• Some are enhancer RNAs• Could have regulatory roles
Summary
• RNAseq is latest tech for massive transcriptomic profiling• Better and getting cheaper than old tech like microarray• Proper processing to reduce technical noise, avoid biases, and
delineate biological variations• Use conventional tools, or develop your own methods, to perform
functional analyses