analysis of successful flexible pavement sections in texas ... · this report does not constitute a...
TRANSCRIPT

Technical Report Documentation Page 1. Report No. FHWA/TX-08/0-5472-1
2. Government Accession No.
3. Recipient's Catalog No. 5. Report Date Published October 2008
4. Title and Subtitle ANALYSIS OF SUCCESSFUL FLEXIBLE PAVEMENT SECTIONS IN TEXAS – INCLUDING DEVELOPMENT OF A WEB SITE AND DATABASE
6. Performing Organization Code
7. Author(s) Paul Krugler, Carlos Chang-Albitres, Tom Scullion, and Arif Chowdhury
8. Performing Organization Report No. Report 0-5472-1
10. Work Unit No. (TRAIS)
9. Performing Organization Name and Address Texas Transportation Institute The Texas A&M University System College Station, Texas 77843-3135
11. Contract or Grant No. Project 0-5472 13. Type of Report and Period Covered Technical Report: September 2005 – August 2007
12. Sponsoring Agency Name and Address Texas Department of Transportation Research and Technology Implementation Office P.O. Box 5080 Austin, Texas 78763-5080
14. Sponsoring Agency Code
15. Supplementary Notes Project performed in cooperation with the Texas Department of Transportation and the Federal Highway Administration. Project Title: A Database for Successful Pavement Sections in Texas – Including Both Experimental and Non-Experimental Pavements URL: http://tti.tamu.edu/documents/0-5472-1.pdf 16. Abstract This report documents a cooperative effort to gather and make available information about flexible pavements which have been identified by the Texas Department of Transportation as superior performers compared to similar pavement structures carrying similar traffic loads. Analyses of available construction records for these pavements and the results of pavement testing performed during this project are provided. A web site was created to store and make available information about successful flexible pavements and also to allow online nomination of additional pavements into the database by field personnel.
17. Key Words Asphalt Concrete, Successful Flexible Pavement Performance, Surface Treatment, Stone-Matrix Asphalt, Coarse-Matrix High-Binder, Superpave, Dense-Graded Hot Mix, Flexible Base, Forensic
18. Distribution Statement No restrictions. This document is available to the public through NTIS: National Technical Information Service Springfield, Virginia 22161 http://www.ntis.gov
19. Security Classif.(of this report) Unclassified
20. Security Classif.(of this page) Unclassified
21. No. of Pages 154
22. Price
Form DOT F 1700.7 (8-72) Reproduction of completed page authorized

ANALYSIS OF SUCCESSFUL FLEXIBLE PAVEMENT SECTIONS IN TEXAS – INCLUDING DEVELOPMENT OF A WEB SITE AND
DATABASE
by
Paul Krugler Carlos Chang-Albitres Research Engineer Associate Transportation Researcher
Texas Transportation Institute Texas Transportation Institute
Tom Scullion Arif Chowdhury Senior Research Engineer Assistant Research Engineer
Texas Transportation Institute Texas Transportation Institute
Report 0-5472-1 Project 0-5472
Project Title: A Database for Successful Pavement Sections in Texas – Including Both Experimental and Non-Experimental Pavements
Performed in cooperation with the Texas Department of Transportation
and the Federal Highway Administration
Published October 2008
TEXAS TRANSPORTATION INSTITUTE The Texas A&M University System College Station, Texas 77843-3135

v
DISCLAIMER
This research was performed in cooperation with the Texas Department of Transportation
(TxDOT) and the Federal Highway Administration (FHWA). The contents of this report reflect
the views of the authors, who are responsible for the facts and the accuracy of the data presented
herein. The contents do not necessarily reflect the official view or policies of the FHWA or
TxDOT. This report does not constitute a standard, specification, or regulation. This report is not
intended for construction, bidding, or permitting purposes. The engineer in charge of the project
was Paul E. Krugler, P.E. #43317. The United States Government and the State of Texas do not
endorse products or manufacturers. Trade or manufacturers’ names appear herein solely because
they are considered essential to the objective of this report.

vi
ACKNOWLEDGMENTS
This project was conducted in cooperation with TxDOT and FHWA. The authors thank
the members of TxDOT’s Project Monitoring Committee: Bill Brudnick (HOU), Tracy Cumby
(LBB), Gary Fitts, (Asphalt Institute), Darlene Goehl (BRY), Joe Leidy (CST), Magdy Mikhail
(CST), Michael Murphy (CST), Tammy Sims (MNT), Walter Torres (HOU), and Karen
VanHooser (TSD). Special thanks go to the project director, Ahmed Eltahan (CST), and the
program coordinator, Darrin Grenfell (FHWA). This project would not have been possible
without the generous support, feedback, guidance, and assistance from all of these individuals.
The authors also extend special appreciation to the many individuals in the districts who
provided traffic control in so many locations across the state.

vii
TABLE OF CONTENTS
Page
List of Figures............................................................................................................................... xi
List of Tables .............................................................................................................................. xiii
Chapter 1: Introduction ............................................................................................................... 1 Organization of the Report.......................................................................................................... 1 Overview of the Texas Successful Flexible Pavements Web Site and Database ....................... 2
Chapter 2: Definition of Successful Flexible Pavement Performance ..................................... 5 Literature Review........................................................................................................................ 5 Brainstorming Meeting with TxDOT Pavement Engineers........................................................ 5 Evaluation of Data from TxDOT’s Pavement Management Information System (PMIS) ...... 12 Selection and Discussion of Definition Criteria ....................................................................... 12 Definition and Criteria for Successful Flexible Pavement Performance .................................. 18
Definition .............................................................................................................................. 18 Individual Criteria................................................................................................................. 19 Criteria Table Instructions .................................................................................................... 19
Chapter 3: Successful Flexible Pavement Nomination and Selection.................................... 21 Nomination Process .................................................................................................................. 21 Selection Process ...................................................................................................................... 21
PMIS Data and Information Summaries for Selected Pavements ........................................ 25
Chapter 4: Web Site and Database Development.................................................................... 27 Software and Technical Specifications..................................................................................... 27
Conceptual Data Modeling ................................................................................................... 27 Programming Technical Information and Database Compatibility ...................................... 30
Web Site Access ....................................................................................................................... 31 Guest Access......................................................................................................................... 31 Read Access .......................................................................................................................... 32 Read, Write, and Approve Access ........................................................................................ 32 Administrator Access............................................................................................................ 32
Organization and Retrieval of Database Information ............................................................... 33 Database Navigation ............................................................................................................. 33
Nominated Pavement Administration....................................................................................... 37
Chapter 5: Laboratory and Pavement Testing of Successful Pavements.............................. 39 Scope and Objectives of Aged Pavement and Materials Testing ............................................. 39 Pavement Testing Protocols...................................................................................................... 39
Ground Penetrating Radar..................................................................................................... 40 Falling Weight Deflectometer............................................................................................... 43 Dynamic Cone Penetrometer ................................................................................................ 44
Pavement Materials Sampling .................................................................................................. 46 Laboratory Testing Protocols.................................................................................................... 50

viii
Asphalt Concrete Mixture Layer Testing ............................................................................. 51 Surface Treatment Layer Testing.......................................................................................... 53 Stabilized Base Layer Testing .............................................................................................. 53 Flexible Base Layer and Subgrade Testing .......................................................................... 54
Chapter 6: Analysis of Information .......................................................................................... 57 Impacts of Specification and Test Method Evolution............................................................... 57 Specification Analysis Methodology........................................................................................ 57
Data Collection ..................................................................................................................... 57 Construction Data Refinement.............................................................................................. 58 Data Analysis Methods ......................................................................................................... 59
Individual Pavement Descriptions and Analyses...................................................................... 61 IH 10 – Odessa District......................................................................................................... 61 IH 10 – San Angelo District.................................................................................................. 62 IH 20W – Atlanta District..................................................................................................... 63 IH 30 – Atlanta District......................................................................................................... 64 BIH 35 – Fort Worth District................................................................................................ 65 US 59 – Atlanta District........................................................................................................ 66 US 67 – Brownwood District................................................................................................ 67 US 190 – Brownwood District.............................................................................................. 68 US 287 – Lufkin District....................................................................................................... 69 US 377 – San Angelo District............................................................................................... 70 US 380 – Abilene District..................................................................................................... 71 US 385 – Odessa District...................................................................................................... 71 SH 21E – Bryan District ....................................................................................................... 72 SH 121 – Fort Worth District................................................................................................ 73 SH 152 – Amarillo District ................................................................................................... 74 SH 171 – Fort Worth District................................................................................................ 75 SH 176 – Odessa District...................................................................................................... 75 SH 183 – Fort Worth District................................................................................................ 76 FM 1472 – Laredo District ................................................................................................... 77 FM 1585 – Lubbock District................................................................................................. 78 FM 2771 – San Antonio District........................................................................................... 79 FM 2828 – San Antonio District........................................................................................... 79 FM 3223 – Waco District ..................................................................................................... 80 FM 3492 – Wichita Falls District ......................................................................................... 81 SH 6 – Houston District........................................................................................................ 81
Analyses of Groups of Similar Pavements ............................................................................... 83 Pavement Air Voids in All Types of Dense Asphalt Paving Mixtures................................. 83 Dense-Graded Asphalt Paving Mixtures .............................................................................. 88 Coarse-Matrix High-Binder Paving Mixtures ...................................................................... 90 Stone-Matrix Asphalt Paving Mixtures ................................................................................ 91 Surface Treatments ............................................................................................................... 92 Flexible Bases ....................................................................................................................... 92 Asphalt Pavement Layers Containing Tire Rubber .............................................................. 94
Pavement Modulus Data Collection ......................................................................................... 95 Historical PMIS Data Collection and Analysis ........................................................................ 99
ix
Strategies for Database Information Update Capabilities....................................................... 103 Recommendations on Changes to Testing Techniques to Improve Pavement Evaluation..... 103
Chapter 7: Findings and Recommendations .......................................................................... 105 Findings................................................................................................................................... 105 Recommendations................................................................................................................... 106
References.................................................................................................................................. 109
Appendix A: CD-ROM............................................................................................................. 111
Appendix B: Pavement Nomination Solicitation Documents ............................................... 115
Appendix C: Nominated Successful Flexible Pavements ...................................................... 121
Appendix D: Summary of 2004-2006 PMIS Performance Scores – Selected Pavements .. 127
Appendix E: Summary of 2004-2006 PMIS Pavement Maintenance Costs – Selected Pavements .................................................................................................................................. 133
Appendix F: Database Conceptual Data Model Glossary..................................................... 137

xi
LIST OF FIGURES Page Figure 1. Texas Successful Flexible Pavements Web Site Login Screen....................................... 2 Figure 2. Texas Successful Flexible Pavements Web Site Home Page.......................................... 3 Figure 3. Upper Portion of Overview Screen – SH 152, Amarillo District.................................... 4 Figure 4. Geographic Locations of Nominated Pavements. ......................................................... 22 Figure 5. Geographic Locations of Selected Pavements. ............................................................. 23 Figure 6. High-Level Conceptual Data Model Diagram for the Texas Successful Flexible
Pavements Database.............................................................................................................. 28 Figure 7. Conceptual Data Model for the Texas Successful Flexible Pavements Database......... 29 Figure 8. Screen Shot of User Accounts Section of the Administrator Screen. ........................... 32 Figure 9. Demonstration of Minor Navigation Availability. ........................................................ 33 Figure 10. Portion of Web Site Screen in Edit Mode. .................................................................. 35 Figure 11. Corresponding Edit Mode Web Site Screen in Normal View..................................... 36 Figure 12. Administrator’s Nominated Pavements Table............................................................. 37 Figure 13. GPR Equipment and Principles of Operation............................................................. 41 Figure 14. Still Picture from GPR Video Data – SH 6, Houston.................................................. 42 Figure 15. Typical Color-Coded GPR Traces for a Test Section. ................................................ 43 Figure 16. FWD Testing – US 59, Atlanta. .................................................................................. 44 Figure 17. Drilling Asphalt Mixture before DCP Testing. ........................................................... 45 Figure 18. DCP Testing in Outer Wheel Path............................................................................... 45 Figure 19. Typical Sampling Layout – Pavements with Asphalt Concrete Mixture Layer(s). .... 47 Figure 20. Typical Sampling Layout – Pavements with No Asphalt Concrete Mixture Layer(s).48 Figure 21. Typical Coring Layout at Section with HMA Layer (SH 176 in Odessa). ................. 49 Figure 22. TTI Auger Used to Obtain Flexible Base and Subgrade Samples. ............................. 49 Figure 23. Measurement of Layer Thickness While Auger Sampling. ........................................ 50 Figure 24. Laboratory Photographs of Pavement Cores............................................................... 51 Figure 25. Asphalt Stabilized Base Cores from US 287 and SH 6............................................... 53 Figure 26. Power 45 Plots of Daily Job Control Gradation Test Results - US 59, Houston. ....... 59 Figure 27. Frequency Diagram of Daily Laboratory-Compacted Densities - US 59, Houston.... 60 Figure 28. Frequency Diagram of Daily Hveem Stability Test Results - US 59, Houston. ......... 60 Figure 29. Frequency Diagram of Air Voids in Aged Pavement Layers – All Asphalt Concrete
Mix Types. ............................................................................................................................ 84 Figure 30. Frequency Diagram of Air Voids in Asphalt Concrete Pavement Surface Layers. .... 85 Figure 31. Frequency Diagram of Air Voids in Underlying Asphalt Concrete Pavement Layers.
............................................................................................................................................... 85 Figure 32. Frequency Diagram of Air Voids in Asphalt Concrete Pavement in Wheel Paths. .... 87 Figure 33. Frequency Diagram of Air Voids in Asphalt Concrete Pavement between Wheel
Paths...................................................................................................................................... 87 Figure 34. Power 45 Average Construction Job Control Gradations – Type D Mixes. ............... 88 Figure 35. Power 45 Average Construction Job Control Gradations – Type C Mixes. ............... 89 Figure 36. Power 45 Average Construction Job Control Gradations – CMHB-F Mixes. ............ 91
xii
Figure 37. Power 45 Average Construction Job Control Gradations – Grade 4 Surface Treatment Aggregate.............................................................................................................................. 92
Figure 38. Power 45 Average Construction Job Control Gradations – Flexible Bases. ............... 93 Figure 39. Power 45 Average Field Sample Gradations – Flexible Bases. .................................. 93 Figure 40. CMHB-F Pavement Containing Type II Tire Rubber – US 385, Odessa. .................. 94 Figure 41. CMHB-F Pavement Macro-Texture – US 385, Odessa. ............................................. 95 Figure 42. FWD Moduli in Surface Treatment Pavements. ......................................................... 98 Figure 43. FWD Moduli in Thin Asphalt Concrete Pavements.................................................... 98 Figure 44. FWD Moduli in Thick Asphalt Concrete Pavements.................................................. 99
xiii
LIST OF TABLES Page Table 1. Top Reference Items for Pavement Performance. ............................................................ 6 Table 2. Brainstorming Meeting Attendees. ................................................................................... 9 Table 3. Potential Factors for Definition of Successful Pavement Performance.......................... 10 Table 4. Level of Service Definitions for Pavement Maintenance (from TxDOT)...................... 11 Table 5. Condition Score Classes (from TxDOT). ....................................................................... 14 Table 6. 2005 PMIS Condition Score Averages by District. ........................................................ 15 Table 7. Distress Score Classes (from TxDOT). .......................................................................... 16 Table 8. 2005 PMIS Distress Score Averages by District. ........................................................... 16 Table 9. Ride Score Classes (from TxDOT)................................................................................. 17 Table 10. 2005 PMIS Ride Score Averages by District. .............................................................. 17 Table 11. Traffic Classes (from TxDOT). .................................................................................... 18 Table 12. Criteria for Identifying Successful Flexible Pavement Sections in Texas.................... 20 Table 13. Initial Successful Flexible Pavements in the Database................................................. 24 Table 14. Numbers of Pavements in Structural Categories and Traffic Levels............................ 25 Table 15. TxDOT Geographic Districts Represented................................................................... 26 Table 16. Major and Minor Web Site Navigation Levels............................................................. 34 Table 17. Field Sampling and Pavement Tests. ............................................................................ 40 Table 18. Asphalt Contents from Cores – Dense-Graded Mixes.................................................. 90 Table 19. VMAs from Construction Records – Dense-Graded Mixes......................................... 90 Table 20. Average Field Test Moduli Compared to Typical Design Moduli............................... 95 Table 21. FWD Back-Calculated Modulus Values....................................................................... 96 Table 22. DCP Modulus Values. .................................................................................................. 97 Table 23. Average Condition Scores from 1998-2006 PMIS Data. ........................................... 100 Table 24. Average Distress Scores from 1998-2006 PMIS Data ............................................... 101 Table 25. Average Ride Summary Scores from 1998-2006 PMIS Data .................................... 102

1
CHAPTER 1: INTRODUCTION
This report documents the development of a web site and database for collecting and
making available information about particularly successful flexible pavement sections in Texas.
The scope of the project included defining successful flexible pavement performance and
identifying the initial group of flexible pavement sections to include in the database. Researchers
collected construction information that was still available for the identified pavements, and
obtained additional test information from tests on aged-pavement cores and auger samples taken
during the project. The gathered information was analyzed to gain insights into pavement
characteristics resulting in superior performance. A comparison with current specification
requirements was made to assess appropriateness of specification criteria.
ORGANIZATION OF THE REPORT
This introductory chapter includes an overview of the Texas Successful Flexible
Pavements web site and database that were developed.
Chapter 2 describes a recommended definition of “successful” flexible pavement
performance and how the definition was developed.
Chapter 3 describes the successful pavement nomination process and the methods used to
evaluate nominations and select the initial group of pavements to be included in the database.
Chapter 4 describes the web site and database that were developed to make information
about particularly successful flexible pavements available to TxDOT pavement engineers as well
as a national audience.
Chapter 5 describes the field sampling, field testing, and laboratory evaluations that were
performed to evaluate selected pavements.
Chapter 6 describes the analyses that were performed on district construction test records
as well as on the results from laboratory and on-site pavement testing performed during this
project.
Chapter 7 summarizes the findings and recommendations derived from this research
project.

2
OVERVIEW OF THE TEXAS SUCCESSFUL FLEXIBLE PAVEMENTS WEB SITE AND DATABASE
The pavements described in this web site should be considered representative of the
many successfully performing flexible pavements in Texas. The process of selecting the initial
flexible pavements to include in this web site began with a solicitation of nominations from
TxDOT’s 25 geographically located district offices. The districts were asked to nominate
pavements that their staffs believe have performed in a superior fashion considering all factors
involved. Preliminary information was gathered about each nominated pavement section, and the
research team visited each nominating district to view and discuss the pavement section’s history
with district personnel. The final selection of pavements considered the need to represent a wide
variety of flexible pavement structure types, asphalt mixture types, and the broad geographical
area of the state.
Registered web site users and guests have access to all pavement information included in
the database. Three security access levels are provided for registered users, allowing TxDOT’s
web site administrator broad flexibility during implementation. The web site features online
functionality for new pavement nominations by registered users. Web site administration tools
are provided to facilitate future TxDOT management of web site content and registered user
access. Figure 1 shows the login screen.
Figure 1. Texas Successful Flexible Pavements Web Site Login Screen.
3
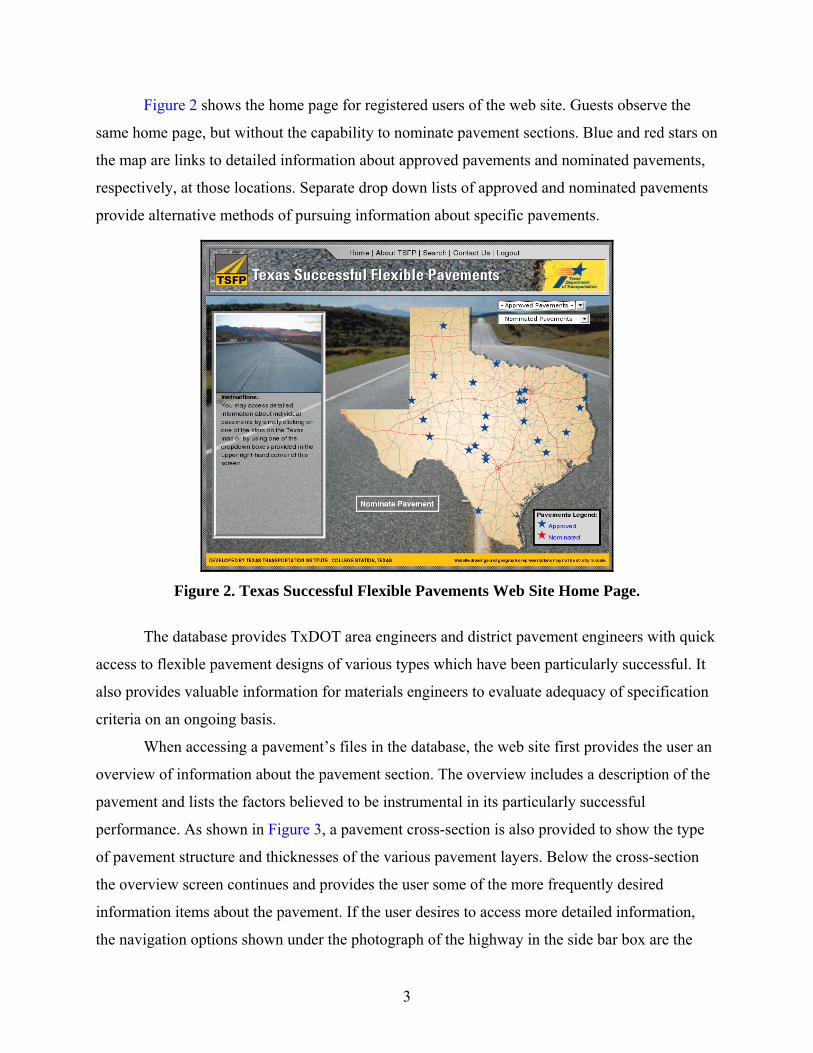
Figure 2 shows the home page for registered users of the web site. Guests observe the
same home page, but without the capability to nominate pavement sections. Blue and red stars on
the map are links to detailed information about approved pavements and nominated pavements,
respectively, at those locations. Separate drop down lists of approved and nominated pavements
provide alternative methods of pursuing information about specific pavements.
Figure 2. Texas Successful Flexible Pavements Web Site Home Page.
The database provides TxDOT area engineers and district pavement engineers with quick
access to flexible pavement designs of various types which have been particularly successful. It
also provides valuable information for materials engineers to evaluate adequacy of specification
criteria on an ongoing basis.
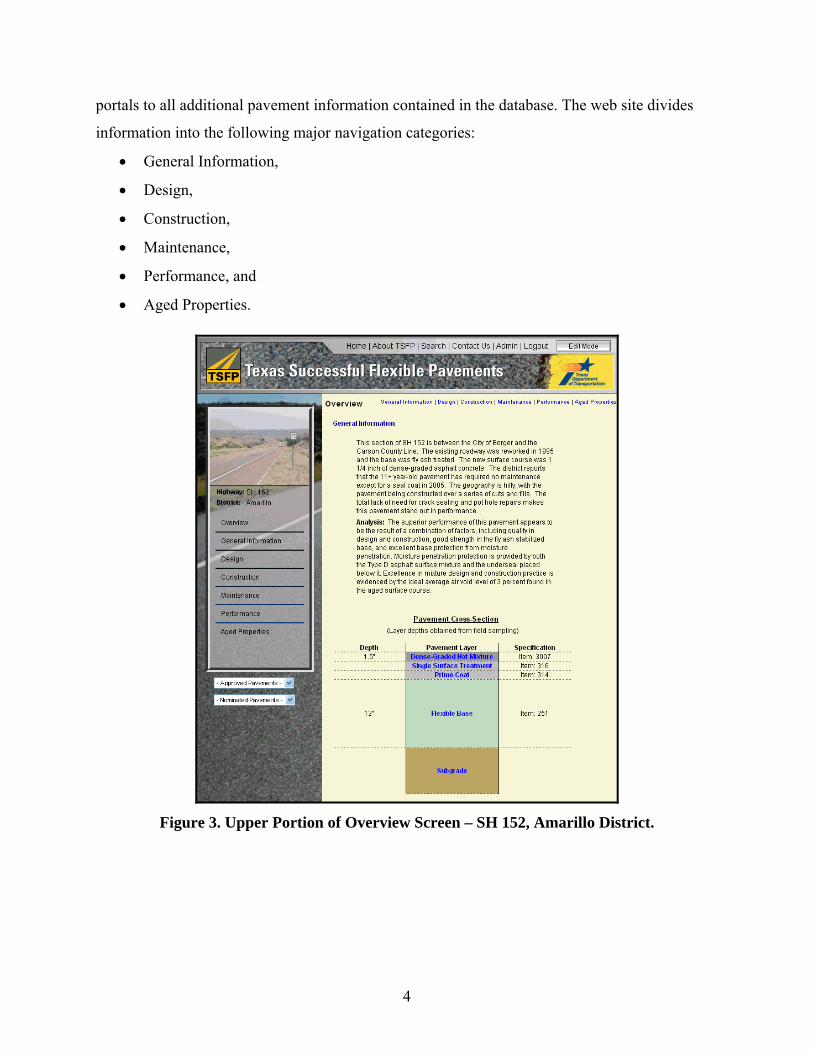
When accessing a pavement’s files in the database, the web site first provides the user an
overview of information about the pavement section. The overview includes a description of the
pavement and lists the factors believed to be instrumental in its particularly successful
performance. As shown in Figure 3, a pavement cross-section is also provided to show the type
of pavement structure and thicknesses of the various pavement layers. Below the cross-section
the overview screen continues and provides the user some of the more frequently desired
information items about the pavement. If the user desires to access more detailed information,
the navigation options shown under the photograph of the highway in the side bar box are the
4
portals to all additional pavement information contained in the database. The web site divides
information into the following major navigation categories:
• General Information,
• Design,
• Construction,
• Maintenance,
• Performance, and
• Aged Properties.
Figure 3. Upper Portion of Overview Screen – SH 152, Amarillo District.

5
CHAPTER 2: DEFINITION OF SUCCESSFUL FLEXIBLE PAVEMENT
PERFORMANCE
The scope of this project included defining successful flexible pavement
performance. Researchers used a multifaceted approach in developing this definition.
LITERATURE REVIEW
One of the first steps to developing a definition was performing a literature review
to obtain currently available information pertaining to successful flexible pavement
performance. The most relevant references to this project were identified, and Table 1
provides those items and a brief description of pertinent information. Definitive
information to assist in development of the definition of successful performance was
limited.
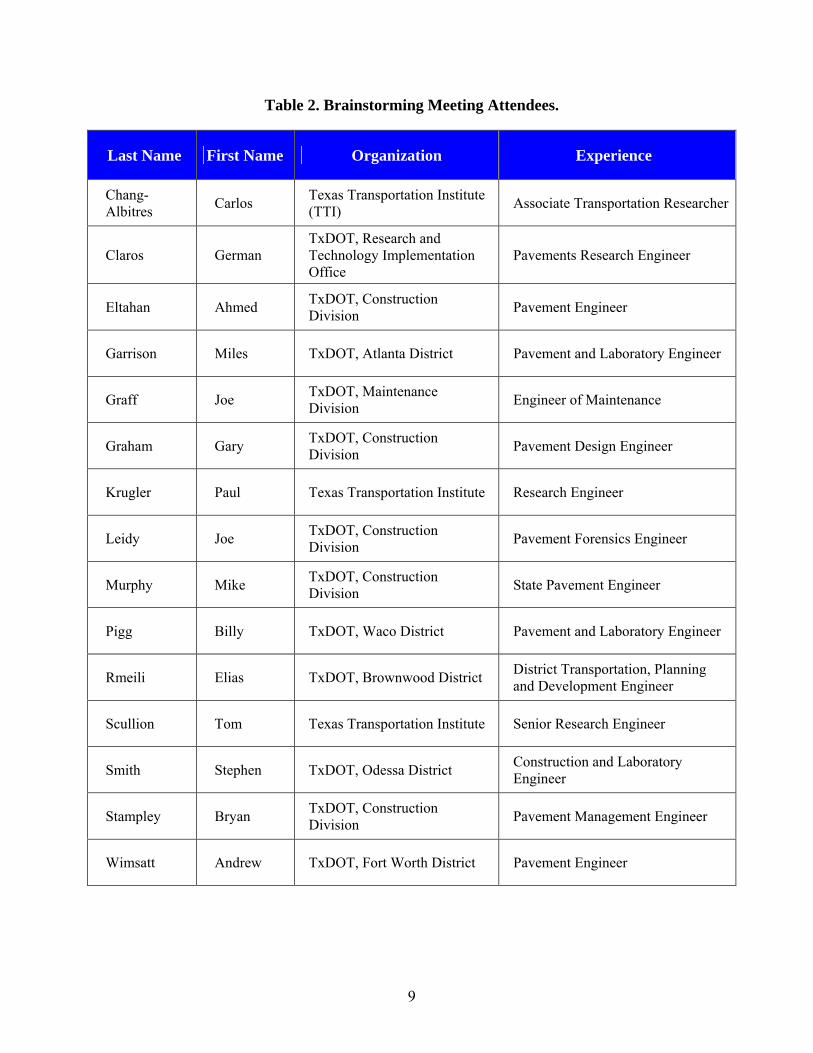
BRAINSTORMING MEETING WITH TXDOT PAVEMENT ENGINEERS
Shortly after completion of the literature review, a brainstorming meeting was
held to discuss definition concepts obtained from the literature and to gather additional
thoughts and opinions based on personal experiences in Texas. Table 2 shows those
attending the meeting and their areas of experience.
A list of potential factors to consider in the definition of successful flexible
pavement performance was developed, and these are categorized in Table 3. Each factor
was discussed, and the meeting culminated with the group reaching consensus that:
• a general definition for statewide application should be developed, as opposed to
separate definitions for regions of the state;
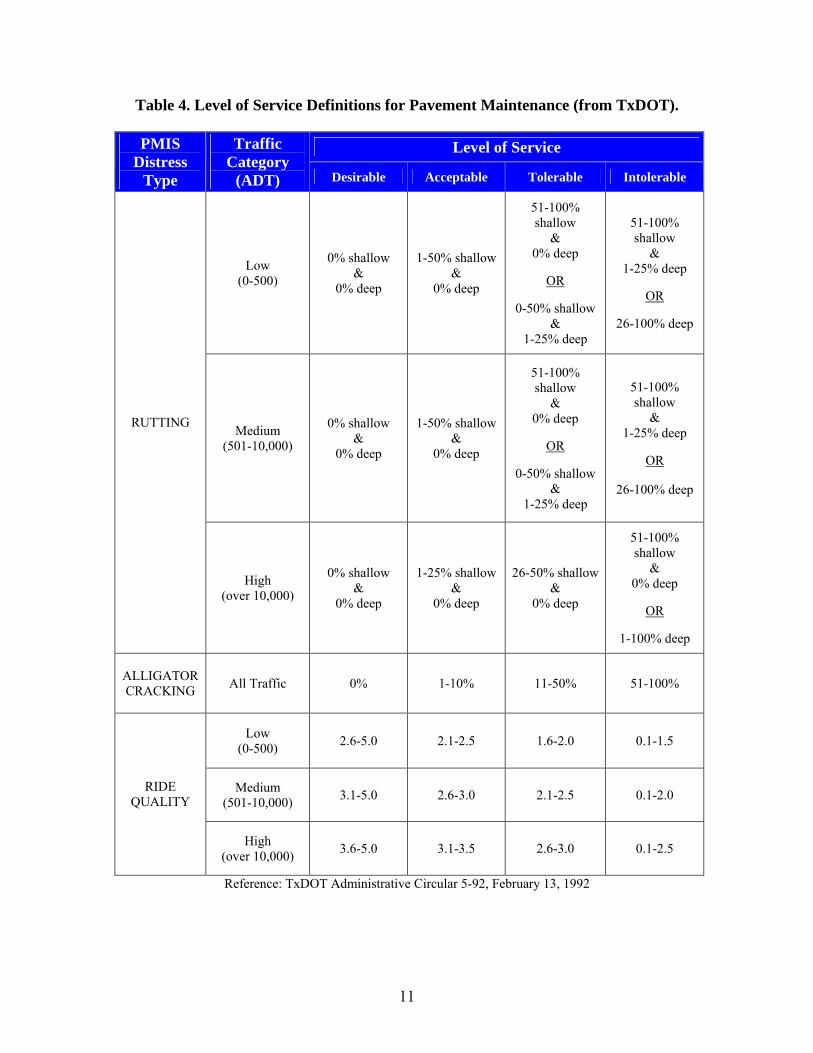
• the research team should consider the Maintenance Division’s level of service
definitions shown in Table 4 as a starting place for desired performance; and
• annual roadway maintenance costs were to be included in the definition to offset
improved visual distress scores resulting from preventative maintenance work.
The research team proceeded to develop the definition of successful flexible pavement
performance with these understandings.

Table 1. Top Reference Items for Pavement Performance.
Reference Item Title Author(s)
Publisher, Year Brief Summary
1 K. Chatti, N. Buch, S.W. Haider, A.S. Pulipaka, R.W. Lyles, D. Gilliland, P. Desaraju
This research focuses on the relative influence of design and construction features on the response and performance of new flexible and rigid pavements. The effects of hot-mix asphalt (HMA) layer thickness, base type, base thickness, and drainage on pavement performance were investigated.
LTTP Data Analysis: Influence of Design and Construction Features on the Response and Performance of New Flexible and Rigid Pavements NCHRP, 2005
Base type has the greatest influence on the fatigue performance of flexible pavements and roughness. Subgrade soil type and climate also have considerable effects on the influence of the design factors (longitudinal cracking, transverse cracking).
Kieran Sharp and Tim Martin ARRB Group, 2005
Austroroads Project AT 1067 has as an overall objective to establish whether there is a national trend for increased under-performance of pavements over the last 10 years, and the likely reasons for this underperformance.
2 Network Performance Profiles
Field inspections were conducted to evaluate the reasons for under-performance of pavements identified by a desk-top review as “underperforming.” The criterion was based on roughness and annual pavement maintenance cost. A deterioration rate matrix, based on roughness and rutting, was proposed for each functional class of roads and traffic level. Criteria for classifying a pavement section as good, fair, or poor was developed.
3 Guidance on the Development, Assessment and Maintenance of Long-Life Flexible Pavements
D. Merrill TRL, 2005
This research introduces the concept of robust pavements. Robust pavements are expected to deteriorate in a similar fashion to long-life pavements, provided that these pavements demonstrate similar characteristics to long-life pavements; these pavements can be thinner than long-life pavements. Guidelines to identify existing robust pavements and criteria are provided in the report. Visual distress, rutting, and structural condition are considered in these criteria.
6
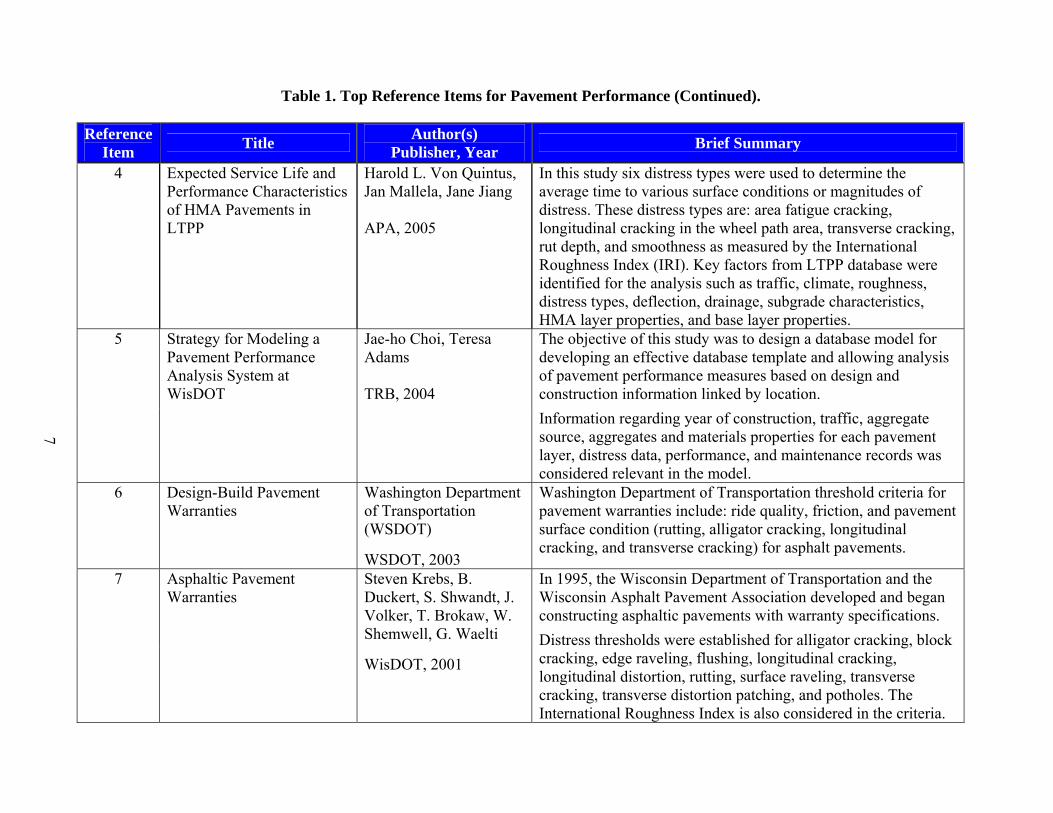
Table 1. Top Reference Items for Pavement Performance (Continued).
Reference Item Title Author(s)
Publisher, Year Brief Summary
4 Expected Service Life and Performance Characteristics of HMA Pavements in LTPP
Harold L. Von Quintus, Jan Mallela, Jane Jiang APA, 2005
In this study six distress types were used to determine the average time to various surface conditions or magnitudes of distress. These distress types are: area fatigue cracking, longitudinal cracking in the wheel path area, transverse cracking, rut depth, and smoothness as measured by the International Roughness Index (IRI). Key factors from LTPP database were identified for the analysis such as traffic, climate, roughness, distress types, deflection, drainage, subgrade characteristics, HMA layer properties, and base layer properties.
5 Strategy for Modeling a Pavement Performance Analysis System at WisDOT
Jae-ho Choi, Teresa Adams TRB, 2004
The objective of this study was to design a database model for developing an effective database template and allowing analysis of pavement performance measures based on design and construction information linked by location.
Information regarding year of construction, traffic, aggregate source, aggregates and materials properties for each pavement layer, distress data, performance, and maintenance records was considered relevant in the model.
6 Design-Build Pavement Warranties
Washington Department of Transportation (WSDOT) WSDOT, 2003
Washington Department of Transportation threshold criteria for pavement warranties include: ride quality, friction, and pavement surface condition (rutting, alligator cracking, longitudinal cracking, and transverse cracking) for asphalt pavements.
7 Asphaltic Pavement Warranties
Steven Krebs, B. Duckert, S. Shwandt, J. Volker, T. Brokaw, W. Shemwell, G. Waelti WisDOT, 2001
In 1995, the Wisconsin Department of Transportation and the Wisconsin Asphalt Pavement Association developed and began constructing asphaltic pavements with warranty specifications.
Distress thresholds were established for alligator cracking, block cracking, edge raveling, flushing, longitudinal cracking, longitudinal distortion, rutting, surface raveling, transverse cracking, transverse distortion patching, and potholes. The International Roughness Index is also considered in the criteria.
7

Table 1. Top Reference Items for Pavement Performance (Continued).
Reference Item Title Author(s)
Publisher, Year Brief Summary
8 Performance-Based Specifications as a Step to Performance-Based Management and Maintenance of Pavement in Japan
Takeshi Yoshida Public Works Research Institute, Japan, 2001
This paper proposes that successful road projects should be defined using performance indicators which should be selected in accordance with the goals and objectives of the project. Skid resistance, durability, evenness, and tire/road noise level are examples of performance indicators.
9 Performance Trends of Rehabilitated AC Pavements
Federal Highway Administration FHWA, 2000
This study documents performance trends of GPS-6 test sections using distress data collected through 1997. Six distress types or performance indicators were used to evaluate performance trends. They include fatigue cracking, longitudinal cracking not in the wheel path, transverse cracking, rutting, and roughness (IRI).
10 Common Characteristics of Good and Poorly Performing AC Pavements
J. B. Rauhut, A. Eltahan, and A.L. Simpson 1999
Data from the Long-Term Pavement Performance (LTPP) test sections were used to identify the site conditions and design/construction features of flexible pavements that lead to good performance and those that lead to poor performance. Four distress types were investigated: performance in roughness (IRI), rutting, transverse cracking, and fatigue cracking.
11 Engineering Application of Washington State’s Pavement Management System
Michael J. Baker, Joe P. Mahoney, and Nadarajah “Siva” Sivaneswaran TRB, 1998
The Washington State Department of Transportation (WSDOT) identified pavement sections that were outperforming or underperforming although constructed of similar materials and subjected to similar traffic and environmental considerations.
The WSDOT’s Pavement Management System was used to select candidate sections for further analysis. The five performance measures considered in the selection criteria included: age of the surface course, a distress-based pavement structural condition score, annual design-lane equivalent single axle loads, roughness (IRI), and rutting.
8
9
Table 2. Brainstorming Meeting Attendees.
Last Name First Name Organization Experience
Chang-Albitres Carlos Texas Transportation Institute
(TTI) Associate Transportation Researcher
Claros German TxDOT, Research and Technology Implementation Office
Pavements Research Engineer
Eltahan Ahmed TxDOT, Construction Division Pavement Engineer
Garrison Miles TxDOT, Atlanta District Pavement and Laboratory Engineer
Graff Joe TxDOT, Maintenance Division Engineer of Maintenance
Graham Gary TxDOT, Construction Division Pavement Design Engineer
Krugler Paul Texas Transportation Institute Research Engineer
Leidy Joe TxDOT, Construction Division Pavement Forensics Engineer
Murphy Mike TxDOT, Construction Division State Pavement Engineer
Pigg Billy TxDOT, Waco District Pavement and Laboratory Engineer
Rmeili Elias TxDOT, Brownwood District District Transportation, Planning and Development Engineer
Scullion Tom Texas Transportation Institute Senior Research Engineer
Smith Stephen TxDOT, Odessa District Construction and Laboratory Engineer
Stampley Bryan TxDOT, Construction Division Pavement Management Engineer
Wimsatt Andrew TxDOT, Fort Worth District Pavement Engineer

10
Table 3. Potential Factors for Definition of Successful Pavement Performance.
Category Factor
Visual Distress Rating
Structural Condition – Deflection Test Results
Should Not Have Structural Failures – No Patching or Base Repairs
Ride Score and Rate of Increase in Roughness
Pavement Condition
Rut Depth and Rate of Increase in Rut Depth
Annual Maintenance Costs Maintenance
Date of Last Seal Coat
Rainfall
Freeze or Non-Freeze Climate and Subgrade
Type of Subgrade – Fineness of the Soil
Pavement Type – Asphalt Concrete, Overlay of Concrete Pavement, Surface Treatment Pavement
Roadside Drainage
Lane Width
Asphalt Concrete Thickness
Design Equivalent Single Axle Loads (ESALs)
Pavement Design
Percent Trucks
Pavement Age Pavement Longevity
Cumulative ESALs
Type of Base Materials
Type of Asphalt Additive – Latex, Crumb-Rubber, Others
Construction Construction Variability
11
Table 4. Level of Service Definitions for Pavement Maintenance (from TxDOT).
Reference: TxDOT Administrative Circular 5-92, February 13, 1992
Level of Service PMIS Distress
Type
Traffic Category
(ADT) Desirable Acceptable Tolerable Intolerable
Low (0-500)
0% shallow &
0% deep
1-50% shallow &
0% deep
51-100% shallow
& 0% deep
OR
0-50% shallow
& 1-25% deep
51-100% shallow
& 1-25% deep
OR
26-100% deep
Medium (501-10,000)
0% shallow &
0% deep
1-50% shallow &
0% deep
51-100% shallow
& 0% deep
OR
0-50% shallow
& 1-25% deep
51-100% shallow
& 1-25% deep
OR
26-100% deep
RUTTING
High (over 10,000)
0% shallow &
0% deep
1-25% shallow &
0% deep
26-50% shallow &
0% deep
51-100% shallow
& 0% deep
OR
1-100% deep
ALLIGATOR CRACKING All Traffic 0% 1-10% 11-50% 51-100%
Low (0-500) 2.6-5.0 2.1-2.5 1.6-2.0 0.1-1.5
Medium (501-10,000) 3.1-5.0 2.6-3.0 2.1-2.5 0.1-2.0 RIDE
QUALITY
High (over 10,000) 3.6-5.0 3.1-3.5 2.6-3.0 0.1-2.5
12
EVALUATION OF DATA FROM TXDOT’S PAVEMENT MANAGEMENT INFORMATION SYSTEM (PMIS)
With information from the literature search and brainstorming meeting as a
backdrop, the research team reviewed 2006 PMIS records for all of the nominated
pavements. Appendix A includes the tabulation of this initial query results. A rather wide
range in the performance criteria was observed despite the fact that each of these
pavements had been nominated as a particularly successful pavement. This wide range in
performance criteria evidenced the difficulty in establishing a single set of criteria that
reasonably identifies successful performance under the myriad of climatic, geographic,
traffic, and local material factors involved across the state. The insight gained from the
2006 PMIS records led to the creation of a definition that requires compliance with a
number of the selected performance criteria, but not all of them, for a pavement’s
performance to be considered successful. Also, engineering judgment is recognized in the
definition as an important element in pavement performance evaluations.
SELECTION AND DISCUSSION OF DEFINITION CRITERIA
As a result of the foregoing efforts, a series of criteria arose as primary candidates
for use in the definition of successful flexible pavement performance. These criteria
included:
• age of the pavement section,
• drainage conditions,
• design service life,
• environmental factors (geographic location),
• maintenance history and treatment costs,
• material properties,
• pavement distresses,
• safety,
• serviceability (ride quality),
• structural adequacy of the pavement structure,
• subgrade, and
• traffic level (ADTs, ESALS).
13
As this list of potential criteria was further considered, the research team observed
that many of these factors are interrelated. Therefore, it was concluded that not all of
them needed to be explicitly included in the minimum criteria defining successful
performance. For example, a section without distresses over its service life will more than
likely be structurally adequate for the level of traffic and environmental factors acting
upon the pavement structure. On the other hand, it is unlikely that a section with poor
drainage conditions will have served without manifesting significant distresses over time.
An important factor that does need to be included is the level of maintenance
expenditures which have been required to adequately maintain the pavement performance
being obtained. These discussions and preliminary analysis lead to focusing on only key
performance criteria that, together, capture virtually all the factors affecting pavement
performance, either directly or indirectly.
Another important consideration in selecting criteria was the ease with which
TxDOT might be able to apply them. Not all data and information may be readily
available even though they are potentially very valuable in defining successful
performance.
From this perspective, the research team determined that the criteria should bear
upon measurable and objective parameters for identifying successful pavement
performance. Analyzing the factors mentioned as potential parameters, the research team
concluded that the following factors should bear upon the determination of successful
flexible pavement performance:
• Age of the Pavement,
• Cumulative Design Loading,
• Pavement Condition Score,
• Pavement Distress Score,
• Pavement Ride Score,
• Traffic Level, and
• Maintenance Expenditures (pavement-related). All of these factors are readily available to TxDOT personnel in PMIS records.

14
In order to characterize each of these factors, and to establish the criteria for
identifying successful flexible pavement sections in Texas, the research team found that
the rating methods used in TxDOT’s PMIS offer the best and the most practical solutions.
Age of the Pavement: The age of the pavement section is an obvious factor to
include in the criteria. While age is only an indirect indicator of the amount of traffic that
has been carried, it’s a direct indicator of the length of time that the pavement has been
exposed to environmental conditions. On less traveled rural roadways, age can become at
least as definitive an indicator of superior performance as cumulative traffic loading.
Another age-related aspect is that determination of “successful” pavement performance is
time-dependent. A pavement section may meet “successful” criteria in its early stage of
life but later on rapidly deteriorate and no longer be described as successful. The age
categories included in the definition of successful performance are 0-7 years, 8-14 years,
and above 14 years.
Cumulative Design Loading: The degree to which a pavement withstands traffic
loading in comparison to its design loading is a most important indicator of successful
performance. The definition criteria, therefore, must be flexible enough to correctly
evaluate a pavement which has already exceeded its service life, regardless of pavement
age. A pavement in reasonable condition after surpassing design traffic loadings should
be considered successful.
Pavement Condition Score: The condition score provides a single descriptor of
the overall pavement condition. This parameter combines ride quality and pavement
distress characteristics of the pavement. Table 5 shows condition score classes used by
TxDOT.
Table 5. Condition Score Classes (from TxDOT).
Condition Score Class Description 90 – 100 A Very Good 70 – 89 B Good 50 – 69 C Fair 35 – 49 D Poor 1 – 34 F Very Poor
Reference: Condition of Texas Pavements PMIS Annual Report, FY 2001-2004 (May 2004)
It is expected for a successful pavement to be in either very good or good
condition, depending upon its stage of service life. A different minimum value for the
15
condition score is established in the criteria for each of the pavement age categories. The
criteria for successful performance also include the requirement for relatively low
variability of condition scores within a successful pavement section. The maximum
amount of variability allowed increases with increasing pavement age. Uniformity in
performance is desirable and believed to be a strong indicator of quality in construction.
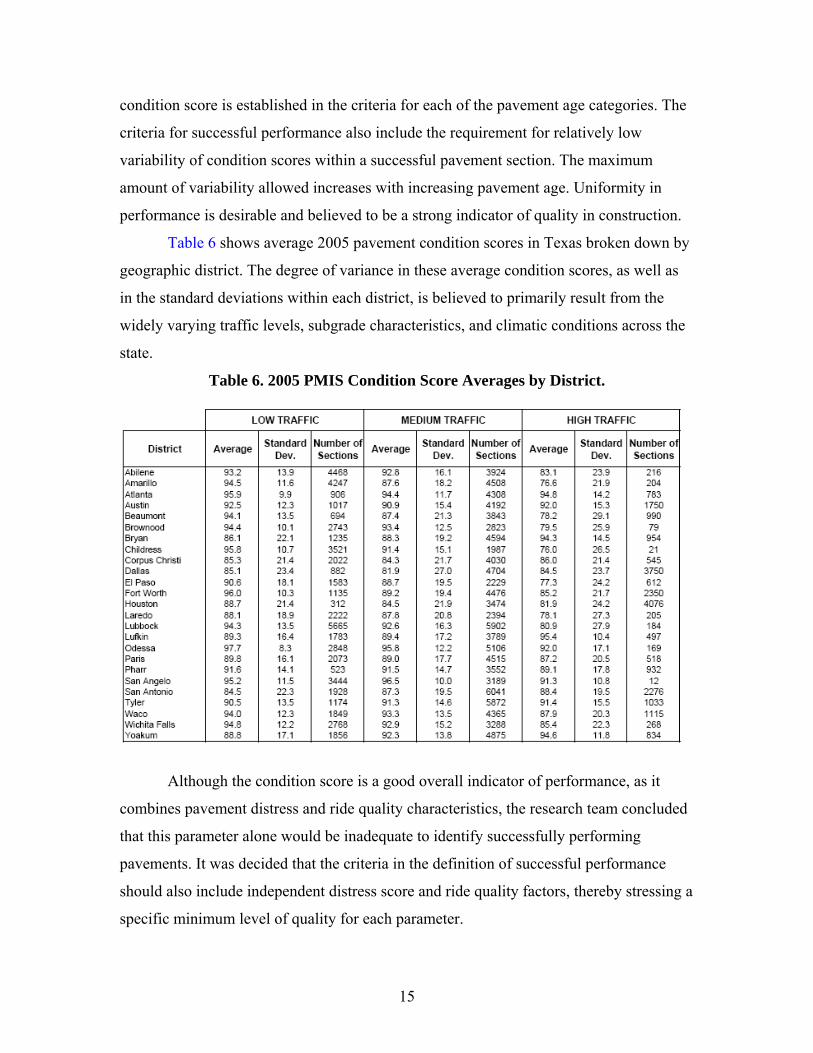
Table 6 shows average 2005 pavement condition scores in Texas broken down by
geographic district. The degree of variance in these average condition scores, as well as
in the standard deviations within each district, is believed to primarily result from the
widely varying traffic levels, subgrade characteristics, and climatic conditions across the
state.
Table 6. 2005 PMIS Condition Score Averages by District.
Although the condition score is a good overall indicator of performance, as it
combines pavement distress and ride quality characteristics, the research team concluded
that this parameter alone would be inadequate to identify successfully performing
pavements. It was decided that the criteria in the definition of successful performance
should also include independent distress score and ride quality factors, thereby stressing a
specific minimum level of quality for each parameter.

16
Pavement Distress Score: The distress score reflects the degree of visible surface
deterioration observed by pavement raters on an annual basis. Table 7 shows distress
score classes defined by TxDOT.
Table 7. Distress Score Classes (from TxDOT).
Distress Score Class Description 90 – 100 A Very Good 70 – 89 B Good 50 – 69 C Fair 35 – 49 D Poor 1 – 34 F Very Poor
Reference: Condition of Texas Pavements PMIS Annual Report, FY 2001-2004 (May 2004) Like the condition score, it is expected that a successful pavement be in either
very good or good condition from a distress rating standpoint, depending on the current
age and stage of its service life. Relatively low variability is also a requirement. Table 8
shows the average 2005 pavement distress scores in Texas by geographic district.
Table 8. 2005 PMIS Distress Score Averages by District.
Pavement Ride Score: The ride score expresses the ride quality on a scale from
0.1 (roughest) to 5.0 (smoothest). Table 9 shows descriptive ride score classes used by
TxDOT.

17
Table 9. Ride Score Classes (from TxDOT).
Distress Score Class Description 4.0 – 5.0 A Very Good 3.0 – 3.9 B Good 2.0 – 2.9 C Fair 1.0 – 1.9 D Poor 0.1 - 0.9 F Very Poor
Reference: Condition of Texas Pavements PMIS Annual Report, FY 2001-2004 (May 2004)
As with other rating criteria, it is expected that a successful pavement be in either
very good or good condition for ride quality, depending on the current age and stage of
its service life. Relatively low variability is again a requirement.
Table 10 shows the average 2005 pavement ride scores in Texas by geographic
district. While the degree of variability is high, as with other pavement rating score types,
the average rating for ride quality dips into the fair category in a number of areas.
Table 10. 2005 PMIS Ride Score Averages by District.
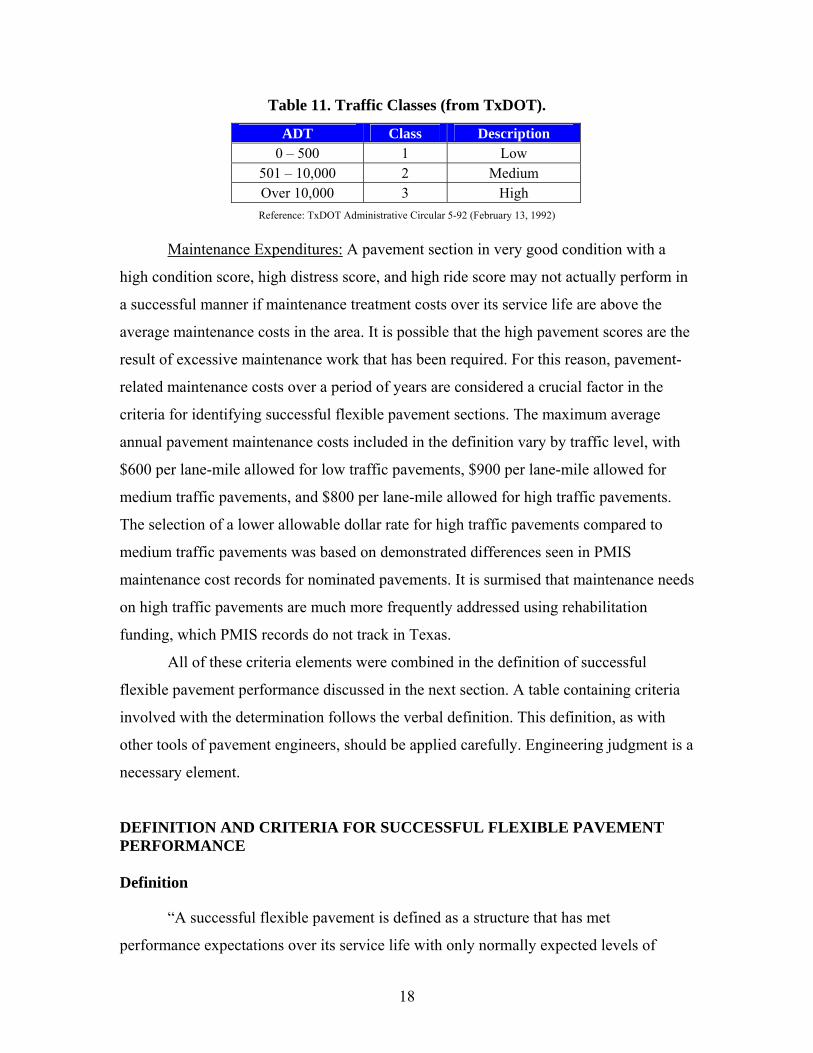
Traffic Level: The traffic level is currently expressed in terms of average daily
traffic for establishing traffic categories within the definition of successful performance.
Table 11 shows the traffic categories included in the definition.
18
Table 11. Traffic Classes (from TxDOT).
ADT Class Description 0 – 500 1 Low
501 – 10,000 2 Medium Over 10,000 3 High
Reference: TxDOT Administrative Circular 5-92 (February 13, 1992)
Maintenance Expenditures: A pavement section in very good condition with a
high condition score, high distress score, and high ride score may not actually perform in
a successful manner if maintenance treatment costs over its service life are above the
average maintenance costs in the area. It is possible that the high pavement scores are the
result of excessive maintenance work that has been required. For this reason, pavement-
related maintenance costs over a period of years are considered a crucial factor in the
criteria for identifying successful flexible pavement sections. The maximum average
annual pavement maintenance costs included in the definition vary by traffic level, with
$600 per lane-mile allowed for low traffic pavements, $900 per lane-mile allowed for
medium traffic pavements, and $800 per lane-mile allowed for high traffic pavements.
The selection of a lower allowable dollar rate for high traffic pavements compared to
medium traffic pavements was based on demonstrated differences seen in PMIS
maintenance cost records for nominated pavements. It is surmised that maintenance needs
on high traffic pavements are much more frequently addressed using rehabilitation
funding, which PMIS records do not track in Texas.
All of these criteria elements were combined in the definition of successful
flexible pavement performance discussed in the next section. A table containing criteria
involved with the determination follows the verbal definition. This definition, as with
other tools of pavement engineers, should be applied carefully. Engineering judgment is a
necessary element.
DEFINITION AND CRITERIA FOR SUCCESSFUL FLEXIBLE PAVEMENT PERFORMANCE
Definition
“A successful flexible pavement is defined as a structure that has met
performance expectations over its service life with only normally expected levels of
19
maintenance for its age, materials utilized, traffic loads, and local conditions.” Table 12
contains the recommended set of criteria for condition scores, distress scores, ride scores,
and annual maintenance expenditures to assist the experienced pavement engineer in
categorizing a pavement or experimental project as successful.
Individual Criteria
There are seven criteria recommended to assist in identifying a successful
pavement section, as follows:
• annual maintenance expenditure average, • minimum condition score average, • standard deviation of condition scores, • minimum distress score average, • standard deviation of distress scores, • minimum ride score average, and • standard deviation of ride scores.
To be identified as a successful pavement, it is recommended that the pavement
section be at least six years old and meet the maintenance expenditure criteria plus at
least four of the other individual criteria listed above and in Table 12. If the section does
not meet these requirements, but extenuating circumstances exist, engineering judgment
should be used in determining if performance is considered successful.
Criteria Table Instructions
To determine if a pavement section meets the definition for successful
performance, first calculate average values and standard deviations for the most recent
condition, distress, and ride scores available for the pavement section being considered.
Condition, distress, and ride scores are available from TxDOT’s PMIS database.
Determine the average annual pavement maintenance expenditure for the pavement
section being considered by averaging expenditure information for each of the segments
of the pavement section. Make this determination for each of the last three years and
calculate the three-year average maintenance expenditure for the pavement section.
Annual pavement maintenance expenditure information is available in TxDOT’s
Maintenance Management Information System (MMIS) as well as from PMIS. Compare
all determined values to the criteria shown in Table 12.
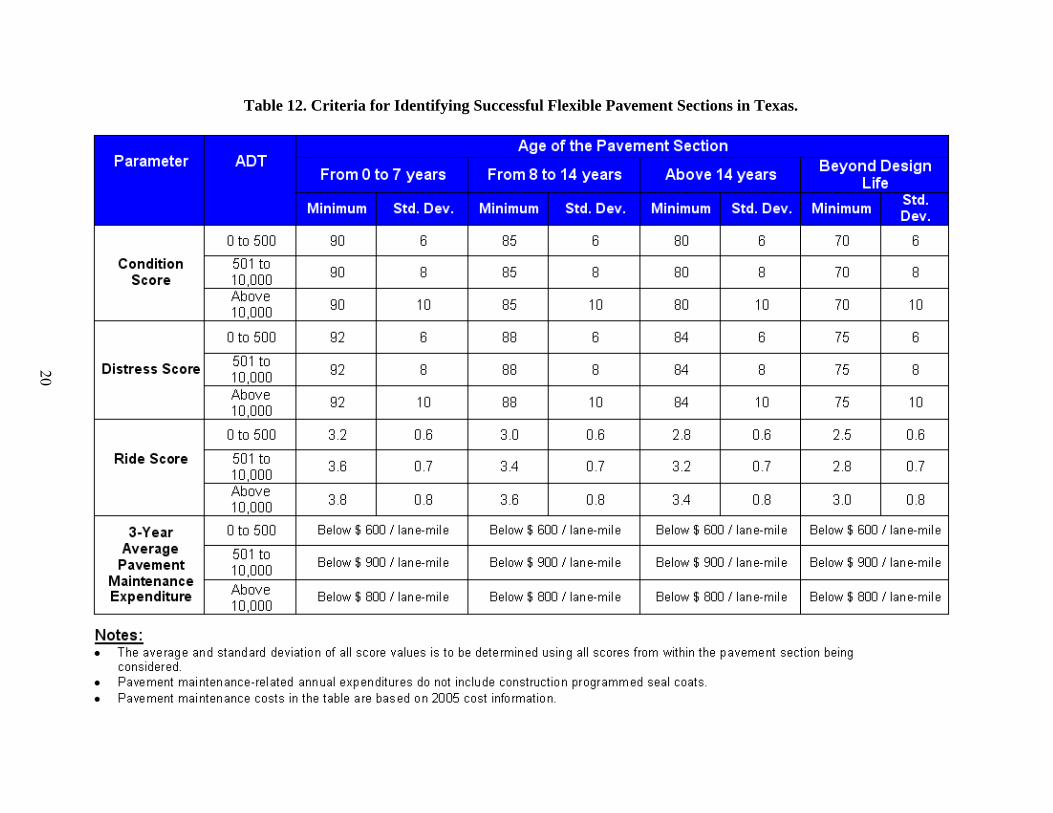
Table 12. Criteria for Identifying Successful Flexible Pavement Sections in Texas.
20
21
CHAPTER 3: SUCCESSFUL FLEXIBLE PAVEMENT NOMINATION AND SELECTION
NOMINATION PROCESS
Identification of particularly successful flexible pavements began by allowing the 25
geographically located districts to nominate sections of pavement which in their opinions
warranted evaluation for including them in the database being created. Appendix B includes the
nomination solicitation letter and form. Guidance provided in the solicitation was broad and
general, as the definition of successful flexible pavement performance discussed in Chapter 2 had
not yet been developed. The following three definitions were included in the letter to the districts.
“Successful – We are seeking excellently performing new pavements or excellent
overlays. The new / reconstructed pavement or the rehabilitated pavement must be
in its first performance period. Pavement performance, primarily serviceability,
should be well above expectations considering the pavement design, traffic and
percentage of trucks, materials utilized, and the local environment.”
“Flexible Pavement. – A pavement with either surface treatment over base, thin or
thick hot mix surfacing, or it may be a composite pavement with a minimum of
2 inches of asphalt mixture over concrete.”
“Section – A length of pavement having constant structure and mixture design and
that has a minimum length of one mile.”
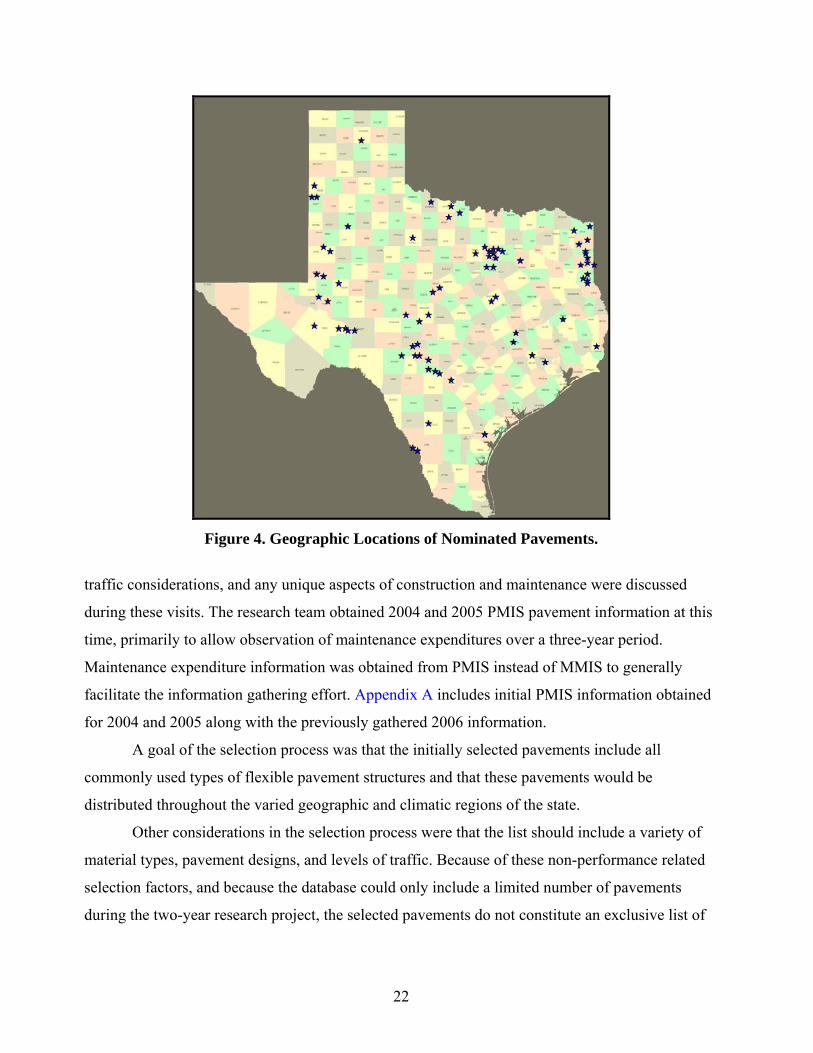
A total of 75 nominations were received from 17 districts. Figure 4 shows locations of
nominated pavements. A listing of all nominated pavements and basic descriptive information is
included in Appendix C.
SELECTION PROCESS
The selection of the initial 25 pavements to populate the database was based on a number
of factors. After receiving all nominations, members of the research team visited each pavement
section site, normally accompanied by the nominator. Pavement conditions were visually noted,
photographed, and additional information was obtained. Unique subgrade conditions, unusual
22
Figure 4. Geographic Locations of Nominated Pavements.
traffic considerations, and any unique aspects of construction and maintenance were discussed
during these visits. The research team obtained 2004 and 2005 PMIS pavement information at this
time, primarily to allow observation of maintenance expenditures over a three-year period.
Maintenance expenditure information was obtained from PMIS instead of MMIS to generally
facilitate the information gathering effort. Appendix A includes initial PMIS information obtained
for 2004 and 2005 along with the previously gathered 2006 information.
A goal of the selection process was that the initially selected pavements include all
commonly used types of flexible pavement structures and that these pavements would be
distributed throughout the varied geographic and climatic regions of the state.
Other considerations in the selection process were that the list should include a variety of
material types, pavement designs, and levels of traffic. Because of these non-performance related
selection factors, and because the database could only include a limited number of pavements
during the two-year research project, the selected pavements do not constitute an exclusive list of

23
the best performing Texas flexible pavements. A number of the other nominated pavements
provide equally impressive performances.
A proposed list of 25 pavement sites was presented to the research project monitoring
committee during the first project milestone meeting, held in June of 2006. Twenty-four pavement
sites were approved at the milestone meeting. It was further decided at the meeting that it would be
desirable to include two additional pavements, both carrying high traffic levels, and that these
pavements should be located in the gulf coast and central Texas areas of the state. After a
comprehensive search, one more pavement section was added to the initially approved list of
pavements. Figure 5 shows the geographic distribution of the final group of 25 selected flexible
pavement sections, and Table 13 provides their descriptive information.
Figure 5. Geographic Locations of Selected Pavements.
Table 14 breaks down the distributions of pavement structure categories and traffic levels
among the selected pavements. Approximately two-thirds of the 25 pavements are in the medium
traffic category, one was selected from the low traffic category, and the rest were in the high traffic
category. The types of pavement structures represented are well distributed except that several
additional thin asphalt concrete pavements would have been desirable.

24
Table 13. Initial Successful Flexible Pavements in the Database.
TxDOT District
Highway Designation
Pavement Structure Type
Pavement Age, Years
2006 Average
Daily Traffic
2006 Percent Trucks in ADT
Abilene US 380 Surface Treatment(s) over Flexible Base 40 1,693 13
Amarillo SH 152 Thin Asphalt Concrete 11 1,250 9
Atlanta IH 20 (WB lanes only)
Composite (Asphalt Surfaced Concrete) 10 15,017 39
Atlanta IH 30 Composite (Asphalt Surfaced Concrete) 10 21,289 28
Atlanta US 59 Thick Asphalt Concrete 17 5,940 23
Brownwood US 67 Thick Asphalt Concrete 26 7,140 18
Brownwood US 190 Surface Treatment(s) over Flexible Base 29 1,450 20
Bryan SH 21 (EB lanes only) Medium Asphalt Concrete 14 5,206 15
Fort Worth BIH 35 Composite (Asphalt Surfaced Concrete) 14 4,800 5
Fort Worth SH 183 Composite (Asphalt Surfaced Concrete) 21 14,660 10
Fort Worth SH 121 Composite (Asphalt Surfaced Concrete) 21 73,845 7
Fort Worth SH 171 Medium Asphalt Concrete 14 6,738 14
Houston SH 6 Thick Asphalt Concrete 11 8,576 17
Laredo FM 1472 Thick Asphalt Concrete 5 20,167 17
Lubbock FM 1585 Surface Treatment(s) over Flexible Base 20 2,442 6
Lufkin US 287 Thick Asphalt Concrete 37 1,850 35
Odessa IH 10 Surface Treatment(s) over Flexible Base 28 2,155 55
Odessa US 385 Medium Asphalt Concrete 8 2,110 16
Odessa SH 176 Medium Asphalt Concrete 9 2,250 32
San Angelo IH 10 Medium Asphalt Concrete 37 3,963 29
San Angelo US 377 Surface Treatment(s) over Flexible Base 57 324 32
San Antonio FM 2771 Surface Treatment(s) over Flexible Base 42 865 16
San Antonio RM 2828 Surface Treatment(s) over Flexible Base 37 896 29
Waco FM 3223 Medium Asphalt Concrete 14 14,820 6
Wichita Falls FM 3492 Surface Treatment(s) over Flexible Base 10 1,015 11

25
Table 14. Numbers of Pavements in Structural Categories and Traffic Levels.
Table 15 provides a breakdown of pavement types by district geographic area. Rarely was
more than a single pavement of a given structural type selected from one district. However,
selecting more than one project in a district was unavoidable in several cases to adequately
represent certain pavement types, particularly the ACP overlay of concrete pavement category.
PMIS Data and Information Summaries for Selected Pavements
To facilitate review, researchers summarized PMIS data for years 2004, 2005, and 2006 for
the 25 selected pavements. Appendix D displays condition, ride, and distress pavement
performance scores for these three years. Appendix E summarizes roadway maintenance
expenditure information for these three years. Some of the pavements are noted to fail to meet the
criteria established in the definition of successful performance. However, most are considered
excellent representatives of successfully performing flexible pavement in Texas.
Traffic Level
Thick Asphalt
Concrete Pavement
(ACP)
Medium Asphalt
Concrete Pavement
(ACP)
Thin Asphalt
Concrete Pavement
(ACP)
ACP over Concrete Pavement
Surface Treatments
over Flexible
Base
Total
High >10,000 ADT 1 1 0 4 0 6
Medium 501 – 10,000
ADT 4 5 1 1 7 18
Low < 500 ADT 0 0 0 0 1 1
Totals 5 6 1 5 8 25

26
Table 15. TxDOT Geographic Districts Represented.
Thin ACP TxDOT District
Thick Asphalt
Concrete Pavement
(ACP)
over Flexible
Base
over Cementitious
Base
ACP over Concrete Pavement
Surface Treatments
over Flexible
Base
Total
Abilene - - - - 1 1
Amarillo - - 1 - - 1
Atlanta 1 - - 2 - 3
Brownwood 1 - - - 1 2
Bryan - 1 - - - 1
Fort Worth - 1 - 3 - 4
Houston 1 - - - - 1
Laredo 1 - - - - 1
Lubbock - - - - 1 1
Lufkin 1 - - - - 1
Odessa 1 1 - - 1 3
San Angelo - 1 - - 1 2
San Antonio - - - - 2 2
Waco - 1 - - - 1
Wichita Falls - - - - 1 1
Totals 6 5 1 5 8 25

27
CHAPTER 4: WEB SITE AND DATABASE DEVELOPMENT
SOFTWARE AND TECHNICAL SPECIFICATIONS Conceptual Data Modeling
Figure 6 shows a high-level conceptual data model diagram providing a general overview
of the major components of the database architecture. Data components are organized into three
levels. The first level provides general information about the pavement section, including section
inventory information and maintenance data. The second level gives information about pavement
performance and aged pavement properties. The third level contains administrative information for
managing and accessing the database.
The data model diagram shown in Figure 6 was the basis for developing more-detailed data
models included herein. Both conceptual and physical data models were created early in the
development process. These data models comply with the requirements of Section 3 of the TxDOT
document Data Architecture Version 3.0 (12).
Database architectures of existing pavement-related databases were reviewed as references
in the early stages of the data modeling process. Several of the databases that were reviewed
included the Pavement Management Information System, Maintenance Management Information
System, and the Long-Term Pavement Performance Database. The architecture for the Texas
Successful Flexible Pavements database was developed based on this review. Comments and
recommendations received at several meetings with TxDOT personnel from the Information
Systems Division (ISD) and the Construction Division (CST) were considered in defining which
data fields to include.
Figure 7 shows the conceptual data model, which is a business-oriented model also at a
high level of understanding. Appendix F includes a glossary for the conceptual data model. The
physical data model is described in much more detail in the Entity-Relationship Diagram, included
in Appendix A CD-ROM due to its size. The diagram of the physical data model shows the
specific requirements of the database management system. The data dictionary for the physical
model is also included in the Appendix A CD-ROM.

Figure 6. High-Level Conceptual Data Model Diagram for the Texas Successful Flexible Pavements Database.
28

Figure 7. Conceptual Data Model for the Texas Successful Flexible Pavements Database.
29

30
As in other areas of development, the diagrams and data dictionary comply with the
requirements described in section 4 and section 5 of Chapter 2 of “Data Architecture Version 3.0”
provided to the research team by TxDOT’s Information Systems Division. The naming convention
follows the guidelines presented in Chapter 3 of the same document.
Programming Technical Information and Database Compatibility
Technical information about the Texas Transportation Institute server, web development
software, and the database modeling tool are listed below. In addition, because of TxDOT’s stated
desire for the Texas Successful Flexible Pavements database to be able to exchange information
with the database being developed under project 0-5513, “Development of a Flexible Pavements
Database,” a protocol to exchange information with external databases was also developed. This
protocol, along with the entity-relationship (E-R) diagram and data dictionary for the Texas
Successful Flexible Pavements database, was provided to researchers developing the Flexible
Pavements Database early in their development process.
General Server Technical Information:
Windows 2003 server with .NET framework 2.0 on ISS 6.
Windows 2003 server to host the Oracle 10g database.
Web Development Software:
ASP.NET
Database abstraction layer.
Database Modeling Tool (E-R Diagram and Data Dictionary):
Oracle Designer 10g.
Protocol to Exchange Information:
XML Web services (proposed).
XML file (if web service is not preferred).
The definition of XML (from google.com) is XML is a W3C initiative that allows
information and services to be encoded with meaningful structure and semantics that computer
31
and humans can understand. XML is great for information exchange, and can easily be extended to
include user-specified and industry-specified tags.
Frequency to Exchange Information:
Every month is the suggested frequency, if XML file type is preferred.
An example of XML from the Texas Successful Flexible Pavements database is shown
below.
<?xml version=”1.0”?>
<tx_inv_sections>
<tx_inv_section id=123>
<district>Bryan</district>
<county>Brazos</county>
<highway_system>FM2818</highway_system>
<pavement_type>flexible</pavement_type>
…
</tx_inv_section>
</tx_inv_sections>
WEB SITE ACCESS
The web site is designed to allow guest access and includes three registered user access
levels. The system security was designed to allow TxDOT maximum flexibility in implementation
and future web site use.
Guest Access
Guests visiting the web site have access to all stored pavement information and data.
Guests may also export data from the database. Guest access is provided to allow anyone with
Internet access to benefit from the information gathered by TxDOT about their more successfully
performing flexible pavements.

32
Read Access The Read access level allows users access to all data, as is available to guests, but users
with Read access may also nominate pavements for inclusion in the database. Once a pavement is
nominated, the nominated pavement information is available for viewing by all guests and
registered users of the web site. The home page map of Texas displays a red star based on the
latitude and longitude supplied by the nominator. Once a user submits a nomination, the web site
provides the user with a My Pavement Nominations table located on their personal nomination
screen that lists all of that user’s nominations, and which also allows the nominator to delete the
nomination and remove it from display on the web site.
Read, Write, and Approve Access
Registered users with this access level have the capabilities available to users with Read
access, but they may also edit data stored in the database for any pavement. In addition, they may
change the status of nominated pavements to approved status and they may remove pavements
from either the nominated or approved status and place them into a disabled status, thereby
removing the information from display on the web site.
Administrator Access
Users with the Administrator access have all of the foregoing capabilities, and also have
the capability to register new users in any of the registered user categories. Administrators are
provided a User Accounts table displaying all currently registered user’s names, email addresses,
organizations, and security access levels. Figure 8 shows an example User Accounts table.
Figure 8. Screen Shot of User Accounts Section of the Administrator Screen.

33
ORGANIZATION AND RETRIEVAL OF DATABASE INFORMATION
The web site screen designs, the selection of major navigation informational areas, and the
organization of data on display screens were developed in efforts to provide TxDOT users a
logical and familiar experience beginning the first time they access the web site.
Database Navigation
Figure 9 shows the major navigation options under the pavement location photograph. The
figure also shows mouse-over pop-up minor navigation options under General Information. Table
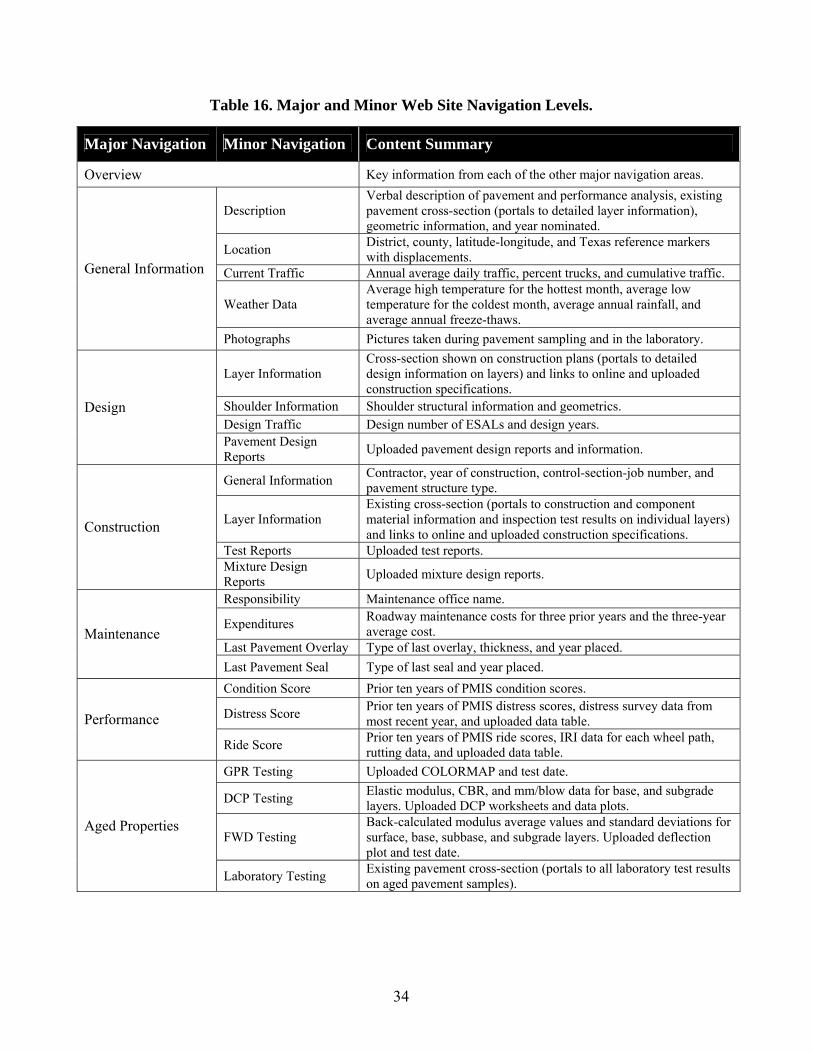
16 details all major and minor navigation levels for the web site interface to the database. The table
also provides a general description of the contents of each minor navigation level.
Figure 9. Demonstration of Minor Navigation Availability.
34
Table 16. Major and Minor Web Site Navigation Levels.
Major Navigation Minor Navigation Content Summary
Overview Key information from each of the other major navigation areas.
Description Verbal description of pavement and performance analysis, existing pavement cross-section (portals to detailed layer information), geometric information, and year nominated.
Location District, county, latitude-longitude, and Texas reference markers with displacements.
Current Traffic Annual average daily traffic, percent trucks, and cumulative traffic.
Weather Data Average high temperature for the hottest month, average low temperature for the coldest month, average annual rainfall, and average annual freeze-thaws.
General Information
Photographs Pictures taken during pavement sampling and in the laboratory.
Layer Information Cross-section shown on construction plans (portals to detailed design information on layers) and links to online and uploaded construction specifications.
Shoulder Information Shoulder structural information and geometrics. Design Traffic Design number of ESALs and design years.
Design
Pavement Design Reports Uploaded pavement design reports and information.
General Information Contractor, year of construction, control-section-job number, and pavement structure type.
Layer Information Existing cross-section (portals to construction and component material information and inspection test results on individual layers) and links to online and uploaded construction specifications.
Test Reports Uploaded test reports.
Construction
Mixture Design Reports Uploaded mixture design reports.
Responsibility Maintenance office name.
Expenditures Roadway maintenance costs for three prior years and the three-year average cost.
Last Pavement Overlay Type of last overlay, thickness, and year placed. Maintenance
Last Pavement Seal Type of last seal and year placed. Condition Score Prior ten years of PMIS condition scores.
Distress Score Prior ten years of PMIS distress scores, distress survey data from most recent year, and uploaded data table. Performance
Ride Score Prior ten years of PMIS ride scores, IRI data for each wheel path, rutting data, and uploaded data table.
GPR Testing Uploaded COLORMAP and test date.
DCP Testing Elastic modulus, CBR, and mm/blow data for base, and subgrade layers. Uploaded DCP worksheets and data plots.
FWD Testing Back-calculated modulus average values and standard deviations for surface, base, subbase, and subgrade layers. Uploaded deflection plot and test date.
Aged Properties
Laboratory Testing Existing pavement cross-section (portals to all laboratory test results on aged pavement samples).

35
The web site features pavement cross-sections that serve as hyperlink portals to detailed
information about the individual pavement layers. Clicking on any pavement layer in a cross-
section view displays the additional information available for that layer.
Information may be entered into the database or may be revised at a later date by registered
users utilizing the edit mode of the web site. The Edit Mode button may be seen in Figure 9 in the
upper right-hand corner of the screen banner. Figure 10 shows an example screen of the web site in
edit mode, with information entered in some of the fields. Figure 11 displays the entered
information as it appears to users in the normal view. Note that unused data entry fields are not
displayed in the normal view. The “display empty fields” option may be modified on an individual
field basis by users having the Administrator access role.
In addition to specific data entry fields for selected information, the web site offers a
number of locations for the user to upload files, graphs, tables, and photographs. In this manner,
almost any information TxDOT should require or desire in the future may be provided by
nominators.
Figure 10. Portion of Web Site Screen in Edit Mode.
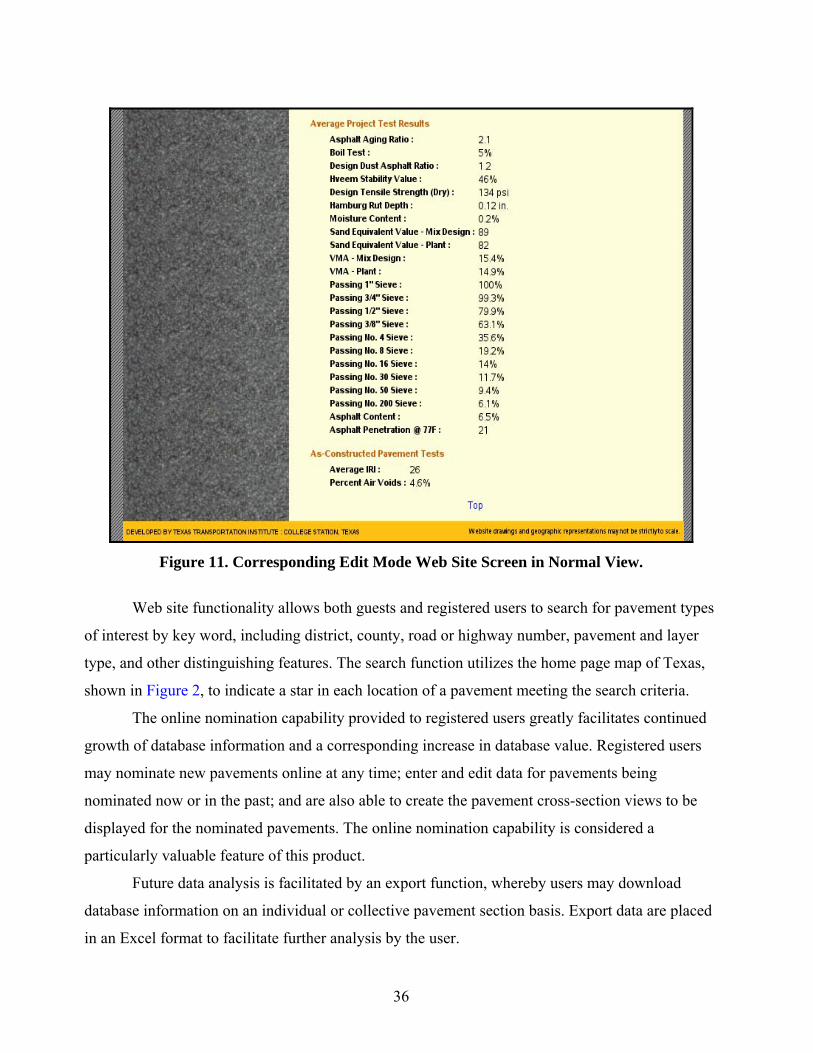
36
Figure 11. Corresponding Edit Mode Web Site Screen in Normal View.
Web site functionality allows both guests and registered users to search for pavement types
of interest by key word, including district, county, road or highway number, pavement and layer
type, and other distinguishing features. The search function utilizes the home page map of Texas,
shown in Figure 2, to indicate a star in each location of a pavement meeting the search criteria.
The online nomination capability provided to registered users greatly facilitates continued
growth of database information and a corresponding increase in database value. Registered users
may nominate new pavements online at any time; enter and edit data for pavements being
nominated now or in the past; and are also able to create the pavement cross-section views to be
displayed for the nominated pavements. The online nomination capability is considered a
particularly valuable feature of this product.
Future data analysis is facilitated by an export function, whereby users may download
database information on an individual or collective pavement section basis. Export data are placed
in an Excel format to facilitate further analysis by the user.
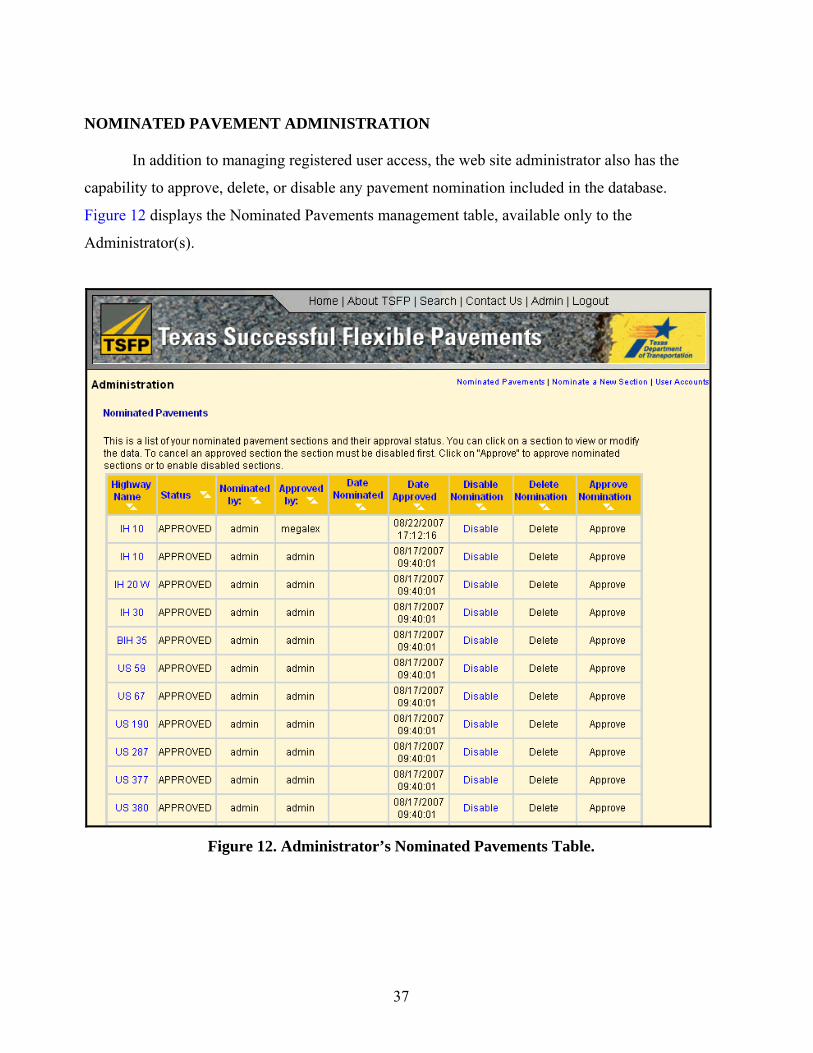
37
NOMINATED PAVEMENT ADMINISTRATION
In addition to managing registered user access, the web site administrator also has the
capability to approve, delete, or disable any pavement nomination included in the database.
Figure 12 displays the Nominated Pavements management table, available only to the
Administrator(s).
Figure 12. Administrator’s Nominated Pavements Table.

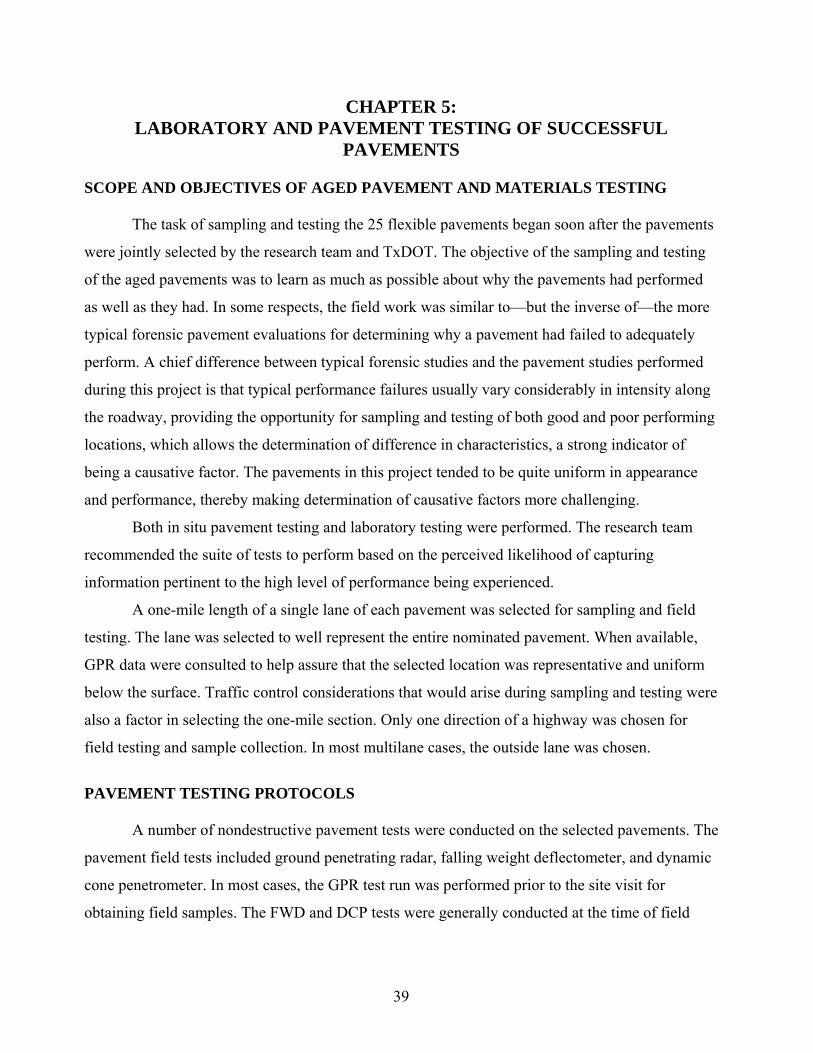
39
CHAPTER 5: LABORATORY AND PAVEMENT TESTING OF SUCCESSFUL
PAVEMENTS SCOPE AND OBJECTIVES OF AGED PAVEMENT AND MATERIALS TESTING
The task of sampling and testing the 25 flexible pavements began soon after the pavements
were jointly selected by the research team and TxDOT. The objective of the sampling and testing
of the aged pavements was to learn as much as possible about why the pavements had performed
as well as they had. In some respects, the field work was similar to—but the inverse of—the more
typical forensic pavement evaluations for determining why a pavement had failed to adequately
perform. A chief difference between typical forensic studies and the pavement studies performed
during this project is that typical performance failures usually vary considerably in intensity along
the roadway, providing the opportunity for sampling and testing of both good and poor performing
locations, which allows the determination of difference in characteristics, a strong indicator of
being a causative factor. The pavements in this project tended to be quite uniform in appearance
and performance, thereby making determination of causative factors more challenging.
Both in situ pavement testing and laboratory testing were performed. The research team
recommended the suite of tests to perform based on the perceived likelihood of capturing
information pertinent to the high level of performance being experienced.
A one-mile length of a single lane of each pavement was selected for sampling and field
testing. The lane was selected to well represent the entire nominated pavement. When available,
GPR data were consulted to help assure that the selected location was representative and uniform
below the surface. Traffic control considerations that would arise during sampling and testing were
also a factor in selecting the one-mile section. Only one direction of a highway was chosen for
field testing and sample collection. In most multilane cases, the outside lane was chosen.
PAVEMENT TESTING PROTOCOLS
A number of nondestructive pavement tests were conducted on the selected pavements. The
pavement field tests included ground penetrating radar, falling weight deflectometer, and dynamic
cone penetrometer. In most cases, the GPR test run was performed prior to the site visit for
obtaining field samples. The FWD and DCP tests were generally conducted at the time of field

40
sampling, with TxDOT personnel performing the FWD tests. Table 17 indicates the field testing
and sampling that was performed.
Table 17. Field Sampling and Pavement Tests.
Ground Penetrating Radar The objective of GPR testing was to investigate subsurface conditions and observe
variations in layer thicknesses, if any. TTI’s one gigahertz (1 GHz) air-launched ground
penetrating radar unit was used and is shown in Figure 13. This system sends discrete pulses of
Sect. No. District HWY No. GPR DCP Field
Sampling11 Abilene US 380 √ √ √ 16 Amarillo SH 152 √ √ √ 6 Atlanta US 59 √ √ √ 3 Atlanta IH 20W √ Concrete √ 4 Atlanta IH 30 √ Concrete √ 8 Brownwood US 190 √ √ √ 7 Brownwood US 67/84 √ √ √
13 Bryan SH 21E √ √ √ 14 Fort Worth SH 183 √ Concrete √ 15 Fort Worth SH 121 Pavement Removed 17 Fort Worth SH 171 √ √ √ 5 Fort Worth BIH 35 √ Concrete √
19 Laredo FM 1472 √ √ √ 20 Lubbock FM 1585 √ √ √ 9 Lufkin US 287 √ √ √ 1 Odessa IH 10 √ √ √
18 Odessa SH 176 √ √ √ 12 Odessa US 385 √ √ √ 10 San Angelo US 377 √ √ √ 2 San Angelo IH 10 √ √ √
21 San Antonio FM 2771 √ √ √ 24 San Antonio RM 2828 √ √ √ 22 Waco FM 3223 √ √ √ 23 Wichita Falls FM 3492 √ √ √ 25 Houston SH 6 √ Could Not
Penetrate √
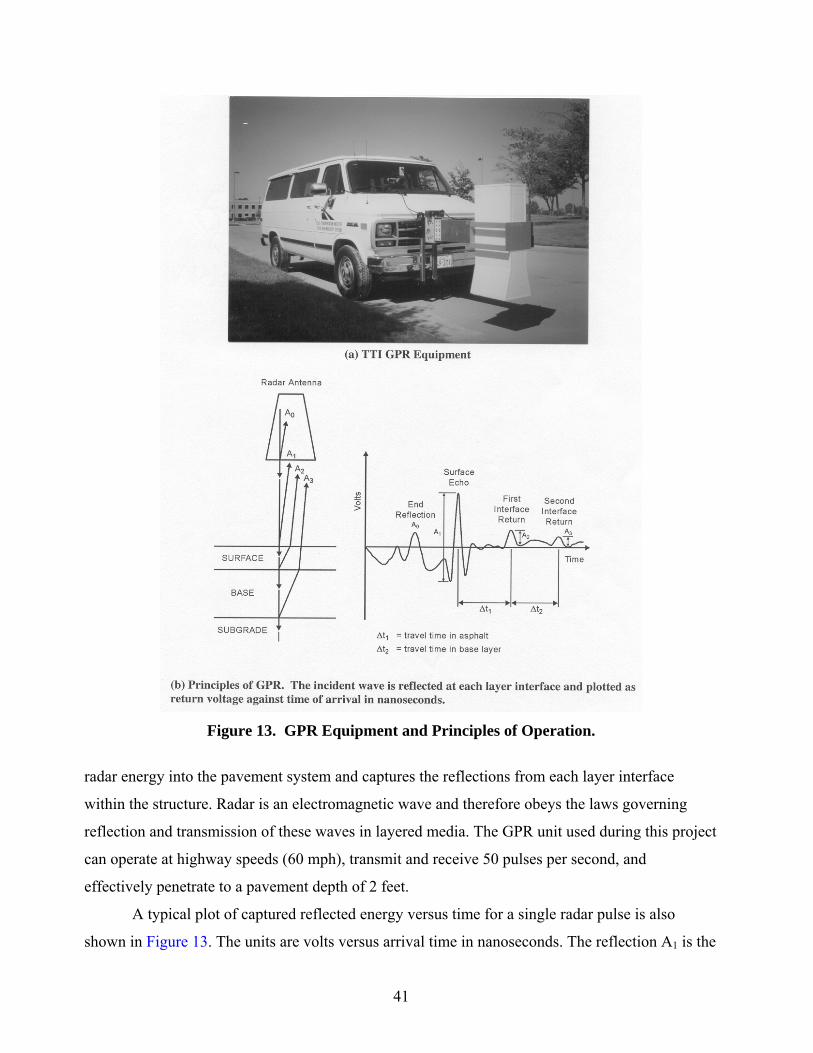
41
Figure 13. GPR Equipment and Principles of Operation.
radar energy into the pavement system and captures the reflections from each layer interface
within the structure. Radar is an electromagnetic wave and therefore obeys the laws governing
reflection and transmission of these waves in layered media. The GPR unit used during this project
can operate at highway speeds (60 mph), transmit and receive 50 pulses per second, and
effectively penetrate to a pavement depth of 2 feet.
A typical plot of captured reflected energy versus time for a single radar pulse is also
shown in Figure 13. The units are volts versus arrival time in nanoseconds. The reflection A1 is the
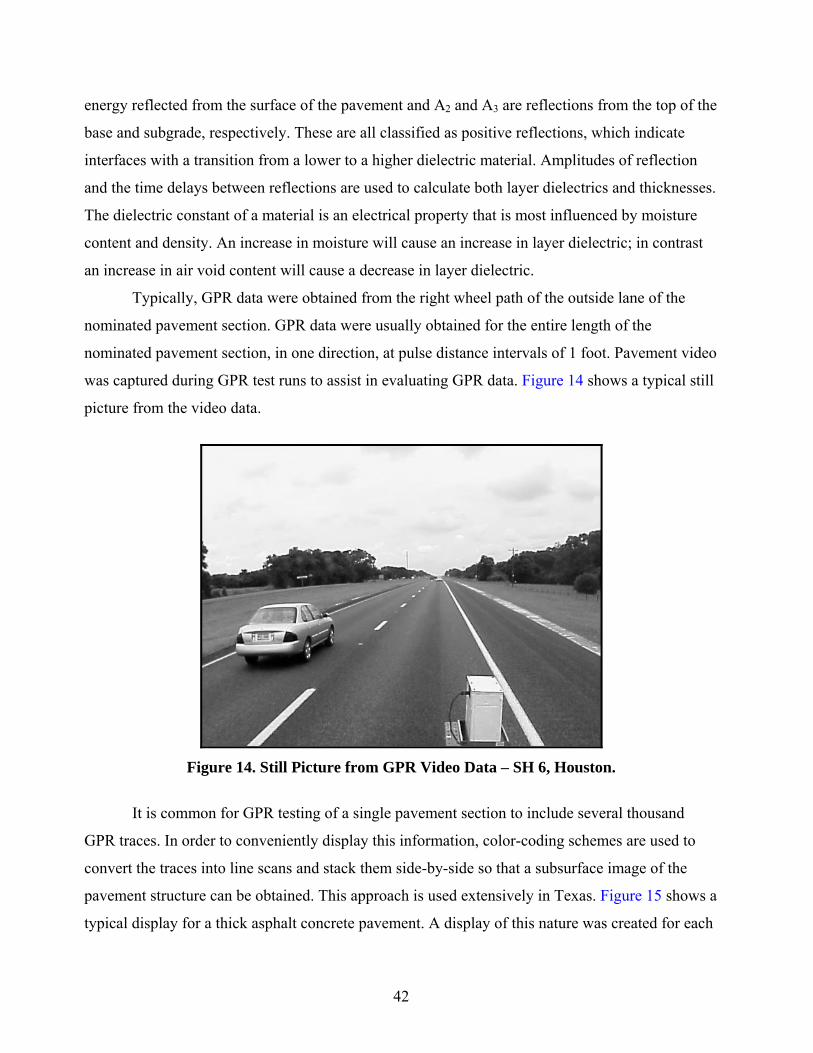
42
energy reflected from the surface of the pavement and A2 and A3 are reflections from the top of the
base and subgrade, respectively. These are all classified as positive reflections, which indicate
interfaces with a transition from a lower to a higher dielectric material. Amplitudes of reflection
and the time delays between reflections are used to calculate both layer dielectrics and thicknesses.
The dielectric constant of a material is an electrical property that is most influenced by moisture
content and density. An increase in moisture will cause an increase in layer dielectric; in contrast
an increase in air void content will cause a decrease in layer dielectric.
Typically, GPR data were obtained from the right wheel path of the outside lane of the
nominated pavement section. GPR data were usually obtained for the entire length of the
nominated pavement section, in one direction, at pulse distance intervals of 1 foot. Pavement video
was captured during GPR test runs to assist in evaluating GPR data. Figure 14 shows a typical still
picture from the video data.
Figure 14. Still Picture from GPR Video Data – SH 6, Houston.
It is common for GPR testing of a single pavement section to include several thousand
GPR traces. In order to conveniently display this information, color-coding schemes are used to
convert the traces into line scans and stack them side-by-side so that a subsurface image of the
pavement structure can be obtained. This approach is used extensively in Texas. Figure 15 shows a
typical display for a thick asphalt concrete pavement. A display of this nature was created for each
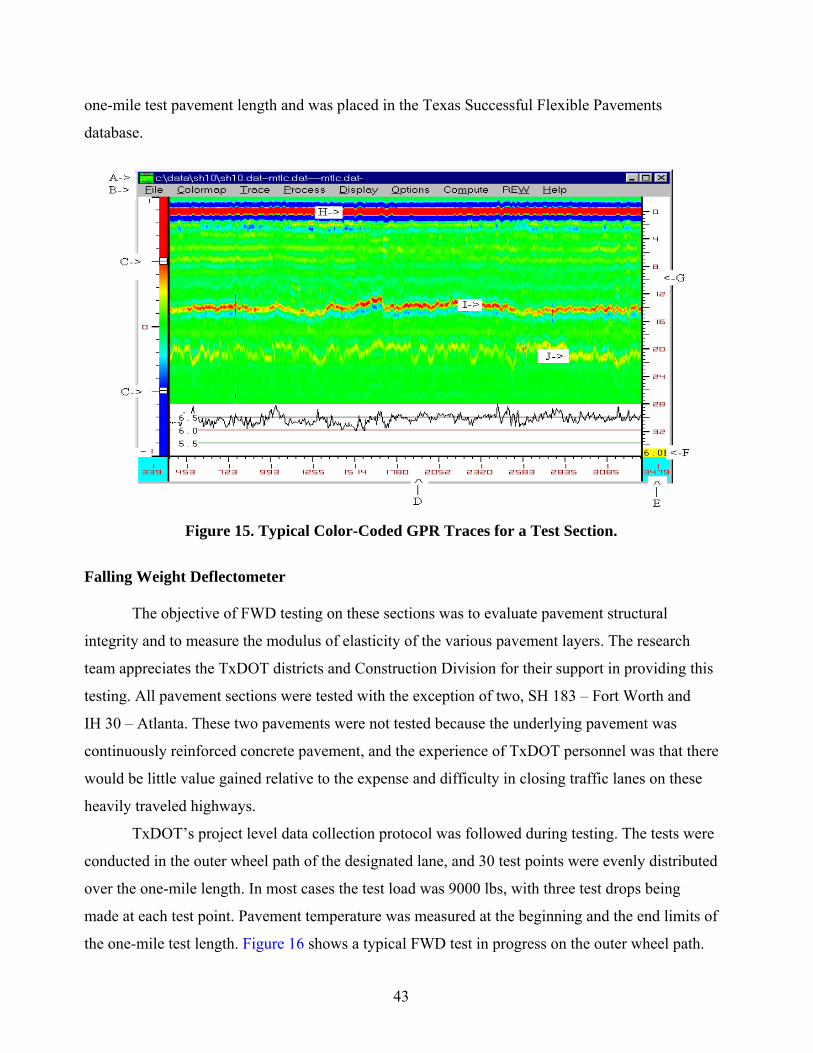
43
one-mile test pavement length and was placed in the Texas Successful Flexible Pavements
database.
Figure 15. Typical Color-Coded GPR Traces for a Test Section.
Falling Weight Deflectometer The objective of FWD testing on these sections was to evaluate pavement structural
integrity and to measure the modulus of elasticity of the various pavement layers. The research
team appreciates the TxDOT districts and Construction Division for their support in providing this
testing. All pavement sections were tested with the exception of two, SH 183 – Fort Worth and
IH 30 – Atlanta. These two pavements were not tested because the underlying pavement was
continuously reinforced concrete pavement, and the experience of TxDOT personnel was that there
would be little value gained relative to the expense and difficulty in closing traffic lanes on these
heavily traveled highways.
TxDOT’s project level data collection protocol was followed during testing. The tests were
conducted in the outer wheel path of the designated lane, and 30 test points were evenly distributed
over the one-mile length. In most cases the test load was 9000 lbs, with three test drops being
made at each test point. Pavement temperature was measured at the beginning and the end limits of
the one-mile test length. Figure 16 shows a typical FWD test in progress on the outer wheel path.

44
Figure 16. FWD Testing – US 59, Atlanta.
Dynamic Cone Penetrometer
The objective of DCP testing was to measure the in situ stiffness of flexible base and
subgrade layer(s). This test was conducted following the general guidelines from ASTM D6951-03
“Standard Test Method for the Use of the Dynamic Cone Penetrometer in Shallow Pavement
Applications.” An 8 kilogram sliding hammer was used for this testing. Before testing, asphalt
concrete layers and surface treatment layers were penetrated with a drill (see Figure 17) so that the
tip of the DCP cone rested on the top of the flexible base layer to begin testing. Figure 18 depicts
personnel taking DCP measurements at one test location. The number of drops between
penetration measurements varied widely depending on the layer stiffness. A smaller number of
drops were used for softer layers and a larger number for stiffer layers. In several cases the
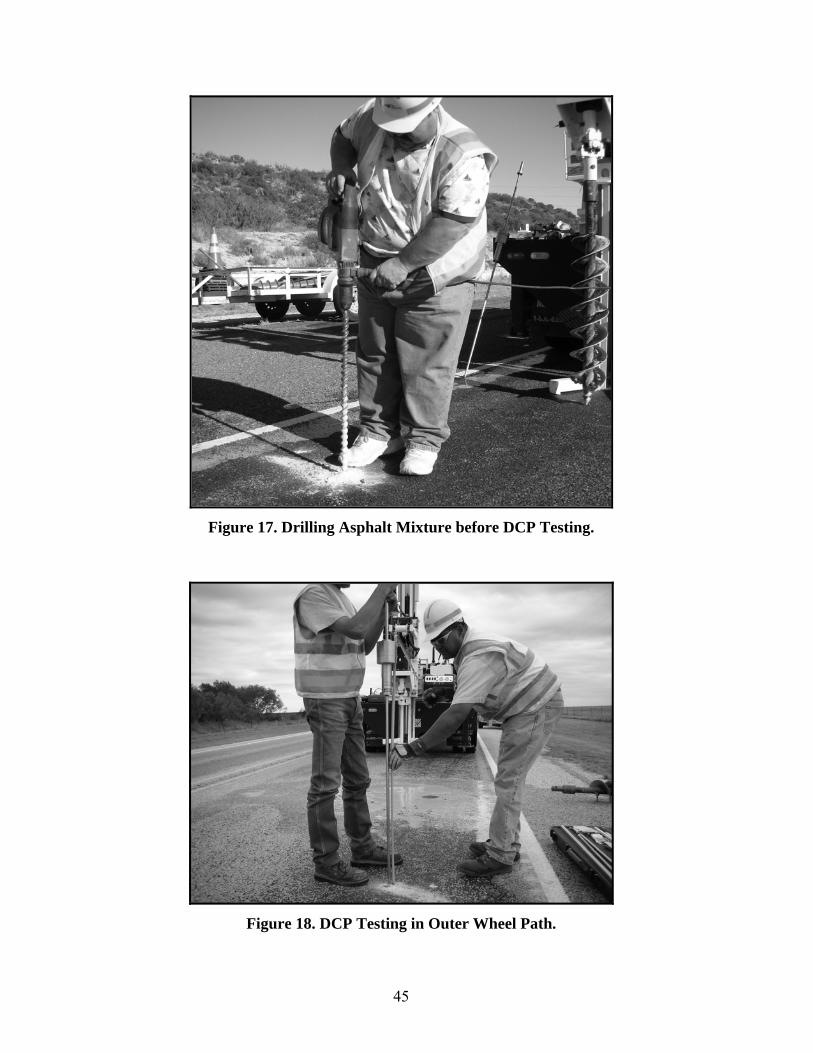
45
Figure 17. Drilling Asphalt Mixture before DCP Testing.
Figure 18. DCP Testing in Outer Wheel Path.

46
research team drilled somewhat further, into the flexible base layer, prior to beginning testing. This
additional drilling was necessary when the depth of penetration was zero or was bouncing after as
many as 40 drops. The problem was believed to be caused by a large rock directly beneath the
cone tip. The research team took DCP measurements at two locations for each one-mile test
length—one near each end of the test section.
PAVEMENT MATERIALS SAMPLING
Samples of the aged pavement were obtained from all pavements to be included in the
initial database. Core samples were obtained from asphalt mixture layers and other stabilized
layers, and loose samples of flexible base layers and subgrade materials were taken by auger.
When the nominated flexible pavement was an overlay of Portland cement concrete, only samples
of the asphalt mixture overlays were obtained. TxDOT district personnel graciously provided the
necessary traffic control.
Samples were obtained from two locations of each one-mile test length. These locations
were generally 500 feet from each end of the section. For pavements including at least one asphalt
concrete mixture layer, a total of ten 6-inch diameter cores were obtained; five from between the
wheel paths and five from the outer wheel path. These cores were distributed between the two
sampling locations as shown in Figure 19, which also shows the typical auger sampling locations
and DCP testing locations. For pavements that did not contain an asphalt concrete mixture layer,
only four 6-inch diameter cores were taken; two from between wheel paths and two from the outer
wheel path, as shown in Figure 20. Pavement cores were marked at the sampling site with paint.
Cores were numbered individually, indicating sampling location number and whether it was taken
from the wheel path or from between wheel paths. For example, WP 1-2 indicates the second core
sample obtained from a wheel path from coring location 1. The samples were also marked with
roadway and district identification. Photographs of coring holes were taken before patching.
Except for samples from FM 1472 and SH 121, the research team used TTI coring
equipment to obtain core samples, as shown in Figure 21 after completing coring at a typical
location. The Laredo District Laboratory generously obtained their pavement’s core samples
during the research team visit. The asphalt cores from SH 121 in the Fort Worth District were
obtained by district personnel prior to the asphalt overlay being milled. Only four 6-inch diameter
cores were available for testing from this pavement.
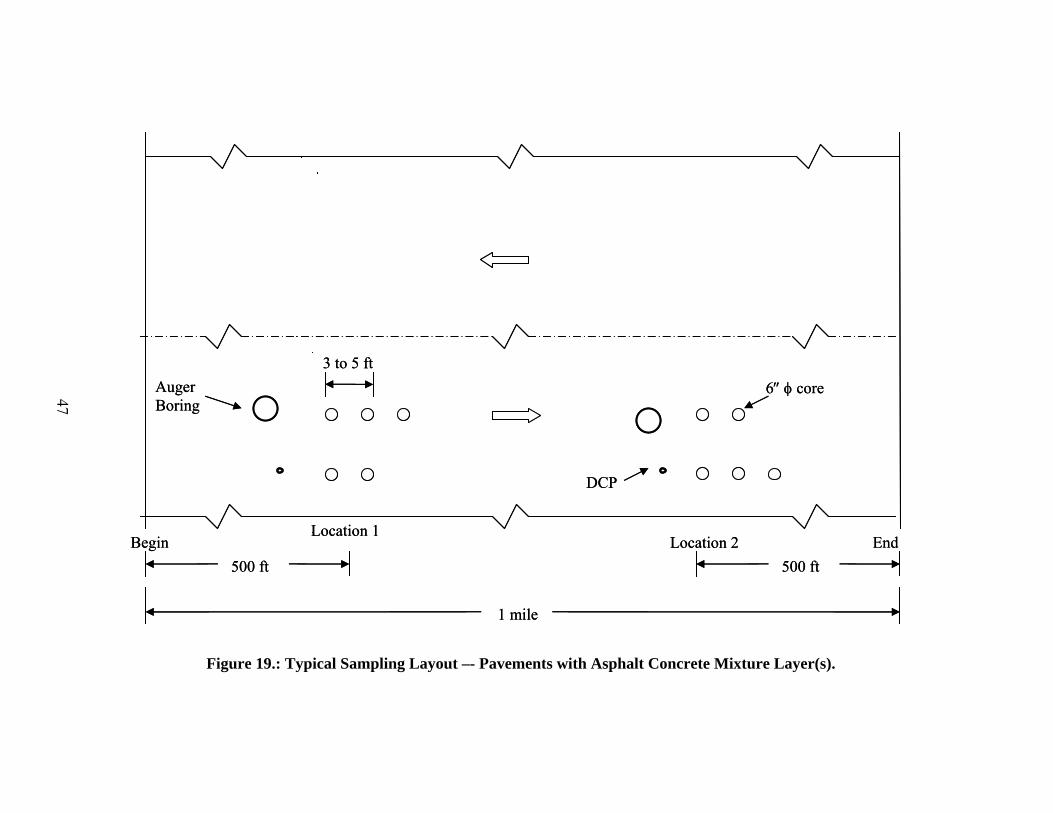
47
Figure 19.: Typical Sampling Layout –- Pavements with Asphalt Concrete Mixture Layer(s).
1 mile
Begin End
6″ φ core
DCP
Location 2 Location 1
Auger Boring
500 ft 500 ft
3 to 5 ft
1 mile
Begin End
6″ φ core
DCP
Location 2 Location 1
Auger Boring
500 ft 500 ft
3 to 5 ft
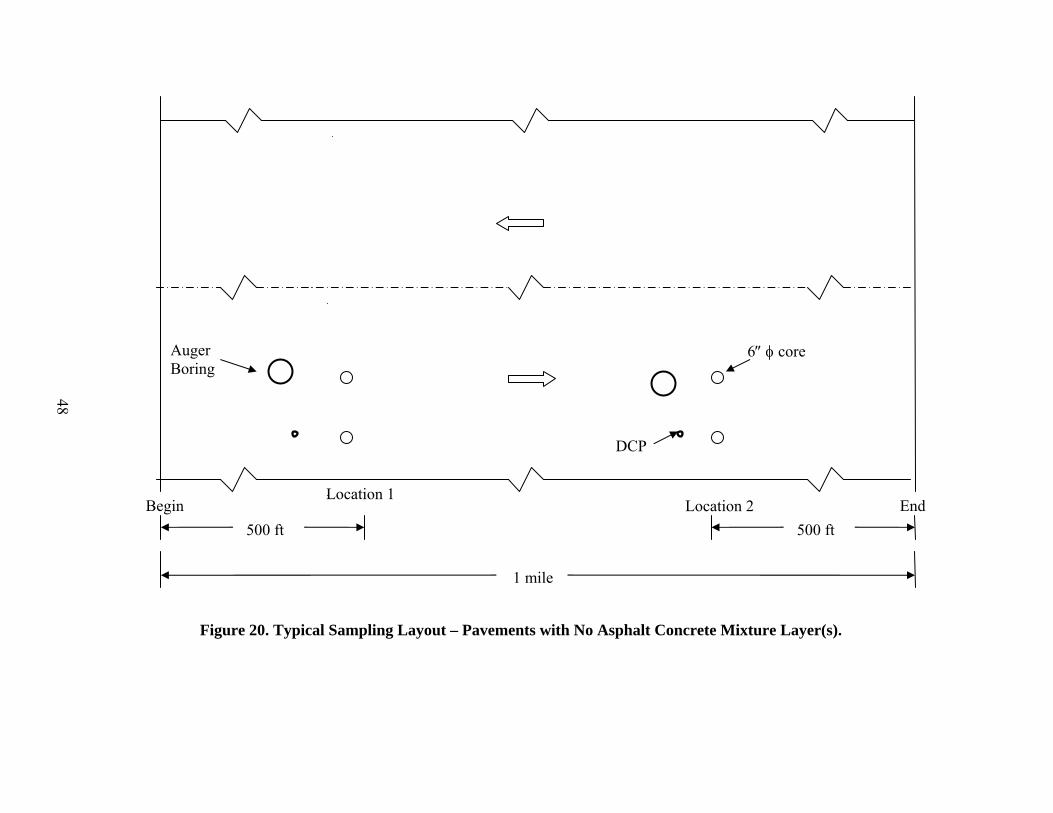
48
Figure 20. Typical Sampling Layout – Pavements with No Asphalt Concrete Mixture Layer(s).
1 mile
End
6″ φ core
DCP
Location 2 Location 1
Auger Boring
500 ft 500 ft Begin
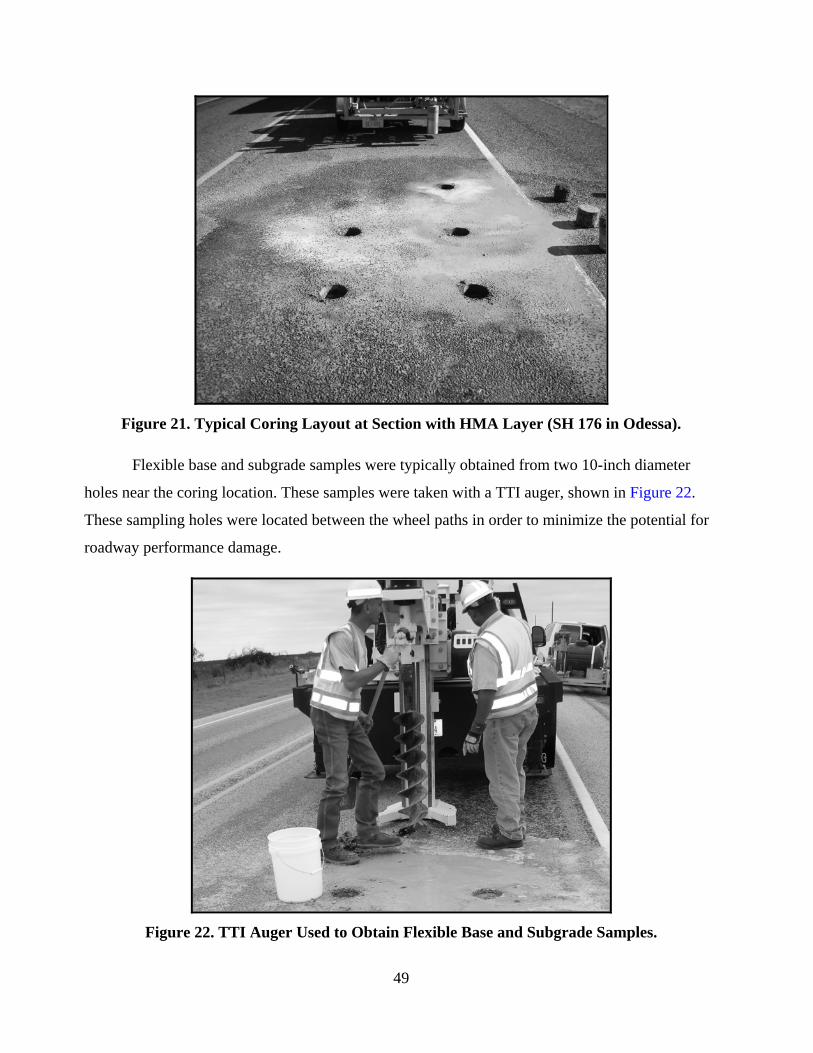
49
Figure 21. Typical Coring Layout at Section with HMA Layer (SH 176 in Odessa).
Flexible base and subgrade samples were typically obtained from two 10-inch diameter
holes near the coring location. These samples were taken with a TTI auger, shown in Figure 22.
These sampling holes were located between the wheel paths in order to minimize the potential for
roadway performance damage.
Figure 22. TTI Auger Used to Obtain Flexible Base and Subgrade Samples.

50
The research team monitored change of sample appearance during operation of the auger so
that separate samples could be obtained when materials obviously varied. Samples were stored in
plastic bags at the time of sampling to allow moisture determination of these pavement layers. The
research team also measured layer thicknesses, as shown in Figure 23. The ultimate depth of auger
boring varied depending on the local conditions. Typically, boring continued to 30 inches below
the pavement surface. The subgrade samples were taken at least 1 foot below the top of the natural
subgrade.
Figure 23. Measurement of Layer Thickness While Auger Sampling.
Besides the collection of pavement samples, the research team recorded global positioning
system (GPS) coordinates, pavement temperatures, and any unique aspect of the sampling
locations while at the sampling sites. Photographs were taken to record operations and to assist in
locating the sampling points in the future, if needed.
LABORATORY TESTING PROTOCOLS
All tests of pavement cores and loose material samples were performed in the TTI
materials laboratory on the campus of Texas A&M University in College Station. The laboratory
tests and procedures that were performed varied by the type of pavement layer, as follows.

51
Asphalt Concrete Mixture Layer Testing The focus of testing asphalt concrete mixture layers was on asphalt binder content, aged
asphalt binder properties, aggregate gradation, and the final percent air voids after years of traffic.
These were selected for their importance to performance. The asphalt binder content and properties
are a major factor in resistance to pavement cracking. The gradation is a major factor in resisting
pavement deformation in the wheel paths. And the final percent air voids is a good indicator of the
degree of protection that the surface layers are providing underlying moisture susceptible,
unstabilized pavement layers.
Core Photography and Measurements
Several cores from each nominated pavement were photographed prior to sawing and
separating pavement layers. These photographs were taken to visually document the pavement
structure and the appearance of individual pavement layers. These photographs have been
uploaded into the Texas Successful Flexible Pavements web site for viewing by users. Figure 24
shows example core photographs. The thickness of each pavement layer was carefully measured at
several locations around a given core sample, and an average of the measurements was recorded. A
general description of each layer was also logged into laboratory records.
Figure 24. Laboratory Photographs of Pavement Cores.
Specific Gravity and Air Void Determinations
Each asphalt concrete mixture layer of adequate thickness for testing was separated by
sawing. Care was taken to exclude any trace of seal coat or microsurfacing materials from the
sample to be tested. Individual asphalt layer samples were left in front of a fan at room temperature

52
for several days in order to remove moisture. At least four samples, two taken from the wheel path
and two taken from between wheel paths, were bulk specific gravity tested. Bulk specific gravity
was measured following Test Method Tex-207-F, Part VI “Bulk Specific Gravity of Compacted
Bituminous Mixtures using the Vacuum Method.”
Two or more of these layer samples were then melted in a warm oven and mixed together.
After cooling to room temperature the sample was carefully split: one half for measuring Rice
theoretical maximum specific gravity and the other half for later solvent extraction and recovery of
the binder. The Rice specific gravity of the sample was determined following Test Method Tex-
227-F, “Theoretical Maximum Specific Gravity of Bituminous Mixtures, Part II.”
The percent air voids contained in the individual pavement layers were then calculated
using the Rice theoretical maximum specific gravity value and the bulk specific gravities of the
core samples.
Asphalt Content and Recovery
Two methods were used to determine the asphalt content of individual pavement mixture
layers. Pavement layers that did not include polymers in the asphalt were tested using the solvent
extraction procedures in Test Method Tex-210-F, “Determining Asphalt Content of Bituminous
Mixtures by Extraction, Part I, Centrifuge Extraction Method Using Chlorinated Solvent.” The
asphalt washed from these samples was then recovered in accordance with Test Method Tex-211-
F, “Recovery of Asphalt from Bituminous Mixtures by the Abson Process.” Pavement mixture
layers believed to contain polymer modifiers were tested for asphalt content in accordance with
Test Method Tex-236-F, “Determining Asphalt Content from Asphalt Paving Mixtures by the
Ignition Method.” This decision was made because of the high uncertainty that recovered polymer-
modified asphalts could be recovered in a manner to adequately determine the binder properties.
Therefore, the more efficient ignition test method was used for these samples.
Mixture Aggregate Gradation
Aggregates recovered during both methods of binder content determination were tested in
accordance with Test Method Tex-200-F, “Sieve Analysis of Fine and Coarse Aggregate, Part II
Washed Sieve Analysis.” The set of sieve sizes selected for gradation testing of each pavement
layer was based on the sieves required in construction specifications for the pavement mixture
type; i.e., Type D, C, etc.

53
Penetration Testing of Binders
The penetration test was selected for testing recovered binder samples because of this test’s
historic use in TxDOT during forensic studies of aged pavements. This data history will allow
TxDOT to readily compare the binder properties from these particularly successful pavements to
test results over the years from a number of other pavements, including a number of pavements
which had failed prematurely. The penetration tests were performed at 77° F in accordance with
ASTM D5-06, Standard Test Method for “Penetration of Bituminous Materials.”
Surface Treatment Layer Testing
Core Photography and Measurements
Cores from pavements consisting of only surface treatments and seal coats above the base
were photographed and the total thickness of the combined pavement seals was measured. The
research team estimated the number of seal coat applications present from the appearance of the
core. No testing was attempted.
Stabilized Base Layer Testing
Core samples were retrieved from three highways containing asphalt stabilized base.
These were SH 6, US 287, and US 67/84. Figure 25 shows the asphalt stabilized base samples
obtained from US 287 in the Lufkin District and from SH 6 in the Houston District. Note that the
US 287 asphalt stabilized base is a sand asphalt mixture.
Figure 25. Asphalt Stabilized Base Cores from US 287 and SH 6.
54
SH 171 in the Fort Worth District included a cement stabilized base, for which a test-
worthy sample could not be obtained by either coring or auger boring.
Asphalt stabilized base layers were documented and tested in the laboratory in the same
manner as asphalt concrete mixture layers.
Flexible Base Layer and Subgrade Testing
Flexible base materials were obtained from 17 pavement test sections. The remaining eight
selected pavements either had underlying concrete pavement or did not have flexible base in the
pavement structure. Sampling and testing of flexible base and subgrade focused on determining
Atterberg limits, moisture content at time of sampling, and mineral type. In addition, the gradation
of each flexible base sample was determined.
Field Moisture Content
A moisture sample was typically obtained at about the midpoint of flexible base layers and
from the upper foot of the subgrade. These samples were immediately sealed in a plastic bag.
Moisture determinations were performed according to Test Method Tex-103-E, “Determining
Moisture Content in Soil Materials.”
Atterberg Limits
The liquid limit, plastic limit, and plasticity index were determined for both flexible base
layer and subgrade samples. Samples were prepared following the standard procedures found in
Test Method Tex-101-E, “Preparing Soil and Flexible base Materials for Testing (Part I),” and
testing was performed in accordance with Test Methods Tex-104-E, “Determining Liquid Limits
of Soils”; Tex-105-E, “Determining Plastic Limit of Soils”; and Tex-106-E, “Calculating the
Plasticity Index of Soils.”
When these samples were obtained from two different locations on a given pavement
section, they were tested individually. Both results are reported in the web site when significantly
different properties were found. Atterberg limits of subgrade samples were measured separately
with samples from two separate auger holes for each test section.
Flexible Base Gradation
The gradation of flexible base materials was determined following the standard procedure
in Test Method Tex-110-E, “Particle Size Analysis of Soil (Part I).” This procedure allows

55
measuring the gradation of particles larger than 0.425 mm (No. 40 sieve). Before performing this
gradation test, the percentage of passing No. 200 sieve material was determined by washing in
accordance with Test Method Tex-111-E, “Determining the Amount of Material in Soils Finer
than 75 μm (No. 200 sieve).” Since TxDOT construction specifications control flexible base
gradation as percent retained by sieve size, these test results are included in the web site in those
units.
Mineral Identification
Dr. Pat Harris, a TTI geologist, assisted the research team in mineral identification of
flexible base samples. Flexible base samples were washed to remove fines from the coarse
aggregate to facilitate mineral identification. Fifteen to twenty coarse aggregate particles were then
randomly selected for identification. Samples were first examined microscopically using a Meiji
binocular microscope. Most samples were identified by this visual examination, but hydrochloric
acid was added to some samples to assist in gauging calcite content. A steel biological pick was
also used to determine the hardness of some samples to further aide in mineral identification.
Reasonable identifications of coarse aggregate mineral composition were possible in this manner.


57
CHAPTER 6:
ANALYSIS OF INFORMATION
A number of analyses were performed on construction inspection test data, PMIS data, and
aged pavement test data obtained from the successful flexible pavements included in the database.
The primary objective of these analyses was to expand knowledge about the correlation of
construction specification requirements and aged pavement test results to long-term successful
performance of flexible pavements in Texas.
IMPACTS OF SPECIFICATION AND TEST METHOD EVOLUTION
The earliest construction year for pavements included in the Texas Successful Flexible
Pavements database is 1949. The most recent construction year is 2001. TxDOT construction
specifications and testing procedures have been revised on numerous occasions over the decades to
keep pace with knowledge and technology concerning flexible pavements. These changes
complicate analyses of information for the purpose of increasing understanding of the impacts of
specification requirements on pavement performance. The most significant challenge is in the area
of changes to testing procedures, as these have a largely unknown and sometimes variable affect
on test results. Analyses of test results are reported herein and compared over time even though a
direct comparison is potentially flawed by changes in the testing techniques used.
Another challenge to the research team was that several of the flexible pavements included
in the project were constructed using metric units of measure. As TxDOT currently uses English
units of measure, all metric information has been converted to English units prior to data analysis
and loading into the Texas Successful Flexible Pavements database.
SPECIFICATION ANALYSIS METHODOLOGY
The systematic methodology developed and employed to analyze construction specification
criteria included data collection, data refinement, and data analyses processes.
Data Collection
Historic data that were collected included information found in construction plans and also
in construction inspection testing records, whenever this information had been retained by the
58
district. Construction plans were located for 24 of the 25 pavements included in the project.
Because of record retention policies within TxDOT, only nine of the pavements to be included in
the database had construction inspection testing records available. Construction records existed in
hard copy in most instances, on microfilm for two projects, and on a CD for one project. The
collected construction test results are tabulated in Appendix A on the CD-ROM. The lack of
construction inspection test results limited the depth and nature of conclusions related to
specification requirement analyses contained herein. However, the web site and database that have
been created provide the means for more precise future evaluations as additional project data are
included in the database.
Following the procedures described in Chapter 5, field pavement tests and laboratory
testing of aged pavement samples were performed to determine current pavement and material
characteristics. The results of all aged pavement laboratory test results are also included in
Appendix A on the CD-ROM. While aged pavement laboratory test results provide insight for the
analysis of construction specification requirements, this information must be carefully evaluated as
it does not usually represent the characteristics of the pavement and materials at the time of
construction. Degradation of aggregate during construction, traffic densification of pavement
layers, and oxidation of asphalt binders will all have significant affects on test results. Although
not particularly an objective of this research project, the aged pavement test results provide a
particularly valuable contribution toward better understanding of desirable long-term properties of
flexible pavement layers.
Construction Data Refinement
In large measure, historic construction data could be included for analysis without
refinement. The most notable exception was that test results were deleted from the analyses when
they did not meet specification requirements and, thereby, resulted in the materials being rejected
at the plant or removed from the roadway at the time of construction.
Data refinement was also required in several instances to allow proper analyses and
comparison to current specification criteria. For instance, TxDOT has used percent-passing,
percent-retained, and percent-passing-and-retained gradation documentation methods in various
material specifications over the decades. When pavements were constructed under specifications
using different gradation documentation methods than TxDOT specifications currently use, the test
results were converted to the gradation documentation method currently being used. Another
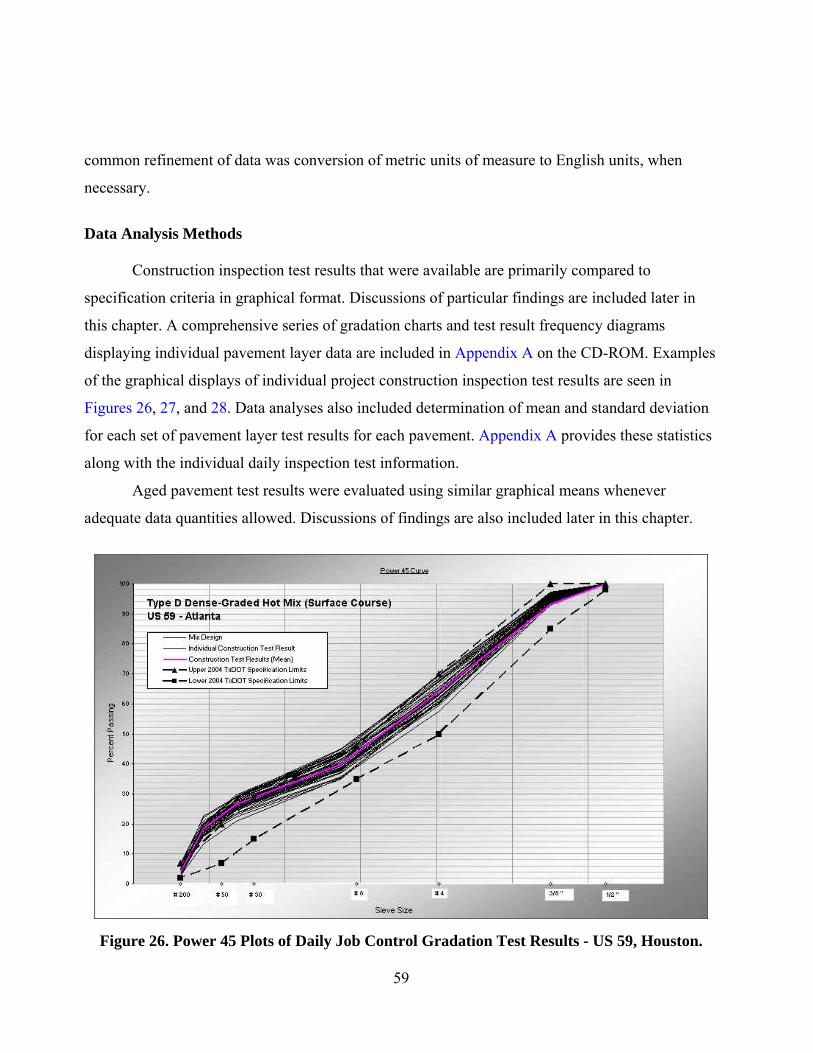
59
common refinement of data was conversion of metric units of measure to English units, when
necessary.
Data Analysis Methods
Construction inspection test results that were available are primarily compared to
specification criteria in graphical format. Discussions of particular findings are included later in
this chapter. A comprehensive series of gradation charts and test result frequency diagrams
displaying individual pavement layer data are included in Appendix A on the CD-ROM. Examples
of the graphical displays of individual project construction inspection test results are seen in
Figures 26, 27, and 28. Data analyses also included determination of mean and standard deviation
for each set of pavement layer test results for each pavement. Appendix A provides these statistics
along with the individual daily inspection test information.
Aged pavement test results were evaluated using similar graphical means whenever
adequate data quantities allowed. Discussions of findings are also included later in this chapter.
Figure 26. Power 45 Plots of Daily Job Control Gradation Test Results - US 59, Houston.

60
Figure 27. Frequency Diagram of Daily Laboratory-Compacted Densities - US 59, Atlanta.
Figure 28. Frequency Diagram of Daily Hveem Stability Test Results - US 59, Atlanta.
61
INDIVIDUAL PAVEMENT DESCRIPTIONS AND ANALYSES
The amount and types of construction information that could be located for the selected
pavements varied. Not surprisingly, the older the pavement, the less likely it was that complete
construction or design information remained available in department records. Laboratory testing of
aged pavement samples and on-site pavement testing provided information on all pavements
included in the database.
All collected information was initially evaluated on an individual pavement basis. Each
pavement included in the web site is described in the section that follows. Each description
includes the type of pavement structure, some of the more pertinent laboratory test results,
commentary on the in-situ pavement testing performed during this project, and a statement of
probable factors contributing to the particularly successful pavement performance. In addition to
the frequent mention of pavement asphalt contents and air voids, because of their bearing on
cracking resistance and layer permeability and aging resistance, the percentages of fines in various
layers are also mentioned. The amount of passing No. 200 sieve material is a major limiting factor
to VMA and asphalt content, and the amounts of coarser aggregate contribute to stability and
deformation resistance.
The detailed test data from individual pavements and graphical displays of individual
project construction inspection test results, when available, are included in Appendix A on the CD-
ROM.
IH 10 – Odessa District
Both the original construction of this surface treatment pavement in 1978 and the hot
rubber asphalt seal coat placed in 1999 are considered extraordinary performers. When built as
new location interstate in 1978, the construction plans called for a total of 11 inches of flexible
base and a two-course surface treatment. These were considered to be the first stage of “staged
construction.” The second stage was to include 5 inches of asphalt stabilized base and 3 inches of
asphalt concrete. The second stage had not been constructed as of 2007. Instead, only preventative
maintenance measures have been taken, most recently being the 1999 placement of a hot rubber
asphalt seal coat. Strain Brothers, Inc. was the contractor for the original pavement construction,
and J. H. Strain & Sons placed the hot rubber asphalt seal coat.
62
The GPR colormap from the recent survey shows a uniform profile, without any anomalies,
which is indicative of a good pavement structure. The back-calculated modulus for the flexible
base from FWD data is 117 ksi, which is above the typical range (40-70 ksi) for this type of base.
The back-calculated modulus for the subgrade is 73 ksi, which indicates a strong subgrade and
reflects the presence of rock in the soil as observed during pavement sampling.
The superior performance of this pavement appears to be the combined result of good
construction practice, high quality flexible base material, and the excellent local subgrade. The
relatively dry climate in this area of Texas is also probably a factor. This pavement clearly
demonstrates that properly designed and constructed surface treatment pavements can be used in
interstate highway construction under certain climate and subgrade conditions.
IH 10 – San Angelo District
This section of pavement on IH 10 is near Junction. The originally constructed pavement
section consisted of two 1 ½ inch dense-graded hot asphalt mixture layers on top of two layers of
flexible base. The lower flexible base layer was specified to be grade 2 while the upper layer was
specified to be grade 1. A mill and fill inlay of coarse-matrix high-binder type C (CMHB-C) was
placed in 2000 to correct some areas of rutting. Overall, this 38-year old pavement has held up
well.
Pavement design and construction testing and inspection records for the original
construction of this IH 10 pavement section were no longer available. Pavement cores revealed
that there is now 5 inches of asphalt mixture above the flexible base. Testing of the cores found 3
percent, 6 percent, and 3 percent air voids in the three asphalt mixture layers, top to bottom, when
averaging all tests from each layer. The air void levels in all three layers were markedly lower in
wheel path cores than in cores taken from between wheel paths. This low air void content in the
wheel path is consistent with the report that the mill and inlay had been performed to correct some
areas of rutting. Asphalt recovered from the top two mixture layers had penetration values in the
40s and 50s, indicating that the asphalt still has considerable life remaining.
Testing of flexible base and subgrade samples found plasticity indices (PIs) of 5 and 4,
respectively. Moisture contents were found to be 4 and 13 percent, respectively. The flexible base
was crushed limestone and contained 12.5 percent passing No. 200 sieve material at the point of
field sampling.

63
The GPR colormap from the recent survey shows a uniform profile, without anomalies,
which is indicative of a good pavement structure. The back-calculated modulus for the hot asphalt
mix from FWD data is 760 ksi, which is within the typical range for CMHB mixes and above that
for dense-grade hot mix asphalt. The back-calculated modulus for the flexible base from FWD
data is 137 ksi, which is above the typical range (40-70 ksi) for this type of base. The back-
calculated modulus for the subgrade is 45 ksi, which indicates a strong subgrade and reflects the
presence of rock in the soil that was observed during coring.
Factors likely to contribute to performance excellence include the low PI and stiffness of
the subgrade, excellent quality flexible base material, and the presence of paved shoulders to
impede lateral moisture migration from the pavement edges. Considering the relatively low
pavement air voids and the current life remaining in the asphalt cement, this pavement could
perform very well for many more years barring an abnormally hot summer, which could possibly
cause the reappearance of rutting.
IH 20W – Atlanta District
This section of IH 20 is the westbound roadbed beginning at the Louisiana state line and
extending to US 80. The pavement layers of interest are the two dense-graded asphalt concrete
mixtures overlaying an existing continuously reinforced concrete pavement. The Type C surface
course includes latex-rubber asphalt modification. Pipe edge drains were installed in 1996 at the
time of overlay placement.
Construction records indicate that both asphalt mixtures were composed of limestone from
Bridgeport area quarries, included liquid antistripping agent, averaged Hveem stabilities in the
high 50s, and the surface course included 3 percent latex rubber. Construction in-place air voids
averaged 6.9 percent for the Type C surface course. No air void data were available for the
underlying Type B layer.
Extraction testing of aged pavement cores from the Type C surface course found an
average asphalt content of 4.2 percent, a passing No. 10 sieve average of 31.9 percent, and a
passing No. 200 sieve average of 3.4 percent. The average air void content in the Type C pavement
layer was 5.1 percent after approximately 10 years of service.
Extraction testing of the underlying Type B aged pavement layer found the asphalt content
to average 3.4 percent, the passing No. 10 sieve to average 33.1 percent, and the passing No. 200

64
sieve to average 4.2 percent. The average air void content found in the Type B course was 5.3
percent.
The GPR colormap from the recent survey shows a uniform profile, without anomalies,
which is indicative of a good pavement. The back-calculated modulus for the hot asphalt mix from
FWD data is 456 ksi, which is within the typical rage for dense-graded hot mix asphalt layers. The
back-calculated modulus for the reinforced concrete pavement is 4,432 ksi, which is within the
typical range (2000 – 7000 ksi) for this type of layer. The back-calculated modulus for the
subgrade is 25 ksi, which is an indication of a good subgrade.
Factors contributing to the superior performance of this concrete pavement overlay appear
to include the use of high quality materials, an abnormally high stability mixture, and the use of
latex-rubber asphalt to maintain a degree of crack resistance in an otherwise tough, rut-resistant
mixture. The placement of an AC-15-5TR lightweight grade 4 single surface treatment between
the two mixture layers may also be playing an important role in maintaining adequate pavement
flexibility and crack resistance. Lastly, the use of pavement edge drains to facilitate moisture
drainage from the pavement should be mentioned as a possible factor contributing to superior
performance.
IH 30 – Atlanta District
This section of IH 30 is between the Arkansas state line and FM 989. The pavement layer
of interest is the dense-graded asphalt concrete overlay that was placed in 1996 over an existing
asphalt concrete overlay and continuously reinforced concrete pavement. The 1996 overlay is
Type C and includes crushed gravel aggregate, lime, and latex-rubber asphalt modification.
Construction records indicate the asphalt overlay was composed of siliceous aggregate,
included 1.5 percent lime antistripping agent, averaged Hveem stability of 44 percent for the
project, and included 3 percent latex-rubber. Construction in-place air voids averaged a rather high
9.6 percent. A grade 4 lightweight surface treatment was placed under the new overlay. The
surface treatment asphalt contained 5 percent tire rubber.
Extraction testing of aged pavement cores from the Type C overlay found an average
asphalt content of 5.7 percent, a passing No. 10 sieve average of 34.0 percent, and a passing
65
No. 200 sieve average of 4.8 percent. The average air void content in the Type C pavement layer
was 3.9 percent after approximately 10 years of service.
The GPR colormap from the recent survey shows a uniform profile, without anomalies,
which is indicative of a good pavement. FWD testing was not conducted in this section since the
underlying layer was continuously reinforced Portland cement concrete.
Factors contributing to the superior performance of this overlay appear to include the use of
high quality materials and the use of latex-rubber asphalt to maintain an additional degree of crack
resistance. The placement of the lightweight grade 4 single surface treatment below the Type C
overlay may also play an important role in maintaining adequate pavement flexibility and crack
resistance.
BIH 35 – Fort Worth District
This pavement is the business route for IH 35 through the small town of Alvarado,
Texas. The pavement structure of interest is the stone-matrix asphalt (SMA) overlay of existing
asphalt mixture and jointed concrete pavement. One-inch of the existing asphalt concrete surface
was planed prior to placing the SMA overlay. This project was the first placement of SMA paving
mixture in Texas. David Bass, the Fort Worth District Laboratory Engineer, and Carl Utley, the
Fort Worth District Construction Engineer, showed early interest in SMA and were instrumental in
bringing this new mixture type to Texas. Joe Fossett was the area engineer. The SMA mixture
produced on this project was also placed on a rural portion of SH 171, overlaying existing asphalt
mixture and flexible base.
Construction records no longer exist for this pavement. However, the research supervisor
on this project was employed by TxDOT and was involved with this project in 1992. It is recalled
that the SMA mixture is composed of limestone aggregate, agricultural lime mineral filler, latex-
rubber modified asphalt cement, and cellulose fiber.
Cores taken at each end of the project revealed an additional inch of existing asphalt
concrete above the concrete pavement at one end of the project.
Laboratory testing of the cores taken from the aged pavement found the SMA asphalt
content to average 6.4 percent, the passing No. 8 sieve to average 24.6 percent, and the passing
No. 200 sieve to average 11.3 percent. The average SMA pavement air void content was 3.7
percent.

66
The GPR colormap from the recent survey shows a uniform profile, without anomalies,
which is an indication of a good pavement. FWD testing was conducted but the back-calculated
modulus values are not reliable because of the thin SMA (1.5 inch) and HMA (1.75 inch) layers on
top of the thick jointed concrete pavement (15.5 inch).
Factors influencing the excellent performance of this pavement are believed to be the air
void level, which would serve to limit water penetration and slow asphalt oxidation; the relatively
high asphalt content compared to that used in dense-graded mixtures produced in 1992; the lack of
any sign of moisture damage in the existing and SMA pavement layers; and the stone skeleton of
the SMA mixture design providing good rut resistance.
US 59 – Atlanta District
This section of US 59 is between FM 2517 and FM 999 just south of Carthage, Texas. The
expansion of this roadway to four lanes and two roadbeds was completed in 1989. The pavement
structure is somewhat unique in that it includes 16 inches of lime-fly ash stabilized subgrade. That
was followed by three layers of Type C asphalt concrete, totaling 8.5 inches in thickness, and then
2 inches of Type D asphalt concrete on the surface.
Construction records indicate that both asphalt mixtures were composed of siliceous
aggregate, included liquid antistripping agent in the AC-20 asphalt cement, and averaged Hveem
stabilities in the low 40s. The surface course included a premium liquid antistripping agent, while
the underlying layers included a standard grade agent. Construction in-place air voids averaged 6.6
percent for the Type D surface course and 6.1 percent for the Type C pavement layers.
Extraction testing of aged pavement cores from the Type D surface course found an
average asphalt content of 4.4 percent, having a penetration value of 40; a passing No. 10 sieve
average of 33.1 percent; and a passing No. 200 sieve average of 4.4 percent. The average air void
content in the Type D pavement layer was found to average 9.6 percent at the two coring locations
after approximately 10 years of service. This is significantly more than the average air void test
results during construction and may not be representative of the majority of the current pavement
length.
Extraction testing of the underlying Type C aged pavement layer found the asphalt content
to also average 4.4 percent, the passing No. 10 to average 35.9 percent, and the passing No. 200
sieve to average 9.8 percent. The pavement air void content could not be determined for the Type
C layers because of apparent stripping in the uppermost Type C layer.
67
The GPR colormap from the recent survey shows a uniform profile except for a short
length at the end of the section that indicates moisture presence in the uppermost asphalt layer. The
back-calculated modulus for the hot asphalt mix from FWD data is 210 ksi, while the back-
calculated modulus for the fly ash stabilized subgrade is 242 ksi.
Factors contributing to the ongoing performance of this flexible pavement appear to
include substantial pavement design, including lime-fly ash stabilized subgrade and a deep asphalt
pavement section. The moisture damage in the uppermost layer of the Type C paving material may
warrant additional investigation even though it is not affecting performance at this time. The use of
standard grade liquid antistripping agent in the Type C layers may be a factor in the degree of
stripping occurring.
US 67 – Brownwood District
This pavement section runs through the small town of Bangs. The pavement structure is
composed of 1.5 inches of dense-graded hot asphalt mixture over 4.5 inches of asphalt stabilized
base over 6 inches of flexible base. The Brown County Area Office was responsible for design and
project inspection, and Charles W. Heald was the area engineer. The district engineer was
Lawrence Schulz. This pavement replaced an old stone Macadam pavement which had three
inches of hot mix on the surface.
A review of construction inspection testing records showed that the average in-place air
voids of the surface paving mixture was 4.6 percent and the average density achieved in the
flexible base was 101.4 percent.
Aged pavement testing found the air void content of the surface paving mixture to be 3.4
percent and the air void content of the asphalt stabilized base to be 1.0 percent at the point of field
sampling. Penetration tests of recovered asphalt found the surface course asphalt too soft for a
penetration test and the asphalt stabilized base asphalt to be 184. It is surmised that the pavement
at the point of sampling may have been contaminated in some manner.
The flexible base and the subgrade were sampled and tested and found to have PIs
of 10 and 6, respectively. Field moisture contents were 3 and 10 percent, respectively. The flexible
base was crushed limestone and averaged 4.7 percent passing the No. 200 sieve at the locations of
field sampling.
The GPR colormap from the recent survey shows a uniform profile except for a short
length at the end of the section that indicates potential presence of moisture at the interface
68
between the surface treatment and the asphalt stabilized base. The back-calculated modulus for the
asphalt stabilized base from FWD data is 560 ksi, which is above the typical range for asphalt
treated bases (250 – 400 ksi). The back-calculated modulus for the flexible base is 139 ksi, which
is also above the typical range (40 – 70 ksi) for this type of layer. The back-calculated modulus for
the subgrade is 39 ksi, which is indicative of good subgrade.
Factors likely to be contributing to performance excellence include high quality flexible
base material, quality construction, the robust pavement structure, and good protection of the base
from moisture intrusion resulting from low air void contents in both pavement mixture layers.
US 190 – Brownwood District
This flexible base and surface treatment pavement is somewhat unique in that it was
constructed on top of an existing asphalt concrete pavement. The plans called for 8 inches of
flexible base to be placed on top of the existing pavement, followed by two single surface
treatments. The McCulloch County Area Office was responsible for design and project inspection
of this rural pavement section. Ben E. Dillon was the area engineer. The district engineer was
Lawrence Schulz. The plan notes required that asphalt surface treatment spray nozzles over the
wheel paths be one size smaller than the rest of the nozzles. There was no evidence of wheel path
flushing noted during site visits.
A review of construction testing records showed that the average density achieved in the
flexible base was 106.0 percent. It is likely that the underlying pavement structure provided
greater resistance than is normally available under a flexible base during construction and thereby
allowed particularly effective compaction of the new flexible base.
Pavement cores indicated that two or perhaps three preventative maintenance seal coats
have been placed since pavement construction in 1977. The area office reported that the last seal
coat was placed in 2000. The cores also indicated excellent prime coat penetration into the flexible
base.
The upper flexible base, lower existing flexible base, and the subgrade were sampled and
tested and found to have PIs of 7, 15, and 29, respectively. Moisture contents were 6, 9 and 28
percent, respectively. The upper flexible base was crushed limestone and had 6.5 percent passing
the No. 200 sieve at the location of field sampling. The lower, original flexible base was also
crushed limestone and had 4.6 percent passing the No. 200 sieve at the location of field sampling.

69
The GPR colormap from the recent survey shows a uniform profile except for a short
length at the end of the section that indicates potential presence of moisture at the interface
between the 2–inch asphalt concrete beneath the 4” flexible base. The back-calculated modulus for
the subgrade is 29 ksi, which is an indication of a good subgrade.
Factors likely to be contributing to performance excellence include high quality flexible
base material, the presence of the underlying asphalt mixture layer, quality in construction, and
timely preventative maintenance over the decades, resulting in approximately an inch of asphalt-
rich and impervious asphalt surfacing.
US 287 – Lufkin District
This section of US 287 is between the city of Groveton and the Polk County line. This
pavement structure is somewhat unique in this district in that it includes asphalt stabilized base.
Further, the 8 inches of base is a sand-asphalt used from time to time in the Lufkin District during
this time. The asphalt stabilized base layer is covered with a little over 1 inch of dense-graded
asphalt surface course. Constructed in 1969, this pavement has required minimal maintenance
while holding up very well carrying the logging traffic in the area for over 35 years.
Construction records no longer exist for this pavement. Cores taken from the aged
pavement were laboratory tested to determine possible contributors to the successful performance
of this pavement.
Extraction testing of the cores from the originally placed Type D surface course found an
average asphalt content of 4.2 percent. The recovered asphalt cement was extremely hard,
registering a penetration value of 0. The passing No. 10 sieve amount averaged 38.1 percent, and
the passing No. 200 sieve averaged 6.5 percent. The average air void content in this Type D
pavement layer was 8.7 percent. This layer was found to be stripping in some of the coring
locations.
Testing of the underlying asphalt stabilized base, a sand-asphalt mixture, found the asphalt
content to average 5.5 percent and have a penetration value of 43. The average air void content
found in this sand-asphalt base was 16.4 percent.
The GPR colormap from the recent survey shows a uniform profile, without anomalies,
which is indicative of a good pavement. The back-calculated modulus for the hot asphalt mix layer
from FWD data is 760 ksi, which is above normally expected modulus values for dense hot mix
asphalt layers. The back-calculated modulus for the asphalt stabilized layer is 64 ksi, which is
70
below typical values for this type of layer. These results are influenced by the thickness of the
layers and should be considered as indicative of a robust overall pavement structure rather than as
individual, isolated values. The back-calculated modulus is 45 ksi for the subbase and 10 ksi for
the subgrade.
No core test results particularly stand out as obvious contributors to the long and successful
performance of this pavement. It is theorized that the use of sand-asphalt base, which allowed a
considerably greater depth of asphalt stabilization than normal, provided additional strength as
well as moisture protection of underlying layers.
US 377 – San Angelo District
This section was built in about 1949 when Kimble County was part of the old Del Rio
District. The resident engineer was M. N. Blakaney, and the district engineer was J. A. Waller.
While this pavement structure benefits from good quality subgrade, this section of pavement has
outperformed similar pavements in this area of the state.
No construction testing or pavement design records were still available for this pavement.
The plans were based upon 1938 Texas Highway Department standard specifications. The plans
called for 3 inches of flexible base, and 4.5 inches was found during field sampling. That was the
entire pavement structure under a two-course surface treatment.
While the subgrade was found to be rocky, bedrock was not reached at the three foot
sampling depth at either location that was sampled. The PI of the subgrade was 14 and the field
moisture content was 10 percent. The flexible base layer was found to have a PI of 11 and a
moisture content of 6 percent. The flexible base gradation had 11 percent passing the No. 200
sieve.
The GPR colormap from the recent survey shows a uniform profile. The back-calculated.
modulus for the flexible base layer is 110 ksi, which is higher than typical values for this type of
layer. The back-calculated modulus for the subgrade is 15 ksi, which is considered good.
Considering the thin pavement structure, a primary factor contributing to performance
excellence is the very stable subgrade conditions in the area. Other factors are probably quality
flexible base material, quality in construction, and timely preventative maintenance over the
decades.
71
US 380 – Abilene District This section of US 380 is between the cities of Rule and Haskell. The current pavement
structure is the reconstruction of old SH 24 which was completed in 1966. The pavement structure
includes a 4-inch foundation course followed by 8 inches of flexible base. The wearing surface
placed in 1966 was a two course surface treatment. This pavement has required little maintenance
over the decades. It carries several hundred trucks per day.
Pavement design and construction testing and inspection records no longer exist for this
pavement. However, the area engineer contacted the retired inspector for the project, who recalled
that they had processed the flexible base very wet of its optimum. This was a common and
successful practice at that time.
Pavement cores indicated that four or perhaps five preventative maintenance seal coats
have been placed since pavement construction in 1966. The area office reported that the last seal
coat was placed in 2004 and was grade 3 precoated limestone and AC-15-5TR.
Testing of flexible base and subgrade samples found PIs of 9 and 24, respectively.
Moisture contents were 6 and 14 percent, respectively. The flexible base was crushed limestone
and banded calcite and had a low percentage passing the No. 200 sieve.
The GPR colormap from the recent survey shows a uniform profile. The back-calculated.
modulus for the flexible base layer is 99 ksi, which is higher than typical values for this type of
layer. The back-calculated modulus for the subgrade is 17 ksi, which is considered good.
Factors likely to be contributing to performance excellence include high quality flexible
base material, quality in construction, and timely preventative maintenance over the decades,
resulting in approximately 1.5 inches of asphalt-rich and impervious asphalt surfacing.
US 385 – Odessa District
This pavement demonstrates the excellent performance that is obtainable using rubber
asphalt for pavement rehabilitation. The rehabilitation of US 385 included an asphalt-rubber seal
coat followed by 1 ¾ inches of crumb-rubber asphalt concrete mixture. This pavement is in
outstanding condition after nine years, and it has won a National Quality Award. It was one of the
best appearing pavements seen by the research team even though it had not yet received a
preventative maintenance surface treatment. This project was designed and constructed by the
Odessa Area Office. Dan Dalager was the area engineer.

72
The GPR colormap from the recent survey shows a uniform profile, without anomalies,
which is indicative of a good pavement. The back-calculated modulus for the flexible base layer is
111 ksi, which is a little higher than typical values for this type of layer. The back-calculated
modulus for the subgrade is 32 ksi, which is an indication of good subgrade.
This pavement appears to owe its length of distress-free service in large measure to its high
content of asphalt-rubber binder. The CMHB-F mixture design VMA was 20.8, creating an
optimum asphalt-rubber content of 8.3 percent at 97 percent design density. The paving mixture
also averaged a low 20.2 percent passing No. 10 sieve aggregate during production, creating
exceptional stone-on-stone contact. This heavy asphalt content would provide increased resistance
to oxidative aging and pavement cracking, while the stone skeleton would provide strength.
Another factor is believed to be the impervious layer of surface treatments, including an asphalt-
rubber surface treatment, immediately below the CMHB-F pavement layer. The flexible base and
subgrade are exceptionally well-protected from moisture intrusion. A final note concerning this
pavement is its extraordinarily smooth ride for a pavement of this age, with a 2006 average IRI of
58 and a ride score of 4.5.
SH 21E – Bryan District
This pavement is in the eastbound direction of SH 21 near the Texas A&M University
Riverside Campus in Brazos County. It was constructed by Young Brothers Construction
Company (now Knife River YCI) in 1991 and 1992 when this facility was expanded to become a
four-lane, divided highway. The pavement structure is composed of 8 inches of lime stabilized
subgrade, 15 inches of flexible base, a two-course surface treatment, 1.5 inches of Type D dense-
graded mixture, and 1.5 inches of CMHB surface course. The Bryan Area Office was responsible
for construction inspection. Only preventative maintenance has been required since construction.
Construction records no longer exist for this pavement. Laboratory testing of the cores
taken from the aged pavement found the CMHB asphalt content to average 6.8 percent and have a
penetration value of 36, the passing No. 10 sieve to average 25.7 percent, and the passing No. 200
sieve to average 9.9 percent. The average air void content in the aged CMHB pavement layer was
2.6 percent. Testing of the underlying Type D aged pavement layer found the asphalt content
to average 7.0 percent and have a penetration value of 41, the passing No. 10 to average 39.0
percent, and the passing No. 200 sieve to average 7.0 percent. The average air void content found
in the Type D cores was 3.6 percent.
73
The GPR colormap from the recent survey shows a uniform profile except for a short
length at the end of the section that indicates potential presence of moisture in the interface
between the 2.2-inch dense-graded hot mix layer and the flexible base. The back-calculated
modulus for the CMHB layer from FWD data is 868 ksi, which is slightly above the typical range
for this type of material (650 – 850 ksi). The back-calculated modulus for the flexible base layer is
52 ksi, which is within the range of typical values (40 – 70 ksi) for this type of layer. The back-
calculated modulus for the stabilized subgrade is 219 ksi, which is above typical modulus values
for this type of layer. The back-calculated modulus for the subgrade is very low, 2 ksi, but this
value can not be interpreted independently from the overall analysis, which indicates a sound
pavement structure.
Factors influencing the superior performance of this pavement are believed to be the high
optimum asphalt contents of the mixture designs and excellent pavement air void levels found in
both of the mixture layers. These factors would together limit water penetration and slow asphalt
oxidation, as indicated by the penetration values of recovered asphalt samples. The stone skeleton
of the CMHB mixture design is undoubtedly a factor in providing long term rut resistance. The
result was an almost impervious pavement that would maintain flexibility over an extended period
of time and yet have good resistance to rutting.
SH 121 – Fort Worth District
This 2 inch thickness of Type D asphalt concrete overlay was located on SH 121 between
Loop 820 and SH 183. It was placed in 1986 and removed after lengthy successful performance, at
about the time of its nomination by the district. The underlying pavement is continuously
reinforced concrete. The asphalt overlay mixture contained 3 percent latex-rubber. A fabric
underseal with AC-10 had been placed between the concrete pavement and the overlay. The area
engineer on this project was Robert Julian, and the district engineer was J. R. Stone.
Construction inspection and testing records for this pavement were no longer available.
Although the overlay had been removed, the research team was provided a set of cores taken by
the Fort Worth district just prior to its removal. These were tested by the research team to
determine factors likely to be contributing to the overlay's successful and lengthy performance.
Visual inspection of the cores found the Type D asphalt concrete to be a lightweight
synthetic aggregate mixture. It was also noted that the fabric underseal on the bottom of the cores
appears to have plenty of asphalt cement to render it completely impermeable.

74
Ignition testing of the cores found 8.5 percent by weight asphalt cement, 7.4 percent
passing the No. 200 sieve, and 41.7 percent passing the No. 10 sieve. The average percent air voids
was 3.8 percent after nearly 20 years of service.
The GPR colormap from the recent survey shows a uniform profile without any anomalies.
FWD testing was not conducted on this section since the underlying layer was continuously
reinforced Portland cement concrete.
Factors appearing to contribute to the superior performance obtained from this concrete
pavement overlay are the substantial optimum asphalt content of the mixture design, providing
resistance to cracking and oxidative aging; the latex additive, providing resistance to reflective
cracking from the concrete below; and the presence of an excellent underseal.
SH 152 – Amarillo District
This section of SH 152 is between the City of Borger and the Carson County Line. The
existing roadway was reworked in 1995 and placed again as 10 inches of fly ash treated flexible
base. The new surface course was 1.25 inches of dense-graded asphalt concrete. The district
reports that the 11 year-old pavement has required no maintenance except for a seal coat in
2005. The geography in the area is hilly, with the pavement being constructed over a series of cuts
and fills. The total lack of need for crack sealing and pothole repairs makes this pavement stand
out in performance.
The GPR colormap from the recent survey shows a uniform profile, without anomalies,
which is indicative of a good pavement. The back-calculated modulus for the fly ash stabilized
layer is 116 ksi, which is above typical values for this type of layer (60 – 75 ksi). The back-
calculated modulus for the subgrade is 18 ksi.
The superior performance of this pavement appears to be the result of a combination of
factors, including quality in design and construction, good strength in the fly ash stabilized base,
and excellent base protection from moisture penetration. Moisture penetration protection is
provided by both the Type D asphalt surface mixture and the underseal placed below it.
Excellence in mixture design and construction practice is evidenced by the ideal average air void
level of 3 percent found in the aged surface course.
75
SH 171 – Fort Worth District This pavement section and a section of BIH-35 in Alvarado are the first sections of stone-
matrix asphalt (SMA) placed in the State of Texas. While the Alvarado section placed SMA over
concrete pavement, this SH 171 section placed 1.25 inches of SMA over an existing 10 inches of
cement-treated flexible base. David Bass, the Fort Worth District Laboratory Engineer, and Carl
Utley, the Fort Worth District Construction Engineer, showed early interest in SMA and were
instrumental in bringing this new paving mixture type to Texas. Joe Fossett was the area
engineer.
Construction records no longer exist for this pavement. However, the research supervisor
was employed by TxDOT and was involved with this project in 1992. It is recalled that the SMA
mixture is composed of limestone aggregate, agricultural lime mineral filler, latex-rubber modified
asphalt cement, and cellulose fiber.
Laboratory testing of the cores taken from the aged pavement found the SMA asphalt
content to average 7.8 percent, the passing No. 8 sieve to average only 18.7 percent, and the
passing No. 200 sieve to average 9.2 percent. The average air void content was 3.9 percent after 14
years of service. The subgrade PI was found to be 5.
The GPR colormap from the recent survey shows a uniform profile. The back-calculated
modulus for the SMA layer from FWD data is 511 ksi, which is typical for this type of material
(500 ksi). The back-calculated modulus for the cement-treated base is 210 ksi, which is typical for
this type of layer. The back-calculated modulus for the subgrade is 20 ksi, which is considered
good.
Factors influencing the excellent performance of this pavement are believed to be the high
optimum asphalt content of the SMA mixture design and the relatively low pavement air void
level, which would together serve to limit water penetration and slow asphalt oxidation; a strong
base layer; low PI subgrade; and the stone skeleton of the SMA mixture design providing good
resistance to rutting.
SH 176 – Odessa District
The nominated pavement overlay is on a rural stretch of SH 176 leading up to the New
Mexico state line. Placed in 1997, this two-inch CMHB-F overlay was one of the first latex-
modified asphalt projects in this district. The asphalt was believed to have been produced from

76
Brazilian crude by Koch Asphalt Materials. The underlying pavement had 1.5 inches of dense-
graded mixture over 8.5 inches of flexible base.
The CMHB-F mixture design gradation provided a VMA of 18, well above the required
15, and demanded 6.9 percent design asphalt content. The asphalt content dropped off very little
during construction, averaging 6.6 percent for the project according to the construction inspection
records which were obtained.
While CMHB-F construction test results averaged 7.5 percent pavement air voids, aged
pavement cores found that traffic compaction had reduced pavement air voids to an average of 2.6
percent, with very little variation between that found in wheel paths and between wheel paths. In
addition, the air void level found in the asphalt mixture layer that had been overlaid in 1997
was 3.8 percent air voids, also near ideal for pavement longevity.
Testing of flexible base and subgrade samples found PIs of 16 and 8, respectively. The
flexible base was a combination of limestone and caliche.
The GPR colormap from the recent survey shows a uniform profile. The back-calculated
modulus for the asphalt layers from FWD data is 277 ksi, which is considered low. It is possible
that the back-calculation analysis may be influenced by the presence of the 1-inch layer of multiple
surface treatments between the 1.8 inches of CMHB and the 1.8 inches of dense-graded hot mix
layer. The back-calculated modulus for flexible base is 98 ksi, which is above typical values for
this type of layer. The back-calculated modulus for the subgrade is 12 ksi.
Factors likely to contribute to performance excellence include the ideal level of air voids in
both of the asphalt mixture layers, the high optimum asphalt content of the CMHB-F mixture,
latex modification of the asphalt cement, the low PI subgrade, and the presence of paved shoulders
to impede lateral moisture migration from the pavement edges.
SH 183 – Fort Worth District
This relatively short section of SH 183 in Tarrant County runs between US 80 and IH 30
on the west side of the city of Fort Worth. Construction was completed in 1987, at which time the
existing ACP overlay was removed, a new 8-inch CRCP was placed under the outside lane, and
both lanes of concrete pavement were overlaid with a fabric underseal and 2 inches of a fine,
dense-graded asphalt concrete surface course. The asphalt concrete contained 3 percent latex-
rubber. Harold Oppermann was the area engineer for this project. The district engineer was J. R.
Stone.

77
Construction inspection and testing records for this pavement were no longer available.
Visual inspection of the cores found the Type D asphalt concrete to be a crushed stone aggregate
mixture. It was also noted that the fabric underseal on the bottom of the cores appears to be well-
bonded and has plenty of asphalt cement to render it completely impermeable.
Ignition testing of the cores found 6.2 percent asphalt cement, 5.1 percent passing the No.
200 sieve, and 35.7 percent passing the No. 10 sieve. The average percent air voids was 7.3
percent after nearly 20 years of service, which is higher than normally expected.
The GPR colormap from the recent survey shows a uniform profile, without anomalies.
FWD testing was not conducted on this section since the underlying layer was continuously
reinforced Portland cement concrete.
Factors appearing to contribute to the superior performance obtained from this concrete
pavement overlay are the rather high optimum asphalt content, providing resistance to cracking
and oxidative aging; the latex additive, providing resistance to reflective cracking from the
concrete below; and the presence of a good underseal.
FM 1472 – Laredo District
This pavement carries extremely heavy truck traffic due to proximity to a large
warehousing area and an international border crossing on the outskirts of the City of Laredo. It has
required lane expansion and structural capacity increases on numerous occasions over the past 20
years. The two-inch Superpave overlay was placed in 2001 over a pavement composed of 5 inches
of dense-graded asphalt mixture, 12 inches of flexible base, and 8 inches of lime stabilized
subgrade. The overlay has withstood the extreme truck traffic and high temperature environment
very well.
The Superpave mixture design showed a VMA of 17.5, well above the specified 15 percent
minimum. The optimum asphalt content was shown to be 5.2 percent. Construction records
indicate that the asphalt content during construction averaged 5.2 percent, right on the mixture
design amount. Tests of aged pavement cores found 5.4 percent asphalt content. The closeness of
these results is an indication of quality in plant production and construction.
Construction test results averaged 6.6 percent pavement air voids. The several locations
which were cored during this study averaged 7.3 percent air voids. This indicates that the mixture
is abnormally resistant to increased densification under traffic. The openness and toughness of this
mixture, after six years of extremely heavy truck traffic, is indication that the design asphalt

78
content may have been somewhat under the ideal optimum for the gradation being provided.
However, while this layer is likely to be somewhat pervious, that characteristic may be of minimal
importance considering the dryness of the local climate. The long term resistance of the pavement
to cracking, stemming in part from oxidative hardening of the asphalt cement, remains to be seen.
The GPR colormap from the recent survey shows a uniform profile. The back-calculated
modulus for the asphalt layer from FWD data is 1,033 ksi, which is very high when compared to
typical modulus values. The back-calculated modulus for the flexible base is 105 ksi, which is also
above typical values for this type of layer. The back-calculated modulus for the lime-stabilized
sub-base is 221 ksi, which is above typical modulus values for this type of layer. The back-
calculated modulus for the subgrade is 31 ksi.
Factors likely to be contributing to performance excellence include the toughness of the
pavement mixture, stemming from the stone on stone contact provided by the Superpave mixture
design, and quality in construction.
FM 1585 – Lubbock District
This section of FM 1585 is between US 87 and US 84 just south of the City of Lubbock. It
has been in service since reconstruction in 1986. The pavement structure includes the use of
salvaged flexible base from the old pavement, followed by 5.5 inches of new flexible base. The
pavement was surfaced with a two-course surface treatment when reconstructed.
As an older pavement, pavement design and construction testing and inspection
records were no longer available. Pavement cores indicate that only two preventative maintenance
seal coats have been placed since original construction. District maintenance records show that an
AC-20-5TR seal coat was placed in 2005.
Testing of flexible base and subgrade samples found PIs of 20 and 10, respectively.
Moisture contents were found to be 6 and 10 percent, respectively. The flexible base was caliche.
The lower PI of the subgrade appears due to its sandy composition.
The GPR colormap from the recent survey shows a uniform profile. The back-calculated
modulus from FWD data for the flexible base is 47 ksi, which is within the range of typical
modulus values for this type of layer (40-70 ksi). The back-calculated modulus for the subgrade is
15 ksi.

79
Factors likely to contribute to performance excellence include the low PI subgrade, quality
in construction, and the presence of paved shoulders to impede lateral moisture migration from the
pavement edges.
FM 2771 – San Antonio District
This thin rural pavement has performed extraordinarily well for over 40 years. The 6-inch
flexible base was treated with EA-HVMS prior to placement of the one-course surface treatment.
Pavement design and construction testing and inspection records no longer exist. Pavement
cores indicated that about a half dozen preventative maintenance seal coats have been placed
since construction. The area office reported that the last seal coat was placed in 2002.
Testing of flexible base and subgrade samples found PIs to be 7 for both materials.
Moisture contents were 4 and 10 percent, respectively. The flexible base was predominantly
crushed limestone river gravel and had only 4 percent passing the No. 200 sieve at the location
sampled.
The GPR colormap from the recent survey shows a uniform profile. The back-calculated
modulus from FWD data for the flexible base is 57 ksi, which is within the range of typical
modulus values for this type of layer (40-70 ksi). The back-calculated modulus for the subgrade is
12 ksi.
Factors likely to contribute to performance excellence include high quality flexible base
material, quality in construction, stable subgrade, and timely preventative maintenance over the
decades, resulting in approximately 1.5 inches of asphalt-rich and impervious asphalt surfacing.
FM 2828 – San Antonio District
This thin rural pavement has performed extraordinarily well for over 37 years. It is
composed of approximately 6 inches of flexible base and was originally surfaced with a two
course surface treatment. The surface of the flexible base was treated with EA-HVMS prior to
placement of the two-course surface treatment.
Being constructed in 1969, pavement design and construction testing and inspection
records no longer exist. Pavement cores indicated that three or four preventative maintenance seal
coats have been placed since construction. The area office reported that the last seal coat was
placed in 2003.
80
Testing of flexible base and subgrade samples found PIs of 11 and 10, respectively.
Moisture contents were 5 and 16 percent, respectively. The flexible base was crushed limestone
river gravel and had only 5 percent passing the No. 200 sieve at the location sampled.
The GPR colormap from the recent survey shows a uniform profile. The back-calculated
modulus from FWD data for the flexible base is 47 ksi, which is within the range of typical
modulus values for this type of layer (40-70 ksi). The back-calculated modulus for the subgrade is
18 ksi.
Factors likely to contribute to performance excellence include high quality flexible base
material, quality in construction, and timely preventative maintenance over the years, resulting in
approximately 1.25 inches of asphalt-rich and impervious asphalt surfacing.
FM 3223 – Waco District
This section of FM 3223 serves the industrial area of Waco. Truck traffic is moderate to
heavy, with considerable stopping, starting, and turning at several signalized intersections. The
1.25 inches of Type D overlay placed in 1992 has performed far beyond normal expectations under
these traffic conditions. It was placed over an existing 1.25 inch thick dense-graded mixture and 10
inches of flexible base.
Construction records no longer exist for this pavement. Laboratory testing of the cores
taken from the aged pavement found the Type D overlay asphalt content to average 5.7 percent
with a penetration value of 56, the passing No. 10 sieve to average 45.6 percent, and the passing
No. 200 sieve to average a low 1.6 percent. The average air void content in the aged overlay was
4.8 percent.
The older, underlying pavement layer was also cored and tested. It was found to be a Type
D mixture with 5.4 percent asphalt content, and the asphalt was still at a surprisingly good
penetration value of 61.
The relatively high asphalt content, apparently made possible by the low amount of passing
No. 200 sieve aggregate in the mixture, appears to be a factor influencing the superior performance
of this pavement overlay. Beyond the uncharacteristically low passing No. 200 percentage and
healthy asphalt content, this pavement layer appears pretty average.
The GPR colormap from the recent survey shows a uniform profile. The back-calculated
modulus for the flexible base is 39 ksi, which is slightly below the lower limit of expected
81
modulus values for this type of layer (40-70 ksi). The back-calculated modulus for the subgrade is
15 ksi.
Timely maintenance sealing over the years is likely also a factor in this pavement's
resistance to oxidative hardening of the asphalt cement. However, for whatever the reasons it has
occurred, the lack of oxidation of the asphalt cement and the pavement's successful resistance to
rutting bode well for continued service despite the overlay's 16 year age.
FM 3492 – Wichita Falls District
In 1996, the existing flexible pavement was reworked, spread to cover the expanded
roadway width, and compacted to form a 2-inch flexible base layer. Ten inches of new flexible
base and a two-course surface treatment followed. This reconstructed rural pavement section was
designed and constructed by the Wichita Falls Area Office.
Construction testing and inspection records were no longer available for this
pavement. District maintenance records show that a preventative maintenance seal coat was placed
in 2001.
Testing of flexible base and subgrade samples found PIs of 11 and 12, respectively.
Moisture contents were found to be 4 and 10 percent, respectively. The flexible base was crushed
fossiliferous limestone and contained less than 5 percent passing No. 200 sieve material at the
location of field sampling.
The GPR colormap from the recent survey shows a uniform profile. The back-calculated
modulus from FWD data for the flexible base is 48 ksi, which is within the range of typical
modulus values for this type of layer (40-70 ksi). The back-calculated modulus for the subgrade is
9 ksi.
Factors likely to contribute to performance excellence include high quality flexible base
material, quality in construction, and timely preventative maintenance.
SH 6 – Houston District
This section of SH 6 is located immediately north of Hempstead. It was constructed in
1985 in the process of expanding the highway to a divided four-lane facility. The new roadbed is
composed of two 1.5 inch dense-graded mixture layers above 12 inches of asphalt stabilized base
above 6 inches of flexible base. This new roadbed has performed exceptionally well. A single
surface treatment and porous friction course were placed in 2005 to restore skid properties.

82
Construction records no longer exist for this pavement. Cores taken from the aged
pavement were laboratory tested to determine possible contributors to the successful performance
of this pavement.
Extraction testing of the cores from the top layer of Type D asphalt concrete found an
average asphalt content of 5.7 percent and a penetration value for the recovered asphalt of 64. The
passing No. 10 sieve amount averaged 34.9 percent, and the passing No. 200 sieve averaged 3.3
percent. The average air void content in the upper Type D pavement layer was 6.4 percent.
Testing of the underlying Type D aged pavement layer found the asphalt content to average
5.1 percent and have a penetration value of 111, the passing No. 10 to average 45.9 percent, and
the passing No. 200 sieve to average 4.4 percent. The average air void content found in the Type D
lower course was 6.6 percent.
The asphalt stabilized base had an asphalt content of 4.3 percent, and the penetration value
of the recovered asphalt was 84.
The GPR colormap from the recent survey shows a uniform profile. A blue trace was noted
at a depth of approximately six inches, which coincides with the depth where the cores tended to
break during the coring operation. However, no stripping was noted during the core examination in
the laboratory. The back-calculated modulus for the asphalt layers from FWD data is 165 ksi,
which is below the typical value. The back-calculated modulus for the asphalt stabilized base layer
is 829 ksi, which is higher than typical values (250-400 ksi). The back-calculation analysis may be
influenced by the pavement structure, which in addition to the stabilized base, has a cement-treated
subgrade below. Also, the presence of the porous friction riding course may be factor as well.
Considering the porous friction course, asphalt dense layers, and asphalt stabilized base as a
whole, we think that the back-calculated modulus reflects a sound structural layer. The back-
calculated modulus for the cement-treated stabilized layer is 67 ksi, which is considered above the
typical range for this type of layer (30 – 45 ksi). The back-calculated modulus for the subgrade is
21 ksi, which is considered good.
The only test results which particularly stand out are the high penetration values of the
asphalt cement in each of the pavement layers placed in 1985. The asphalt cement is seen to have
resisted oxidative hardening, thereby keeping the layers flexible enough to resist the pavement
cracking that would have otherwise been expected.

83
ANALYSES OF GROUPS OF SIMILAR PAVEMENTS
The research team evaluated test results from groups of the same and similar pavement
layer types whenever adequate data existed. While an inadequate number of replicates of any given
pavement type exists to support specification change recommendations at this time, the evaluations
of aggregated test results from groups of same and similar pavement types do provide valuable
indications of specification performance as well as generally increase knowledge about desirable
characteristics in flexible pavements.
The evaluation methods below also establish an approach and framework for continued,
more intensive and more conclusive evaluations of specification requirements in the future, when
additional pavement data sets should be available in the database.
Pavement Air Voids in All Types of Dense Asphalt Paving Mixtures
The cored pavements for this project contained 30 different asphalt pavement layers
designed to have optimally low air voids throughout their service lives. Of these, 7 were of
unconfirmed mix type, although very likely dense-graded mixes; 17 were dense-graded mixes;
3 were CMHB mixes; 2 were SMA mixes; and there was 1 Superpave mix. Several of these layers
are below particularly successful overlays, which were the primary focus of the evaluations being
performed. However, basic testing was performed on these underlying layers in hopes of further
enhancing project findings.
Several interesting observations may be made about the levels of air voids found in these
successfully performing pavement layers after years of traffic compaction. Figure 29 shows the
frequency distribution of pavement air void average values as found in the 30 dense asphalt
pavement layers that were cored and tested. The data show an apparent skew toward the 3 to
4 percent air void levels. It is noteworthy that this has been the targeted design air void level in
Texas for many decades. However, there also appears to be a secondary factor involved with the
data distribution, as a second peak in the distribution curve is noted in the 6 to 7 percent air void
range.
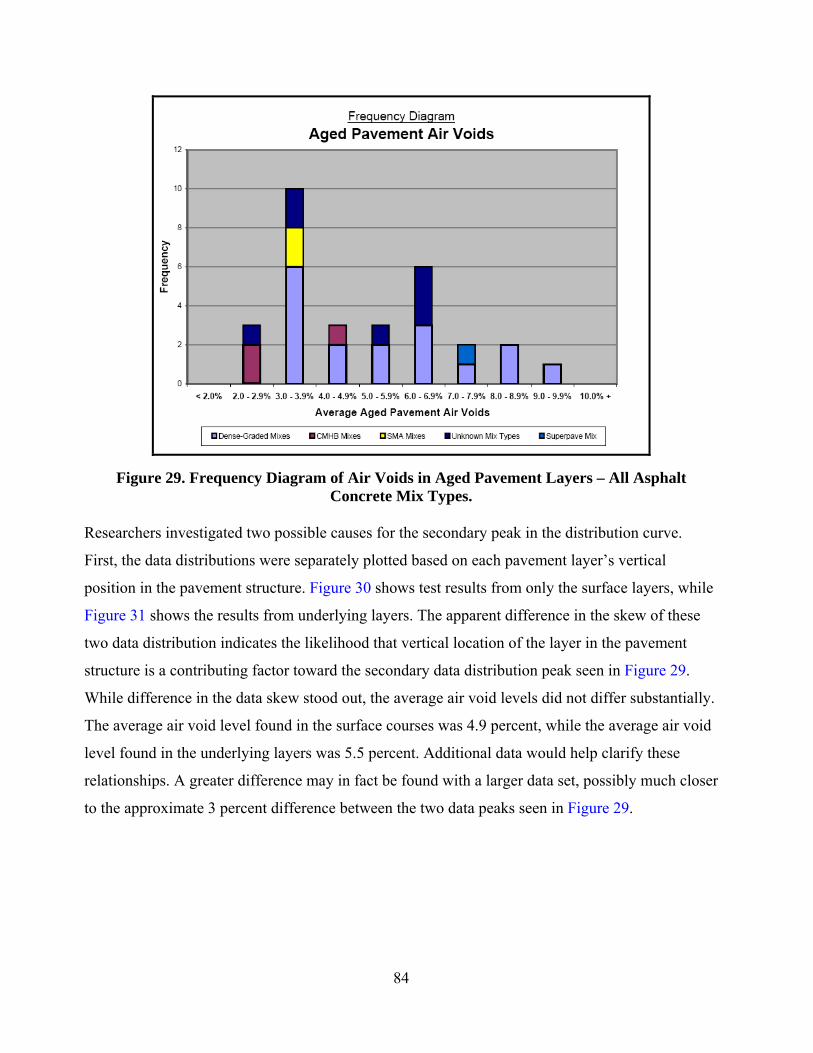
84
Figure 29. Frequency Diagram of Air Voids in Aged Pavement Layers – All Asphalt Concrete Mix Types.
Researchers investigated two possible causes for the secondary peak in the distribution curve.
First, the data distributions were separately plotted based on each pavement layer’s vertical
position in the pavement structure. Figure 30 shows test results from only the surface layers, while
Figure 31 shows the results from underlying layers. The apparent difference in the skew of these
two data distribution indicates the likelihood that vertical location of the layer in the pavement
structure is a contributing factor toward the secondary data distribution peak seen in Figure 29.
While difference in the data skew stood out, the average air void levels did not differ substantially.
The average air void level found in the surface courses was 4.9 percent, while the average air void
level found in the underlying layers was 5.5 percent. Additional data would help clarify these
relationships. A greater difference may in fact be found with a larger data set, possibly much closer
to the approximate 3 percent difference between the two data peaks seen in Figure 29.

85
Figure 30. Frequency Diagram of Air Voids in Asphalt Concrete Pavement Surface Layers.
Figure 31. Frequency Diagram of Air Voids in Underlying Asphalt Concrete Pavement Layers.
The difference in air void levels between surface courses and underlying layers was not
surprising, as temperatures in underlying layers will have been lower over the lives of these aged

86
pavements, thereby keeping the viscosity of the asphalt binder higher in the lower layers, which in
turn increases their resistance to densification under traffic.
This difference does, though, raise the question if the department would benefit by
increasing the target mix design density by a small amount, perhaps 0.5 percent, to pavement
layers at least 2 or 3 inches below the riding surface. The potential gain in that specification
adjustment would be to increase cracking resistance while slightly decreasing porosity in
underlying pavement layers. The data in this project are inadequate by itself to justify that
recommendation, however. A much larger data set, and that data set composed of randomly
selected pavements, should be evaluated to better assess the likelihood that the additional asphalt
binder that would go into underlying layers might push these pavement layers, as a group, too
close to the point of instability, thereby allowing normal mix plant production variation in asphalt
content to cause performance problems.
The second possible cause for the secondary peak in the data distribution that was
investigated was the variation in transverse coring location on the pavement. Test results from
cores located in the wheel path and test results from cores located between wheel paths, at the
same pavement locations, are shown in Figure 32 and Figure 33, respectively. While the cores
taken between wheel paths were expected to have higher air voids than the cores taken from the
wheel path at the same pavement location, the difference was rather small, with the wheel path
cores from all pavements averaging 4.9 percent air voids and between wheel path cores from all
pavements averaging 5.8 percent air voids. This difference is enough to indicate that transverse
coring location may be a minor contributing factor toward the dual data distribution peaks seen in
Figure 29. It is noted that this difference is considerably less than the difference often found in
pavements performing poorly enough to be the subject of a forensic pavement study. The lack of
difference is seen as a mark of good laboratory mixture design, plant production, and pavement
construction practices in this group of particularly successful flexible pavements.
With the secondary peak in the data distribution explained to a reasonable degree of
assurance, the skew toward the 3 to 4 percent air void range becomes more notable as evidence
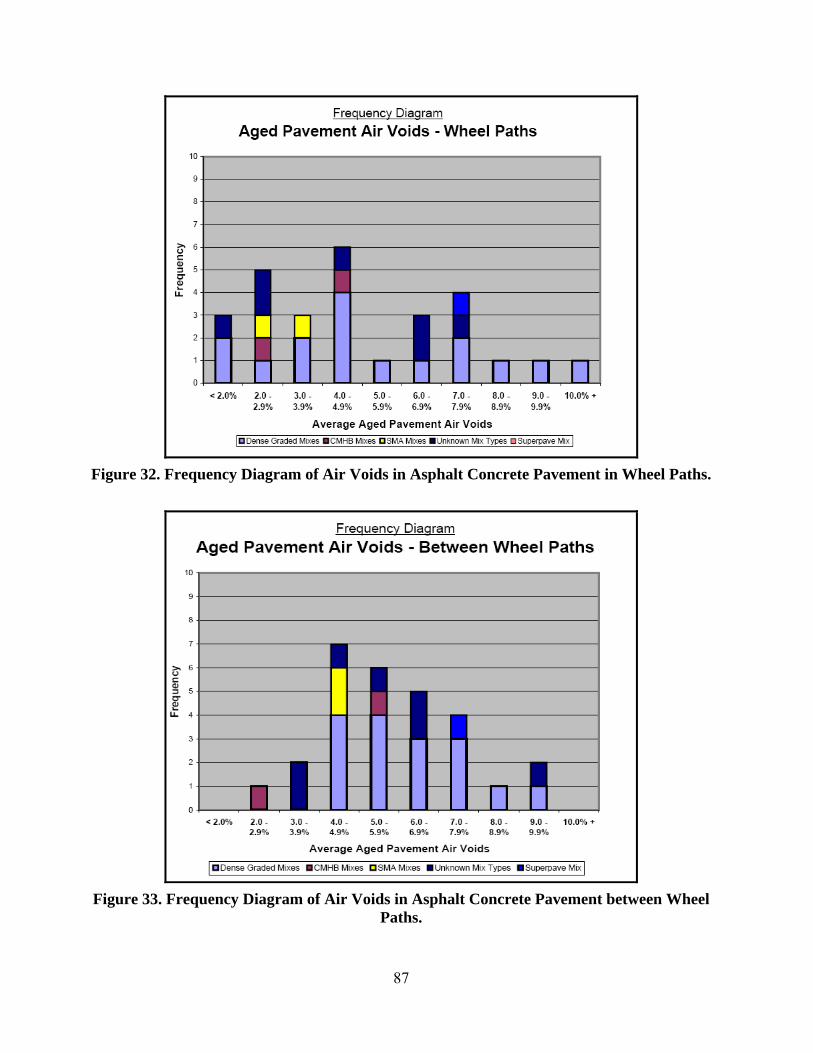
87
Figure 32. Frequency Diagram of Air Voids in Asphalt Concrete Pavement in Wheel Paths.
Figure 33. Frequency Diagram of Air Voids in Asphalt Concrete Pavement between Wheel Paths.

88
that department mixture design and job control laboratory compaction methods over the decades,
with the Texas gyratory compactor, has provided an excellent approximation of ultimate traffic
densification of pavement layers, particularly in surface courses.
Dense-Graded Asphalt Paving Mixtures
Construction inspection gradation test results were located for two Type D and three
Type C dense-graded asphalt pavements. The average job control gradations determined at the mix
plants during production on these projects are shown on Figure 34 and Figure 35, which also
display current specification upper and lower gradation requirements for these two mixture types.
It is apparent that specification requirements have changed over the years, as occasionally these
average gradations are outside of current specification requirements.
Gradation data from a considerably higher number of pavements would be necessary to
allow identification of frequently occurring gradation characteristics, which in turn could lend
insight for future specification revisions. The Texas Successful Flexible Pavements web site and
Figure 34. Power 45 Average Construction Job Control Gradations – Type D Mixes.

89
Figure 35. Power 45 Average Construction Job Control Gradations – Type C Mixes.
database will facilitate the gathering of the additional data needed to better evaluate gradation and
numerous other flexible pavement construction specification requirements.
Historically, TxDOT had utilized a minimum asphalt requirement to assure adequate binder
and film thickness in asphalt paving mixtures. Since about 1992, minimum requirements for voids-
in-the-mineral-aggregate have indirectly established the minimum amounts of asphalt binder to
include in asphalt paving mixtures.
As older pavements tended to provide the best examples of particularly well-performing
flexible pavements, most of the dense-graded pavement layers selected for evaluation were
constructed prior to VMA specification requirements. However, the average asphalt contents
found by extraction or ignition oven testing of pavement cores indicate that selected pavements
generally had asphalt contents well above the minimum asphalt contents in specifications, thereby
indicating generally higher VMAs as well. Unfortunately, specifically corresponding VMAs for
these older pavement mixtures cannot be determined from core tests. Table 18 shows asphalt
contents as measured in core samples of Type D and Type C dense-graded pavement layers.
Table 19 includes mixture design VMA results for the two pavements where that information was
available. The core asphalt content of 5.7 percent and mix design VMA value of 14 for the Type C

90
mixture placed on IH 30 do not appear to correlate. A review of the construction records found that
indeed the mix design asphalt content had been 4.7 percent, which is more in line with the mix
design VMA of 14.
Table 18. Asphalt Contents from Cores – Dense-Graded Mixes.
Asphalt Content, % by Weight Highway Designation Type D Type C
IH 20 (WB lanes only) - 4.2
IH 30 - 5.7
US 59 4.4 4.4
US 67 6.1 -
SH 21 (EB lanes only) 7.0 -
SH 183 6.2 -
SH 6 5.7 & 5.1 -
US 287 4.2 -
IH 10 7.0 -
FM 3223 5.7 & 5.4 -
Average 5.7 4.8 1982 Spec
Minimum % 4.0 3.5
Table 19. VMAs from Construction Records – Dense-Graded Mixes.
Mix Design VMA Highway Designation Type C
IH 20 (WB lanes only) 15
IH 30 14
Coarse-Matrix High-Binder Paving Mixtures
Construction inspection gradation test results were located for two CMHB asphalt
pavement mixtures, both of them being CMHB-F mixture types. Figure 36 shows the average job

91
control gradations determined at the mix plants during production on these projects, which also
displays current specification upper and lower gradation requirements for CMHB-F mixtures.
Figure 36. Power 45 Average Construction Job Control Gradations – CMHB-F Mixes.
Stone-Matrix Asphalt Paving Mixtures
No construction inspection records were still available for the two SMA pavements
included in the database. It is recommended that a number of well-performing SMA pavements be
identified for which construction records exist so that trends in data can be analyzed and compared
to current construction specification criteria for this mixture type.
Figure 30 shows that both SMA pavements included in the database were found to have
near ideal air void levels after approximately 14 years of service. It should also be mentioned that
these two pavements were constructed on the same project, but on different highways with widely
varying underlying pavement types.
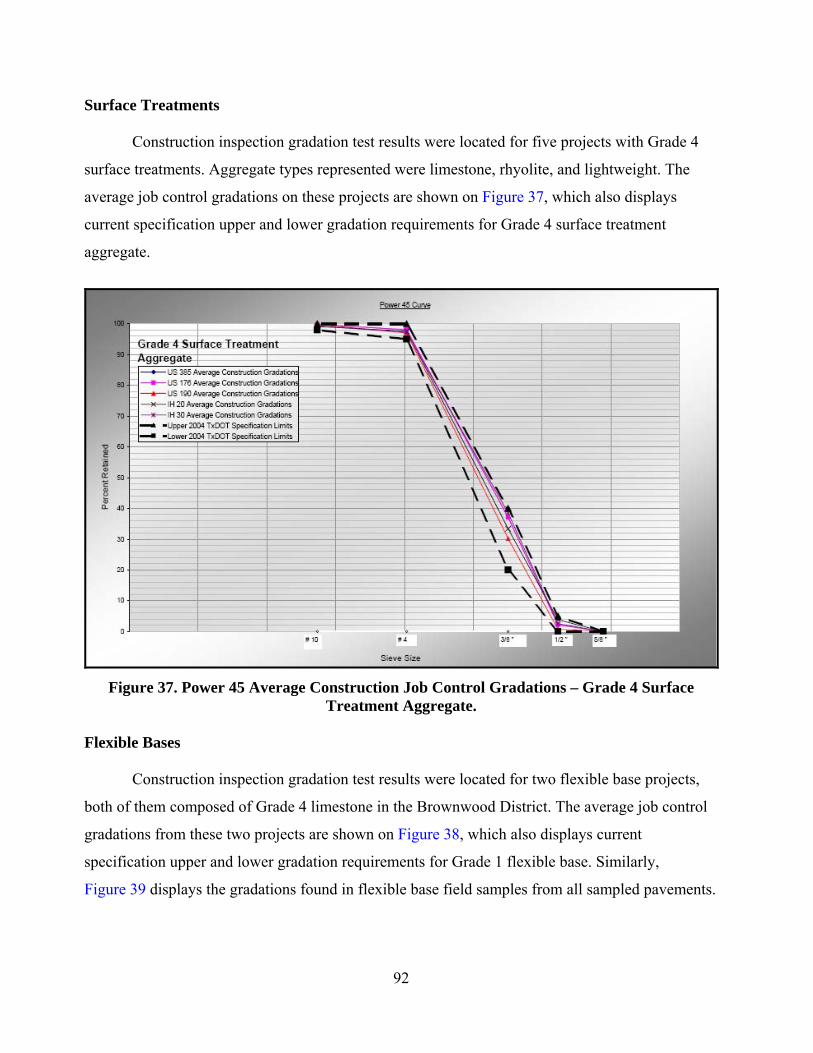
92
Surface Treatments
Construction inspection gradation test results were located for five projects with Grade 4
surface treatments. Aggregate types represented were limestone, rhyolite, and lightweight. The
average job control gradations on these projects are shown on Figure 37, which also displays
current specification upper and lower gradation requirements for Grade 4 surface treatment
aggregate.
Figure 37. Power 45 Average Construction Job Control Gradations – Grade 4 Surface
Treatment Aggregate.
Flexible Bases Construction inspection gradation test results were located for two flexible base projects,
both of them composed of Grade 4 limestone in the Brownwood District. The average job control
gradations from these two projects are shown on Figure 38, which also displays current
specification upper and lower gradation requirements for Grade 1 flexible base. Similarly,
Figure 39 displays the gradations found in flexible base field samples from all sampled pavements.
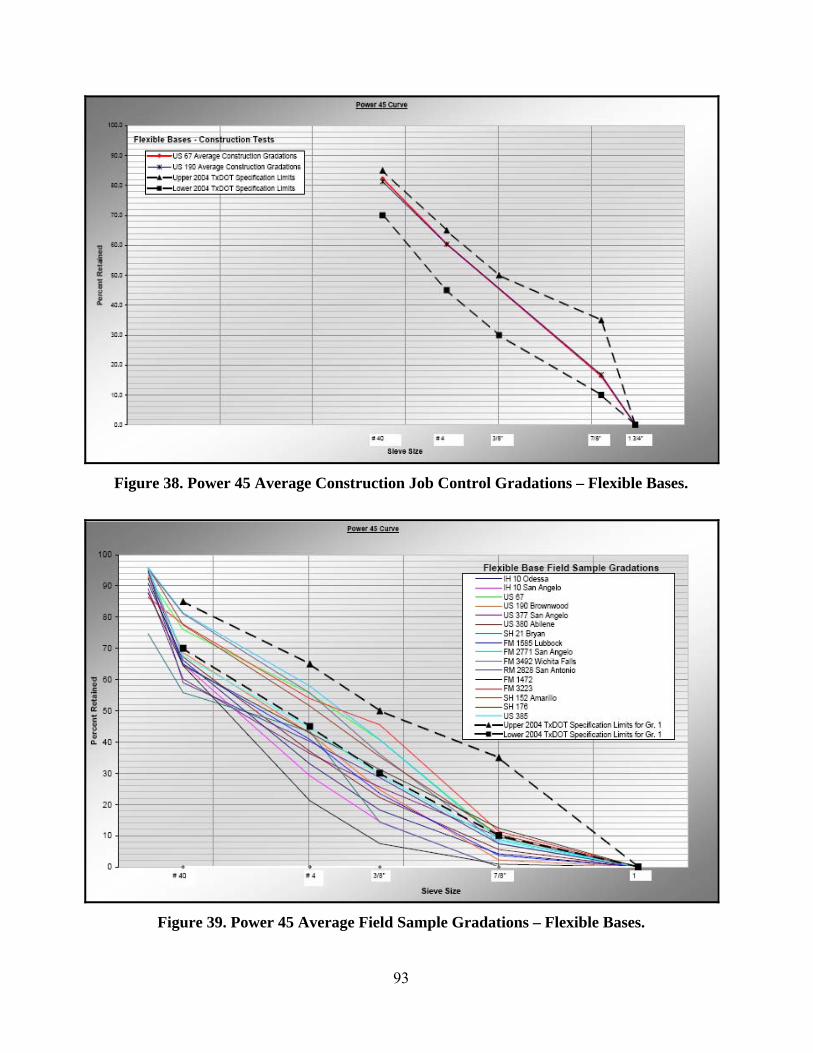
93
Figure 38. Power 45 Average Construction Job Control Gradations – Flexible Bases.
Figure 39. Power 45 Average Field Sample Gradations – Flexible Bases.
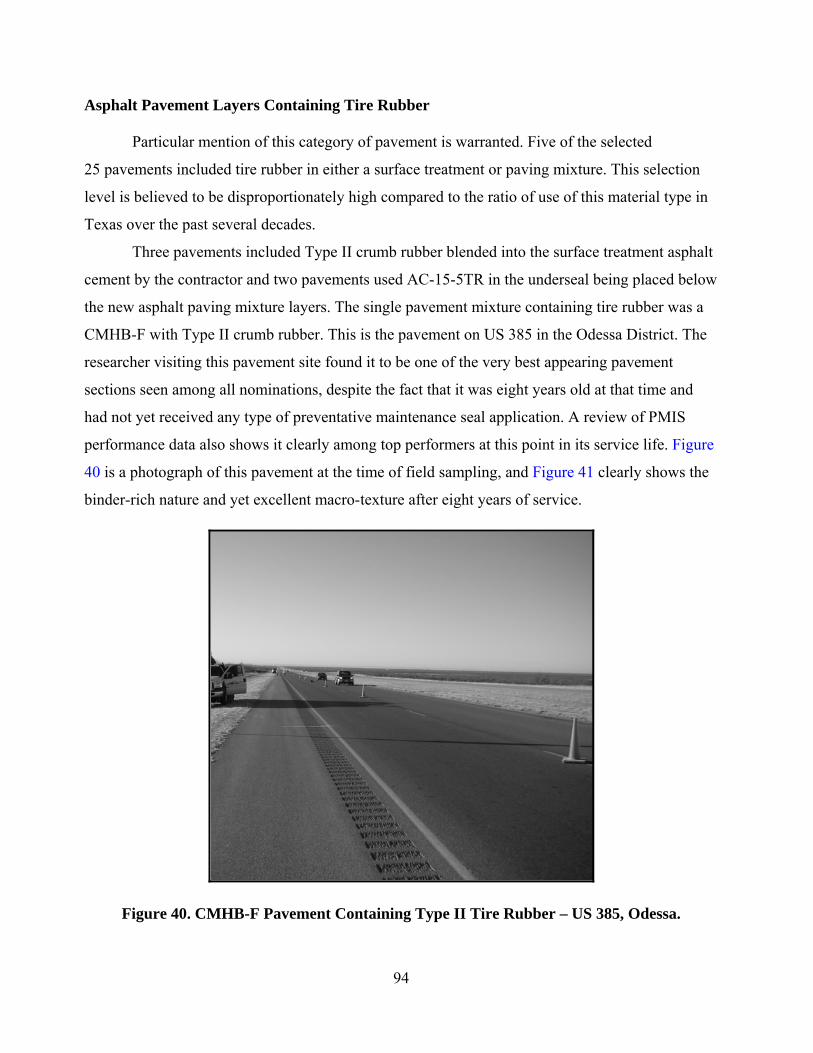
94
Asphalt Pavement Layers Containing Tire Rubber Particular mention of this category of pavement is warranted. Five of the selected
25 pavements included tire rubber in either a surface treatment or paving mixture. This selection
level is believed to be disproportionately high compared to the ratio of use of this material type in
Texas over the past several decades.
Three pavements included Type II crumb rubber blended into the surface treatment asphalt
cement by the contractor and two pavements used AC-15-5TR in the underseal being placed below
the new asphalt paving mixture layers. The single pavement mixture containing tire rubber was a
CMHB-F with Type II crumb rubber. This is the pavement on US 385 in the Odessa District. The
researcher visiting this pavement site found it to be one of the very best appearing pavement
sections seen among all nominations, despite the fact that it was eight years old at that time and
had not yet received any type of preventative maintenance seal application. A review of PMIS
performance data also shows it clearly among top performers at this point in its service life. Figure
40 is a photograph of this pavement at the time of field sampling, and Figure 41 clearly shows the
binder-rich nature and yet excellent macro-texture after eight years of service.
Figure 40. CMHB-F Pavement Containing Type II Tire Rubber – US 385, Odessa.

95
Figure 41. CMHB-F Pavement Macro-Texture – US 385, Odessa. PAVEMENT MODULUS DATA COLLECTION
Modulus values associated with most of the 25 pavements were obtained through field
testing. Researchers performed DCP testing of pavements that did not include underlying Portland
cement concrete, and TxDOT performed FWD testing in support of this project on 23 of the
pavements. Table 20, below, shows average modulus values determined from all dense-graded
asphalt mixture pavement layers, all flexible base layers, and all of the subgrades, as determined
by both field test methods. These average values are compared to the ranges and typical values for
these layer types found in the TxDOT Pavement Design Guide. Table 21 includes modulus values
back-calculated from FWD test results for all tested pavements. Table 22 includes modulus values
determined from DCP testing for all tested pavements.
Table 20. Average Field Test Moduli Compared to Typical Design Moduli.
Pavement Layer Type
Typical Design Modulus, ksi *
Average FWD Modulus, ksi
Average DCP Modulus, ksi
Dense-Graded Hot Asphalt Mixture 500 478 -
Flexible Base 40 - 70 86 41
Subgrade 8 - 20 23 27
* From Pavement Design Guide, Texas Department of Transportation.
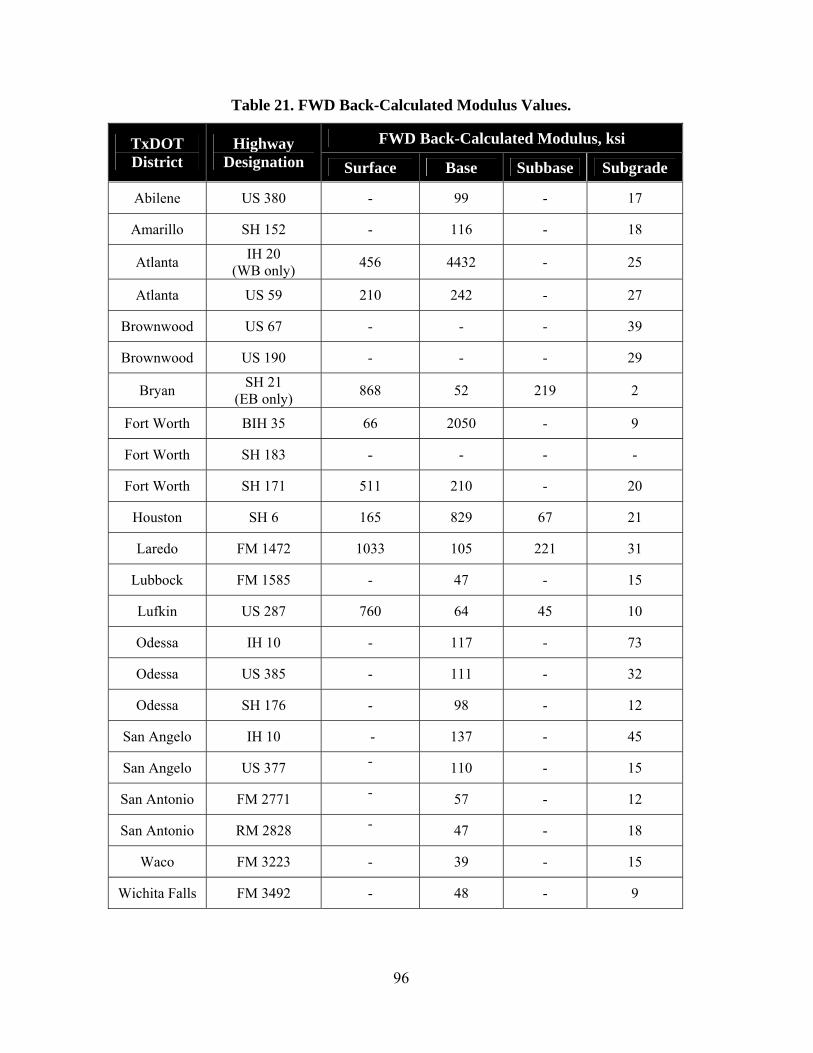
96
Table 21. FWD Back-Calculated Modulus Values.
FWD Back-Calculated Modulus, ksi TxDOT District
Highway Designation Surface Base Subbase Subgrade
Abilene US 380 - 99 - 17
Amarillo SH 152 - 116 - 18
Atlanta IH 20 (WB only) 456 4432 - 25
Atlanta US 59 210 242 - 27
Brownwood US 67 - - - 39
Brownwood US 190 - - - 29
Bryan SH 21 (EB only) 868 52 219 2
Fort Worth BIH 35 66 2050 - 9
Fort Worth SH 183 - - - -
Fort Worth SH 171 511 210 - 20
Houston SH 6 165 829 67 21
Laredo FM 1472 1033 105 221 31
Lubbock FM 1585 - 47 - 15
Lufkin US 287 760 64 45 10
Odessa IH 10 - 117 - 73
Odessa US 385 - 111 - 32
Odessa SH 176 - 98 - 12
San Angelo IH 10 - 137 - 45
San Angelo US 377 - 110 - 15
San Antonio FM 2771 - 57 - 12
San Antonio RM 2828 - 47 - 18
Waco FM 3223 - 39 - 15
Wichita Falls FM 3492 - 48 - 9
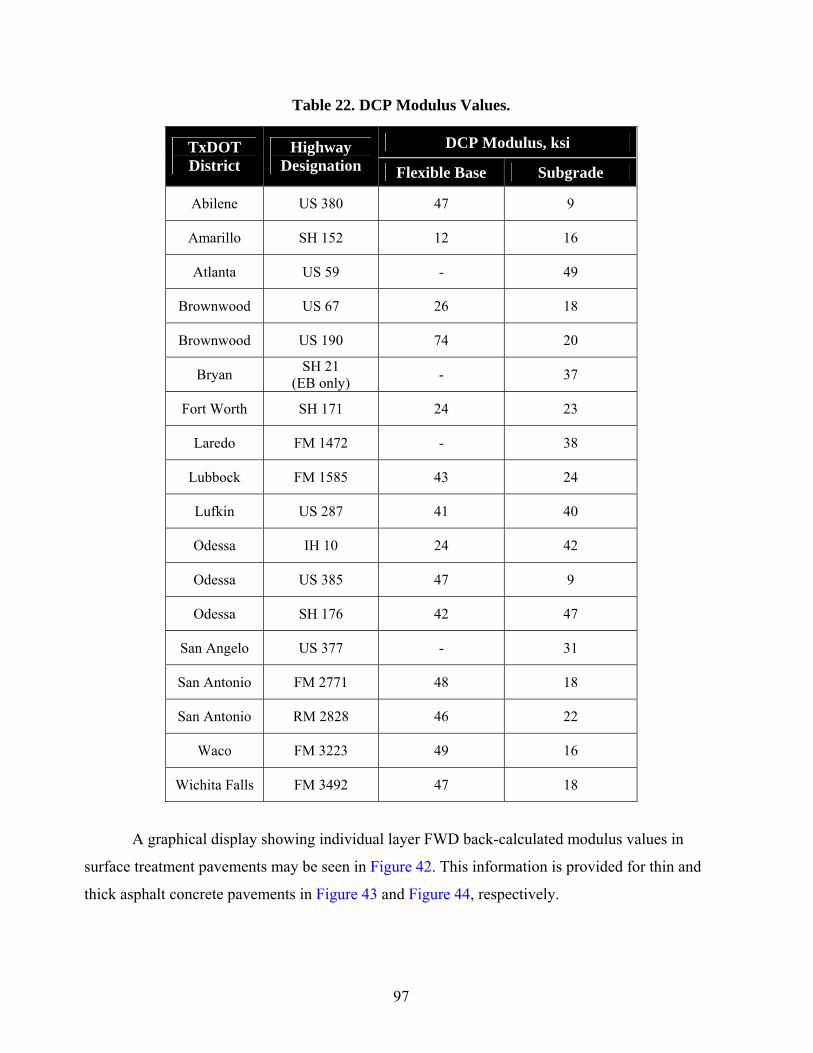
97
Table 22. DCP Modulus Values.
DCP Modulus, ksi TxDOT District
Highway Designation Flexible Base Subgrade
Abilene US 380 47 9
Amarillo SH 152 12 16
Atlanta US 59 - 49
Brownwood US 67 26 18
Brownwood US 190 74 20
Bryan SH 21 (EB only) - 37
Fort Worth SH 171 24 23
Laredo FM 1472 - 38
Lubbock FM 1585 43 24
Lufkin US 287 41 40
Odessa IH 10 24 42
Odessa US 385 47 9
Odessa SH 176 42 47
San Angelo US 377 - 31
San Antonio FM 2771 48 18
San Antonio RM 2828 46 22
Waco FM 3223 49 16
Wichita Falls FM 3492 47 18
A graphical display showing individual layer FWD back-calculated modulus values in
surface treatment pavements may be seen in Figure 42. This information is provided for thin and
thick asphalt concrete pavements in Figure 43 and Figure 44, respectively.
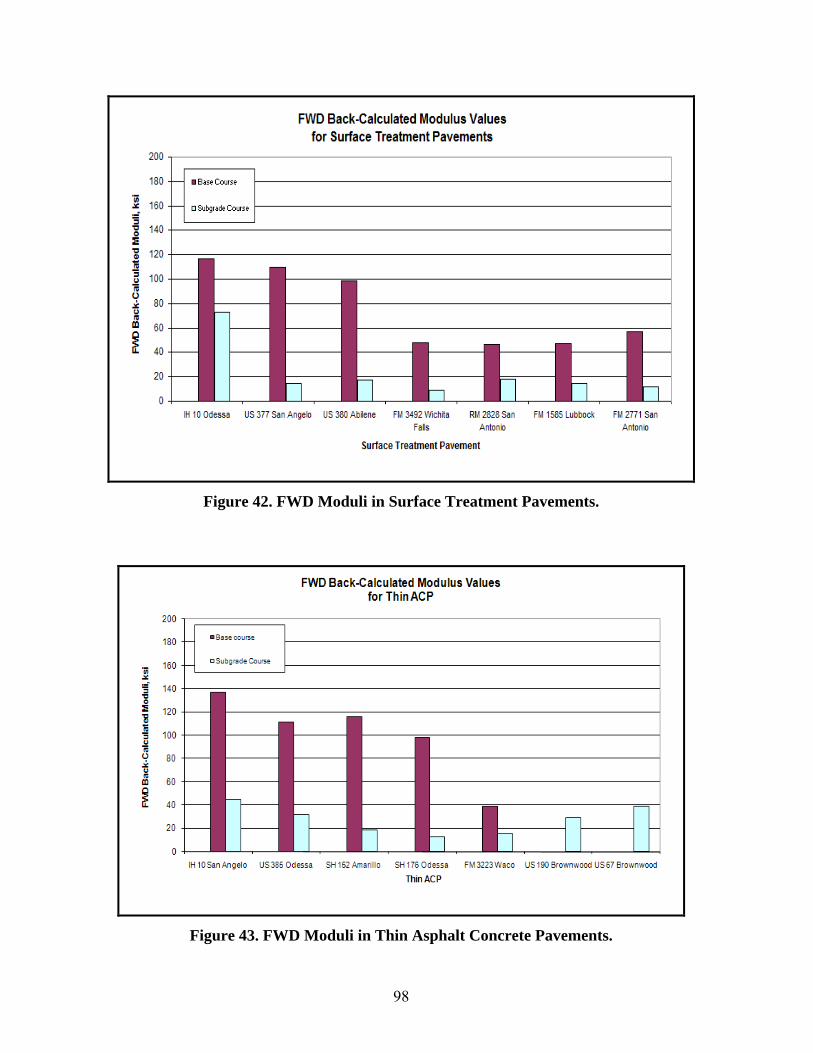
98
Figure 42. FWD Moduli in Surface Treatment Pavements.
Figure 43. FWD Moduli in Thin Asphalt Concrete Pavements.
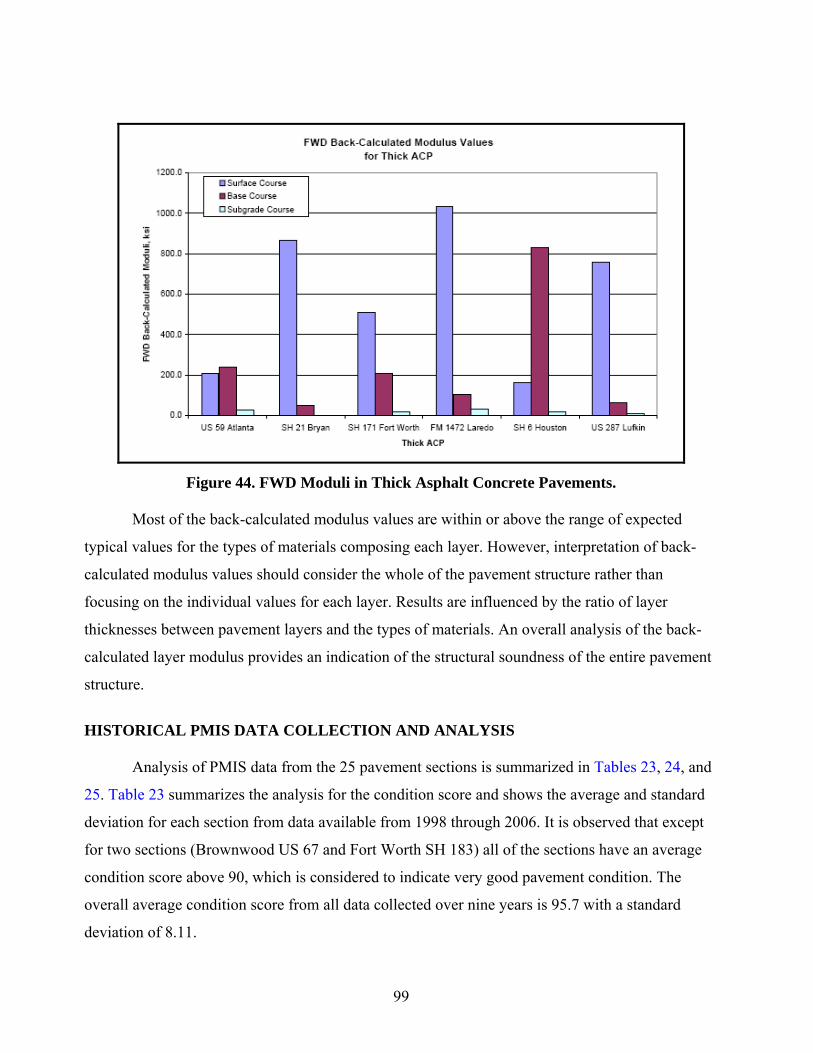
99
Figure 44. FWD Moduli in Thick Asphalt Concrete Pavements.
Most of the back-calculated modulus values are within or above the range of expected
typical values for the types of materials composing each layer. However, interpretation of back-
calculated modulus values should consider the whole of the pavement structure rather than
focusing on the individual values for each layer. Results are influenced by the ratio of layer
thicknesses between pavement layers and the types of materials. An overall analysis of the back-
calculated layer modulus provides an indication of the structural soundness of the entire pavement
structure.
HISTORICAL PMIS DATA COLLECTION AND ANALYSIS
Analysis of PMIS data from the 25 pavement sections is summarized in Tables 23, 24, and
25. Table 23 summarizes the analysis for the condition score and shows the average and standard
deviation for each section from data available from 1998 through 2006. It is observed that except
for two sections (Brownwood US 67 and Fort Worth SH 183) all of the sections have an average
condition score above 90, which is considered to indicate very good pavement condition. The
overall average condition score from all data collected over nine years is 95.7 with a standard
deviation of 8.11.
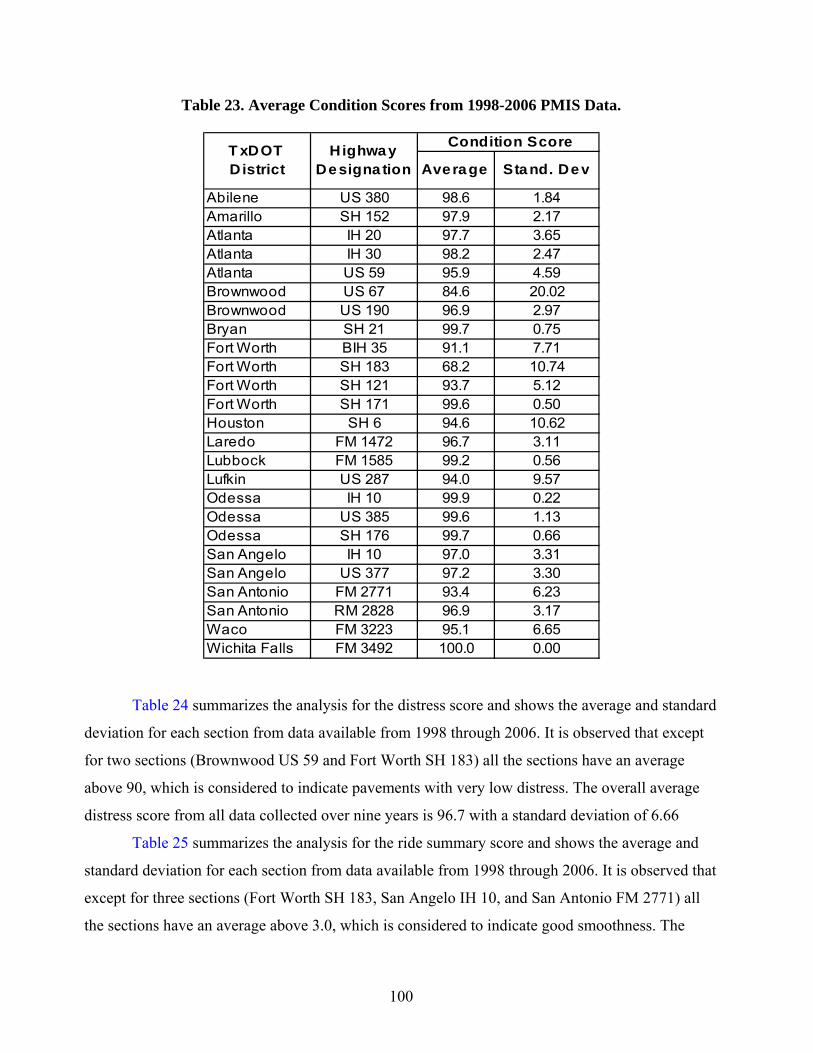
100
Table 23. Average Condition Scores from 1998-2006 PMIS Data.
Condition Score
Average Stand. Dev
Abilene US 380 98.6 1.84Amarillo SH 152 97.9 2.17Atlanta IH 20 97.7 3.65Atlanta IH 30 98.2 2.47Atlanta US 59 95.9 4.59Brownwood US 67 84.6 20.02Brownwood US 190 96.9 2.97Bryan SH 21 99.7 0.75Fort Worth BIH 35 91.1 7.71Fort Worth SH 183 68.2 10.74Fort Worth SH 121 93.7 5.12Fort Worth SH 171 99.6 0.50Houston SH 6 94.6 10.62Laredo FM 1472 96.7 3.11Lubbock FM 1585 99.2 0.56Lufkin US 287 94.0 9.57Odessa IH 10 99.9 0.22Odessa US 385 99.6 1.13Odessa SH 176 99.7 0.66San Angelo IH 10 97.0 3.31San Angelo US 377 97.2 3.30San Antonio FM 2771 93.4 6.23San Antonio RM 2828 96.9 3.17Waco FM 3223 95.1 6.65Wichita Falls FM 3492 100.0 0.00
T xDOT District
Highway Designa tion
Table 24 summarizes the analysis for the distress score and shows the average and standard
deviation for each section from data available from 1998 through 2006. It is observed that except
for two sections (Brownwood US 59 and Fort Worth SH 183) all the sections have an average
above 90, which is considered to indicate pavements with very low distress. The overall average
distress score from all data collected over nine years is 96.7 with a standard deviation of 6.66
Table 25 summarizes the analysis for the ride summary score and shows the average and
standard deviation for each section from data available from 1998 through 2006. It is observed that
except for three sections (Fort Worth SH 183, San Angelo IH 10, and San Antonio FM 2771) all
the sections have an average above 3.0, which is considered to indicate good smoothness. The
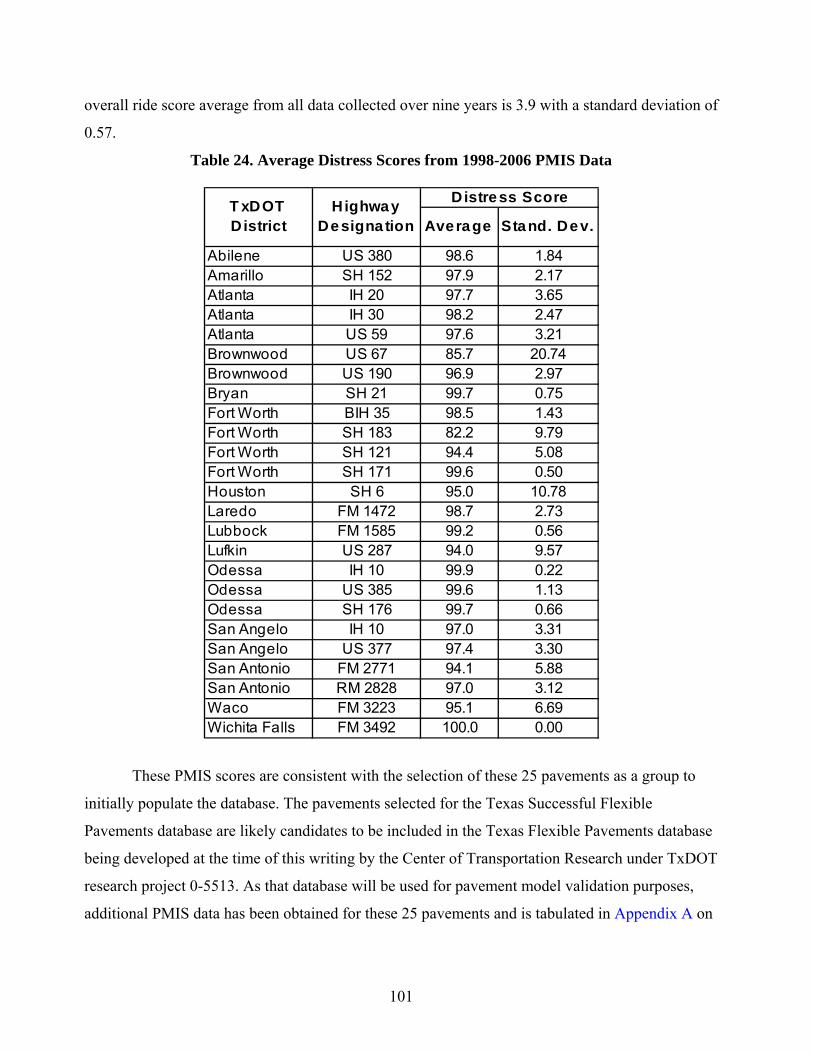
101
overall ride score average from all data collected over nine years is 3.9 with a standard deviation of
0.57.
Table 24. Average Distress Scores from 1998-2006 PMIS Data
D istress Score
Average Stand. Dev.
Abilene US 380 98.6 1.84Amarillo SH 152 97.9 2.17Atlanta IH 20 97.7 3.65Atlanta IH 30 98.2 2.47Atlanta US 59 97.6 3.21Brownwood US 67 85.7 20.74Brownwood US 190 96.9 2.97Bryan SH 21 99.7 0.75Fort Worth BIH 35 98.5 1.43Fort Worth SH 183 82.2 9.79Fort Worth SH 121 94.4 5.08Fort Worth SH 171 99.6 0.50Houston SH 6 95.0 10.78Laredo FM 1472 98.7 2.73Lubbock FM 1585 99.2 0.56Lufkin US 287 94.0 9.57Odessa IH 10 99.9 0.22Odessa US 385 99.6 1.13Odessa SH 176 99.7 0.66San Angelo IH 10 97.0 3.31San Angelo US 377 97.4 3.30San Antonio FM 2771 94.1 5.88San Antonio RM 2828 97.0 3.12Waco FM 3223 95.1 6.69Wichita Falls FM 3492 100.0 0.00
T xDOT District
Highway Designa tion
These PMIS scores are consistent with the selection of these 25 pavements as a group to
initially populate the database. The pavements selected for the Texas Successful Flexible
Pavements database are likely candidates to be included in the Texas Flexible Pavements database
being developed at the time of this writing by the Center of Transportation Research under TxDOT
research project 0-5513. As that database will be used for pavement model validation purposes,
additional PMIS data has been obtained for these 25 pavements and is tabulated in Appendix A on

102
Table 25. Average Ride Summary Scores from 1998-2006 PMIS Data
R ide Summary
Average Stand. Dev.
Abilene US 380 3.6 0.17Amarillo SH 152 4.6 0.05Atlanta IH 20 4.4 0.17Atlanta IH 30 4.4 0.10Atlanta US 59 4.1 0.40Brownwood US 67 3.6 0.08Brownwood US 190 4.1 0.20Bryan SH 21 4.2 0.19Fort Worth BIH 35 3.3 0.20Fort Worth SH 183 2.9 0.11Fort Worth SH 121 3.7 0.18Fort Worth SH 171 4.1 0.09Houston SH 6 4.1 0.28Laredo FM 1472 3.8 0.38Lubbock FM 1585 4.5 0.10Lufkin US 287 3.3 0.23Odessa IH 10 4.3 0.05Odessa US 385 4.4 0.28Odessa SH 176 4.4 0.09San Angelo IH 10 4.3 0.17San Angelo US 377 2.9 0.11San Antonio FM 2771 2.8 0.07San Antonio RM 2828 3.3 0.05Waco FM 3223 4.2 0.30Wichita Falls FM 3492 4.3 0.16
T xDOT District
H ighway Designation
the CD-ROM. The desire had been to collect and provide a total of 10 year’s of PMIS information.
However, only nine year’s of data were available to the researchers. Nevertheless, the database and
web site are designed to allow entry and storage of up to 10 year’s of PMIS performance score
information.
103
STRATEGIES FOR DATABASE INFORMATION UPDATE CAPABILITIES
One of the designated products of this project was for the research team to investigate and
report strategies for updating or adding new information to the database on an ongoing basis.
The research team concluded that by far the greatest ongoing need for data in the Texas
Successful Flexible Pavements database is the nomination and inclusion of additional pavements.
This need soon became the focus of strategizing for updating capabilities. Once possibilities to
provide this capability were explored, the research team determined that it might be feasible to
include this capability within this project’s budget and time limit. That effort was successful, and a
straightforward and easy means has been provided for registered users to nominate additional
pavements. Further, a truly easy means of managing nominated pavements, including approving or
removing information from display, was provided for the TxDOT administrator of the web site.
The research team also weighed the value of automatic transfer of updated PMIS
performance data into the Texas Successful Flexible Pavements database for the 25 initially loaded
pavements as well as for pavements to include later. The recommendation provided to TxDOT is
that uploaded PMIS information could be misleading as often as helpful and should not be
pursued. As pavements included in the database are rehabilitated and reconstructed, the most
recent PMIS data that would be uploaded, replacing older PMIS data, would no longer be
reflective of the pavement structure that is described within the database. It is believed much more
valuable and practical for users to always be able to see the PMIS data that were available to the
nominator at the time of pavement nomination. These are the data that were the basis of the
pavement’s nomination.
RECOMMENDATIONS ON CHANGES TO TESTING TECHNIQUES TO IMPROVE PAVEMENT EVALUATION
Another designated product of this project was for the research team to provide TxDOT
any recommendations for improving pavement evaluation testing techniques which became
evident during the course of this project. While no needs for change were observed, a couple of
recommendations can be provided based on experiences during this project.
The field testing and sampling plan developed and used during this project, described in
Chapter 5, was found efficient and effective for the purpose of evaluating pavements that were not
104
experiencing performance difficulties. Future use of this plan for similar information gathering
needs is recommended.
A possibly significant improvement in pavement evaluation technique is being developed
by Tom Scullion, a member of our project research team. The rest of the research team observed a
prototype of a system that integrates pavement evaluation video with PaveCheck data
representations. The prototype allowed the user to access video for any specific roadbed location
by clicking on the PaveCheck figure at the desired point. In this manner, an evaluator can look for
telltale surface signs of subsurface conditions, greatly facilitating improved analyses made from
GPR test results. The user may also quickly and accurately determine physical location on the
roadway where a subsurface condition has been noted. Further development and evaluation of this
capability is strongly recommended.

105
CHAPTER 7: FINDINGS AND RECOMMENDATIONS
FINDINGS
This project resulted in the following findings.
• The web site and database programmers were able to develop a product within the
scope of this project that allows online nomination of additional pavements by users
possessing the appropriate security access level. The web site also features several web
site administration tools to facilitate ongoing web site management by TxDOT.
• While the success of each pavement appears to have somewhat differing factors
involved, in general, superior performance may be attributed to the combined result of
good construction practice, high-quality materials, and timely maintenance.
• Analysis of PMIS data from the 25 pavement sections reflects superior pavement
performance over time. Average condition scores, distress scores, and ride scores from
data available from 1998 through 2006 indicate very good performance and
substantiate the selections of these pavements by the districts.
• GPR colormaps display uniform pavement profiles for the selected pavements, an
indication of uniformity in materials production, materials quality, and use of good
pavement construction practices. Colormaps were consistent with observations of layer
depths and occasional anomalies made in the field during pavement sampling.
• Most pavement layer back-calculated modulus values were within or above the range of
expected typical values for the types of materials involved.
• Current record retention policies for construction inspection test results severely limited
availability of construction inspection test results for pavements older than six or seven
years in age. However, potentially valuable observations were made regarding test
results and specification criteria that warrant further evaluation. Additional quantities of
construction inspection test results will be required to adequately evaluate these
specification improvement opportunities. Recommendations concerning these
observations are included below.

106
RECOMMENDATIONS
The following recommendations are made.
• Availability of the Texas Successful Flexible Pavements web site and database should
be advertised to all potential department users to gain immediate and maximum benefit
from the information now available.
• District pavement engineers should be provided security access and be encouraged to
nominate additional flexible pavements that they find to be clearly performing beyond
normal expectations.
• Once a number of additional pavements have been included in the database, TxDOT
should consider more closely evaluating benefits and other possible effects from a
small increase in the laboratory design density for pavement layers below the surface
course.
• The voids-in-the-mineral-aggregate criteria in current specifications should be
evaluated beyond that possible during this project, specifically to validate the current
specification criteria or to support increased minimum values, should that be found
appropriate for this most important mixture composition characteristic.
• Implementing a sister web site and database, using the same basic web site and
database structure developed in this project, should be considered for the sole purpose
of capturing and tracking information about experimental pavement sections placed
under construction and maintenance oversight. This additional use appears an excellent
means to leverage the value of the programming already provided, as development
costs for the sister web site would be a small fraction of original development costs.
This work may meet the criteria for implementation program funding, or other funding
outside of the research program.
• Similarly, implementing a sister web site and database solely for collecting information
about Superpave, SMA, and CMHB mixtures should be considered to expedite
department ability to evaluate current specification criteria unique to these mixtures and
to increase general understanding of these pavement types. A separate database is
recommended to allow the random selection of pavements, selected from throughout
the state, to assure statewide applicability of findings. This approach also assures
adequate numbers of pavement data sets for statistical evaluations. The gathering and
107
loading of this information into the database may appropriately fall under TxDOT’s
Implementation Program or other non-research funding should department human
resources not be readily available. If the current web site and database require only
superficial changes, such as naming conventions, the cost would be extremely small to
provide this additional tool to TxDOT.
• The 25 pavement data sets created during this project should be included in the
database being developed under TxDOT research project 0-5513. Nominated
pavements that were not selected for full evaluation under this project should also be
considered by the project 0-5513 team, as they provide additional good candidates to
populate that database with upper-end performing pavements.
• TxDOT should continue to pursue coordination of protocols between the database
provided by this project and the database being developed under research
project 0-5513, ultimately allowing either database to transfer data to or from the other
database. It is believed that the protocol developed for that purpose under this project
provides a solid framework to achieve that goal.
• Current record retention policies for construction inspection test result records should
be reviewed to determine if adjustments might be practical that would facilitate future
review of important construction specification criteria.
• The prototype system observed by the research team that integrates pavement
evaluation video with PaveCheck data representations should be further developed,
evaluated, and strongly considered for incorporation into the standard pavement
evaluation testing protocol.

109
REFERENCES
1. Chatti, K., N. Buch, S.W. Haider, A.S. Pulipaka, R.W. Lyles, D. Gilliland, and P. Desaraju. LTPP Data Analysis: Influence of Design and Construction Features on the Response and Performance of New Flexible and Rigid Pavements. National Cooperative Highway Research Program (NCHRP), Michigan State University, Michigan, 2005.
2. Sharp, K., and T. Martin. Network Performance Profiles. www.arrb.com.au. Road System and Engineering Technology Forum, August 2005.
3. Merrill, D. Guidance on the Development, Assessment and Maintenance of Long-Life Flexible Pavements. Report TRL 639. Highways Agency, Quarry Products Association and Refined Bitumen Association.
4. Von Quintus, H., J. Mallela, and J. Jiang. Expected Service Life and Performance Characteristics of HMA Pavements in LTPP. Eres Consultants Division, Texas, 2005.
5. Choi, J., and T.M. Adams. Strategy for Modeling a Pavement Performance Analysis System at WisDOT. Transportation Research Board, Washington D.C., 2004.
6. Design Build Pavement Warranties. Washington Department of Transportation, Washington, 2006.
7. Krebs, S.W., B. Duckert, S. Schwandt, J. Volker, T. Brokaw, W. Shemwell, and G. Waelti. Asphaltic Pavement Warranties, Five-Year Progress Report. WisDOT, FHA, WAPA, Wisconsin, 2001.
8. Yoshida, T. Performance-Based Specifications as a Step to Performance-Step Management and Maintenance of Pavement in Japan. Public Works Research Institute, Japan, 2001.
9. Richter, C.. Performance Trends of Rehabilitated AC Pavements. Publication Number: FHWA -RD-99-193, US DOT, FHA, Virginia, 2000.
10. Rauhut, J.B., A. Eltahan, and A.L. Simpson. Common Characteristics of Good and Poorly Performing AC Pavement. Publication Number: FHWA-RD-99-193, US DOT, FHA, Virginia, 1999.
11. Baker, M.J., J.P. Mahoney, and N. Sivaneswaran. Engineering Application of Washington State’s Pavement Management System. Research Record 1643, WSDOT, Washington, 1998.
12. Information Systems Division, TxDOT Data Architecture - Version 3.0, Texas Department of Transportation, Austin, Texas, 2006.

111
APPENDIX A: (SEE COMPACT DISC ATTACHED TO BACK COVER)

113
The following information is provided on CD-ROM due to the length and size of these
documents:
Initial 2004-2006 PMIS Information - All Nominated Pavements
Database Entity-Relationship Diagram
Database Data Dictionary
Construction Inspection Test Results
Laboratory Test Results on Samples of Aged Pavements
Graphical Display of Individual Pavement Layer Test Results
1998-2006 PMIS Pavement Scores – Selected Pavements

115
APPENDIX B: PAVEMENT NOMINATION SOLICITATION DOCUMENTS


117

119

121
APPENDIX C: NOMINATED SUCCESSFUL FLEXIBLE PAVEMENTS

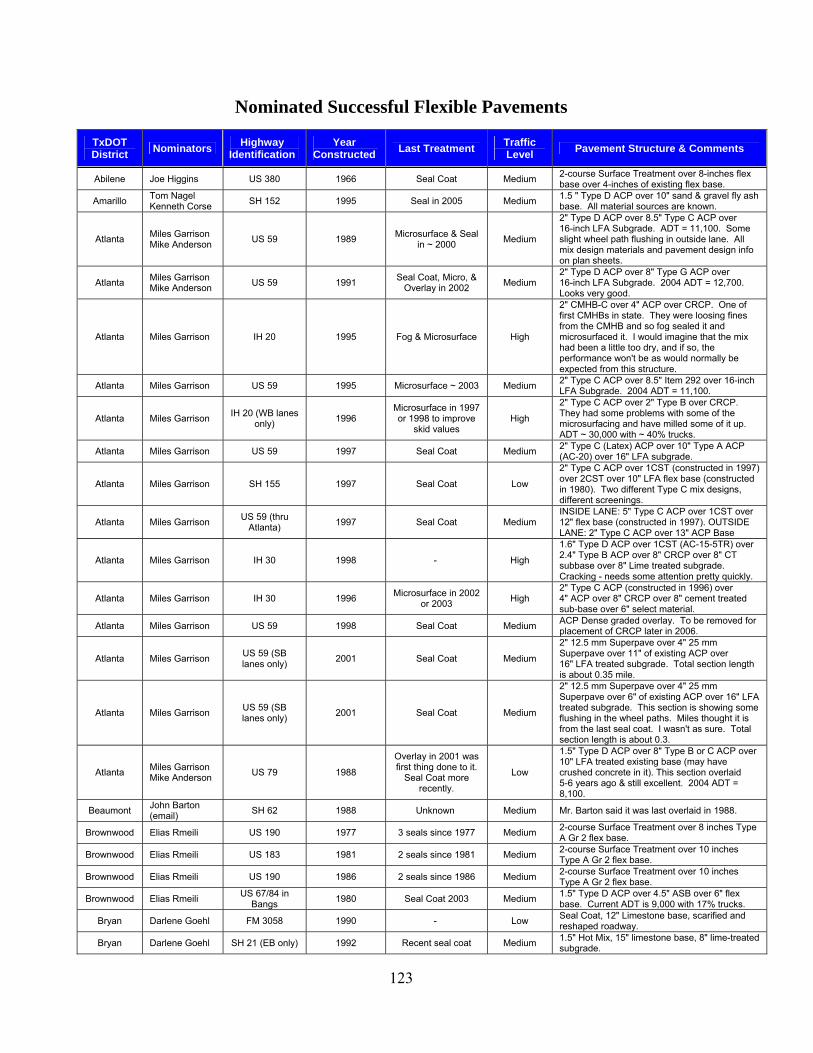
123
Nominated Successful Flexible Pavements
TxDOT District Nominators Highway
Identification Year
Constructed Last Treatment Traffic Level Pavement Structure & Comments
Abilene Joe Higgins US 380 1966 Seal Coat Medium 2-course Surface Treatment over 8-inches flex base over 4-inches of existing flex base.
Amarillo Tom Nagel Kenneth Corse SH 152 1995 Seal in 2005 Medium 1.5 " Type D ACP over 10" sand & gravel fly ash
base. All material sources are known.
Atlanta Miles Garrison Mike Anderson US 59 1989 Microsurface & Seal
in ~ 2000 Medium
2" Type D ACP over 8.5" Type C ACP over 16-inch LFA Subgrade. ADT = 11,100. Some slight wheel path flushing in outside lane. All mix design materials and pavement design info on plan sheets.
Atlanta Miles Garrison Mike Anderson US 59 1991 Seal Coat, Micro, &
Overlay in 2002 Medium 2" Type D ACP over 8" Type G ACP over 16-inch LFA Subgrade. 2004 ADT = 12,700. Looks very good.
Atlanta Miles Garrison IH 20 1995 Fog & Microsurface High
2" CMHB-C over 4" ACP over CRCP. One of first CMHBs in state. They were loosing fines from the CMHB and so fog sealed it and microsurfaced it. I would imagine that the mix had been a little too dry, and if so, the performance won't be as would normally be expected from this structure.
Atlanta Miles Garrison US 59 1995 Microsurface ~ 2003 Medium 2" Type C ACP over 8.5" Item 292 over 16-inch LFA Subgrade. 2004 ADT = 11,100.
Atlanta Miles Garrison IH 20 (WB lanes only) 1996
Microsurface in 1997 or 1998 to improve
skid values High
2" Type C ACP over 2" Type B over CRCP. They had some problems with some of the microsurfacing and have milled some of it up. ADT ~ 30,000 with ~ 40% trucks.
Atlanta Miles Garrison US 59 1997 Seal Coat Medium 2" Type C (Latex) ACP over 10" Type A ACP (AC-20) over 16" LFA subgrade.
Atlanta Miles Garrison SH 155 1997 Seal Coat Low
2" Type C ACP over 1CST (constructed in 1997) over 2CST over 10" LFA flex base (constructed in 1980). Two different Type C mix designs, different screenings.
Atlanta Miles Garrison US 59 (thru Atlanta) 1997 Seal Coat Medium
INSIDE LANE: 5" Type C ACP over 1CST over 12" flex base (constructed in 1997). OUTSIDE LANE: 2" Type C ACP over 13" ACP Base
Atlanta Miles Garrison IH 30 1998 - High
1.6" Type D ACP over 1CST (AC-15-5TR) over 2.4" Type B ACP over 8" CRCP over 8" CT subbase over 8" Lime treated subgrade. Cracking - needs some attention pretty quickly.
Atlanta Miles Garrison IH 30 1996 Microsurface in 2002 or 2003 High
2" Type C ACP (constructed in 1996) over 4" ACP over 8" CRCP over 8" cement treated sub-base over 6" select material.
Atlanta Miles Garrison US 59 1998 Seal Coat Medium ACP Dense graded overlay. To be removed for placement of CRCP later in 2006.
Atlanta Miles Garrison US 59 (SB lanes only) 2001 Seal Coat Medium
2" 12.5 mm Superpave over 4" 25 mm Superpave over 11" of existing ACP over 16" LFA treated subgrade. Total section length is about 0.35 mile.
Atlanta Miles Garrison US 59 (SB lanes only) 2001 Seal Coat Medium
2" 12.5 mm Superpave over 4" 25 mm Superpave over 6" of existing ACP over 16" LFA treated subgrade. This section is showing some flushing in the wheel paths. Miles thought it is from the last seal coat. I wasn't as sure. Total section length is about 0.3.
Atlanta Miles Garrison Mike Anderson US 79 1988
Overlay in 2001 was first thing done to it.
Seal Coat more recently.
Low
1.5" Type D ACP over 8" Type B or C ACP over 10" LFA treated existing base (may have crushed concrete in it). This section overlaid 5-6 years ago & still excellent. 2004 ADT = 8,100.
Beaumont John Barton (email) SH 62 1988 Unknown Medium Mr. Barton said it was last overlaid in 1988.
Brownwood Elias Rmeili US 190 1977 3 seals since 1977 Medium 2-course Surface Treatment over 8 inches Type A Gr 2 flex base.
Brownwood Elias Rmeili US 183 1981 2 seals since 1981 Medium 2-course Surface Treatment over 10 inches Type A Gr 2 flex base.
Brownwood Elias Rmeili US 190 1986 2 seals since 1986 Medium 2-course Surface Treatment over 10 inches Type A Gr 2 flex base.
Brownwood Elias Rmeili US 67/84 in Bangs 1980 Seal Coat 2003 Medium 1.5" Type D ACP over 4.5" ASB over 6" flex
base. Current ADT is 9,000 with 17% trucks.
Bryan Darlene Goehl FM 3058 1990 - Low Seal Coat, 12" Limestone base, scarified and reshaped roadway.
Bryan Darlene Goehl SH 21 (EB only) 1992 Recent seal coat Medium 1.5" Hot Mix, 15" limestone base, 8" lime-treated subgrade.
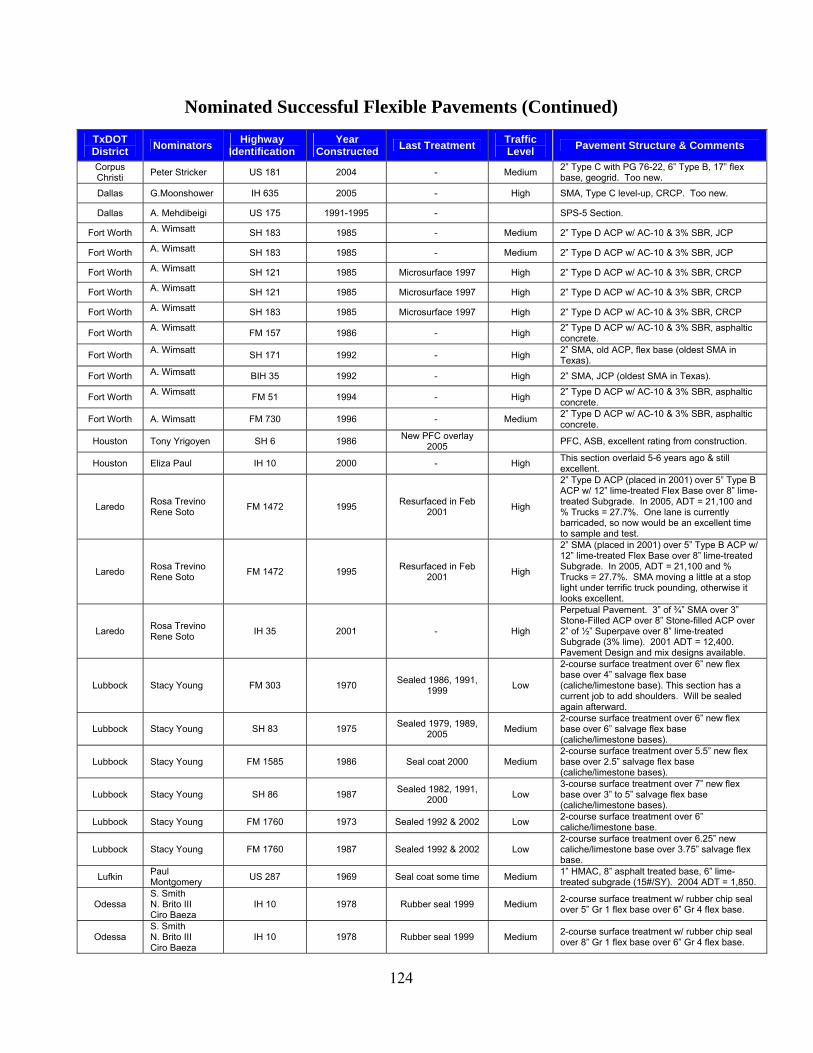
124
Nominated Successful Flexible Pavements (Continued)
TxDOT District Nominators Highway
Identification Year
Constructed Last Treatment Traffic Level Pavement Structure & Comments
Corpus Christi Peter Stricker US 181 2004 - Medium 2” Type C with PG 76-22, 6” Type B, 17” flex
base, geogrid. Too new.
Dallas G.Moonshower IH 635 2005 - High SMA, Type C level-up, CRCP. Too new.
Dallas A. Mehdibeigi US 175 1991-1995 - SPS-5 Section.
Fort Worth A. Wimsatt SH 183 1985 - Medium 2” Type D ACP w/ AC-10 & 3% SBR, JCP
Fort Worth A. Wimsatt SH 183 1985 - Medium 2” Type D ACP w/ AC-10 & 3% SBR, JCP
Fort Worth A. Wimsatt SH 121 1985 Microsurface 1997 High 2” Type D ACP w/ AC-10 & 3% SBR, CRCP
Fort Worth A. Wimsatt SH 121 1985 Microsurface 1997 High 2” Type D ACP w/ AC-10 & 3% SBR, CRCP
Fort Worth A. Wimsatt SH 183 1985 Microsurface 1997 High 2” Type D ACP w/ AC-10 & 3% SBR, CRCP
Fort Worth A. Wimsatt FM 157 1986 - High 2” Type D ACP w/ AC-10 & 3% SBR, asphaltic concrete.
Fort Worth A. Wimsatt SH 171 1992 - High 2” SMA, old ACP, flex base (oldest SMA in Texas).
Fort Worth A. Wimsatt BIH 35 1992 - High 2” SMA, JCP (oldest SMA in Texas).
Fort Worth A. Wimsatt FM 51 1994 - High 2” Type D ACP w/ AC-10 & 3% SBR, asphaltic concrete.
Fort Worth A. Wimsatt FM 730 1996 - Medium 2” Type D ACP w/ AC-10 & 3% SBR, asphaltic concrete.
Houston Tony Yrigoyen SH 6 1986 New PFC overlay 2005 PFC, ASB, excellent rating from construction.
Houston Eliza Paul IH 10 2000 - High This section overlaid 5-6 years ago & still excellent.
Laredo Rosa Trevino Rene Soto FM 1472 1995 Resurfaced in Feb
2001 High
2” Type D ACP (placed in 2001) over 5” Type B ACP w/ 12” lime-treated Flex Base over 8” lime-treated Subgrade. In 2005, ADT = 21,100 and % Trucks = 27.7%. One lane is currently barricaded, so now would be an excellent time to sample and test.
Laredo Rosa Trevino Rene Soto FM 1472 1995 Resurfaced in Feb
2001 High
2” SMA (placed in 2001) over 5” Type B ACP w/ 12” lime-treated Flex Base over 8” lime-treated Subgrade. In 2005, ADT = 21,100 and % Trucks = 27.7%. SMA moving a little at a stop light under terrific truck pounding, otherwise it looks excellent.
Laredo Rosa Trevino Rene Soto IH 35 2001 - High
Perpetual Pavement. 3” of ¾” SMA over 3” Stone-Filled ACP over 8” Stone-filled ACP over 2” of ½” Superpave over 8” lime-treated Subgrade (3% lime). 2001 ADT = 12,400. Pavement Design and mix designs available.
Lubbock Stacy Young FM 303 1970 Sealed 1986, 1991, 1999 Low
2-course surface treatment over 6” new flex base over 4” salvage flex base (caliche/limestone base). This section has a current job to add shoulders. Will be sealed again afterward.
Lubbock Stacy Young SH 83 1975 Sealed 1979, 1989, 2005 Medium
2-course surface treatment over 6” new flex base over 6” salvage flex base (caliche/limestone bases).
Lubbock Stacy Young FM 1585 1986 Seal coat 2000 Medium 2-course surface treatment over 5.5” new flex base over 2.5” salvage flex base (caliche/limestone bases).
Lubbock Stacy Young SH 86 1987 Sealed 1982, 1991, 2000 Low
3-course surface treatment over 7” new flex base over 3” to 5” salvage flex base (caliche/limestone bases).
Lubbock Stacy Young FM 1760 1973 Sealed 1992 & 2002 Low 2-course surface treatment over 6” caliche/limestone base.
Lubbock Stacy Young FM 1760 1987 Sealed 1992 & 2002 Low 2-course surface treatment over 6.25” new caliche/limestone base over 3.75” salvage flex base.
Lufkin Paul Montgomery US 287 1969 Seal coat some time Medium 1” HMAC, 8” asphalt treated base, 6” lime-
treated subgrade (15#/SY). 2004 ADT = 1,850.
Odessa S. Smith N. Brito III Ciro Baeza
IH 10 1978 Rubber seal 1999 Medium 2-course surface treatment w/ rubber chip seal over 5” Gr 1 flex base over 6” Gr 4 flex base.
Odessa S. Smith N. Brito III Ciro Baeza
IH 10 1978 Rubber seal 1999 Medium 2-course surface treatment w/ rubber chip seal over 8” Gr 1 flex base over 6” Gr 4 flex base.
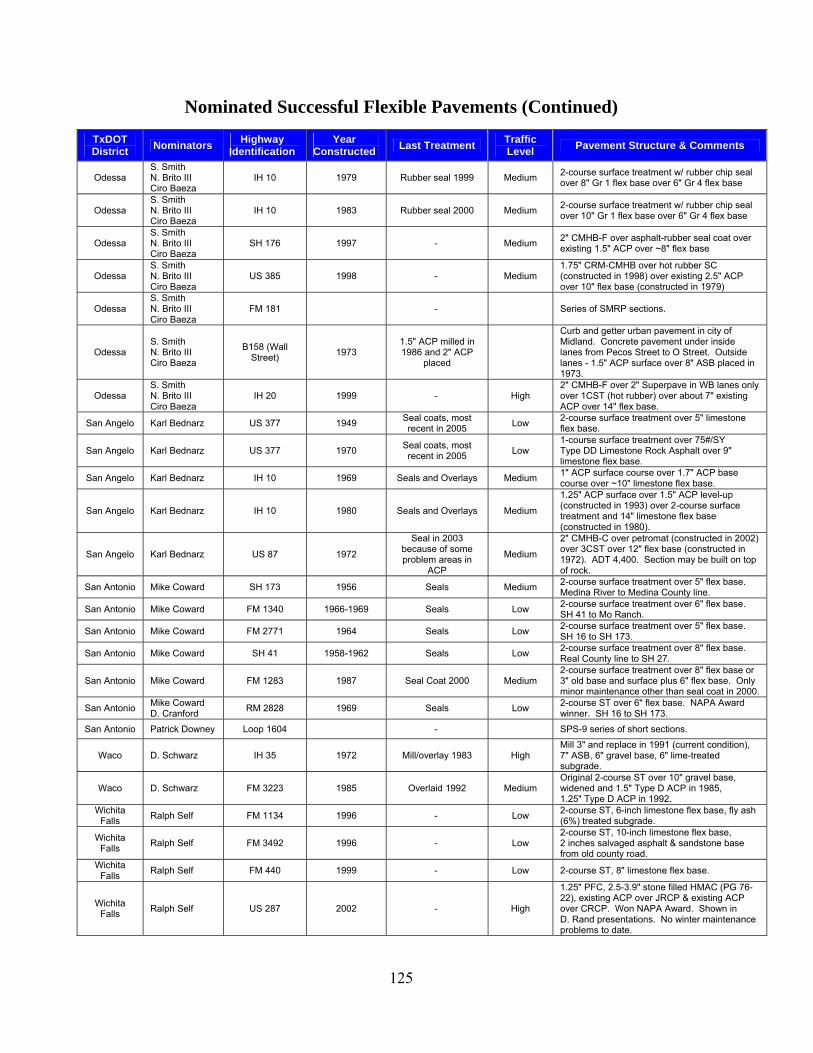
125
Nominated Successful Flexible Pavements (Continued)
TxDOT District Nominators Highway
Identification Year
Constructed Last Treatment Traffic Level Pavement Structure & Comments
Odessa S. Smith N. Brito III Ciro Baeza
IH 10 1979 Rubber seal 1999 Medium 2-course surface treatment w/ rubber chip seal over 8" Gr 1 flex base over 6" Gr 4 flex base
Odessa S. Smith N. Brito III Ciro Baeza
IH 10 1983 Rubber seal 2000 Medium 2-course surface treatment w/ rubber chip seal over 10" Gr 1 flex base over 6" Gr 4 flex base
Odessa S. Smith N. Brito III Ciro Baeza
SH 176 1997 - Medium 2" CMHB-F over asphalt-rubber seal coat over existing 1.5" ACP over ~8" flex base
Odessa S. Smith N. Brito III Ciro Baeza
US 385 1998 - Medium 1.75" CRM-CMHB over hot rubber SC (constructed in 1998) over existing 2.5" ACP over 10" flex base (constructed in 1979)
Odessa S. Smith N. Brito III Ciro Baeza
FM 181 - Series of SMRP sections.
Odessa S. Smith N. Brito III Ciro Baeza
B158 (Wall Street) 1973
1.5" ACP milled in 1986 and 2" ACP
placed
Curb and getter urban pavement in city of Midland. Concrete pavement under inside lanes from Pecos Street to O Street. Outside lanes - 1.5" ACP surface over 8" ASB placed in 1973.
Odessa S. Smith N. Brito III Ciro Baeza
IH 20 1999 - High 2" CMHB-F over 2" Superpave in WB lanes only over 1CST (hot rubber) over about 7" existing ACP over 14" flex base.
San Angelo Karl Bednarz US 377 1949 Seal coats, most recent in 2005 Low 2-course surface treatment over 5" limestone
flex base.
San Angelo Karl Bednarz US 377 1970 Seal coats, most recent in 2005 Low
1-course surface treatment over 75#/SY Type DD Limestone Rock Asphalt over 9" limestone flex base.
San Angelo Karl Bednarz IH 10 1969 Seals and Overlays Medium 1" ACP surface course over 1.7" ACP base course over ~10" limestone flex base.
San Angelo Karl Bednarz IH 10 1980 Seals and Overlays Medium
1.25" ACP surface over 1.5" ACP level-up (constructed in 1993) over 2-course surface treatment and 14" limestone flex base (constructed in 1980).
San Angelo Karl Bednarz US 87 1972
Seal in 2003 because of some problem areas in
ACP
Medium
2" CMHB-C over petromat (constructed in 2002) over 3CST over 12" flex base (constructed in 1972). ADT 4,400. Section may be built on top of rock.
San Antonio Mike Coward SH 173 1956 Seals Medium 2-course surface treatment over 5" flex base. Medina River to Medina County line.
San Antonio Mike Coward FM 1340 1966-1969 Seals Low 2-course surface treatment over 6" flex base. SH 41 to Mo Ranch.
San Antonio Mike Coward FM 2771 1964 Seals Low 2-course surface treatment over 5" flex base. SH 16 to SH 173.
San Antonio Mike Coward SH 41 1958-1962 Seals Low 2-course surface treatment over 8" flex base. Real County line to SH 27.
San Antonio Mike Coward FM 1283 1987 Seal Coat 2000 Medium 2-course surface treatment over 8" flex base or 3" old base and surface plus 6" flex base. Only minor maintenance other than seal coat in 2000.
San Antonio Mike Coward D. Cranford RM 2828 1969 Seals Low 2-course ST over 6" flex base. NAPA Award
winner. SH 16 to SH 173.
San Antonio Patrick Downey Loop 1604 - SPS-9 series of short sections.
Waco D. Schwarz IH 35 1972 Mill/overlay 1983 High Mill 3" and replace in 1991 (current condition), 7" ASB, 6" gravel base, 6" lime-treated subgrade.
Waco D. Schwarz FM 3223 1985 Overlaid 1992 Medium Original 2-course ST over 10" gravel base, widened and 1.5" Type D ACP in 1985, 1.25" Type D ACP in 1992.
Wichita Falls Ralph Self FM 1134 1996 - Low 2-course ST, 6-inch limestone flex base, fly ash
(6%) treated subgrade.
Wichita Falls Ralph Self FM 3492 1996 - Low
2-course ST, 10-inch limestone flex base, 2 inches salvaged asphalt & sandstone base from old county road.
Wichita Falls Ralph Self FM 440 1999 - Low 2-course ST, 8" limestone flex base.
Wichita Falls Ralph Self US 287 2002 - High
1.25" PFC, 2.5-3.9" stone filled HMAC (PG 76-22), existing ACP over JRCP & existing ACP over CRCP. Won NAPA Award. Shown in D. Rand presentations. No winter maintenance problems to date.


127
APPENDIX D: SUMMARY OF 2004-2006 PMIS PERFORMANCE SCORES – SELECTED PAVEMENTS


129
2004 PMIS Pavement Performance Scores – Selected Pavements
Distress Score Ride Score Condition Score TxDOT District
Highway Designation
Year Constructed
Annual Average
Daily Traffic (AADT)
Percent Trucks
Average Std. Dev. Average Std.
Dev. Average Std. Dev.
Abilene US 380 1966 1,643 12 92 18.76 3.7 0.31 92 20.11
Amarillo SH 152 1995 1,354 10 98 4.83 4.6 0.24 98 4.83
Atlanta IH 20 (WB lanes only)
1996 Overlay 14,643 35 70 46.31 4.6 0.17 70 46.31
Atlanta IH 30 1996 Overlay 21,275 28 92 27.81 4.14 1.27 92 27.81
Atlanta US 59 1989 7,569 23 99 1.28 4.3 0.31 99 1.28
Brownwood US 67/84 1980 7,350 15 100 0 3.8 0.13 100 0
Brownwood US 190 1977 1,400 24 99 4.73 4.3 0.23 99 4.73
Bryan SH 21 (EB lanes only) 1992 5,450 14 100 1.25 4.1 0.29 100 1.25
Fort Worth BIH 35 1992 Overlay 6,300 4 99 1 3.2 0.33 93 12.76
Fort Worth SH 183 1985 Overlay 14,528 10 86 11.96 3 0.28 74 17.11
Fort Worth SH 121 1985 Overlay 76,306 7 93 8.78 3.6 0.31 92 8.76
Fort Worth SH 171 1992 Overlay 6,713 16 90 27.88 4.2 0.1 90 27.88
Houston SH 6 1985 8,576 17 97 6.4 3.8 0.30 96 10.96
Laredo FM 1472 2001 Overlay 19,022 26 100 0 2.7 1.37 72 42.33
Lubbock FM 1585 1986 2,230 6 98 5.68 4.5 0.29 98 5.68
Lufkin US 287 1969 1,850 38 68 46.33 2.5 1.72 68 46.33
Odessa IH 10 1978 2,340 50 100 1.56 4.3 0.19 100 1.56
Odessa US 385 1998 Overlay 2,144 19 100 0.24 4.5 0.24 100 0.24
Odessa SH 176 1997 Overlay 1,750 35 100 0.85 4.3 0.45 100 0.85
San Angelo IH 10 1969 4,320 28 97 7.84 4.3 0.19 97 7.84
San Angelo US 377 1949 295 26 91 12.92 2.9 0.31 91 12.92
San Antonio FM 2771 1964 892 15 97 5.3 2.9 0.24 97 5.18
San Antonio RM 2828 1969 980 15 99 3.23 3.3 0.12 99 3.23
Waco FM 3223 1992 Overlay 15,280 6 100 0 3.5 0.45 97 7.06
Wichita Falls FM 3492 1996 790 11 100 0 4 0.54 100 0

130
2005 PMIS Pavement Performance Scores – Selected Pavements
Distress Score Ride Score Condition Score TxDOT District
Highway Designation
Year Constructed
Annual Average
Daily Traffic (AADT)
Percent Trucks
Average Std. Dev. Average Std.
Dev. Average Std. Dev.
Abilene US 380 1966 1,675 14 96 14.23 3.5 0.24 95 15.94
Amarillo SH 152 1995 1,304 14 95 11.71 4.6 0.2 95 11.71
Atlanta IH 20 (WB lanes only)
1996 Overlay 15,566 35 100 1.48 4.5 0.19 100 1.48
Atlanta IH 30 1996 Overlay 20,455 27 100 1.32 4.5 0.21 100 1.32
Atlanta US 59 1989 5,698 24 100 0 4.3 0.31 100 0
Brownwood US 67/84 1980 7,300 16 98 1.64 3.8 0.25 98 1.64
Brownwood US 190 1977 1,500 25 99 4.72 4.1 0.26 99 4.72
Bryan SH 21 (EB lanes only) 1992 5,375 14 97 12.49 4.1 0.28 97 12.49
Fort Worth BIH 35 1992 Overlay 4,840 6 97 3.83 2.9 0.65 75 27.21
Fort Worth SH 183 1985 Overlay 14,229 10 82 9.14 3 0.35 71 15.43
Fort Worth SH 121 1985 Overlay 74,441 7 94 8.2 3.6 0.39 91 10.14
Fort Worth SH 171 1992 Overlay 6,788 13 99 2.1 4.1 0.19 99 2.1
Houston SH 6 1985 8,576 17 96 11.4 3.7 0.36 95 14.6
Laredo FM 1472 2001 Overlay 19,567 27 100 0 3.6 0.58 96 5.79
Lubbock FM 1585 1986 2,525 7 97 8.09 4.4 0.31 97 8.09
Lufkin US 287 1969 1,900 39 69 11.9 3.7 0.36 68 12.7
Odessa IH 10 1978 2,215 52 100 0.13 4.3 0.24 100 0.13
Odessa US 385 1998 Overlay 1,971 20 100 0 4.5 0.23 100 0
Odessa SH 176 1997 Overlay 2,000 32 100 0 4.2 0.4 100 0
San Angelo IH 10 1969 4,045 29 100 1.39 4.4 0.19 100 1.39
San Angelo US 377 1949 288 28 100 0.54 3 0.22 100 0.54
San Antonio FM 2771 1964 899 15 97 6.42 2.8 0.23 95 6.3
San Antonio RM 2828 1969 951 29 99 3.21 3.2 0.17 99 3.2
Waco FM 3223 1992 Overlay 14,320 6 100 0 4 0.22 100 0
Wichita Falls FM 3492 1996 938 11 100 0 4.2 0.32 100 0
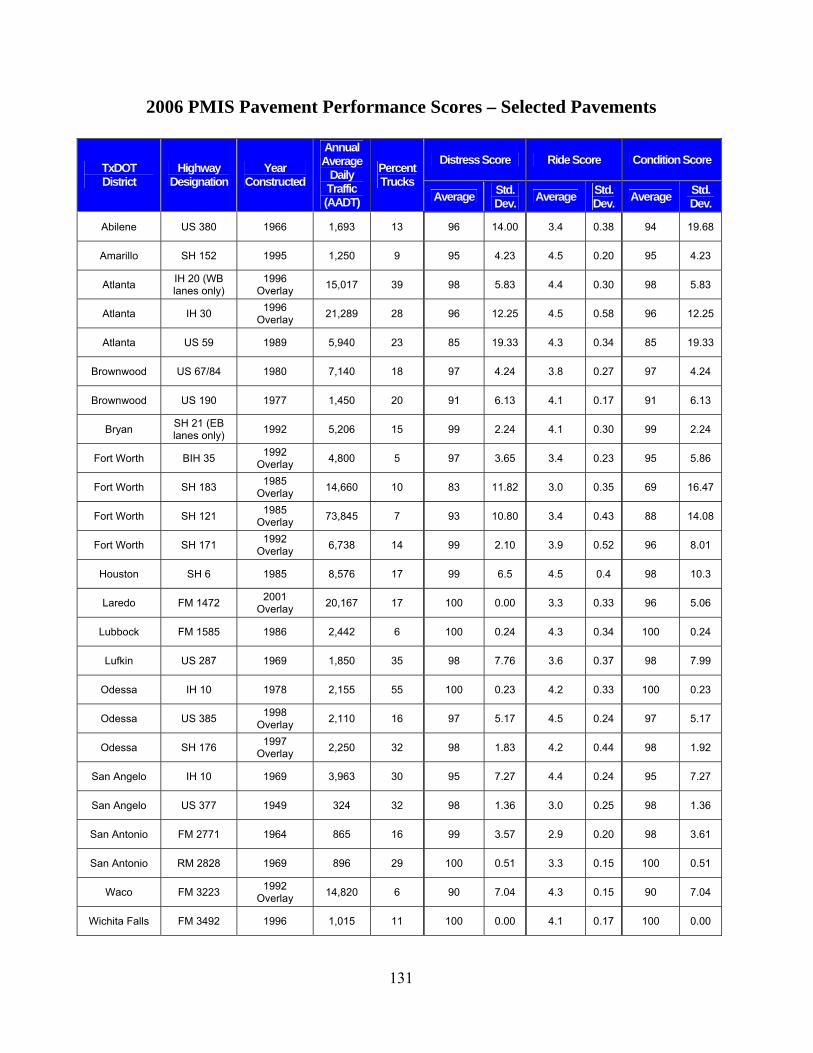
131
2006 PMIS Pavement Performance Scores – Selected Pavements
Distress Score Ride Score Condition Score TxDOT District
Highway Designation
Year Constructed
Annual Average
Daily Traffic (AADT)
Percent Trucks
Average Std. Dev. Average Std.
Dev. Average Std. Dev.
Abilene US 380 1966 1,693 13 96 14.00 3.4 0.38 94 19.68
Amarillo SH 152 1995 1,250 9 95 4.23 4.5 0.20 95 4.23
Atlanta IH 20 (WB lanes only)
1996 Overlay 15,017 39 98 5.83 4.4 0.30 98 5.83
Atlanta IH 30 1996 Overlay 21,289 28 96 12.25 4.5 0.58 96 12.25
Atlanta US 59 1989 5,940 23 85 19.33 4.3 0.34 85 19.33
Brownwood US 67/84 1980 7,140 18 97 4.24 3.8 0.27 97 4.24
Brownwood US 190 1977 1,450 20 91 6.13 4.1 0.17 91 6.13
Bryan SH 21 (EB lanes only) 1992 5,206 15 99 2.24 4.1 0.30 99 2.24
Fort Worth BIH 35 1992 Overlay 4,800 5 97 3.65 3.4 0.23 95 5.86
Fort Worth SH 183 1985 Overlay 14,660 10 83 11.82 3.0 0.35 69 16.47
Fort Worth SH 121 1985 Overlay 73,845 7 93 10.80 3.4 0.43 88 14.08
Fort Worth SH 171 1992 Overlay 6,738 14 99 2.10 3.9 0.52 96 8.01
Houston SH 6 1985 8,576 17 99 6.5 4.5 0.4 98 10.3
Laredo FM 1472 2001 Overlay 20,167 17 100 0.00 3.3 0.33 96 5.06
Lubbock FM 1585 1986 2,442 6 100 0.24 4.3 0.34 100 0.24
Lufkin US 287 1969 1,850 35 98 7.76 3.6 0.37 98 7.99
Odessa IH 10 1978 2,155 55 100 0.23 4.2 0.33 100 0.23
Odessa US 385 1998 Overlay 2,110 16 97 5.17 4.5 0.24 97 5.17
Odessa SH 176 1997 Overlay 2,250 32 98 1.83 4.2 0.44 98 1.92
San Angelo IH 10 1969 3,963 30 95 7.27 4.4 0.24 95 7.27
San Angelo US 377 1949 324 32 98 1.36 3.0 0.25 98 1.36
San Antonio FM 2771 1964 865 16 99 3.57 2.9 0.20 98 3.61
San Antonio RM 2828 1969 896 29 100 0.51 3.3 0.15 100 0.51
Waco FM 3223 1992 Overlay 14,820 6 90 7.04 4.3 0.15 90 7.04
Wichita Falls FM 3492 1996 1,015 11 100 0.00 4.1 0.17 100 0.00


133
APPENDIX E: SUMMARY OF 2004-2006 PMIS PAVEMENT MAINTENANCE COSTS – SELECTED PAVEMENTS


135
2004-2006 Annual Pavement Maintenance Costs – Selected Pavements
Average Roadway Maintenance Expenditures per Lane-Mile (from PMIS) TxDOT
District Highway
Designation Year
Constructed
Annual Average
Daily Traffic (AADT)
Percent Trucks
2004 2005 2006 Three-Year Average
Abilene US 380 1966 1,693 13 $24 $98 $3 $42
Amarillo SH 152 1995 1,250 9 $1,042 $28 $219 $430
Atlanta IH 20 (WB lanes only)
1996 Overlay 15,017 39 $3,611 $365 $2,927 $2,301
Atlanta IH 30 1996 Overlay 21,289 28 $3,604 $1,214 $1,113 $1,977
Atlanta US 59 1989 5,940 23 $854 $7,413 $86 $2,784
Brownwood US 67/84 1980 7,140 18 $827 $61 $26 $305
Brownwood US 190 1977 1,450 20 $213 $102 $9 $108
Bryan SH 21 (EB lanes only) 1992 5,206 15 $6 $111 $289 $135
Fort Worth BIH 35 1992 Overlay 4,800 5 $27 $740 $0 $256
Fort Worth SH 183 1985 Overlay 14,660 10 $2,825 $59 $172 $1,019
Fort Worth SH 121 1985 Overlay 73,845 7 $628 $1,037 $1,187 $951
Fort Worth SH 171 1992 Overlay 6,738 14 $237 $619 $905 $587
Houston SH 6 1985 8,576 17 $91 $3056 $96 $1,081
Laredo FM 1472 2001 Overlay 20,167 17 $360 $19 $185 $188
Lubbock FM 1585 1986 2,442 6 $378 $38 $604 $340
Lufkin US 287 1969 1,850 35 $257 $9,046 $923 $3,409
Odessa IH 10 1978 2,155 55 $22 $41 $25 $29
Odessa US 385 1998 Overlay 2,110 16 $1 $48 $2 $17
Odessa SH 176 1997 Overlay 2,250 32 $9 $35 $0 $15
San Angelo IH 10 1969 3,963 30 $27 $0 $5 $11
San Angelo US 377 1949 324 32 $955 $2,162 $11 $1,043
San Antonio FM 2771 1964 865 16 $0 $58 $108 $55
San Antonio RM 2828 1969 896 29 $0 $0 $108 $36
Waco FM 3223 1992 Overlay 14,820 6 $1,460 $7 $113 $527
Wichita Falls FM 3492 1996 1,015 11 $0 $0 $0 $0


137
APPENDIX F: DATABASE CONCEPTUAL DATA MODEL GLOSSARY


139
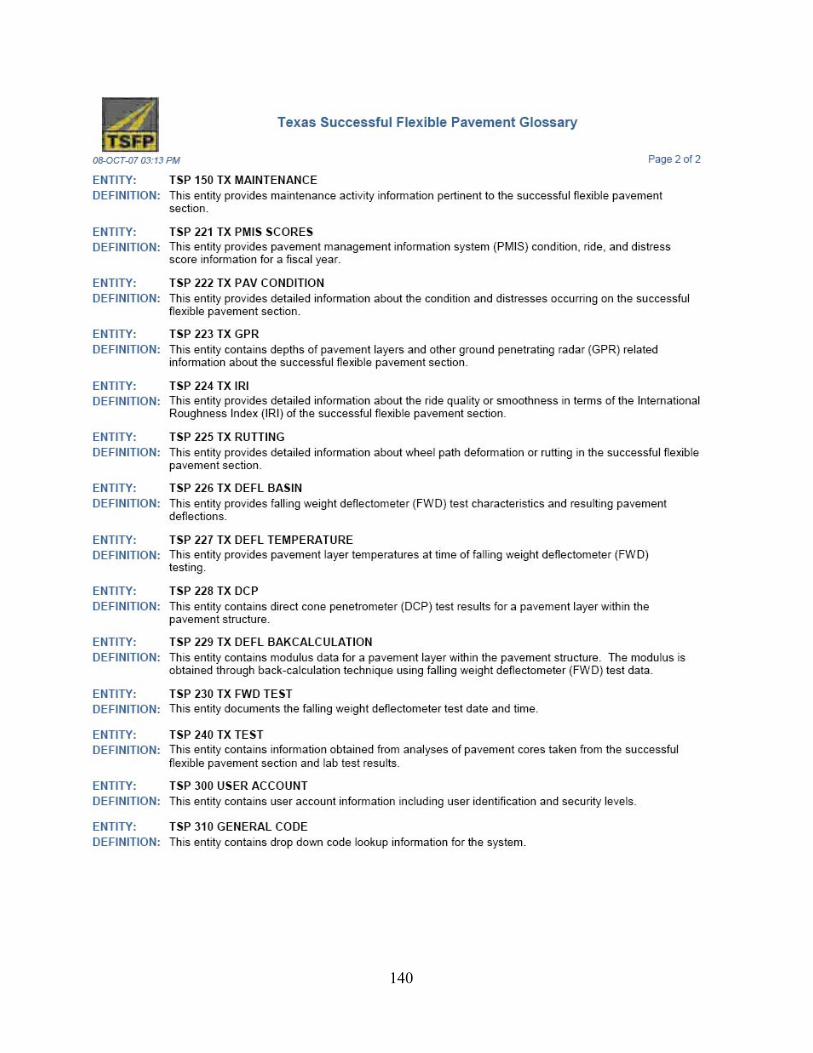
140