analysis of support pressure for stabilization of rock ... · of the tunnel route. numerical...
TRANSCRIPT

9
Journal of Structural Engineering and Geotechnics,
6 (2), 9-20, Summer 2016
QIAU
Analysis of support pressure for stabilization of rock blocks in the Zaker tunnel
Vahid Hosseini Toudeshki Department of Civil Engineering, Zanjan Branch٫ Islamic Azad University٫ Zanjan, Iran
Received 12 March 2016, Accepted 20 May 2016
Abstract
This paper presents the results of engineering geological studies of rock blocks along a road tunnel in NW Iran. The tunnel is to cross the Western Alborz Mountain Range through 530 m in length with 11.2 m span and 8 m height. Eocene tuffs and andesites crop out in whole of the tunnel route. Numerical analyses are done using, a 3D stability analysis and visualization program, called Unwedge that studies pyramidal blocks and supplies an easy-to-use, graphical environment for data entry and visualization. The analysis of support pressure and the sensitivity analysis are done in the different units of the tunnel and the most critical mode of joints combination and the most optimal excavation direction in each of the units is determined. From this analysis, it is possible to ascertain the support pressure for stabilize the rock blocks as a function of the trend and plunge of the tunnel axis. Three-dimensional diagrams have been used to illustrate how the support pressure assembly might affect the design of an excavation.
Keywords: Support pressure; Unwedge; Zaker tunnel; Trend; Plunge
1. Introduction The convergence-confinement method (CCM) is used to analyze the interaction between a rock mass and a support system. One of the main components of CCM is the ground reaction curve (GRC) that defines a relation between the tunnel wall deformations and the ground pressure acting on the tunnel walls. The ground reaction curve (GRC) can be estimated by the analytical manner for the elastic-perfectly-plastic and elastic-brittle rock mass [1], and the numerical manner for the strain-softening rock mass [2]. According to many researchers, the ground pressure stops after the critical deformation, and thus the ground pressure on the support system increases due to the formation of a loosening zone. The extent of the plastic or failure zone and the amount of deformation in the rock mass surrounding the tunnel can be controlled by the application of an internal support pressure (pi) (Fig. 1). When the internal support pressure (pi) is greater than the support pressure, no failure takes place and the behaviour of the rock mass surrounding the tunnel is elastic, but if the internal support pressure (pi) is less than the support pressure, failure occurs. The interaction of the deforming rock mass and the resisting support is shown in the Fig. 2.
*Corresponding Author: [email protected]
Fig.1. Internal support pressure (pi) and plastic zone surrounding a circular tunnel. After Hoek et al., 2008
V. Hosseini Toudeshki
10
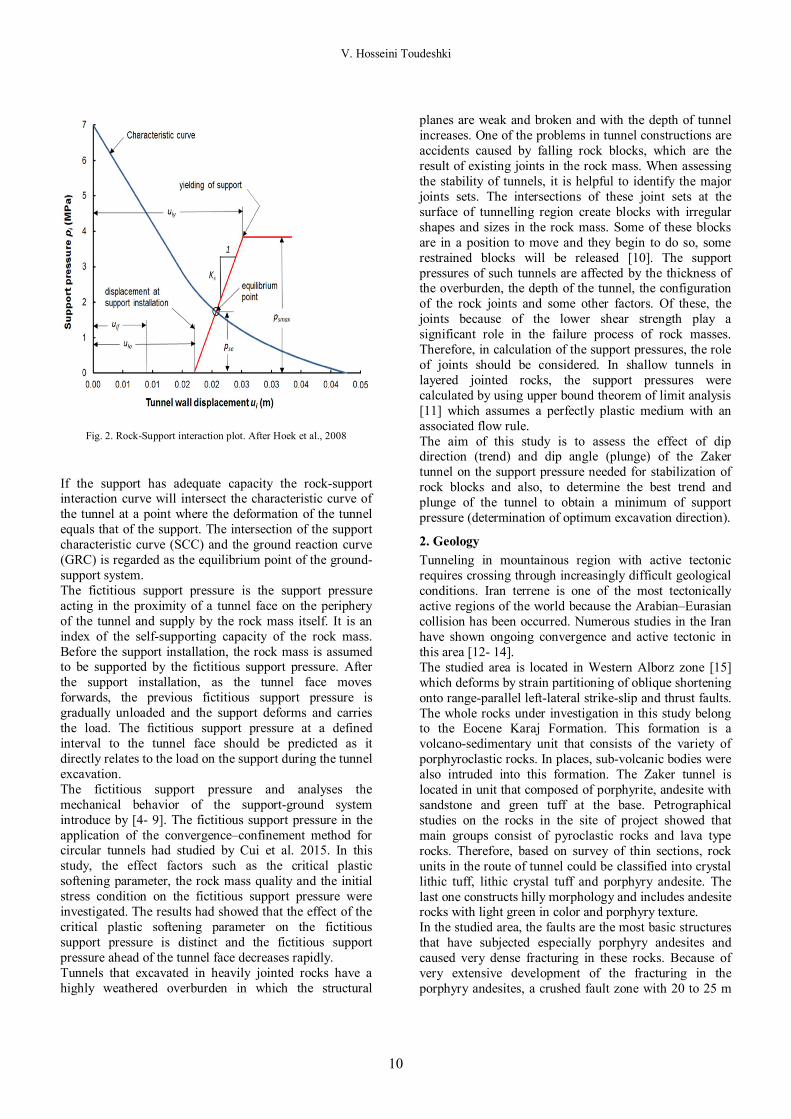
Fig. 2. Rock-Support interaction plot. After Hoek et al., 2008
If the support has adequate capacity the rock-support interaction curve will intersect the characteristic curve of the tunnel at a point where the deformation of the tunnel equals that of the support. The intersection of the support characteristic curve (SCC) and the ground reaction curve (GRC) is regarded as the equilibrium point of the ground-support system. The fictitious support pressure is the support pressure acting in the proximity of a tunnel face on the periphery of the tunnel and supply by the rock mass itself. It is an index of the self-supporting capacity of the rock mass. Before the support installation, the rock mass is assumed to be supported by the fictitious support pressure. After the support installation, as the tunnel face moves forwards, the previous fictitious support pressure is gradually unloaded and the support deforms and carries the load. The fictitious support pressure at a defined interval to the tunnel face should be predicted as it directly relates to the load on the support during the tunnel excavation. The fictitious support pressure and analyses the mechanical behavior of the support-ground system introduce by [4- 9]. The fictitious support pressure in the application of the convergence–confinement method for circular tunnels had studied by Cui et al. 2015. In this study, the effect factors such as the critical plastic softening parameter, the rock mass quality and the initial stress condition on the fictitious support pressure were investigated. The results had showed that the effect of the critical plastic softening parameter on the fictitious support pressure is distinct and the fictitious support pressure ahead of the tunnel face decreases rapidly. Tunnels that excavated in heavily jointed rocks have a highly weathered overburden in which the structural
planes are weak and broken and with the depth of tunnel increases. One of the problems in tunnel constructions are accidents caused by falling rock blocks, which are the result of existing joints in the rock mass. When assessing the stability of tunnels, it is helpful to identify the major joints sets. The intersections of these joint sets at the surface of tunnelling region create blocks with irregular shapes and sizes in the rock mass. Some of these blocks are in a position to move and they begin to do so, some restrained blocks will be released [10]. The support pressures of such tunnels are affected by the thickness of the overburden, the depth of the tunnel, the configuration of the rock joints and some other factors. Of these, the joints because of the lower shear strength play a significant role in the failure process of rock masses. Therefore, in calculation of the support pressures, the role of joints should be considered. In shallow tunnels in layered jointed rocks, the support pressures were calculated by using upper bound theorem of limit analysis [11] which assumes a perfectly plastic medium with an associated flow rule. The aim of this study is to assess the effect of dip direction (trend) and dip angle (plunge) of the Zaker tunnel on the support pressure needed for stabilization of rock blocks and also, to determine the best trend and plunge of the tunnel to obtain a minimum of support pressure (determination of optimum excavation direction).
2. Geology Tunneling in mountainous region with active tectonic requires crossing through increasingly difficult geological conditions. Iran terrene is one of the most tectonically active regions of the world because the Arabian–Eurasian collision has been occurred. Numerous studies in the Iran have shown ongoing convergence and active tectonic in this area [12- 14]. The studied area is located in Western Alborz zone [15] which deforms by strain partitioning of oblique shortening onto range-parallel left-lateral strike-slip and thrust faults. The whole rocks under investigation in this study belong to the Eocene Karaj Formation. This formation is a volcano-sedimentary unit that consists of the variety of porphyroclastic rocks. In places, sub-volcanic bodies were also intruded into this formation. The Zaker tunnel is located in unit that composed of porphyrite, andesite with sandstone and green tuff at the base. Petrographical studies on the rocks in the site of project showed that main groups consist of pyroclastic rocks and lava type rocks. Therefore, based on survey of thin sections, rock units in the route of tunnel could be classified into crystal lithic tuff, lithic crystal tuff and porphyry andesite. The last one constructs hilly morphology and includes andesite rocks with light green in color and porphyry texture. In the studied area, the faults are the most basic structures that have subjected especially porphyry andesites and caused very dense fracturing in these rocks. Because of very extensive development of the fracturing in the porphyry andesites, a crushed fault zone with 20 to 25 m
Journal of Structural Engineering and Geotechnics, 6 (2), 9-20, Summer 2016
11
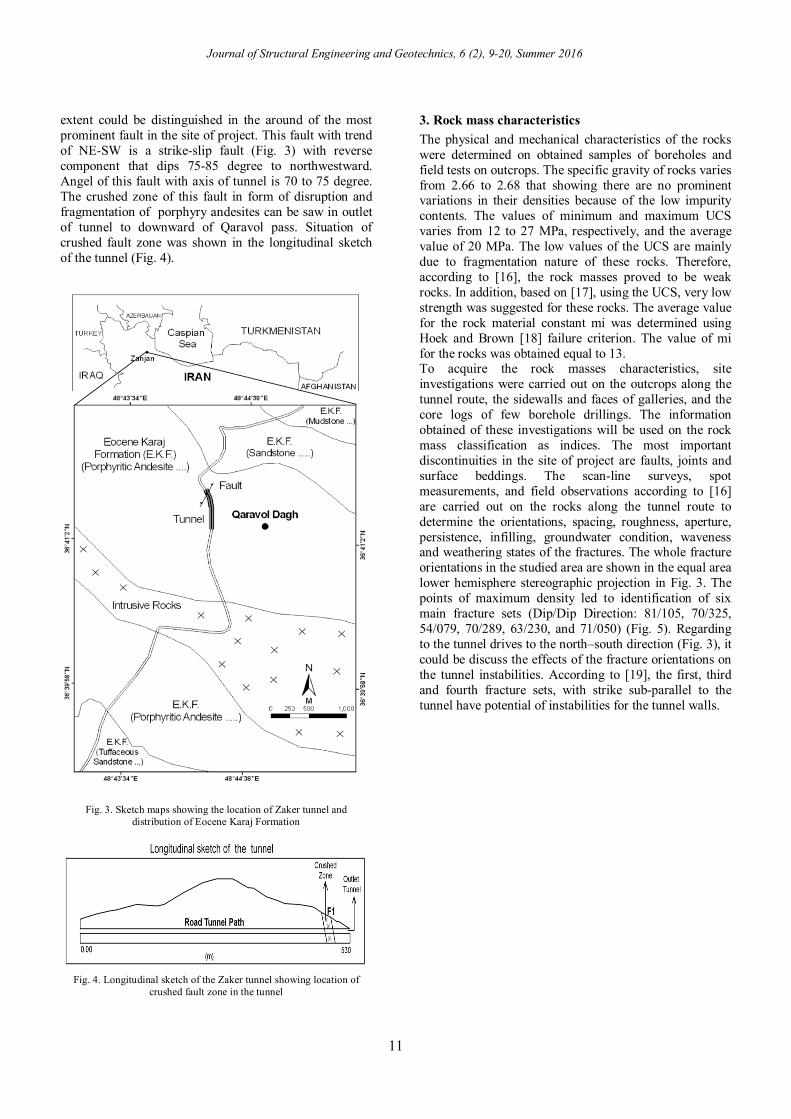
extent could be distinguished in the around of the most prominent fault in the site of project. This fault with trend of NE-SW is a strike-slip fault (Fig. 3) with reverse component that dips 75-85 degree to northwestward. Angel of this fault with axis of tunnel is 70 to 75 degree. The crushed zone of this fault in form of disruption and fragmentation of porphyry andesites can be saw in outlet of tunnel to downward of Qaravol pass. Situation of crushed fault zone was shown in the longitudinal sketch of the tunnel (Fig. 4).
Fig. 3. Sketch maps showing the location of Zaker tunnel and distribution of Eocene Karaj Formation
Fig. 4. Longitudinal sketch of the Zaker tunnel showing location of
crushed fault zone in the tunnel
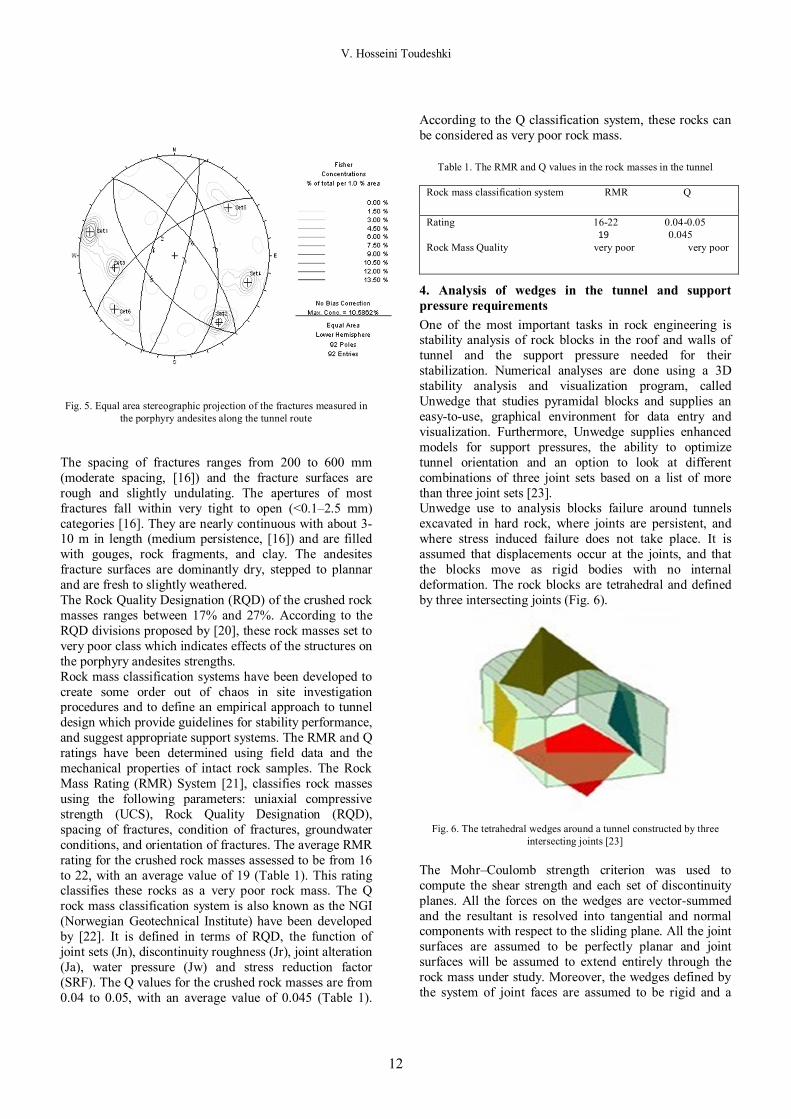
3. Rock mass characteristics The physical and mechanical characteristics of the rocks were determined on obtained samples of boreholes and field tests on outcrops. The specific gravity of rocks varies from 2.66 to 2.68 that showing there are no prominent variations in their densities because of the low impurity contents. The values of minimum and maximum UCS varies from 12 to 27 MPa, respectively, and the average value of 20 MPa. The low values of the UCS are mainly due to fragmentation nature of these rocks. Therefore, according to [16], the rock masses proved to be weak rocks. In addition, based on [17], using the UCS, very low strength was suggested for these rocks. The average value for the rock material constant mi was determined using Hoek and Brown [18] failure criterion. The value of mi for the rocks was obtained equal to 13. To acquire the rock masses characteristics, site investigations were carried out on the outcrops along the tunnel route, the sidewalls and faces of galleries, and the core logs of few borehole drillings. The information obtained of these investigations will be used on the rock mass classification as indices. The most important discontinuities in the site of project are faults, joints and surface beddings. The scan-line surveys, spot measurements, and field observations according to [16] are carried out on the rocks along the tunnel route to determine the orientations, spacing, roughness, aperture, persistence, infilling, groundwater condition, waveness and weathering states of the fractures. The whole fracture orientations in the studied area are shown in the equal area lower hemisphere stereographic projection in Fig. 3. The points of maximum density led to identification of six main fracture sets (Dip/Dip Direction: 81/105, 70/325, 54/079, 70/289, 63/230, and 71/050) (Fig. 5). Regarding to the tunnel drives to the north–south direction (Fig. 3), it could be discuss the effects of the fracture orientations on the tunnel instabilities. According to [19], the first, third and fourth fracture sets, with strike sub-parallel to the tunnel have potential of instabilities for the tunnel walls.
V. Hosseini Toudeshki
12
Fig. 5. Equal area stereographic projection of the fractures measured in
the porphyry andesites along the tunnel route
The spacing of fractures ranges from 200 to 600 mm (moderate spacing, [16]) and the fracture surfaces are rough and slightly undulating. The apertures of most fractures fall within very tight to open (<0.1–2.5 mm) categories [16]. They are nearly continuous with about 3-10 m in length (medium persistence, [16]) and are filled with gouges, rock fragments, and clay. The andesites fracture surfaces are dominantly dry, stepped to plannar and are fresh to slightly weathered. The Rock Quality Designation (RQD) of the crushed rock masses ranges between 17% and 27%. According to the RQD divisions proposed by [20], these rock masses set to very poor class which indicates effects of the structures on the porphyry andesites strengths. Rock mass classification systems have been developed to create some order out of chaos in site investigation procedures and to define an empirical approach to tunnel design which provide guidelines for stability performance, and suggest appropriate support systems. The RMR and Q ratings have been determined using field data and the mechanical properties of intact rock samples. The Rock Mass Rating (RMR) System [21], classifies rock masses using the following parameters: uniaxial compressive strength (UCS), Rock Quality Designation (RQD), spacing of fractures, condition of fractures, groundwater conditions, and orientation of fractures. The average RMR rating for the crushed rock masses assessed to be from 16 to 22, with an average value of 19 (Table 1). This rating classifies these rocks as a very poor rock mass. The Q rock mass classification system is also known as the NGI (Norwegian Geotechnical Institute) have been developed by [22]. It is defined in terms of RQD, the function of joint sets (Jn), discontinuity roughness (Jr), joint alteration (Ja), water pressure (Jw) and stress reduction factor (SRF). The Q values for the crushed rock masses are from 0.04 to 0.05, with an average value of 0.045 (Table 1).
According to the Q classification system, these rocks can be considered as very poor rock mass.
Table 1. The RMR and Q values in the rock masses in the tunnel
Rock mass classification system RMR Q
Rating 16-22 0.04-0.05 19 0.045 Rock Mass Quality very poor very poor
4. Analysis of wedges in the tunnel and support pressure requirements One of the most important tasks in rock engineering is stability analysis of rock blocks in the roof and walls of tunnel and the support pressure needed for their stabilization. Numerical analyses are done using a 3D stability analysis and visualization program, called Unwedge that studies pyramidal blocks and supplies an easy-to-use, graphical environment for data entry and visualization. Furthermore, Unwedge supplies enhanced models for support pressures, the ability to optimize tunnel orientation and an option to look at different combinations of three joint sets based on a list of more than three joint sets [23]. Unwedge use to analysis blocks failure around tunnels excavated in hard rock, where joints are persistent, and where stress induced failure does not take place. It is assumed that displacements occur at the joints, and that the blocks move as rigid bodies with no internal deformation. The rock blocks are tetrahedral and defined by three intersecting joints (Fig. 6).
Fig. 6. The tetrahedral wedges around a tunnel constructed by three
intersecting joints [23] The Mohr–Coulomb strength criterion was used to compute the shear strength and each set of discontinuity planes. All the forces on the wedges are vector-summed and the resultant is resolved into tangential and normal components with respect to the sliding plane. All the joint surfaces are assumed to be perfectly planar and joint surfaces will be assumed to extend entirely through the rock mass under study. Moreover, the wedges defined by the system of joint faces are assumed to be rigid and a

Journal of Structural Engineering and Geotechnics, 6 (2), 9-20, Summer 2016
13
limit equilibrium analysis is assumed for single wedges. This manner cannot analyze the overall stability of the tunnel, which requires analysis by Finite Elements or Finite Differences, considering the blocks to be subjected to their corresponding stress and deformation states. For stabilizing of wedges, a uniform support pressure should be applied normal to the excavation boundary to achieve the design factor of safety for a specific wedge. Usually, the value of design factor of safety for tunnels is considered equal to 1.3 to 1.5. For example, in order to stabilizing of wedges in the Fig. 7 a uniform support pressure is applied normal to tunnel wall (Fig. 8).
Fig. 7. Wedges produced by the joint combination [23]
Fig.8. Support pressure applied to entire perimeter of tunnel section for
stabilizing the wedges in the Fig. 5 [23]
5. Numerical analysis of the Zaker tunnel To simulate the excavation of the Zaker tunnel using Unwedge software, a vaulted section of the tunnel is selected and geometric characteristics of this section are shown in Fig. 9. Generally, based on engineering geological characteristics of rock masses, four lithological units ET-1, ET-2, ET-2,1 and EA-1 have been identified in the Zaker tunnel. The analysis of rock blocks and support pressure requirements in each of these units is done individually.
Fig. 9. Geometric characteristics of the tunnel section (dimensions to meters)
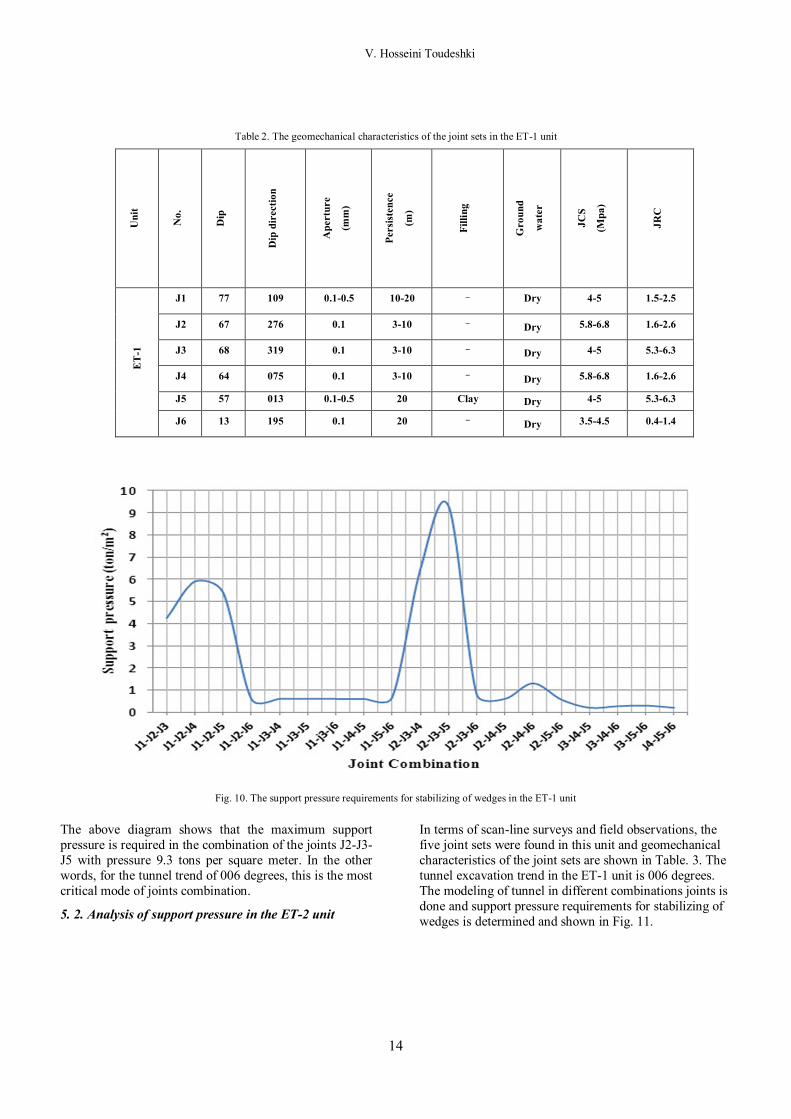
5. 1. Analysis of support pressure in the ET-1 unit According to scan-line surveys and field observations, the six joint sets were distinguished in this unit and geomechanical characteristics of the joint sets are shown in Table. 2. The tunnel excavation trend in the ET-1 unit is 006 degrees. The modeling of tunnel in different combinations joints is done and support pressure requirements for stabilizing of wedges is determined and shown in Fig. 10.
V. Hosseini Toudeshki
14
Table 2. The geomechanical characteristics of the joint sets in the ET-1 unit
JRC
JCS
(Mpa
) G
roun
d
wat
er
Filli
ng
Pers
iste
nce
(m
)
Ape
rtur
e
(mm
)
Dip
dir
ectio
n
Dip
No.
Uni
t
1.5-2.5 4-5 Dry - 10-20 0.1-0.5 109 77 J1
ET
-1
1.6-2.6 5.8-6.8 Dry - 3-10 0.1 276 67 J2
5.3-6.3 4-5 Dry - 3-10 0.1 319 68 J3
1.6-2.6 5.8-6.8 Dry - 3-10 0.1 075 64 J4
5.3-6.3 4-5 Dry Clay 20 0.1-0.5 013 57 J5
0.4-1.4 3.5-4.5 Dry - 20 0.1 195 13 J6
Fig. 10. The support pressure requirements for stabilizing of wedges in the ET-1 unit
The above diagram shows that the maximum support pressure is required in the combination of the joints J2-J3-J5 with pressure 9.3 tons per square meter. In the other words, for the tunnel trend of 006 degrees, this is the most critical mode of joints combination.
5. 2. Analysis of support pressure in the ET-2 unit
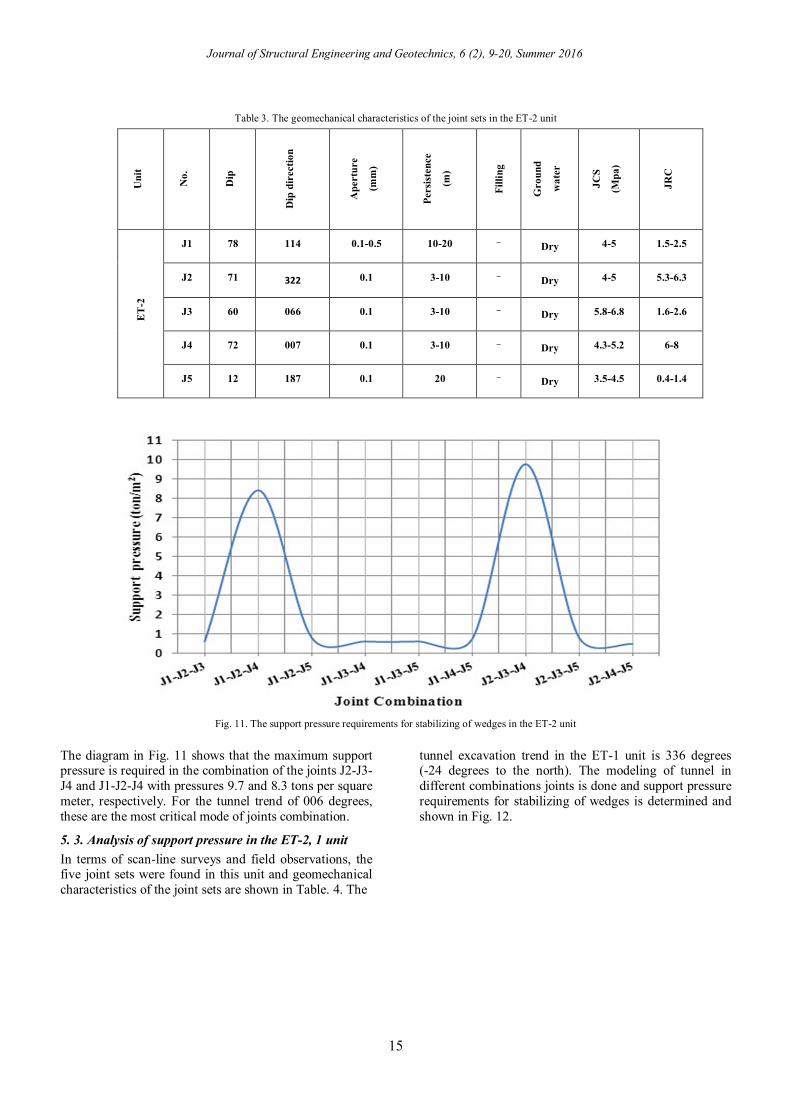
In terms of scan-line surveys and field observations, the five joint sets were found in this unit and geomechanical characteristics of the joint sets are shown in Table. 3. The tunnel excavation trend in the ET-1 unit is 006 degrees. The modeling of tunnel in different combinations joints is done and support pressure requirements for stabilizing of wedges is determined and shown in Fig. 11.
Journal of Structural Engineering and Geotechnics, 6 (2), 9-20, Summer 2016
15
Table 3. The geomechanical characteristics of the joint sets in the ET-2 unit
JRC
JCS
(Mpa
) G
roun
d
wat
er
Filli
ng
Pers
iste
nce
(m
)
Ape
rtur
e
(mm
)
Dip
dir
ectio
n
Dip
No.
Uni
t
1.5-2.5 4-5 Dry - 10-20 0.1-0.5 114 78 J1
ET
-2
5.3-6.3 4-5 Dry - 3-10 0.1 322 71 J2
1.6-2.6 5.8-6.8 Dry - 3-10 0.1 066 60 J3
6-8 4.3-5.2 Dry - 3-10 0.1 007 72 J4
0.4-1.4 3.5-4.5 Dry - 20 0.1 187 12 J5
Fig. 11. The support pressure requirements for stabilizing of wedges in the ET-2 unit
The diagram in Fig. 11 shows that the maximum support pressure is required in the combination of the joints J2-J3-J4 and J1-J2-J4 with pressures 9.7 and 8.3 tons per square meter, respectively. For the tunnel trend of 006 degrees, these are the most critical mode of joints combination.
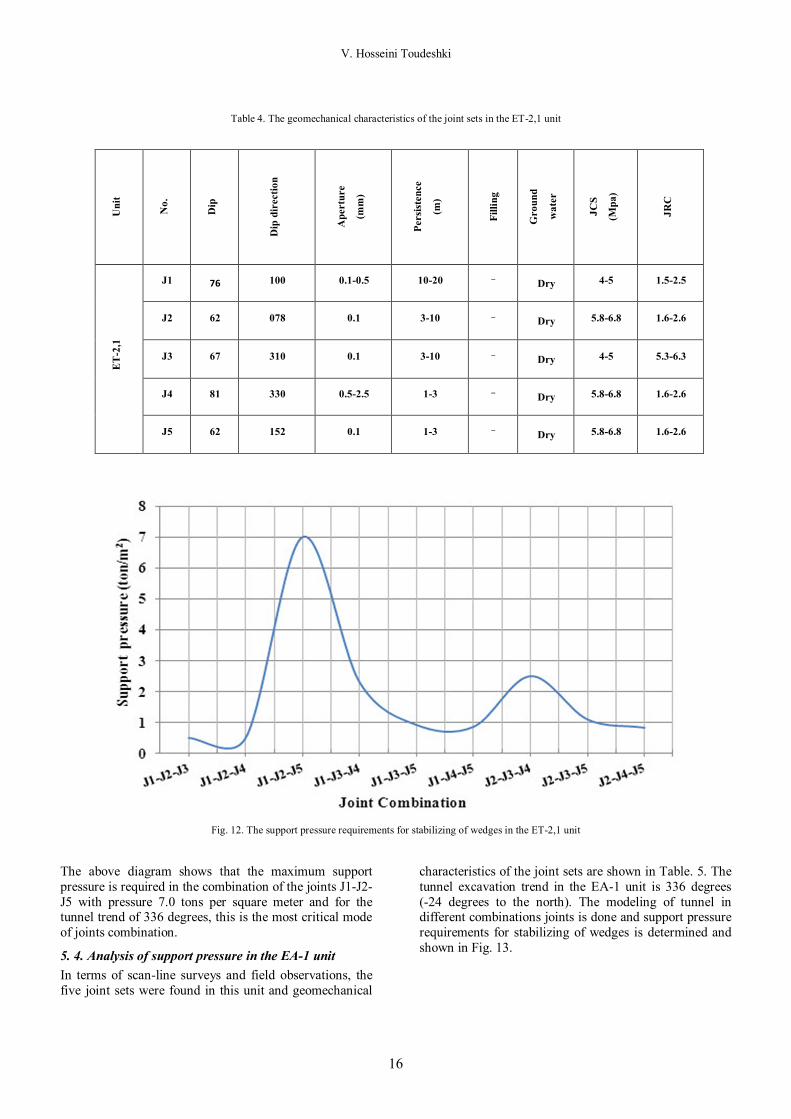
5. 3. Analysis of support pressure in the ET-2, 1 unit In terms of scan-line surveys and field observations, the five joint sets were found in this unit and geomechanical characteristics of the joint sets are shown in Table. 4. The
tunnel excavation trend in the ET-1 unit is 336 degrees (-24 degrees to the north). The modeling of tunnel in different combinations joints is done and support pressure requirements for stabilizing of wedges is determined and shown in Fig. 12.
V. Hosseini Toudeshki
16
Table 4. The geomechanical characteristics of the joint sets in the ET-2,1 unit
Fig. 12. The support pressure requirements for stabilizing of wedges in the ET-2,1 unit
The above diagram shows that the maximum support pressure is required in the combination of the joints J1-J2-J5 with pressure 7.0 tons per square meter and for the tunnel trend of 336 degrees, this is the most critical mode of joints combination.
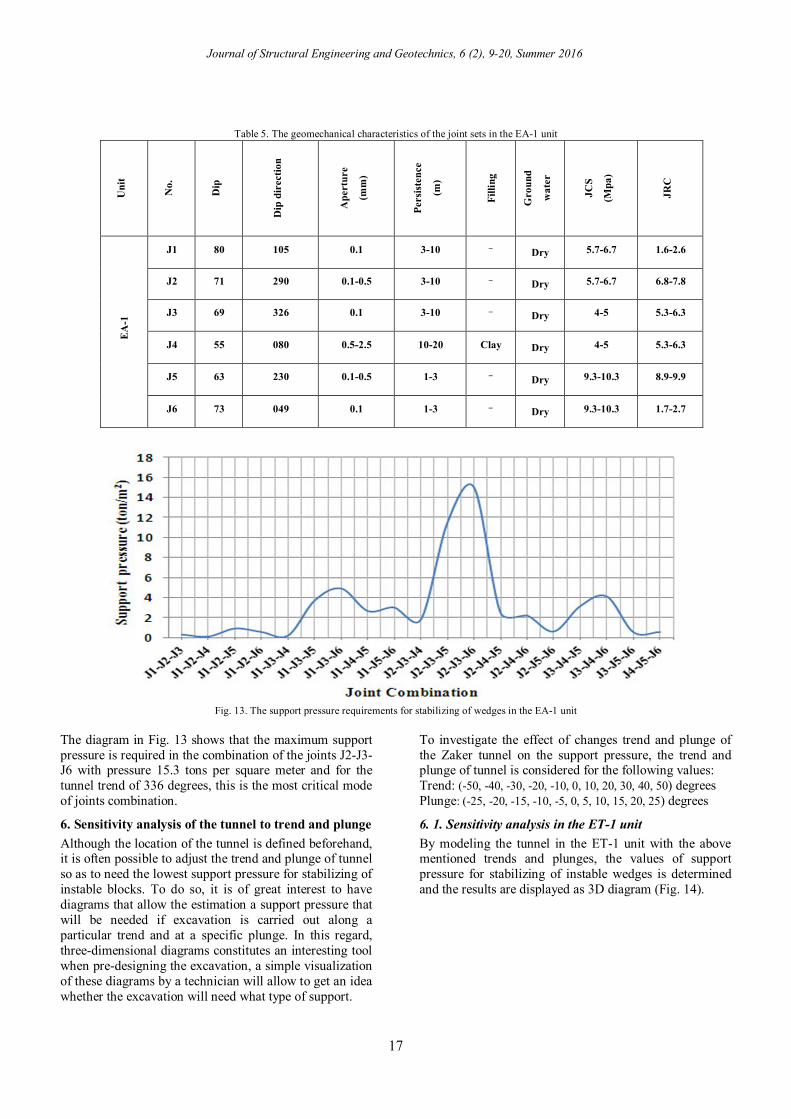
5. 4. Analysis of support pressure in the EA-1 unit In terms of scan-line surveys and field observations, the five joint sets were found in this unit and geomechanical
characteristics of the joint sets are shown in Table. 5. The tunnel excavation trend in the EA-1 unit is 336 degrees (-24 degrees to the north). The modeling of tunnel in different combinations joints is done and support pressure requirements for stabilizing of wedges is determined and shown in Fig. 13.
JRC
JCS
(Mpa
) G
roun
d
wat
er
Filli
ng
Pers
iste
nce
(m
)
Ape
rtur
e
(mm
)
Dip
dir
ectio
n
Dip
No.
Uni
t
1.5-2.5 4-5 Dry - 10-20 0.1-0.5 100 76 J1
ET
-2,1
1.6-2.6 5.8-6.8 Dry - 3-10 0.1 078 62 J2
5.3-6.3 4-5 Dry - 3-10 0.1 310 67 J3
1.6-2.6 5.8-6.8 Dry - 1-3 0.5-2.5 330 81 J4
1.6-2.6 5.8-6.8 Dry - 1-3 0.1 152 62 J5
Journal of Structural Engineering and Geotechnics, 6 (2), 9-20, Summer 2016
17
Table 5. The geomechanical characteristics of the joint sets in the EA-1 unit
JRC
JCS
(Mpa
) G
roun
d
wat
er
Filli
ng
Pers
iste
nce
(m
)
Ape
rtur
e
(mm
)
Dip
dir
ectio
n
Dip
No.
Uni
t
1.6-2.6 5.7-6.7 Dry - 3-10 0.1 105 80 J1
EA
-1
6.8-7.8 5.7-6.7 Dry - 3-10 0.1-0.5 290 71 J2
5.3-6.3 4-5 Dry - 3-10 0.1 326 69 J3
5.3-6.3 4-5 Dry Clay 10-20 0.5-2.5 080 55 J4
8.9-9.9 9.3-10.3 Dry - 1-3 0.1-0.5 230 63 J5
1.7-2.7 9.3-10.3 Dry - 1-3 0.1 049 73 J6
Fig. 13. The support pressure requirements for stabilizing of wedges in the EA-1 unit
The diagram in Fig. 13 shows that the maximum support pressure is required in the combination of the joints J2-J3-J6 with pressure 15.3 tons per square meter and for the tunnel trend of 336 degrees, this is the most critical mode of joints combination.
6. Sensitivity analysis of the tunnel to trend and plunge Although the location of the tunnel is defined beforehand, it is often possible to adjust the trend and plunge of tunnel so as to need the lowest support pressure for stabilizing of instable blocks. To do so, it is of great interest to have diagrams that allow the estimation a support pressure that will be needed if excavation is carried out along a particular trend and at a specific plunge. In this regard, three-dimensional diagrams constitutes an interesting tool when pre-designing the excavation, a simple visualization of these diagrams by a technician will allow to get an idea whether the excavation will need what type of support.
To investigate the effect of changes trend and plunge of the Zaker tunnel on the support pressure, the trend and plunge of tunnel is considered for the following values: Trend: (-50, -40, -30, -20, -10, 0, 10, 20, 30, 40, 50) degrees Plunge: (-25, -20, -15, -10, -5, 0, 5, 10, 15, 20, 25) degrees
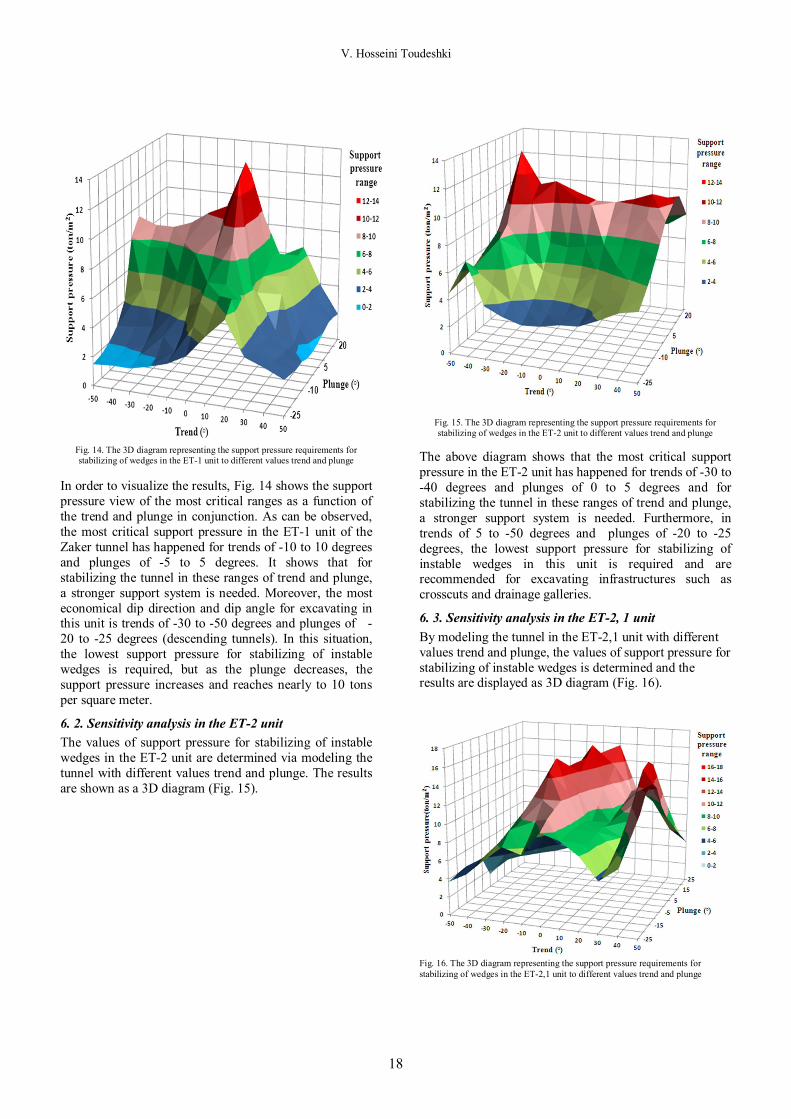
6. 1. Sensitivity analysis in the ET-1 unit By modeling the tunnel in the ET-1 unit with the above mentioned trends and plunges, the values of support pressure for stabilizing of instable wedges is determined and the results are displayed as 3D diagram (Fig. 14).
V. Hosseini Toudeshki
18
Fig. 14. The 3D diagram representing the support pressure requirements for stabilizing of wedges in the ET-1 unit to different values trend and plunge
In order to visualize the results, Fig. 14 shows the support pressure view of the most critical ranges as a function of the trend and plunge in conjunction. As can be observed, the most critical support pressure in the ET-1 unit of the Zaker tunnel has happened for trends of -10 to 10 degrees and plunges of -5 to 5 degrees. It shows that for stabilizing the tunnel in these ranges of trend and plunge, a stronger support system is needed. Moreover, the most economical dip direction and dip angle for excavating in this unit is trends of -30 to -50 degrees and plunges of -20 to -25 degrees (descending tunnels). In this situation, the lowest support pressure for stabilizing of instable wedges is required, but as the plunge decreases, the support pressure increases and reaches nearly to 10 tons per square meter.
6. 2. Sensitivity analysis in the ET-2 unit The values of support pressure for stabilizing of instable wedges in the ET-2 unit are determined via modeling the tunnel with different values trend and plunge. The results are shown as a 3D diagram (Fig. 15).
Fig. 15. The 3D diagram representing the support pressure requirements for stabilizing of wedges in the ET-2 unit to different values trend and plunge
The above diagram shows that the most critical support pressure in the ET-2 unit has happened for trends of -30 to -40 degrees and plunges of 0 to 5 degrees and for stabilizing the tunnel in these ranges of trend and plunge, a stronger support system is needed. Furthermore, in trends of 5 to -50 degrees and plunges of -20 to -25 degrees, the lowest support pressure for stabilizing of instable wedges in this unit is required and are recommended for excavating infrastructures such as crosscuts and drainage galleries.
6. 3. Sensitivity analysis in the ET-2, 1 unit By modeling the tunnel in the ET-2,1 unit with different values trend and plunge, the values of support pressure for stabilizing of instable wedges is determined and the results are displayed as 3D diagram (Fig. 16).
Fig. 16. The 3D diagram representing the support pressure requirements for stabilizing of wedges in the ET-2,1 unit to different values trend and plunge

Journal of Structural Engineering and Geotechnics, 6 (2), 9-20, Summer 2016
19
The above diagram shows that the most critical support pressure in the ET-2, 1 unit has happened for trend of 0.00 degrees and plunge of 15 degrees, although in trends of -30 to 10 degrees and plunges 0 to 20 degrees is also required high support pressure for stabilizing of wedges. Moreover, the most economical dip direction and dip angle for excavating in this unit is trends of -40 to -50 degrees and all plunges, since in these situations, the lowest support pressure for stabilizing of instable wedges is required.
6. 4. Sensitivity analysis in the EA-1 unit The values of support pressure for stabilizing of instable wedges in the EA-1 unit are determined via modeling the tunnel with different values trend and plunge. The results are shown as a 3D diagram (Fig. 17).
Fig. 17. The 3D diagram representing the support pressure requirements for stabilizing of wedges in the EA-1 unit to different values trend and plunge As can be seen in Fig. 17, the most critical support pressure in the EA-1 unit has happened for trends of 10 to 20 degrees and plunges of 5 to 10 degrees. In this case, the support pressure reaches about 40 tons per square meter and therefore for stabilizing the tunnel a very strong support system is needed. Moreover, the best trend and plunge for excavating of the tunnel in this unit is trends of -20 to -30 degrees and plunge of -25 degrees. In this situation, the lowest support pressure for stabilizing of instable wedges is required. By comparing the 3D diagrams obtained from the sensitivity analysis it can be concluded that the least support pressure is related to trends of below zero degrees and the most optimal excavation direction of the Zaker tunnel is the trends of -40 to -50 degrees and plunges of -20 to -25 degrees.
7. Conclusions The combination of joint sets in the Zaker tunnel can create the wedges at the roof and walls of tunnel which some of them are instable and in order to stabilize the wedges, a uniform support pressure should be applied normal to the excavation boundary. The software Unwedge includes computer-aided design features such as stability analysis of wedges involving multiple
discontinuity sets, the support pressure, and determination of optimum excavation direction. This program provides a support design which is based upon the largest possible wedge which can occur in the roof and walls of the tunnel. These wedges can form in rock masses with very persistent discontinuity surface such as bedding planes in layered sedimentary rocks. In many metamorphic or igneous rocks, the discontinuity surfaces are not continuous and the size of the wedges that can from is limited by the persistence these surfaces. From the analysis of the support pressure presented in the study, it is possible to ascertain the support pressure needed to stabilize the wedges as a function of the trend and plunge of the tunnel axis. Accordingly, the most critical mode of joints combination in the different units of the Zaker tunnel is obtained from the analysis of support pressure and the most optimal excavation direction in each of the units is determined from the sensitivity analysis of the tunnel.
8. References [1] Sharan, S. K. (2005). Exact and approximate solutions for
displacements around circular openings in elasto-brittle-plastic Hoek–Brown rock. Int J Rock Mech Min Sci., 42, 542–549.
[2] Wang, S. L., Yin, X. T., Tang, H., Ge, X. R. (2010). A new approach for analyzing circular tunnel in strain-softening rock masses. Int J Rock Mech Min Sci., 47, 170–178.
[3] Hoek, E., Carranza-Torres, C., Diederichs, M. S., Corkum, B. (2008). Rock-Support Interaction analysis for tunnels in weak rock masses, Rocscience Inc, Canada.
[4] Schwartz, C. W., Einstein, H. H. (1979). Simplified analysis for tunnel supports. J Geotech. Eng. Div. ASCE, 104 (4), 499–518.
[5] Schwartz, C. W., Einstein, H. H. (1980). Simplified analysis for ground-structure interaction in tunnelling. In: Proceedings of the21st Symposium on Rock Mechanics. Rolla: University of Missouri, 787–796.
[6] Fahimifar, A., Ranjbarnia, M. (2009). Analytical approach for the design of active grouted rock bolts in tunnel stability based on convergence-confinement method. Tunn Undergr Space Technol., 24, 363–375.
[7] Carranza-Torres, C., Diederichs, M. (2009). Mechanical analysis of circular liners with particular reference to composite supports. For example, liners consisting of shotcrete and steel sets. Tunn Undergr Space Technol., 24, 506–532.
[8] Osgoui, R. R., Oreste, P. (2010). Elasto-plastic analytical model for the design of grouted bolts in a Hoek–Brown medium. Int J Numer Anal Method Geomech., 34, 1651–1686.
[9] Carranza-Torres, C., Rysdahl, B., Kasim, M. (2013). On the elastic analysis of a circular lined tunnel considering the delayed installation of the support. Int J Rock Mech Min Sci., 6,57–85.
[10] Menéndez-Díaz, A., González-Palacio, C., Álvarez-Vigil, A. E., González-Nicieza, C., Ramírez-Oyanguren, P. (2009). Analysis of tetrahedral and pentahedral key blocks in underground excavations, Computers and Geotechnics, 36, 1009–1023.
[11] Zhiwei Wang, Chunsheng Qiao, Chaoye Song, Junfeng Xu. (2014). Upper bound limit analysis of support pressures of

V. Hosseini Toudeshki
20
shallow tunnels in layered jointed rock strata, Tunnelling and Underground Space Technology, 43 , 171–183.
[12] Jackson, J. A., Priestley, K., Allen, M. B., Berberian, M. (2002). Active tectonics of the South Caspian Basin. Geophysical Journal International, 148, 214–245.
[13] Allen, M. B., Ghasemi, M. R., Shahrabi, M., Qorashi, M. (2003). Accommodation of late Cenozoic oblique shortening in the Alborz range, northern Iran. J. Structural Geology, 25, 655-672.
[14] Allen, M. B., Jackson, J. A., Walker, R. (2004). Late Cenozoic reorganization of the Arabia-Eurasia collision and the comparison of short-term and long-term deformation rates: Tectonics, v. 23, art. no. TC2008, doi: 10.1029/2003 TC001530.
[15] Aghanabati, A. (2004). Geology of Iran. Geological Survey of Iran, 619 pp.
[16] International Soil and Rock Mechanics ISRM, (1981). In: Brown, E. T. (Ed.), Rock Characterization, Testing and Monitoring, ISRM Suggested Methods. Pergamon Press, Oxford, 211 pp.
[17] Deere, D. U., Miller, R. P. (1966). Engineering classification and index properties of intact rock. Tech. Rept. No. AFWL-TR-65-116, Air Force Weapons Lab., Kirtland Air Force Base, New Mexico, 308 pp.
[18] Hoek, E., Brown, T. (1988). The Hoek–Brown failure criteria—a 1988 update, In: Proc. 15th Canadian Rock Mech. Symp., 31–38.
[19] Yeung, M. R., Leong, L. C. (1997). Effects of joint attributes on tunnel stability. Int. J. Rock Mech. Min. Sci., 34 (3 and 4), 505.
[20] Deere, D. U. (1964). Technical description of rock cores for engineering purposes. Rock Mech. Rock Eng., 1, 17–22.
[21] Bieniawski, Z. T. (1989). Engineering Rock Mass Classification. Wiley, New York, 251 pp.
[22] Barton, N. R., Lien, R., Lunde, J. (1974). Engineering classification of rock masses for the design of tunnel support. Rock Mech., 4, 189–239.
[23] Rocscience, (1992). UNWEDGE reference manual, 50 pp.