analysis of technological parameters through response ... · analysis of technological parameters...
TRANSCRIPT
26
Estonian Journal of Engineering, 2012, 18, 1, 26–41 doi: 10.3176/eng.2012.1.03
Analysis of technological parameters through response surface methodology in machining hardened
X38CrMoV5-1 using whisker ceramic tool (Al2O3+SiC)
Brahim Fnidesa,b, Sofiane Berkanib, Mohamed Athmane Yalleseb,
Smail Boutabbab, Jean-François Rigalc and Salim Daffrid
a Département de Construction Mécanique et Productique, FGM&GP, USTHB, BP 32 El-Alia, Bab-Ezzouar, 16111, Alger, Algérie; [email protected]
b Laboratoire Mécanique et Structures (LMS), Département de Génie Mécanique, Université 08 Mai 1945 de Guelma, BP : 401, Guelma 24000, Algérie
c Université de Lyon, CNRS, INSA – Lyon, LaMCoS, UMR5259, F69621, France; [email protected]
d dDEAD Contracting & Trading Ltd, 07 Rue Doudou Mokhtar, Ben Aknoun, 16000, Alger, Algérie; [email protected]
Received 21 March 2011, in revised form 16 January 2012 Abstract. This experimental study is an attempt to model technological parameters such as cutting forces and surface roughness in hard turning of X38CrMoV5-1 hot work tool steel hardened to 50 HRC. This steel is free from tungsten on Cr-Mo-V basis, insensitive to temperature changes and has a high wear resistance. It is employed for the manufacture of helicopter rotor blades and forging dies. The workpiece is machined by a whisker ceramic tool (insert CC670 of chemical composition 75%Al2O3+25%SiC) under dry conditions. Based on 33 full factorial design, a total of 27 tests are carried out. The range of each parameter is set at three different levels, namely low, medium and high. Mathematical models were deduced by applying analysis of variance (ANOVA) and through factor interaction graphs in the response surface methodology (RSM) in order to express the influence degree of each cutting regime element on cutting force components and surface roughness criteria. The results indicate that the depth of cut is the dominant factor affecting cutting force components. The feed rate influences tangential cutting force more than radial and axial forces. The cutting speed affects radial force more than tangential and axial forces. The results also reveal that feed rate is the dominant factor affecting surface roughness, followed by cutting speed. As for the depth of cut, its effect is not very important. These mathematical models would be helpful in selecting cutting variables for optimization of hard cutting process. Key words: hard turning, whisker ceramic, X38CrMoV5-1, cutting force, surface roughness, ANOVA, RSM.

27
1. INTRODUCTION Hard turning is a cutting process defined as turning materials with hardness
higher than 45 HRC under appropriate cutting tools and high cutting speed. Machining of hard steel using advanced tool materials, such as cubic boron nitride and alumina based ceramic, has more advantages than grinding or polish-ing, such as short cycle time, process flexibility, compatible surface roughness, higher material removal rate and less environment problems without the use of cutting fluid. This process has become a normal practice in industry because it increased productivity and reduced energy consumption [1,2].
Alumina-based ceramics are considered to be one of the most suitable tool materials for machining hardened steels because of their high hot hardness, wear resistance and chemical inertness. However, the ceramic tools possess a high degree of brittleness and low thermal shock resistance which may result in excessive chipping or fracture, thereby reducing tool life. In order to improve their toughness, Al2O3-based ceramics are usually reinforced with TiC, TiN, Ti(C, N), SiC, or TiB2 additions. Alumina, reinforced with SiC whiskers, is the toughest and most resistant to thermal shock of the Al2O3-based ceramics. This whisker reinforcement improves the notch resistance of the insert. The end result is a ceramic insert that can run at speeds five to six times that of conventional carbide insert in nickel-based materials. As an added benefit, the toughness of the SiC whiskers also makes this category of ceramic available for machining harder materials with interruptions [3].
Cutting forces and surface finish are the most important technological para-meters in machining process. Cutting force is the background for the evaluation of the necessary power machining (choice of the electric motor). It is also used for dimensioning of machine tool components and the tool body. It influences machining system stability. In hard turning, cutting forces have been found to be influenced by a number of factors such as depth of cut, feed rate, cutting speed, cutting time, workpiece hardness, etc. Surface roughness is in relation to many properties of machine elements such as wear resistance, the capacity of fit and sealing. In hard turning, surface finish has been found to be influenced by a number of factors such as feed rate, cutting speed, tool nose radius and tool geometry, cutting time, workpiece hardness, stability of the machine tool and the workpiece set-up, etc [4].
Theoretical arithmetic mean surface roughness achievable based on tool geometry and feed rate is given approximately as 2
a 0.032R f rε= ( f is feed rate and rε is the tool nose radius).
The relationship between hardness and cutting forces during turning AISI 4340 steel, hardened from 29 to 57 HRC using mixed alumina tools, was investigated in [5,6]. The results suggest that an increase of 48% in hardness leads to an increase in cutting forces from 30% to 80%. It is reported that for work material hardness values between 30 and 50 HRC, continuous chips were formed and the cutting force components were reduced. However, when the workpiece

28
hardness increased above 50 HRC, segmented chips were observed and the cutting force showed a sudden elevation.
In machining AISI D2 steel, hardened at 62 HRC with CBN tools, the relationship between forces and cutting regime could be represented by power function type equations [7]. Empirical models were found to correlate the surface finish with the feed rate and cutting speed. The results indicated that the surface roughness increases with the increase of the feed rate, and almost decreases with the increase of cutting speed in the analysis of surface roughness parameters in turning of FRP tubes by PCD tool [8].
Surface roughness has been investigated in finish turning of AISI D2 steels (60 HRC) using ceramic wiper inserts. Experimental results showed that surface roughness aR values as low as 0.18–0.20 µm are attainable with wiper tools. Better surface finishes were obtained at the lowest feed rate and highest cutting speed combination [9].
The results of the experimental study on turning hardened AISI 4140 steel (63 HRC) with Al2O3+TiCN mixed ceramic tools showed that only two interactions, cutting speed–feed rate and feed rate–axial depth of cut, have statically significant influence on the surface roughness: they explain 28% and 23% of the total variation, respectively. An analysis of the interaction plots revealed that in order to minimize the surface roughness, the highest speed, 250 m/min, the lowest level of axial depth of cut, 0.25 mm, and the medium level of feed rate, 0.10 mm/rev, should be preferred. The analysis also showed that setting only the feed rate to its lowest level, 0.05 mm/rev, provides a robust alternative to the aforementioned optimal combination [10].
In hard machining of hardened bearing steel using a cubic boron nitride tool, the radial force is dominating, especially when machining is within the limit of tool nose radius. Such finding is in contradiction with what is known from conventional turning as r t(0.3 0.5)F F= − (here rF is the radial (thrust) force and
tF is the tangential cutting force). Consequently, the radial force can not be neglected in characterizing the static and dynamic behaviour of such machining system. For the 100Cr6 steel roughness, the machining surface is a function of the local damage form and the wear profile of CBN tool. When augmenting the cutting speed c ,V tool wear increases and leads directly to the degradation of the surface quality. In spite of the evolution of flank wear (VB) up to the allowable limit [VB] = 0.3 mm, aR did not exceed 0.55 µm. Roughness is largely influenced by the feed rate under hard turning conditions, although the theoretical model does not describe rationally this effect. Therefore, the use of parametric models may allow better descriptions of roughness phenomena as a function of various factors. A relation between VB and aR in the form ( )
a e VBR k β= is proposed. Coefficients k and β vary within the ranges 0.204–0.258 and 1.67–2.90, respectively. It permits the follow-up of tool wear from easily accessible workpiece roughness data [11].
The aim of the present study is to develop statistical models of technological parameters studied for using the main cutting parameters such as cutting speed,

29
feed rate and depth of cut on X38CrMoV5-1 hardened steel. Machining tests were carried out under different conditions with whisker ceramic cutting tool. The predicting equations for cutting force components and surface roughness criteria have been developed. Constants and coefficients of these equations were calculated by applying analysis of variance, multiple linear regression and response surface methodology of softwares Minitab 15 and Design-Expert. How-ever, these models were built using only the main cutting variables (cutting speed, feed rate and depth of cut) and significant interactions. The confirmation experiments, carried out to check the validity of developed models, predicted response factors within 2% error.
2. EXPERIMENTAL PROCEDURE The material used for experiments is X38CrMoV5-1, hot work tool steel
which is popularly used in hot form pressing. Its resistance to high temperature and its aptitude for polishing enable it to answer the most severe requests in hot dieing, helicopter rotor blades and moulds under pressure. Its chemical composi-tion is given in Table 1.
The workpiece is of 73 mm in diameter and it is machined under dry condi-tions. It is hardened to 50 HRC. Its hardness was measured by a digital durometer DM2D.
The lathe used for machining operations is TOS TRENCIN, model SN40C, spindle power 6.6 kW. The cutting forces have been measured in real time within the three components a( ,F rF and t )F using a quartz KISTLER dynamometer, model 9257 B.
A 2D roughness meter Surftest 201, Mitutoyo, was selected to measure different criteria of surface roughness (arithmetic mean roughness a ,R total rough-ness tR and mean depth of roughness z ).R Roughness values were obtained with-out disassembling the workpiece in order to reduce uncertainties due to resumption operations. These measurements were repeated three times out of three generatrices equally positioned at 120° and the result is an average of these values for a given machining pass.
Table 1. Chemical composition of grade X38CrMoV5-1
Composition Wt, %
C 0.35 Cr 5.26 Mo 1.19 V 0.5 Si 1.01 Mn 0.32 S 0.002 P 0.016
Other components 1.042 Fe 90.31
30
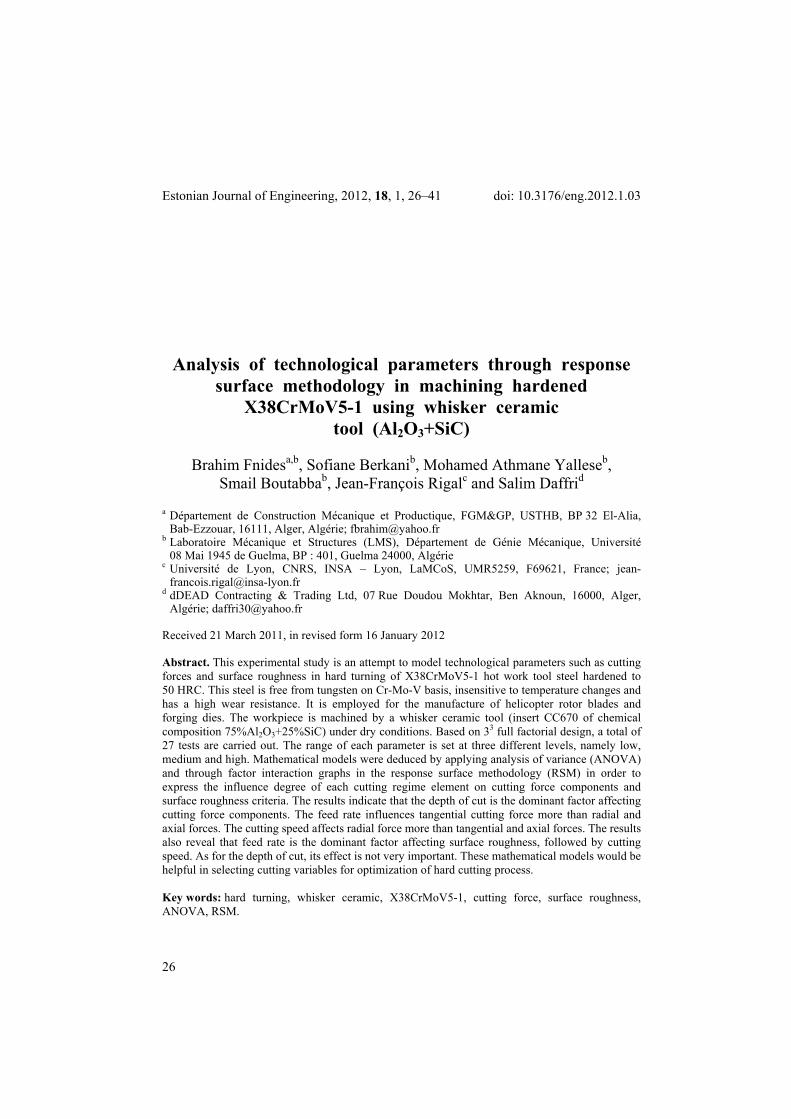
The cutting insert used is a whisker ceramic (CC670), removable, of square form with eight cutting edges and having designation SNGN 120408 T01020. It is mounted on a commercial toolholder of designation CSBNR2525M12 with the geometry of active part characterized by the following angles: 75 ,χ = ° 6 ,α = °
6 ,γ = − ° 6λ = − ° [12]. Here χ is the major cutting edge angle, α is the relief angle, γ is the rake angle and λ is the inclination angle.
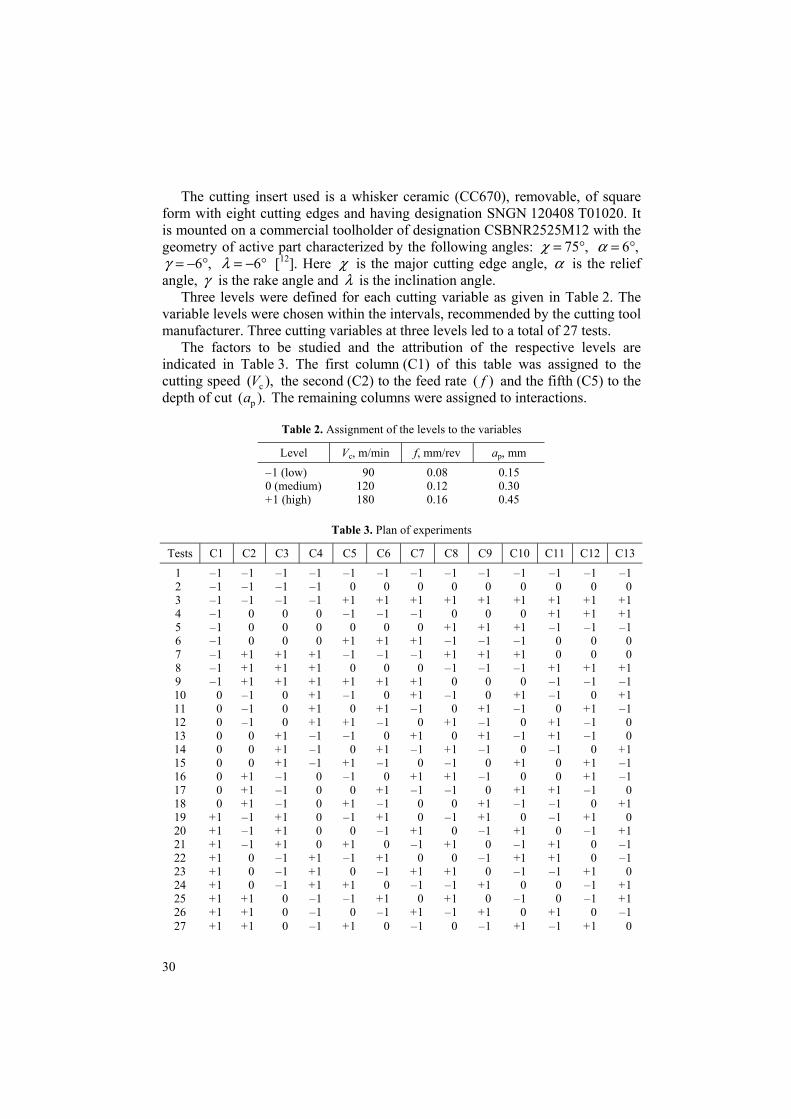
Three levels were defined for each cutting variable as given in Table 2. The variable levels were chosen within the intervals, recommended by the cutting tool manufacturer. Three cutting variables at three levels led to a total of 27 tests.
The factors to be studied and the attribution of the respective levels are indicated in Table 3. The first column (C1) of this table was assigned to the cutting speed c( ),V the second (C2) to the feed rate ( )f and the fifth (C5) to the depth of cut p( ).a The remaining columns were assigned to interactions.
Table 2. Assignment of the levels to the variables
Level Vc, m/min f, mm/rev ap, mm – 1 (low) 90 0.08 0.15 0 (medium) 120 0.12 0.30 + 1 (high) 180 0.16 0.45
Table 3. Plan of experiments
Tests C1 C2 C3 C4 C5 C6 C7 C8 C9 C10 C11 C12 C13 1 – 1 – 1 – 1 – 1 – 1 – 1 – 1 – 1 – 1 – 1 – 1 – 1 – 1 2 – 1 – 1 – 1 – 1 0 0 0 0 0 0 0 0 0 3 – 1 – 1 – 1 – 1 + 1 + 1 + 1 + 1 + 1 +1 + 1 + 1 + 1 4 – 1 0 0 0 – 1 – 1 – 1 0 0 0 + 1 + 1 + 1 5 – 1 0 0 0 0 0 0 + 1 + 1 +1 – 1 – 1 – 1 6 – 1 0 0 0 + 1 + 1 + 1 – 1 – 1 – 1 0 0 0 7 – 1 + 1 + 1 + 1 – 1 – 1 – 1 + 1 + 1 +1 0 0 0 8 – 1 + 1 + 1 + 1 0 0 0 – 1 – 1 – 1 + 1 + 1 + 1 9 – 1 + 1 + 1 + 1 + 1 + 1 + 1 0 0 0 – 1 – 1 – 1 10 0 – 1 0 + 1 – 1 0 + 1 – 1 0 +1 – 1 0 + 1 11 0 – 1 0 + 1 0 + 1 – 1 0 + 1 – 1 0 + 1 – 1 12 0 – 1 0 + 1 + 1 – 1 0 + 1 – 1 0 + 1 – 1 0 13 0 0 + 1 – 1 – 1 0 + 1 0 + 1 – 1 + 1 – 1 0 14 0 0 + 1 – 1 0 + 1 – 1 + 1 – 1 0 – 1 0 + 1 15 0 0 + 1 – 1 + 1 – 1 0 – 1 0 +1 0 + 1 – 1 16 0 + 1 – 1 0 – 1 0 + 1 + 1 – 1 0 0 + 1 – 1 17 0 + 1 – 1 0 0 + 1 – 1 – 1 0 +1 + 1 – 1 0 18 0 + 1 – 1 0 + 1 – 1 0 0 + 1 – 1 – 1 0 + 1 19 + 1 – 1 + 1 0 – 1 + 1 0 – 1 + 1 0 – 1 + 1 0 20 + 1 – 1 + 1 0 0 – 1 + 1 0 – 1 +1 0 – 1 + 1 21 + 1 – 1 + 1 0 + 1 0 – 1 + 1 0 – 1 + 1 0 – 1 22 + 1 0 – 1 + 1 – 1 + 1 0 0 – 1 +1 + 1 0 – 1 23 + 1 0 – 1 + 1 0 – 1 + 1 + 1 0 – 1 – 1 + 1 0 24 + 1 0 – 1 + 1 + 1 0 – 1 – 1 + 1 0 0 – 1 + 1 25 + 1 + 1 0 – 1 – 1 + 1 0 + 1 0 – 1 0 – 1 + 1 26 + 1 + 1 0 – 1 0 – 1 + 1 – 1 + 1 0 + 1 0 – 1 27 + 1 + 1 0 – 1 + 1 0 – 1 0 – 1 +1 – 1 + 1 0

31
3. RESULTS AND DISCUSSION Table 4 presents experimental results of cutting force components a( ,F rF
and t )F and surface roughness criteria a( ,R tR and z )R for various combina-tions of cutting regime elements (cutting speed, feed rate and depth of cut) according to 33 full factorial design. The results indicate that cutting forces decrease with increasing cutting speed. This can be related to the temperature increase in cutting zone and leads to the reduction of the yield strength of the workpiece and chip thickness. The results also show that cutting forces increase with increasing feed rate and depth of cut because chip thickness becomes significant what causes the growth of the volume of deformed metal and that requires enormous forces to cut the chip. Minimal values of cutting forces and surface finish were obtained at c 180 m/min,V = 0.08 mm/revf = and pa = 0.15 mm (test number 19). That means that increasing of cutting speed with lowest feed rate and depth of cut lead to decreasing of cutting force components
Table 4. Design layout and experimental results
Actual factors Performance measures Tests
Vc, m/min
f, mm/rev
ap, mm
Fa, N
Fr, N
Ft, N
Ra, µm
Rt, µm
Rz, µm
1 90 0.08 0.15 30.11 92.05 67.28 0.45 2.78 1.70 2 90 0.08 0.30 71.72 128.41 116.93 0.44 2.80 1.81 3 90 0.08 0.45 110.99 176.72 160.84 0.46 3.01 1.89 4 90 0.12 0.15 35.38 108.58 80.19 0.54 3.63 2.16 5 90 0.12 0.30 95.33 155.23 150.62 0.56 3.67 2.21 6 90 0.12 0.45 114.32 204.97 222.74 0.51 3.74 2.30 7 90 0.16 0.15 42.25 139.67 103.36 0.75 4.86 3.94 8 90 0.16 0.30 101.87 201.37 194.47 0.77 4.89 3.97 9 90 0.16 0.45 156.64 264.08 286.85 0.71 4.91 4.06 10 120 0.08 0.15 26.69 84.93 61.09 0.44 2.70 1.60 11 120 0.08 0.30 62.97 121.29 113.58 0.43 2.79 1.69 12 120 0.08 0.45 107.95 170.30 157.94 0.42 2.81 1.75 13 120 0.12 0.15 32.52 100.01 79.28 0.53 3.22 2.14 14 120 0.12 0.30 92.28 144.12 140.59 0.49 3.30 2.19 15 120 0.12 0.45 110.01 171.41 213.32 0.52 3.41 2.25 16 120 0.16 0.15 38.23 128.98 98.74 0.69 4.79 3.87 17 120 0.16 0.30 88.94 198.57 193.13 0.70 4.82 3.90 18 120 0.16 0.45 134.76 214.23 263.26 0.68 4.90 3.99 19 180 0.08 0.15 25.34 77.86 56.92 0.43 2.69 1.58 20 180 0.08 0.30 58.49 117.48 109.93 0.43 2.75 1.63 21 180 0.08 0.45 86.66 168.39 151.40 0.40 2.83 1.72 22 180 0.12 0.15 31.83 95.56 70.08 0.51 3.18 2.11 23 180 0.12 0.30 89.42 139.13 130.06 0.46 3.25 2.22 24 180 0.12 0.45 107.61 170.52 215.50 0.47 3.33 2.24 25 180 0.16 0.15 38.17 125.47 96.45 0.59 4.43 3.67 26 180 0.16 0.30 87.38 187.85 185.87 0.57 4.56 3.71 27 180 0.16 0.45 131.81 211.24 245.96 0.64 4.74 3.78
32
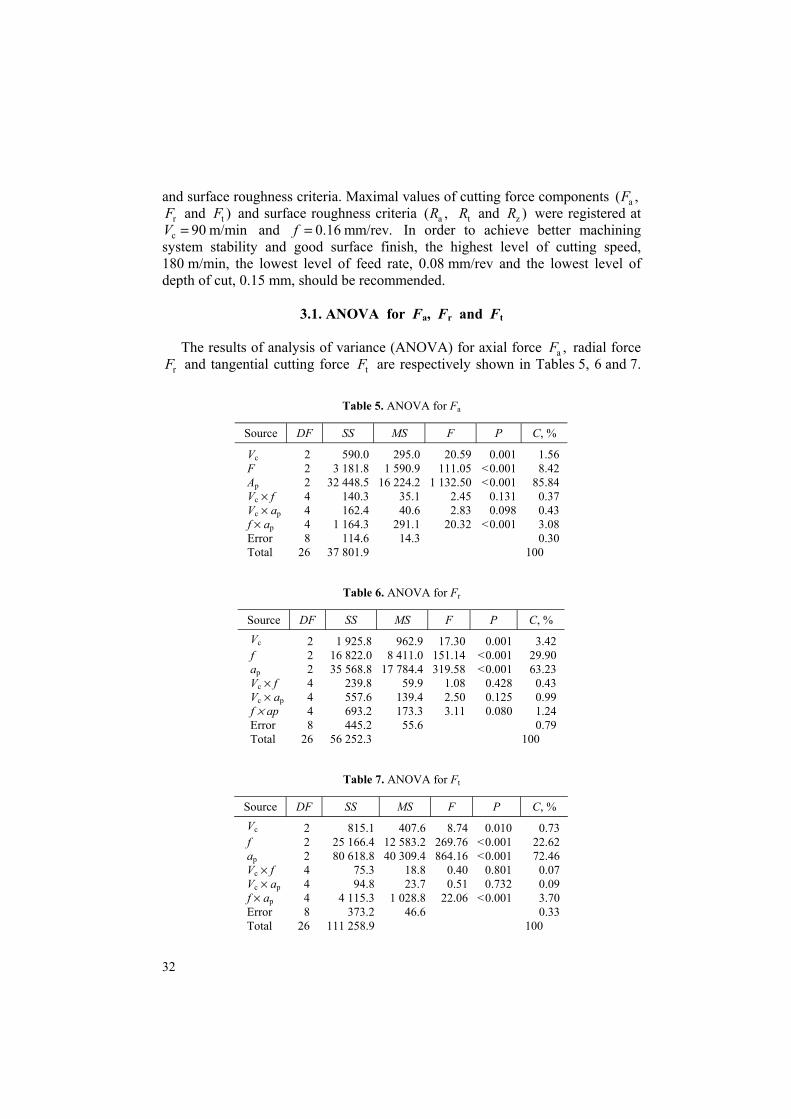
and surface roughness criteria. Maximal values of cutting force components a( ,F rF and t )F and surface roughness criteria a( ,R tR and z )R were registered at c 90 m/minV = and 0.16 mm/rev.f = In order to achieve better machining
system stability and good surface finish, the highest level of cutting speed, 180 m/min, the lowest level of feed rate, 0.08 mm/rev and the lowest level of depth of cut, 0.15 mm, should be recommended.
3.1. ANOVA for Fa, Fr and Ft The results of analysis of variance (ANOVA) for axial force a ,F radial force
rF and tangential cutting force tF are respectively shown in Tables 5, 6 and 7.
Table 5. ANOVA for Fa
Source DF SS MS F P C, %
Vc 2 590.0 295.0 20.59 0.001 1.56 F 2 3 181.8 1 590.9 111.05 < 0.001 8.42 Ap 2 32 448.5 16 224.2 1 132.50 < 0.001 85.84 Vc × f 4 140.3 35.1 2.45 0.131 0.37 Vc × ap 4 162.4 40.6 2.83 0.098 0.43 f × ap 4 1 164.3 291.1 20.32 < 0.001 3.08 Error 8 114.6 14.3 0.30 Total 26 37 801.9 100
Table 6. ANOVA for Fr
Source DF SS MS F P C, % Vc 2 1 925.8 962.9 17.30 0.001 3.42 f 2 16 822.0 8 411.0 151.14 < 0.001 29.90 ap 2 35 568.8 17 784.4 319.58 < 0.001 63.23 Vc × f 4 239.8 59.9 1.08 0.428 0.43 Vc × ap 4 557.6 139.4 2.50 0.125 0.99 f × ap 4 693.2 173.3 3.11 0.080 1.24 Error 8 445.2 55.6 0.79 Total 26 56 252.3 100
Table 7. ANOVA for Ft
Source DF SS MS F P C, % Vc 2 815.1 407.6 8.74 0.010 0.73 f 2 25 166.4 12 583.2 269.76 < 0.001 22.62 ap 2 80 618.8 40 309.4 864.16 < 0.001 72.46 Vc × f 4 75.3 18.8 0.40 0.801 0.07 Vc × ap 4 94.8 23.7 0.51 0.732 0.09 f × ap 4 4 115.3 1 028.8 22.06 < 0.001 3.70 Error 8 373.2 46.6 0.33 Total 26 111 258.9 100

33
These tables also show the degrees of freedom (DF), sum of squares (SS), mean squares (MS), F-values (F) and probability (P) in addition to the percentage contribution (C, %) of each factor and different interactions. A low P value (≤ 0.02) indicates statistical significance for the source on the corresponding response.
It is clear from the results of ANOVA that the depth of cut affects aF in a considerable way. Its contribution is 85.84%. The second factor influencing aF is feed rate. Its contribution is 8.42%. As for cutting speed, its effect is less important and its contribution is 1.56%. The interaction pf a× is significant. Its contribution is 3.08%. The interactions cV f× and c pV a× are not significant.
Respectively, their contributions are 0.37% and 0.43%. It can be seen that the depth of cut is the most important factor affecting radial force r .F Its contribu-tion is 63.23%. The second factor influencing rF is feed rate. Its contribution is 29.90%. As for the cutting speed, its contribution is 3.42%. The interactions
c ,V f× c pV a× and pf a× are not significant. Respectively, their contributions are 0.43%, 0.99% and 1.24%. It can be noted that the depth of cut is the dominant factor affecting tangential cutting force t .F Its contribution is 72.46%. The second factor influencing tF is feed rate. Its contribution is 22.62%. As for the cutting speed, its effect is less significant because its contribution is 0.73%. The interaction pf a× is significant. Its contribution is 3.70%. The interactions
cV f× and c pV a× are not significant. Respectively, their contributions are 0.07% and 0.09%. These results are close to those found in [13–21]. The difference is the hardness of machined steel, its chemical composition and its mechanical characteristics. For this cutting regime (0.12 ≤ f ≤ 0.16 mm/rev and pa = 0.45 mm), we confirm that the tangential cutting force becomes the major force.
To understand the hard turning process in terms of cutting forces, mathematical models were developed using the multiple regression method. a ,F
rF and tF models are successively given by Eqs (1), (2) and (3). Respectively, their coefficients of correlation 2R are 95.48%, 93.02% and 98.9%.
a c p p9.67 0.12 5.79 146.40 1126.39F V f a f a= − − + + , (1)
r c p0.145 0.199 741.708 295.8334F V f a= − − + + , (2)
t c p p26.04 0.14 47.63 91.70 2953.19F V f a f a= − + + + . (3)
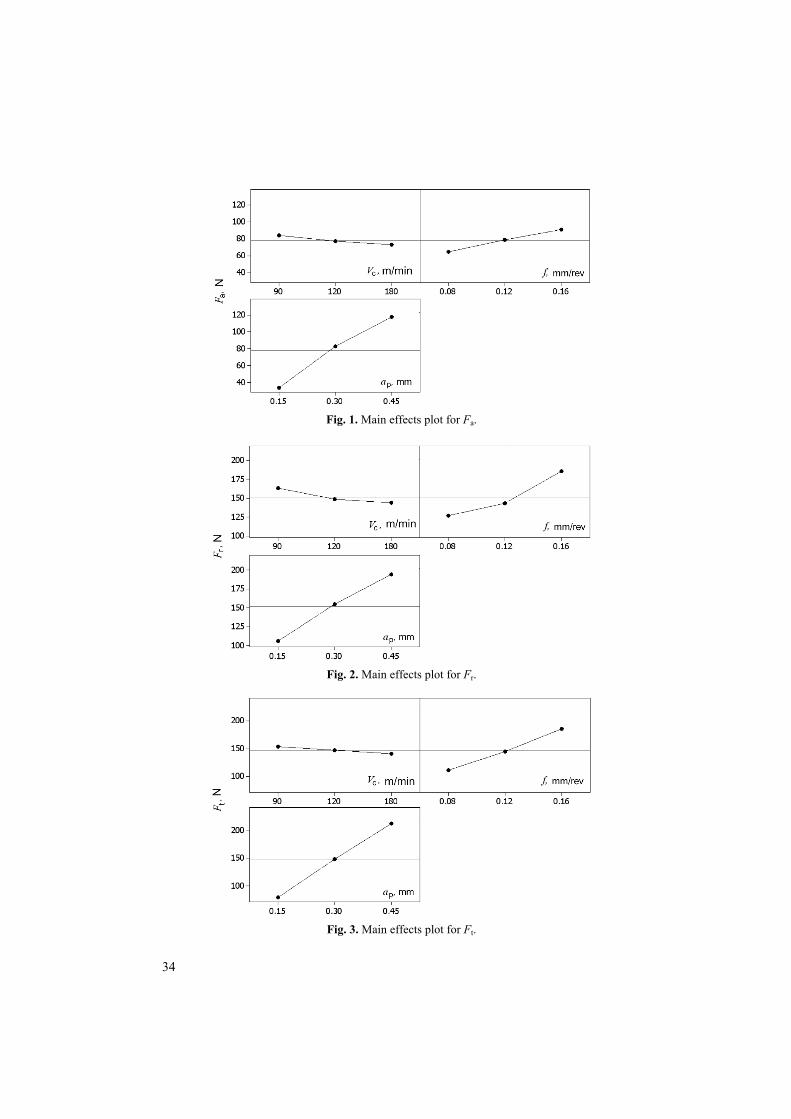
3.2. Main effects plot for Fa, Fr and Ft
Figures 1, 2 and 3 give the main factor plots for a ,F rF and t .F Cutting
forces appear to be decreasing functions of c.V These figures also indicate that a ,F rF and tF are almost linear increasing functions of pa and .f
34
Fig. 1. Main effects plot for Fa.
Fig. 2. Main effects plot for Fr.
Fig. 3. Main effects plot for Ft.
35
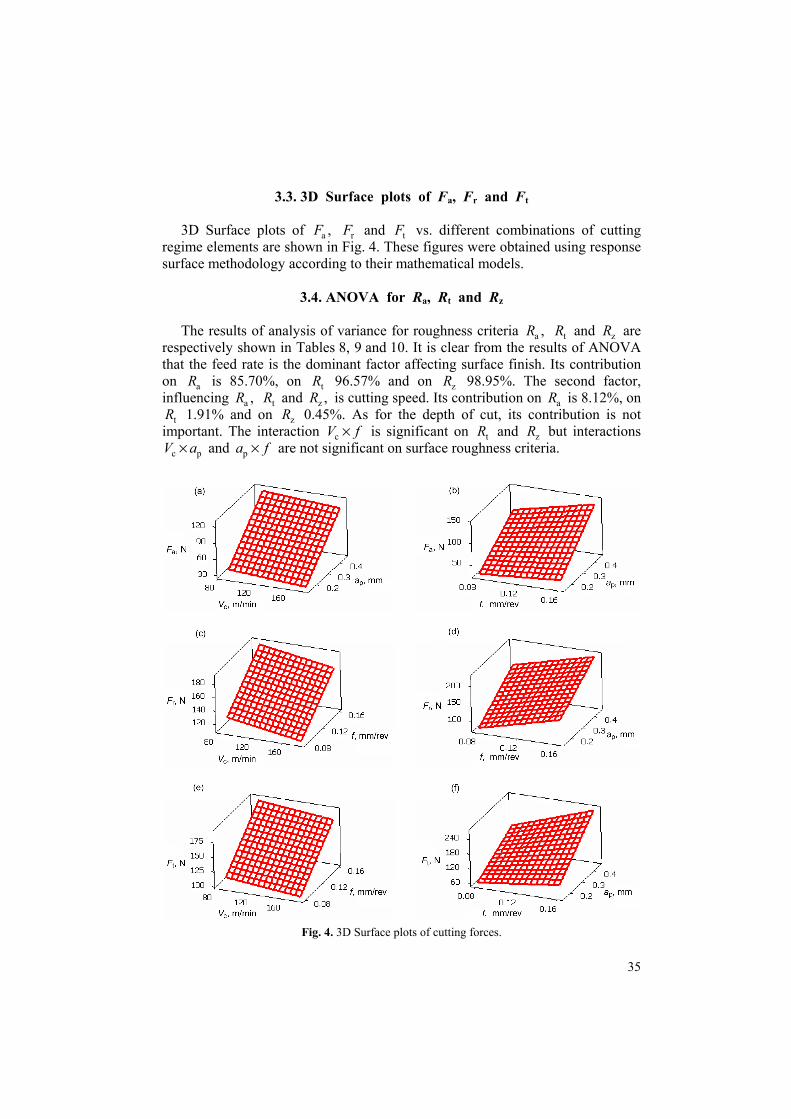
3.3. 3D Surface plots of Fa, Fr and Ft 3D Surface plots of a ,F rF and tF vs. different combinations of cutting
regime elements are shown in Fig. 4. These figures were obtained using response surface methodology according to their mathematical models.
3.4. ANOVA for Ra, Rt and Rz
The results of analysis of variance for roughness criteria a ,R tR and zR are
respectively shown in Tables 8, 9 and 10. It is clear from the results of ANOVA that the feed rate is the dominant factor affecting surface finish. Its contribution on aR is 85.70%, on tR 96.57% and on zR 98.95%. The second factor, influencing a ,R tR and z ,R is cutting speed. Its contribution on aR is 8.12%, on
tR 1.91% and on zR 0.45%. As for the depth of cut, its contribution is not important. The interaction cV f× is significant on tR and zR but interactions
c pV a× and pa f× are not significant on surface roughness criteria.
Fig. 4. 3D Surface plots of cutting forces.

36
Table 8. ANOVA for Ra
Source DF SS MS F P C, %
Vc 2 0.026674 0.013337 18.23 0.001 8.12 f 2 0.281341 0.140670 192.31 < 0.001 85.70 ap 2 0.000830 0.000415 0.57 0.588 0.25 Vc × f 4 0.011081 0.002770 3.79 0.052 3.38 Vc × ap 4 0.001793 0.000448 0.61 0.665 0.55 ap × f 4 0.000726 0.000181 0.25 0.903 0.22 Error 8 0.005852 0.000731 1.78 Total 26 0.328296 100
Table 9. ANOVA for Rt
Source DF SS MS F P C, %
Vc 2 0.3616 0.1808 58.64 < 0.001 1.91 f 2 18.2904 9.1452 2966.01 < 0.001 96.57 ap 2 0.1106 0.0553 17.93 0.001 0.58 Vc × f 4 0.1476 0.0369 11.96 0.002 0.78 Vc × ap 4 0.0056 0.0014 0.46 0.766 0.03 ap × f 4 0.0002 0.0001 0.02 0.999 0.01 Error 8 0.0247 0.0031 0.12 Total 26 18.9407 100
Table 10. ANOVA for Rz
Source DF SS MS F P C, %
Vc 2 0.1059 0.529 178.09 < 0.001 0.45 f 2 23.2570 11.6285 39 123.85 < 0.001 98.95 ap 2 0.0815 0.0407 137.08 < 0.001 0.35 Vc × f 4 0.0542 0.0136 45.63 < 0.001 0.23 Vc × ap 4 0.0008 0.0002 0.65 0.640 0.00 ap × f 4 0.0028 0.0007 2.32 0.145 0.01 Error 8 0.0024 0.0003 0.01 Total 26 23.5045 100
Models of a ,R tR and zR are given by Eqs (4), (5) and (6). Their coefficients of correlation 2R are 88.9%, 93.87% and 89.25%, respectively:
a c p0.29571 0.00084 3.05556 0.04444 ,R V f a= − + − (4)
t c p c0.4347 0.0009 28.7530 0.5185 0.0316 ,R V f a V f= + + + − (5)
z c p c0.8639 0.0006 29.4970 0.4481 0.0184 .R V f a V f= − + + + − (6)
3.5. Main effects plot for Ra, Rt and Rz
Figures 5, 6 and 7 give the main factor plots for a ,R tR and z .R Surface roughness appears to be a decreasing function of cutting speed c.V These figures also indicate that a ,R tR and zR are increasing functions of the feed rate .f

37
Fig. 5. Main effects plot for Ra.
Fig. 6. Main effects plot for Rt.
Fig. 7. Main effects plot for Rz.
38
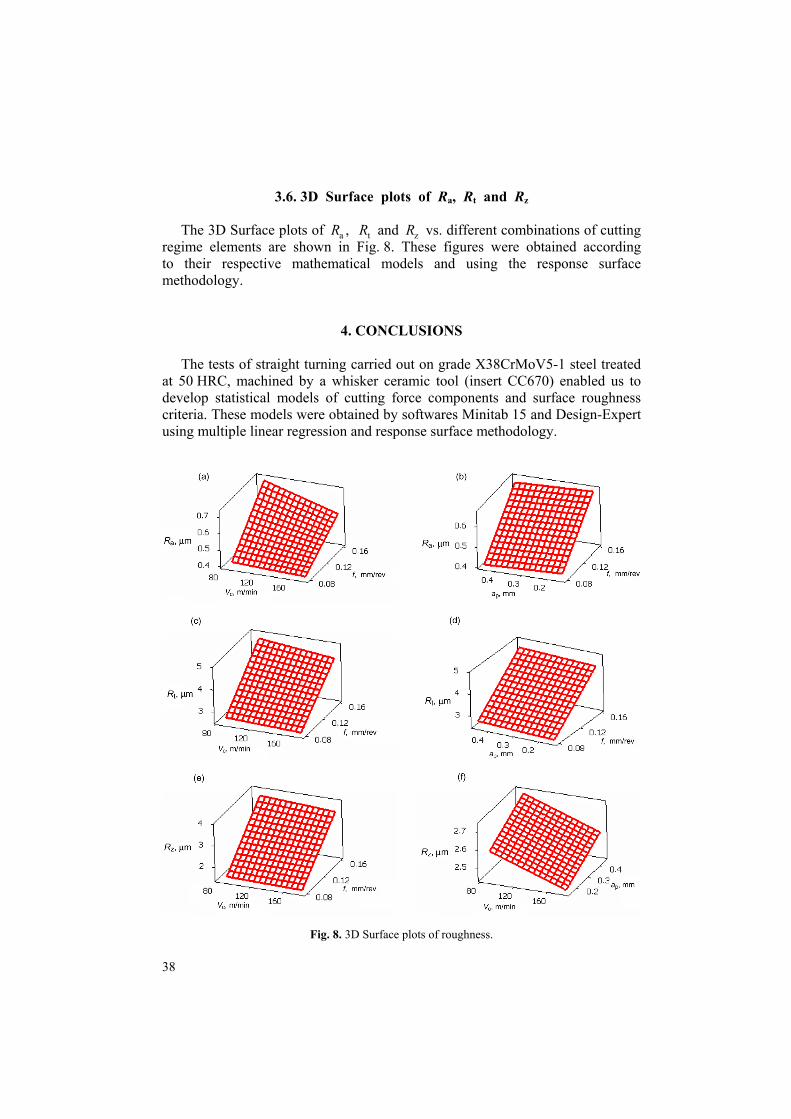
3.6. 3D Surface plots of Ra, Rt and Rz The 3D Surface plots of a ,R tR and zR vs. different combinations of cutting
regime elements are shown in Fig. 8. These figures were obtained according to their respective mathematical models and using the response surface methodology.
4. CONCLUSIONS The tests of straight turning carried out on grade X38CrMoV5-1 steel treated
at 50 HRC, machined by a whisker ceramic tool (insert CC670) enabled us to develop statistical models of cutting force components and surface roughness criteria. These models were obtained by softwares Minitab 15 and Design-Expert using multiple linear regression and response surface methodology.
Fig. 8. 3D Surface plots of roughness.

39
The results revealed that the depth of cut seems to influence cutting forces more significantly than the feed rate and cutting speed. The results also indicated that the feed rate is the dominant factor affecting surface roughness, followed by cutting speed. As for the depth of cut, its effect is not very important. Thus, if we want to get good machining system stability, much removed amount of chip and good surface finish, we must use the highest level of cutting speed, 180 m/min, the lowest level of feed rate, 0.08 mm/rev and the medium level of depth of cut, 0.30 mm.
Statistical models deduced defined the degree of influence of each cutting regime element on cutting force components and surface roughness criteria. They can also be used for optimization of the hard machining. This is a very significant issue for automated monitoring of industrial processes.
This study reveals that in dry hard turning of this steel and for all cutting conditions tested, the principal force is not always the radial force. For this cutting regime (0.12 ≤ f ≤ 0.16 mm/rev and p 0.45 mm),a = the tangential cutting force becomes the major force, followed by radial and axial forces. This study confirms that in dry hard turning of this steel and for all cutting conditions tested, the found roughness criteria are close to those obtained in grinding (0.4 ≤ Ra < 0.78 µm).
REFERENCES
1. Fnides, B., Yallese, M. A., Mabrouki, T. and Rigal, J.-F. Surface roughness model in turning hardened hot work steel using mixed ceramic tool. Mechanika. Kaunas: Technologija, 2009, 3(77), 68–73.
2. Qamar, S. Z. Effect of heat treatment on mechanical properties of H11 tool steel. J. Achievements Mater. Manufact. Eng., 2009, 35(2), 115–120.
3. Dewes, R. C. and Aspinwall, D. K. A review of ultra high speed milling of hardened steels. J. Mater. Process. Technol., 1997, 69, 1–17.
4. Ozel, T., Hsu, T. K. and Zeren, E. Effects of cutting edge geometry, workpiece hardness, feed rate and cutting speed on surface roughness and forces in finish turning of hardened AISI H13 steel. Int. J. Adv. Manufact. Technol., 2005, 25, 262–269.
5. Strafford, K. N. and Audy, J. Indirect monitoring of machinability in carbon steels by measure-ment of cutting forces. J. Mater. Process. Technol., 1997, 67, 150–156.
6. Luo, S. Y., Liao, Y. S. and Tsai, Y. Y. Wear characteristics in turning high hardness alloy steel by ceramic and CBN tools. J. Mater. Process. Technol., 1999, 88, 114–121.
7. Arsecularatne, J. A., Zhang, L. C., Montross, C. and Mathew, P. On machining of hardened AISI D2 steel with PCBN tools. J. Mater. Process. Technol., 2006, 171, 244–252.
8. Palanikumar, K., Mata, F. and Paulo Davim, J. Analysis of surface roughness parameters in turning of FRP tubes by PCD tool. J. Mater. Process. Technol., 2008, 204, 469–474.
9. Ozel, T., Karpat, Y., Figueira, L. and Paulo Davim, J. Modelling of surface finish and tool flank wear in turning of AISI D2 steel with ceramic wiper inserts. J. Mater. Process. Technol., 2007, 189, 192–198.
10. Aslan, E., Camuşcu, N. and Birgören, B. Design optimization of cutting parameters when turning hardened AISI 4140 steel (63 HRC) with Al2O3+TiCN mixed ceramic tool. Mater. Des., 2007, 28, 1618–1622.
40
11. Yallese, M. A., Chaoui, K., Zeghib, N., Boulanouar, L. and Rigal, J.-F. Hard machining of hardened bearing steel using cubic boron nitride tool. J. Mater. Process. Technol., 2009, 209, 1092–1104.
12. SANDVIK Coromant. Catalogue Général, Outils de coupe Sandvik Coromant, Tournage – Fraisage – Perçage – Alésage – Attachments, 2009.
13. Paulo Davim, J. and Figueira, L. Machinability evaluation in hard turning of cold work tool steel (D2) with ceramic tools using statistical techniques. J. Mater. Des., 2007, 28, 1186–1191.
14. Noordin, M. Y., Venkatesh, V. C., Sharif, S., Elting, S. and Abdullah, A. Application of response surface methodology in describing the performance of coated carbide tools when turning AISI 1045 steel. J. Mater. Process. Technol., 2004, 145, 46–58.
15. Gaitonde, V. N., Karnik, S. R., Figueira, L. and Paulo Davim, J. Machinability investigations in hard turning of AISI D2 cold work tool steel with conventional and wiper ceramic inserts. Int. J. Refract. Met. Hard Mater., 2009, 27, 754–763.
16. Jackson, M. J., Robinson, G. M. and Morrell, J. S. Machining M42 tool steel using nano-structured coated cutting tools. J. Achiev. Mater. Manufact. Eng., 2007, 23, 83–86.
17. Stoić, A., Kopač, J., Ergić, T. and Duspar, M. Turning conditions of Ck 45 steel with alternate hardness zones. J. Achiev. Mater. Manufact. Eng., 2009, 34, 87–94.
18. Zawada-Tomkiewicz, A. Analysis of surface roughness parameters achieved by hard turning with the use of PCBN tools. Estonian J. Eng., 2011, 17, 88–99.
19. Fnides, B., Yallese, M. A., Mabrouki, T. and Rigal, J.-F. Application of response surface methodology for determining cutting force model in turning hardened AISI H11 hot work tool steel. SADHANA-APES, 2011, 36, 109–123.
20. Aouici, H., Yallese, M. A., Fnides, B., Chaoui, K. and Mabrouki, T. Modeling and optimization of hard turning of X38CrMoV5-1 steel with CBN tool: Machining parameters effects on flank wear and surface roughness. J. Mech. Sci. Technol., 2011, 25, 2843–2851.
21. Aouici, H., Yallese, M. A., Fnides, B. and Mabrouki, T. Machinability investigation in hard turning of AISI H11 hot work steel with CBN tool. Mechanika. Kaunas: Technologija, 2010, 6(86), 71–77.
Tehnoloogiliste parameetrite analüüs karastatud tööriistaterase X38CrMoV5-1 treimisel niitmonokristallidega armeeritud
keraamilise (Al2O3+SiC) lõikeriistaga
Brahim Fnides, Sofiane Berkani, Mohamed Athmane Yallese, Smail Boutabba, Jean-François Rigal ja Salim Daffri
Käesolevas eksperimentaalses uurimuses on modelleeritud lõiketöötluse pea-
misi parameetreid (lõikejõu komponendid ja pinnakareduse parameetrid) kõvadu-seni 50 HRC karastatud kuumstantsiterase X38CrMoV5-1 treimisel. Kulumiskin-del Cr-Mo-V tööriistateras on volframivaba, ei ole tundlik temperatuurimuutus-tele ja leiab kasutamist helikopteritiivikute ning stantside valmistamisel. Kuum-stantsiterast treiti monokristallidega armeeritud Al2O3 baasil keraamiliste (75% Al2O3 + 25% SiC) lõiketeradega jahutusvedelikku kasutamata. Eksperi-mentide kavandamisel kasutati täisfaktoriaalset planeerimismeetodit. Kokku tehti 27 katset iga uuritava faktori (lõikekiirus, ettenihkekiirus, lõikesügavus) kolmel erineval tasandil. Analüüsiti eelnimetatud tehnoloogiliste faktorite mõju lõikejõu kolmele komponendile ja pinnakaredust iseloomustavatele parameetritele.

41
Uurimistulemused näitasid, et domineeriva mõjuga lõikejõu komponentidele on lõikesügavus. Ettenihkekiirus on suurima mõjuga lõikejõu tangentsiaalkompo-nendile, väiksem radiaal- ja aksiaalkomponendile. Lõikekiiruse mõju on suurim lõikejõu radiaalkomponendile, väiksem tangentsiaal- ja aksiaalkomponendile. Tulemused näitavad samuti, et pinnakaredust mõjutab kõige rohkem ettenihke-kiirus. Vähim mõju on lõikesügavusel. Uurimistöö tulemusena saadud matemaa-tilised mudelid on abiks lõiketöötlusparameetrite valikul suure kõvadusega töö-riistateraste treimisel rasketes lõiketingimustes.