analysis of the catalytic site of the gtpase ran 1 catalysis of gtp
TRANSCRIPT
Analysis of the catalytic site of the GTPase Ran
1
Catalysis of GTP hydrolysis by small GTPases at atomic detail by integration of X-ray crystallography, experimental and theoretical IR spectroscopy
Till Rudack1,#, Sarah Jenrich1,#, Sven Brucker1, Ingrid R. Vetter2, Klaus Gerwert1,3, and Carsten Kötting1
1Biophysics, University of Bochum, Universitaetstrasse 150, 44780 Bochum, Germany 2Max-Planck-Institut für Molekulare Physiologie, Otto-Hahn-Strasse 11, 44227 Dortmund, Germany 3Chinese Academy of Sciences-Max Planck Partner Institute and Key Laboratory for Computational
Biology, Shanghai Institutes for Biological Sciences, 320 Yue Yang Road, Shanghai, 200031, China
#these authors contributed equally
*Running title: Analysis of the catalytic site of the GTPase Ran
To whom correspondence should be addressed: Klaus Gerwert, Department of Biophysics, Ruhr University Bochum, Universitätsstr. 150, D-44801 Bochum, Germany, Tel.: +49-234-3224461; Fax.: +49-234-3214238; e-mail: [email protected]; Carsten Kötting, Department of Biophysics, Ruhr University Bochum, Universitätsstr. 150, D-44801 Bochum, Germany, Tel.: +49-234-3224873; Fax.: +49-234-3204873; e-mail: [email protected]
Keywords: small GTPase, spectroscopy, X-ray crystallography, computer simulations, nuclear transport, reaction mechanism, QM/MM simulation, FTIR, nucleotide coordination, crystal structure
Background: The Mg coordination in the active
site of GTPases varies among X-ray structures of Ran and related GTPases.
Results: The Mg is in both Ras and Ran always coordinated to the - and -phosphate.
Conclusion: Other factors like steric hindrance by the Y39 side chain influence the hydrolysis rate in Ran.
Significance: The new information allows an improved view on the catalytic mechanism of GTPases.
ABSTRACT: Small GTPases regulate key processes in cells. Malfunction of their GTPase reaction by mutations is involved in severe diseases. Here, we compare the GTPase reaction of the slower hydrolyzing GTPase Ran with Ras. By combination of time-resolved FTIR-difference spectroscopy and QM/MM simulations we elucidate that the Mg2+ coordination by the phosphate groups, which varies largely among the X-ray structures, is the same for Ran and Ras. A new X-ray structure of a Ran·RanBD1 complex with improved resolution confirmed this finding and
revealed a general problem with the refinement of Mg2+ in GTPases. The Mg2+ coordination is not responsible for the much slower GTPase reaction of Ran. Instead, the location of the Tyr39 side chain of Ran between the γ-phosphate and Gln69 prevents the optimal positioning of the attacking water molecule by the Gln69 relative to the γ-phosphate. This is confirmed in the RanY39A·RanBD1 crystal structure. The QM/MM simulations provide IR spectra of the catalytic center which agree very nicely with the experimental ones. The combination of both methods can correlate spectra with structure at atomic detail. For example the FTIR difference spectra of RasA18T and RanT25A mutants show that spectral differences are mainly due to the hydrogen bond of Thr25 to the α-phosphate in Ran. By integration of X-ray structure analysis, experimental and theoretical IR spectroscopy the catalytic center of the X-ray structural models are further refined to sub-Ångstrom resolution, allowing an improved understanding of catalysis.
http://www.jbc.org/cgi/doi/10.1074/jbc.M115.648071The latest version is at JBC Papers in Press. Published on August 13, 2015 as Manuscript M115.648071
Copyright 2015 by The American Society for Biochemistry and Molecular Biology, Inc.
by guest on January 29, 2018http://w
ww
.jbc.org/D
ownloaded from

Analysis of the catalytic site of the GTPase Ran
2
1. INTRODUCTION
Small GTPases are molecular switches, which regulate many cellular processes (1, 2). The “on” state is characterized by a specific conformation of the switch region of the proteins which is induced by GTP binding, while the “off” state is obtained with GDP in the binding pocket. The “switch off” is performed by GTP hydrolysis, which can be further accelerated by GTPase activating proteins (3). The "switch on" is facilitated by nucleotide exchange, usually effected by guanine nucleotide exchange factors (GEF). The small GTPase Ras is the central regulator in cell growth and differentiation (4). Ras is mutated in about 25% of human tumors. The related small GTPase Ran regulates nuclear transport (5, 6) and is involved in spindle formation and nuclear envelope formation of dividing cells (7). The GTP-form of Ran is stabilized by Ran binding proteins (RanBP1 or the structurally similar RanBD domains of the RanBP2 protein) (8).
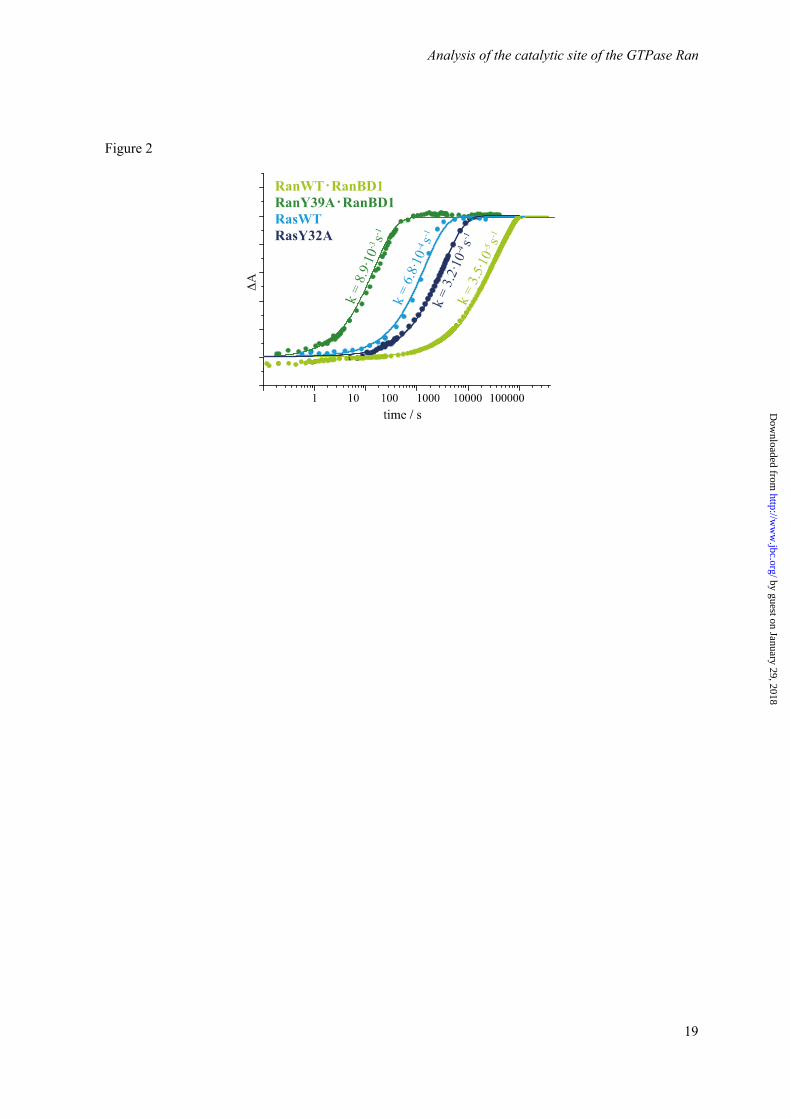
The reaction rate of the intrinsic hydrolysis reaction among GTPases varies. Especially Ran has a very slow reaction rate compared to other GTPases. This is important to maintain the Ran gradient: Ran·GTP should be concentrated mainly in the nucleoplasm and Ran·GDP in the cytoplasm (9). Fast intrinsic GTP-hydrolysis by Ran in the nucleoplasm (i.e. without GAP) would decrease the gradient and impact the nuclear transport, which can lead to severe diseases like the Hutchinson-Gilford Progeria Syndrome (10). Indeed, GTP hydrolysis is roughly 26 times slower in Ran and about 13 times slower in Ran·RanBD1 than in Ras (11). Here, we address at the atomic level the mechanism underlying the difference in the Ran and Ras hydrolysis rate.
One potential candidate for the difference is the position of the magnesium ion. FTIR experiments have shown Mg2+ to be one of the key players for catalyzing GTP hydrolysis due to its ability to shift negative charge within the GTP (12). The corresponding conformational change and charge shift of the triphosphate could be a reason for the different hydrolysis rates. Indeed, the position of the Mg2+ varies among available GTPase crystal structures. Figure 1 shows a comparison of the Mg2+ coordination in Ras and Ran with bound GTP or GTP analogues based on X-ray structural
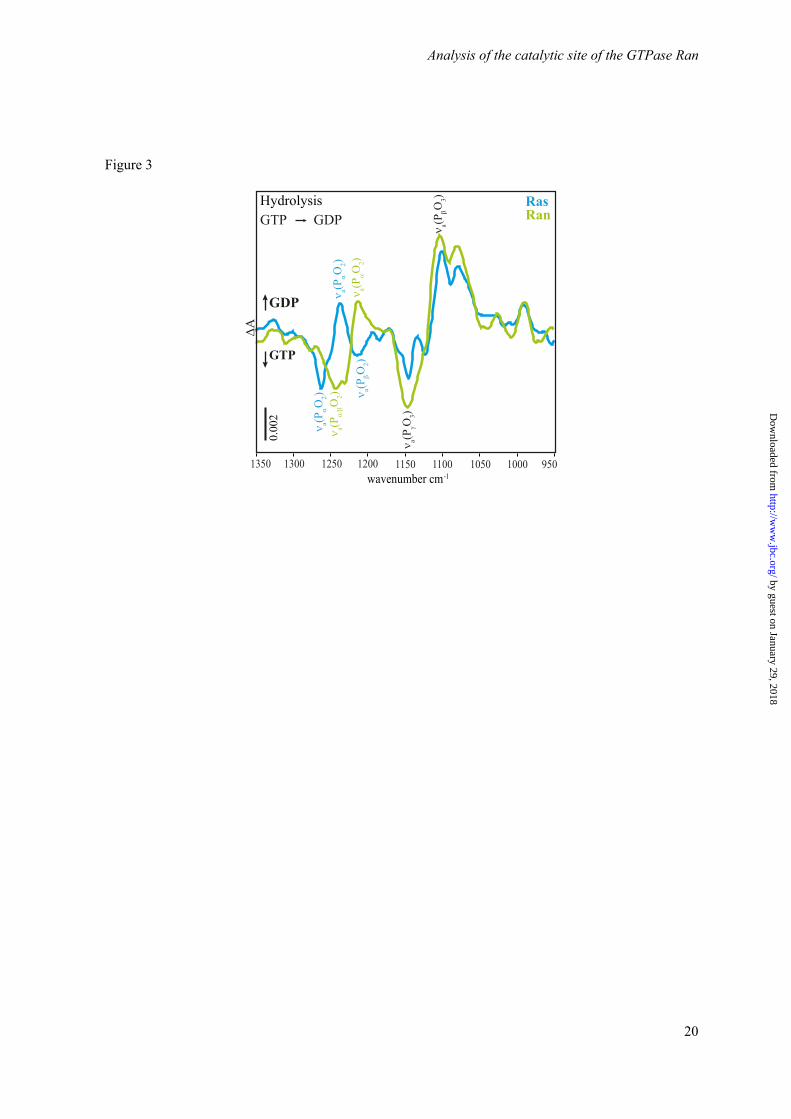
models. The X-ray structure of H-Ras·GTP (PDB ID 1QRA, Figure 1a) (13) and of Ran·GppNHp·RanBD1 (PDB ID 1RRP, Figure 1b) (14) indicate a difference in the coordination of the Mg2+. In Ras (Figure 1a) the Mg2+ is coordinated by the two hydroxyl groups of Ser17 and Thr35, two water molecules, an oxygen atom of the β-phosphate and an oxygen atom of the γ-phosphate. This coordination will be labeled with respect to the GTP-Mg2+ interactions “βγ-form” in the following. In Ran·RanBD1 (Figure 1b) five of the coordinating groups are analogues to their Ras counterparts: two hydroxyl groups (Thr24 and Thr42), one water molecule, one β-, and one γ-phosphate oxygen atom. However, instead of the second water molecule, the Mg2+ is coordinated by one α-phosphate oxygen atom. This coordination will be labeled “αβγ-form”. GTP·Mg2+ conformation in water has also an αβγ-form (12) and shows a very slow hydrolysis rate (5·10-8 s-1 at 303 K) (15). The different GTP·Mg2+ conformation might explain why the hydrolysis rate of GTP·Mg2+ bound to Ran in the RanBP1 complex (3.5·10-5 s-1 at 303 K) is slower than for GTP·Mg2+ bound to H-Ras (6.8·10-4 s-1 at 303 K) (Figure 2) (11). FTIR spectroscopy is sensitive to very small changes in the nucleotide environment, and indeed, the spectrum of the GTP-phosphates in Ran is significantly different to GTP in Ras (Figure 3) (11).
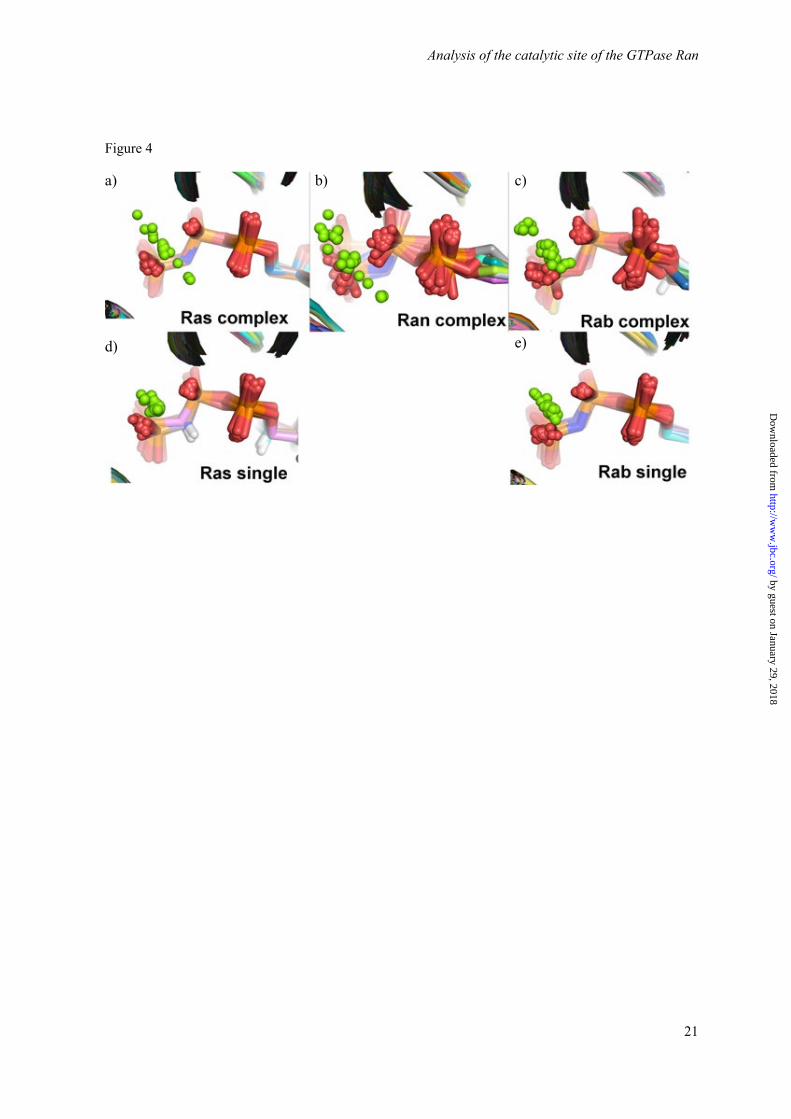
However, available X-ray structures reveal a more complicated picture than described above. In particular, an analysis of the Mg2+ position in various GTPase X-ray structures reveals an uncertainty in the Mg2+ location. There are also Ran-structures available indicating a βγ-form (Figure 1c). In contrast, all structures of Ras alone show a βγ-form (Figure 4d). However, if Ras complexes are also considered, the position of the Mg2+ is again shifting quite systematically (Figure 4a). The same behavior is also observed for Rab GTPases (Figures 4c, 4e). In order to investigate this unexpected variability of Mg2+ location and obtain additional information about its position in solution, we combine in this study new crystal structures of Ran complexes with improved resolution with theoretical and experimental vibrational spectroscopy.
It has been shown that spectral changes can be decoded into structural changes by the
by guest on January 29, 2018http://w
ww
.jbc.org/D
ownloaded from

Analysis of the catalytic site of the GTPase Ran
3
combination of FTIR spectroscopy with biomolecular simulations (16). QM/MM calculations allow the accurate calculation of the vibrational spectrum (17–21). If experimental and theoretical spectra agree, the theoretical structural model is validated and the detailed simulated structural models can be used for interpreting reaction mechanisms and catalysis. Bond length can be calculated with a resolution of 0.01 Å, well below the resolution of X-ray analysis. However, these changes are significant for catalysis. The change of a C-C single bond by 0.1 Å corresponds to 6 kJ/mol, which is about a quarter of the change in free energy of activation for GTP hydrolysis in water compared to GTP in Ras. A combined QM/MM and FTIR analysis was performed for H-Ras and it was found that a combination of charge shifts, an increase in Pβ-Pγ distance and a strained, staggered conformation of the GTP induced by the Ras and GAP seem to be responsible for catalysis (16).
Here, we report on an atomic structural model of the triphosphate environment of Ran obtained by the combination of X-ray structure analysis, biomolecular simulations and FTIR spectroscopy. Our model allows for the elucidation of the correct Mg2+ position in solution and permits an investigation of the dramatic difference in Ran and Ras hydrolysis rates.
2. METHODS
Biomolecular Simulations. Molecular mechanics (MM) simulations were performed with Gromacs 4.0.7 (22, 23), and the hybrid quantum mechanics / molecular mechanics (QM/MM) simulations with Gromacs/Gaussian03 (23–25). The used simulation systems are described in detail in Table S1, Supporting Information. Hydrogen atoms were added to the X-ray structures by the MAXIMOBY algorithm (26). Afterwards the protonated structures were checked and amended by the same algorithm. Parameters for the MM and QM/MM simulations were as described previously (12). In order to calculate theoretical IR features and structural details we used the same workflow as described in an earlier paper (16), but with an enlarged quantum region.
For the QM/MM equilibration run the triphosphate, the ribose, the Mg2+, Ala18 (Ras)/Thr25 (Ran), the backbone carboxyl and
oxygen atom of Ser17/Thr24, a dummy atom between the carboxyl atom and the α carboxyl atom of Ser17/Thr24, the backbone nitrogen atom and its bound hydrogen atom of Leu19/Phe26, and the dummy atom between the nitrogen atom and the α carboxyl atom of Leu19/Phe26 were treated quantum mechanically. For the first QM/MM energy optimization run the triphosphate, the ribose, the Mg2+, Ala18/Thr25, the backbone of Ser17/Thr24, the backbone of Lys16/Lys23, the backbone carboxyl and oxygen atom of Gly15/Gly22, a dummy atom between the carboxyl atom and the α carboxyl atom of Gly15/Gly22, the backbone nitrogen atom and its bound hydrogen atom of Leu19/Phe26, and the dummy atom between the nitrogen atom and the α carboxyl atom of Leu19/Phe26 were treated quantum mechanically. For the second QM/MM energy optimization run and the following normal mode analysis the triphosphate, the ribose, the Mg2+, Ala18 (Ras)/Thr25 (Ran), the backbone carboxyl and oxygen atom of Ser17/Thr24, a dummy atom between the carboxyl atom and the α carboxyl atom of Ser17/Thr24, the backbone nitrogen atom and its bound hydrogen atom of Leu19/Phe26, and the dummy atom between the nitrogen atom and the α carboxyl atom of Leu19/Phe26 were treated quantum mechanically.
Averaged structures were generated by the tool developed by Fischer et al. (27). Thereby an iterative scheme of calculating an average conformation and re-aligning the trajectory to that average structure to compute a new average structure was performed. This procedure was repeated until the average structure stopped changing and the RMSD was below 0.001 Å. Then the structure with the closest RMSD to the generated average structure was extracted from the trajectory as the run-average structure. The calculation of the B-factors from the MD simulations is described in the Table S2, Supporting Information.
Caged compounds. The P3-1-(2-nitrophenyl)-ethyl-ester of GTP (npe-GTP) was synthesized in two steps from 2-nitrophenylacetylhydrazone and GTP with subsequent purification via anion exchange chromatography according to a procedure by Walker and Trentham (28). The P3-para-hydroxyphenacyl ester of GTP (php-GTP) was synthesized by coupling GDP and php-caged
by guest on January 29, 2018http://w
ww
.jbc.org/D
ownloaded from
Analysis of the catalytic site of the GTPase Ran
4
Pi. The latter was obtained in five steps from para-hydroxyacetophenone and dibenzylphosphate and according to a procedure from Park and Givens (29).
Proteins (Cloning, overexpression and preparation). Point mutations in Ras and Ran were obtained by side-directed mutagenesis using the overlap extension PCR method. Wild-type and A18T H-Ras (1-166) were prepared with Escherichia coli (CK600K) using the ptac-expression system as described before (30). For Ran wild-type, Ran T25A and Ran Y39A (1-216) the pET3d-expression system with Escherichia coli (BL21(DE3)) was used (8). Human RanBP1 (1-201) and NF1-333 were both overexpressed as a GST (Glutathione-S-transferase) fusion protein using the plasmid pGEX-4T-1mod and Escherichia coli (BL21 (DE3)). The pGEX-4T-1mod plasmid has an additional TEV (Tobacco etch virus) protease recognition site. Purification was done by GSH affinity chromatography, on column digestion with TEV protease and subsequent gel filtration. Overexpression and purification of Rna1p from Schizosaccharomyces pombe (1-386) was done as previously described (31). RanBD1(1155-1321) (first Ran-binding domain of human RanBP2) was prepared as described by Vetter et al. (14).
Nucleotide exchange and manganese loading with different GTPases. For FTIR measurements Ras, Ran and their mutants were loaded with caged GTP according to John et al. (32). Minimum 1 mg GTPase was incubated with a 1.5 molar excess of php-GTP and 1 U alkaline phosphatase in reaction buffer (50 mM Tris-HCl, 10 µM ZnSO4, 200 mM (NH4)2SO4, 1 mM DTT, pH 7.5). The reactions were observed via HPLC. In case of Ran a 1:1 complex of Ran·RanBP1 was used.
The exchange to Ran·npe-GTP·Mn2+ was a two-step process. First, nucleotide free Ran:RanBP1 was produced according to John et al. (32) and second, following a 10 min EDTA treatment (1 mM), the GTPase was loaded with 20 mM Mn2+ and 1.5 molar excess of npe-GTP. The use of npe-GTP instead of php-GTP was necessary because php-GTP is not stable in the presence of Mn2+ ions.
After nucleotide exchange all samples were subsequently applied to a NAP-5- gelfiltration
column to change to low salt buffer for FTIR sample preparation (Ras: 500 µM Hepes-buffer, 50 µM MgCl2, 50 µM DTT, pH 7.4; Ran: 1 mM Hepes-buffer, 100 µM MgCl2/MnCl2, 100 µM DTT, pH 7.6) and removal of excess nucleotide.
FTIR spectroscopy and sample preparation. Samples were prepared between CaF2 windows as described before (33) and measured on a Bruker Vertex 80V spectrometer. Ran measurements were done with 5 mM concentration of the GTPase in complex with RanBP1 and 5 mol% Rna1p (0.25 mM), Ras measurements with 10 mM and 1 mol% NF1-333 (0.1 mM) using a buffer composed of 200 mM HEPES-buffer pH 7.5, 20 mM MgCl2 and 20 mM DTT. Intrinsic reactions with Ran, Ras and mutants were carried out at 283 K, manganese measurements with Ran at 278 K. Photolysis of the caged compounds and data acquisition was performed as described before (34). The data were analyzed between 1800 and 950 cm-1 with a global fit method (35). In this analysis, the absorbance changes ∆A during the hydrolysis reaction are analyzed by fitting the data to a one exponential function with apparent rate constant khyd and the amplitude ahyd(ν):
The photolysis spectrum aph(ν) is a difference spectrum comparing the state before triggering with the state after flashing, extrapolated to time t = 0. In the Figures the disappearing bands face downwards and the appearing bands face upwards. The absolute absorbance differences depend on the exact sample thickness, the laser intensity and the amount of caged GTP after nucleotide exchange. Thus, for the comparison of two spectra, one can be scaled to match the absolute absorbance difference of the other.
Protein preparation for X-ray Crystallography. Exchange of bound GDP to GppNHp (5’-guanosyl-[β,γ-imido]-triphosphate), a nonhydrolysable GTP analogue, on RanY39A was performed by incubating 1 µmol of each RanY39A and RanBD1 with a 2.5 excess of GppNHp and 20 Units alkaline phosphatase in a volume of 2.7 ml for 20 hours at room temperature in 50 mM TRIS buffer, pH 7.6, 200 mM (NH4)2SO4, 5 mM Dithiothreitol (DTT). The formed complex was purified on a prepacked
)1)(()(),( tkhydph
hydeaatA by guest on January 29, 2018http://w
ww
.jbc.org/D
ownloaded from
Analysis of the catalytic site of the GTPase Ran
5
Superdex 75 pg 16/60 column (GE Healthcare) used at an ÄKTAprime System (GE Healthcare) in 20 mM Tris buffer, pH 7.4, 2 mM MgCl2 and 2 mM DTT. Peak fractions were collected; purity checked by SDS-PAGE, pooled and concentrated (Amicon Ultra-15 centrifugal filter unit with molecular mass cutoff 30,000 Da, Millipore) up to 24.4 g/l, shock freezed and stored at -80 °C.
Protein crystallization and structure solution. RanY39A_1-216·GppNHp·RanBD1 was prepared at 24.4 mg/ml in 20 mM Tris pH 7.4, 2 mM MgCl2 and 2 mM DTT. Hanging drops were set up at 20 °C by mixing 1.5 µl protein with 1.5 µl reservoir consisting of 1.8 M ammonium sulfate, 2.5% PEG 1500, and 100 mM HEPES pH 7.5. Crystals were flash frozen in 1.8 M AS, 2% PEG 1000, 100 mM HEPES 7.5, and 30% Glycerol. Data was collected at a wavelength of 1.0039 using a Pilatus 6M detector. The crystals in space group C2221 diffracted to 3.2 Å, contained 2 complexes per asymmetric unit and were solved using PHASER with the RanΔ191·BeF structure as a template. Refinement in PHENIX with local NCS and secondary structure constraints as well as RanΔ191·BeF as a reference structure (i.e. dihedral angles are constrained to the reference structure to get better geometries at this low resolution) converged to a final R and Rfree of 22.2% and 25.5%, respectively, with 0.76% Ramachandran outliers. Comparison of the model refined with and without using constraints from the reference structure showed no major differences except for better geometries in the former case.
RanΔ191GDP·BeF3·RanBD1 was prepared in buffer “A” (20 mM KHPO4, pH 7.4, 2 mM MgCl2, 1 mM DTT, 5 % (w/v) sucrose) by adding 67.8 µl RanΔ191 8 mg/ml + 36.3 µl RanBD1 10.8 mg/ml + 5 µl BeFx-stock (1 M BeF2 + 3 M NaF). The hanging drops were set up at 18 °C by mixing 3 µl of the protein complex with 3 µl reservoir consisting of 18% PEG 4000, 250mM ammonium sulfate and 100 mM MES pH 6.25. Crystals were flash frozen in the reservoir solution plus 10% glycerol. The crystals in space group P21 had 2 complexes in the asymmetric unit and diffracted to 2.4 Å. Data was collected at a wavelength of 0.9797 using a MarCCD detector.
The structure was solved using PHASER from the CCP4 suite with the Ran·RanBD1 complex 1RRP from the protein data bank as a template, built in COOT and refined with REFMAC5 using TLS with four segments per domain and tight NCS constraints to a final R factor of 24.64% and Rfree of 27.80%. Relaxing the NCS constraints increased Rfree. The geometry is excellent with only 0.63% outliers in the Ramachandran plot.
All following crystals were set up as hanging drop at 18 °C with the protein dissolved in the buffer “A” supplemented by 50 mM BeF2 and 150 mM NaF as described above and collected using a MarCCD detector (all at 0.984 Å except RanY39A in P1 at 1.000 Å):
For RanWT_1-216·GDP·BeF3, 1.2 µl protein 18 mg/ml was mixed with 3 µl reservoir (30 % PEG 1000, 50 mM Tris pH 8, 20 mM MgCl2) and 1.8 µl water. Crystals were flash frozen without cryo protectant and diffracted to 1.7 Å in space group P41. A similar setup but with 50 mM HEPES pH 7.2 instead of the Tris buffer, with 32% PEG1000 and using 3 µl protein plus 3 µl reservoir yielded crystals of space group P21 that diffracted to 1.8 Å and were flash frozen in reservoir containing 10% glycerol. Both space groups had 2 mol/AU.
3 µl RanY39A_1-216·GDP·BeF3 at 11.4 mg/ml in buffer “A” mixed with 3 µl of 35% PEG 1000, 50mM Tris pH 8.5, 20mM MgCl2, 1 mM GDP, 1mM BeF2 gave P1 crystals with 8 mol/AU in space group P1 that diffracted to 1.75 Å and could be frozen without cryo protectant. A similar setup with 50 mM HEPES pH 7.2 instead of the Tris buffer and 34% PEG1000 yielded P21 crystals that diffracted to 1.75 Å with 2 mol/AU and were flash frozen in reservoir containing 10% glycerol. The P1 data could also be processed in P21, but molecular replacement showed clearly that this is a case of pseudosymmetry, and the structure could be solved correctly only in P21.
All datasets were collected at 100 K at the SLS synchrotron in Villigen, Switzerland, at beamline X10SA (PXII) (Table S3, Supporting Information).
3. RESULTS AND DISCUSSION
Influence of the magnesium positions on the phosphate vibrations. As introduced above, one
by guest on January 29, 2018http://w
ww
.jbc.org/D
ownloaded from
Analysis of the catalytic site of the GTPase Ran
6
reason for the well-known difference of the phosphate absorptions in the FTIR spectra of GTP bound to Ras compared to Ran·RanBD1 (see (11) and Figure 3) could be a different Mg2+ coordination of the triphosphate according to the corresponding X-ray structures (1QRA (Ras) and 1RRP (Ran·RanBD1)) called βγ- or αβγ-form in the following. In order to investigate whether this might be the cause of the band shifts, we performed biomolecular simulations of H-Ras·GTP as well as of Ran·GTP·RanBD1 to be able to calculate the theoretical infrared spectra for comparison with the experimentally determined phosphate vibrations. The high-resolution X-ray structure 1QRA (βγ-form) was employed as starting structure for H-Ras, for Ran·GTP·RanBD1 the complex of Ran·GppNHp with RanBD1 (X-ray structure 1RRP) was used (αβγ-form). Additionally, we simulated both H-Ras in a Ran-like αβγ-form, and Ran with a Ras-like βγ-form. In 1QRA a crystal contact leads to an artificially "flipped out" conformation of Tyr32. As discussed before in detail (12), this tyrosine moves in our simulations into the canonical position close to the -phosphate that is found in the majority of Ras crystal structures. This structure corresponding to the state 2 observed in NMR spectroscopy (36) with the canonical position of Tyr32 was used as starting structure for all simulations. All four systems were stable during simulations of 50 ns duration. The four structures, averaged over the equilibrated last 25 ns, are shown in Figure 5.
Next, we did QM/MM simulations of six snapshots of each system and calculated the theoretical infrared spectra. In order to obtain reliable spectra, we treated a large part of the active site by quantum mechanics, i.e. besides the triphosphate also the ribose, the Mg2+ and the amino acid that forms hydrogen bonds to the α-phosphate, Ala18 for Ras or Thr25 for Ran. Thus, all binding partners of the α-phosphate are treated quantum mechanically and the calculated energy of the α-phosphate vibration should be very accurate. The results of these calculations are summarized in Figure 6.
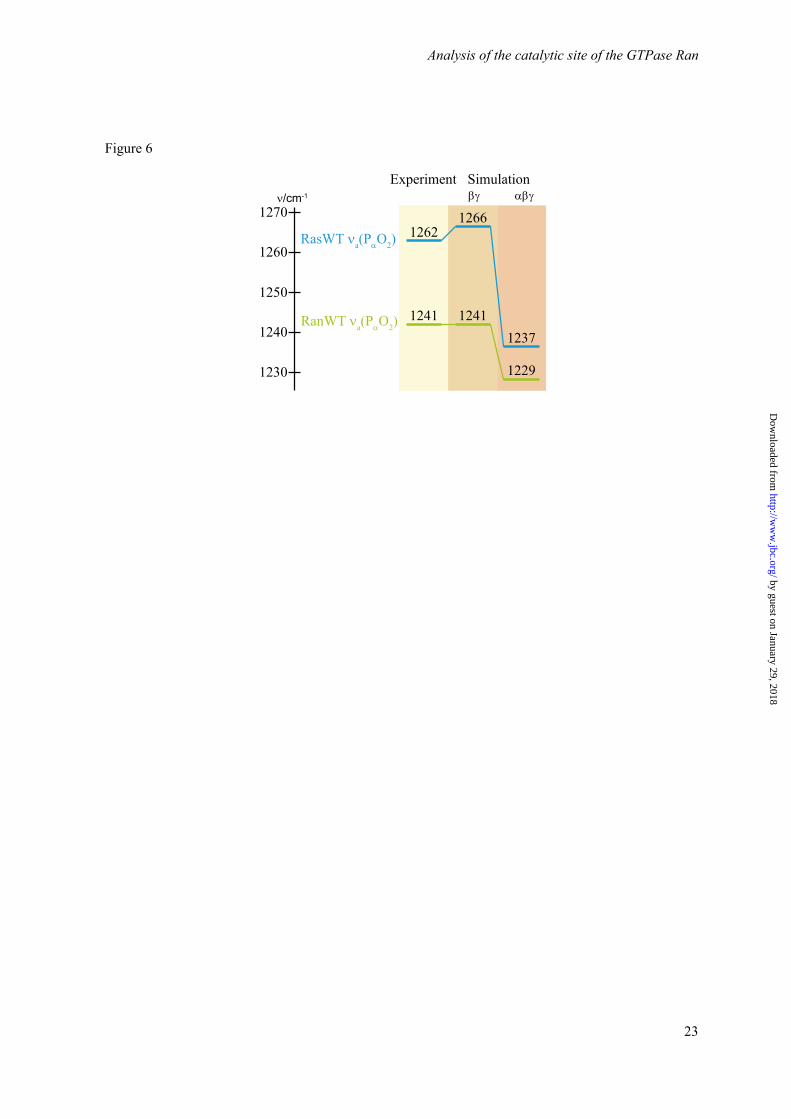
The calculated frequencies for νa(PαO2) of Ras are 1266 cm-1 for the βγ-form and 1237 cm-1 for the αβγ-form, respectively. As expected, the coordination of the α-phosphate by the Mg2+ leads
to a strong redshift of the vibration. While the value of the βγ-form is very close to the experimental value of 1266 cm-1, the αβγ-form deviates by 25 cm-1. For Ran·RanBD1 the corresponding vibration is already redshifted compared to Ras for the βγ-form and calculated to be at 1241 cm-1. For the αβγ–form a further redshift to 1229 cm-1 is calculated. Thus, the value for the βγ-form coincides with the experimental value, while the value of the αβγ–form deviates by 12 cm-1. Accordingly, the calculations suggest the βγ-form for both proteins, Ras and Ran·RanBD1.
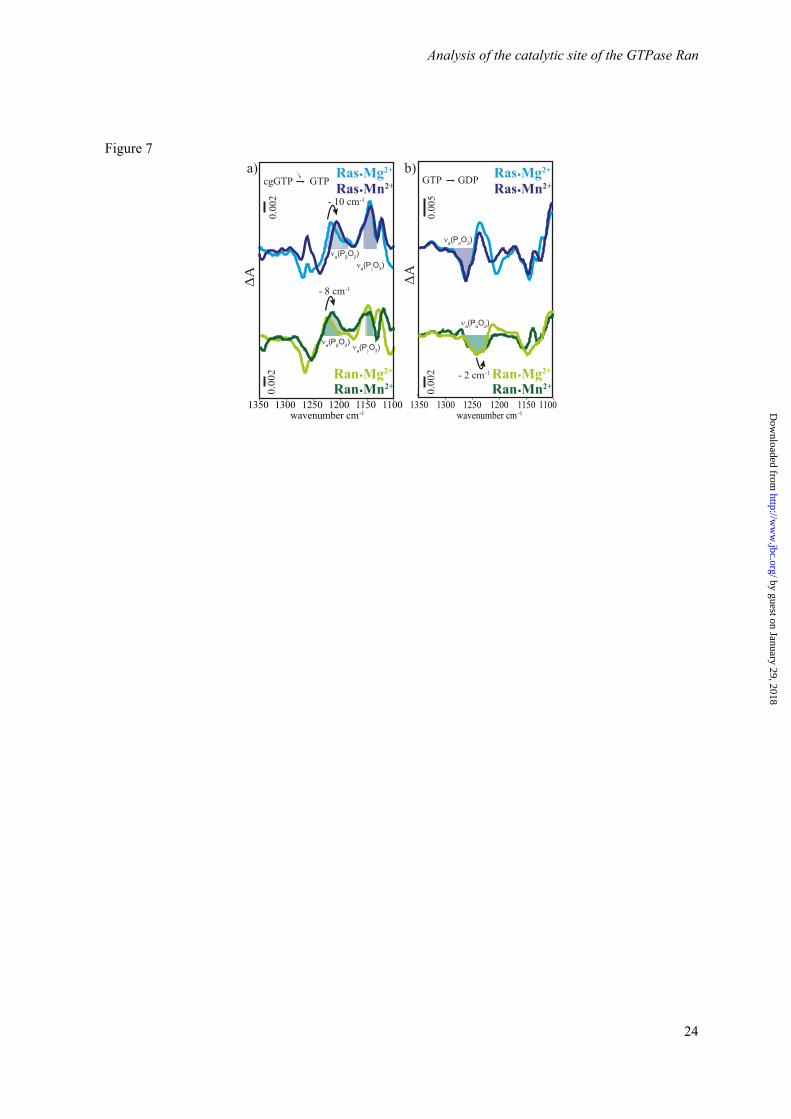
In order to obtain further experimental evidence for a similar Mg2+ coordination of Ras and Ran·RanBD1 in solution we performed an exchange of Mg2+ to Mn2+. Mn2+ is known to coordinate GTP in Ras in the same manner as Mg2+ and selective shifts of the vibrations of coordinated phosphate groups can be expected (37). The spectra obtained via photolysis of caged GTP are shown in Figure 7 and the shifts are summarized in Table 1. The observed shifts are comparable for Ras and Ran·RanBD1, again suggesting a similar coordination of the metal ion. In both cases no significant shift of the νa(PαO2) vibration is observed, indicating no direct interaction of the Mn2+ with the -phosphate. According to our experience, the -phosphate should clearly show a shift upon changes in its environment whereas the effect on the -phosphate is usually less clear. Furthermore, the -phosphate environment in the MD-simulations was not treated quantum mechanically so that the predictions would be not as accurate as for the -phosphate. In summary, theory and experiment consistently suggest Mg2+ coordination to the β- and γ-phosphates (βγ-form) for both proteins, Ran and Ras.
A new X-ray structure of Ran·RanBD1. To further investigate the discrepancy between the Mg2+ position in the structure of the (low resolution) Ran·GppNHp·RanBD1 complex (1RRP) and the findings described above, we searched for crystal forms with better diffraction and managed to crystallize a complex of RanΔ191·GDP·BeF3·RanBD1 that diffracted to 2.4 Å. The GDP·BeF3 complexes of small GTPases are usually good mimics of the GTP state (38). Although the construct lacks the C-terminus
by guest on January 29, 2018http://w
ww
.jbc.org/D
ownloaded from

Analysis of the catalytic site of the GTPase Ran
7
of Ran starting from residue 192, the overall arrangement of the Ran and RanBD1 domains in the structure of Ran(1-191)·GDP·BeF3·RanBD1(1155-1321) (called Ran·RanBD1 in the following) are very similar to 1RRP. The deletion in Ran has removed the helix that wraps around the RanBD1 domain together with the negatively charged 211DEDDDL216 motif that confers a large part of the binding affinity between Ran and the Ran binding domains (39). However, the remaining affinity is sufficiently large to ensure formation of the canonical complex. Concurrently, in the second complex of the asymmetric unit in the original Ran·RanBD1 structure (PDB ID 1RRP), the C-terminal helix and 211DEDDDL216 motif (residue 187 to the end) is disordered, indicating a flexible position of this region. Lack of this C-terminal moiety might thus have helped to improve the resolution of the Ran·RanBD1 complex crystals (2.4 Å in our structure compared to 2.96 Å in 1RRP). Further effects of the missing Ran C-terminus are discussed below.
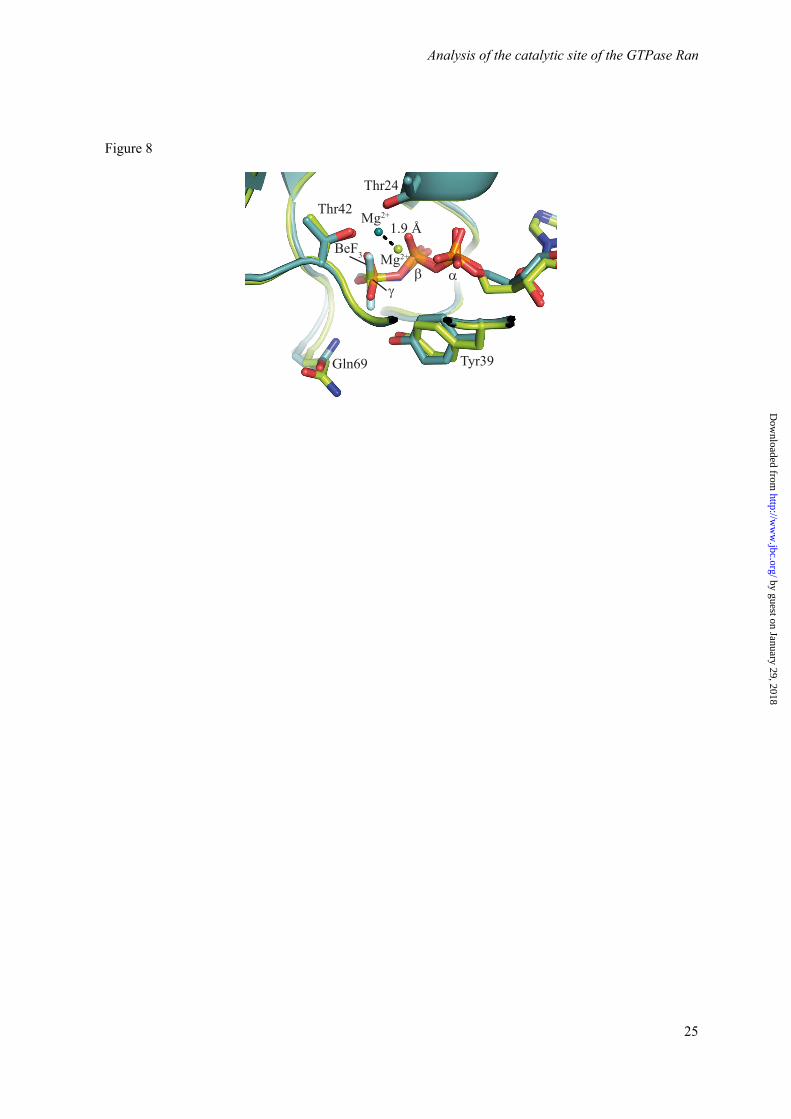
When comparing our new Ran·GDP·BeF3·RanBD1 structure to 1RRP, it was apparent that the magnesium ion was shifted by 1.9 Å (Figure 8). In our higher resolution structure, the magnesium is almost exactly in the same position as in the Ras structures that usually have a very good resolution and quality (e.g. 5P21, 2RGE). In 1RRP, the magnesium ion occupies a position where other structures have a water molecule that coordinates the Mg ion. Indeed, analysis of all available structures of Ran (Figure 4 b) and Ras (Figures 4 a, d) reveals that the magnesium ions are found spread out along a line that connects two of the axial water molecules and the Mg2+. It appears that – especially in lower quality structures – the Mg ion often accidentally wanders off into the water positions during refinement. This is nicely seen in Figure 4 where high resolution X-ray structure of uncomplexed GTPases (Figure 4, second row) reveal a clear βγ-form, whereas in the usually lower resolved X-ray structures of complexed GTPases (Figure 4, upper row) the Mg2+ coordination varies. In summary, this would suggest that the βγ-form is the correct magnesium position for Ras and Ran, and the αβγ-form would be a crystallographic artifact due to low resolution data.
In our new Ran·RanBD1 structure, the beryllium fluoride superimposes nicely with the -phosphate oxygens of the GppNHp in 1RRP, and is only slightly rotated around an axis from the beryllium to the closest -oxygen of the GDP (Figure 8). The switch regions are – as expected – very similar to 1RRP, just the tip of switch II with Gln69 is slightly more retracted from the γ-phosphate position, perhaps due to the slightly bulkier beryllium fluoride. As usual, switch II shows slightly elevated temperature factors. However, Gln69 has a well-defined electron density with distances of 5.4 and 5.73 Å between the Gln-Cδ atom and the γ-phosphate.
Efforts to obtain a Ran·GDP·BeF3-structure without RanBD1 were not successful: two structures of Ran wild type in different space groups were solved (Table S3, Supporting Information) that grew in a GDP·BeF3 containing buffer, but contained Ran only in the canonical GDP form, no trace of density at the -phosphate position that could correspond to BeF3
- was visible, corroborating the hypothesis that RanBD1 stabilizes the GTP conformation of Ran (14) and enables binding of BeF3
-.
Influence of Thr25 of Ran on the -phosphate vibrations. If the Mg2+ coordination is not the cause for the spectral difference between Ras and Ran·RanBD1, what is the reason for the redshift of the α-phosphate vibration in Ran·RanBD1 relative to Ras, found in both experiment and theory? One explanation could be the additional hydrogen bond of the Thr25 side chain to an α-phosphate oxygen in Ran. This hydrogen bond is not present in Ras since an alanine is in the corresponding position.
In order to prove this idea, we performed the FTIR spectroscopic measurements of the corresponding mutants H-RasA18T with an additional hydrogen bond to the α-phosphate and RanT25A that lacks this bond, respectively. The mutation A18T in N-Ras has been found in tumors with very good prognosis (40). Demunter and coworkers measured the KD of the nucleotide for this mutant and found it unchanged compared with wildtype. Figure S2, Supporting Information, shows infrared difference spectra of Ras wildtype compared to RasA18T obtained via photolysis of caged GTP (cgGTP) bound as the nucleotide. In the photolysis spectrum bands facing downward
by guest on January 29, 2018http://w
ww
.jbc.org/D
ownloaded from

Analysis of the catalytic site of the GTPase Ran
8
(disappearing bands) are due to Ras·cgGTP and bands facing upward (appearing bands) are due to Ras·GTP. In the hydrolysis spectrum bands facing downward are due to Ras·GTP and the bands facing upward are due to Ras·GDP + Pi. All bands that do not change during the reaction are cancelled out in these difference spectra. It can be seen that the spectra of wildtype and mutant are very similar.
The corresponding experiments for Ran wildtype and RanT25A are shown in Figure S3, Supporting Information. In all experiments, the almost unchanged spectra in the amide region between 1300 cm-1 and 1700 cm-1 indicate that the observed processes are not influenced by the mutations. Only in the region of the phosphate absorptions some changes are observed. This region is shown enlarged in Figure 9. The asymmetric stretching vibrations of the β-phosphate (νa(PβO2)) at 1216 cm-1 and γ-phosphate (νa(PγO3)) at 1143 cm-1, observed as positive bands in the photolysis spectrum, are unchanged. At the same time the asymmetric stretching vibration of the α-phosphate (νa(PαO2)), observed as negative band in the hydrolysis spectrum, is downshifted by 21 cm-1 upon the mutation A18T in Ras. Thus, this band is now almost in the position of the νa(PαO2) band of Ran. Conversely, the νa(PαO2) band of Ran shifts upwards by 19 cm-1 upon T25A mutation, close to its position in Ras. Similar to Ras, no significant changes are found for β- and γ-phosphate vibrations upon mutation of T25A in Ran. In summary, the phosphate bands of RasA18T resemble very precisely the corresponding spectra of Ran wildtype. Vice versa, the RanT25A spectra are very similar to Ras wildtype. Thus, the FTIR spectroscopic experiment reveals that the different α-phosphate band positions in Ran compared to Ras are not due to a different coordination of Mg2+ but due to the additional hydrogen bond of Thr25 of Ran that is substituted by an alanine in Ras wildtype.
Complementary, we performed MD simulations on the corresponding mutated proteins, i.e. RanT25A·GTP·RanBD1 and H-RasA18T (Figure S1 b, d, Supporting Information), and compared the results with the respective wildtypes. We calculated the IR spectra and predicted the band shifts between wildtype and mutation (Table 2). Such relative changes are much more precise than
the absolute values because they are less dependent on the used method and extent of the quantum mechanically treated region as shown already for isotopic shifts in Ras (41). We calculated the βγ-form for both mutants but the αβγ-form only for the RanT25A mutant because in Ras the Mg2+ coordination is undisputed .
The results from the MD simulations underline the experimental FTIR findings. The theoretically predicted shifts induced by the mutation (Table 2) fit well to the measurement if the βγ-form is assumed in the MD simulations: only the α-phosphate band shifts significantly, by 17 cm-1 in theory and 19 cm-1 in the experiment. If the αβγ-form is assumed in RanT25A the calculated shifts deviate much stronger from the experiment: The a(PαO2) vibrational mode shifts by only 12 cm-1 upon Ran T25A mutation in the αβγ-form compared to 19 cm-1 in the experiment and more importantly a similar shift of 10 cm-1 was found for the a(PβO2) vibrational mode, in contrast to the experiment, where it remains unchanged upon mutation.
Merging the results from the experimental and theoretical mutagenesis studies it clearly shows that the Mg2+ in Ran·GTP·RanBD1 is in the βγ-form like it is in Ras. All spectral changes of the phosphate vibrations between Ras and Ran can be explained by the additional hydrogen bond of the hydroxyl group of Thr25.
Structural details of the triphosphate: distance of β- and γ phosphate. If the differences in the hydrolysis rate of H-Ras and Ran·RanBD1 cannot be explained correctly by a different Mg2+ coordination, what else can be the reason? Now that we have dynamic computational models of Ras·GTP·Mg2+ and Ran·GTP·Mg2+·RanBD1 with atomic resolution, which are validated by the agreement of experimental and calculated infrared spectra, we can examine them with regard to structural parameters far beyond the resolution of X-ray crystallography and with GTP instead of being limited to analogues like GppNHp or GDP·BeF3. As shown above his high resolution is essential to elucidate catalytic effects. Figure 10 shows the small structural differences between GTP in water, bound to Ran and bound to Ras. Interestingly, the distance of the γ-phosphate to the β-phosphate increases from 2.99 Å in water to
by guest on January 29, 2018http://w
ww
.jbc.org/D
ownloaded from
Analysis of the catalytic site of the GTPase Ran
9
3.00 Å in Ran but to 3.03 Å in Ras. The faster the reaction is the larger is this distance. Similarly the PβOPγ angle increases. This could be one cause for the slower GTPase reaction of Ran compared to Ras.
Structure of RanY39A·RanBD1. Another observation hints to the influence of the side chain of Tyr39. The Y39A mutant of Ran was found to catalyze GTP hydrolysis about two orders of magnitude faster compared to Ran wildtype, whereas in Ras the corresponding Y32A mutation has almost no influence on GTP hydrolysis compared to wildtype (Figure 2) (11). We therefore tried to solve the structure of RanY39A to elucidate the reason of the faster hydrolysis. As for RanWT, we first tried to obtain a structure of RanY39A alone (without binding partner) in complex with GDP·BeF3 and solved two 1.75 Å crystal structures in different space groups (Table S3, Supporting Information), but only GDP was observed in the active site, similar to wildtype Ran where a Ran binding domain is needed to force Ran·GDP into the GTP conformation and thus enables BeF3
- binding. The region around the mutated Y39 did not show any significant changes relative to wild type, and the same is true for the remainder of the protein.
In contrast, we could crystallize the RanY39A·GppNHp·RanBD1 complex (RanY39A·RanBD1 in the following) and solve the structure with 3.2 Å resolution. The magnesium ions are located in a position very close to the Ran·RanBD1 and Ras positions, although at a resolution of 3.2 Å this is not very reliable as mentioned above.
Close to the active site, switch II shows a relatively large deviation of residues 70-75 relative to 1RRP and Ran·RanBD1. This is most likely due to crystal packing since a neighboring molecule is so close that it “flattens” the switch II helix and pushes Phe72 and Gln69 slightly forward in direction of the axis of the switch II helix. In contrast, the switch I region is almost completely unaltered compared to Ran wildtype except for the missing side chain of Tyr39. As in 1RRP and Ran·RanBD1, the temperature factors for the switch II region are elevated, in case of RanY39A·RanBD1 more than in the other two structures. The Gln69 has well-defined electron
density in both RanY39A chains with distances of 6.07 and 6.22 Å from the Cδ atom of Gln69 to the γ-phosphate. Further details are given in the Section S1 of the Supporting Information.
In summary, there are no significant changes in the active site that could directly explain the different reaction rates of Ran wildtype and Y39A. This prompted us to investigate the possibility that the wildtype of Ran has a slower hydrolysis rate than the mutant because the side chain of Tyr39 blocks access of the catalytic glutamine to the γ-phosphate as described in the following.
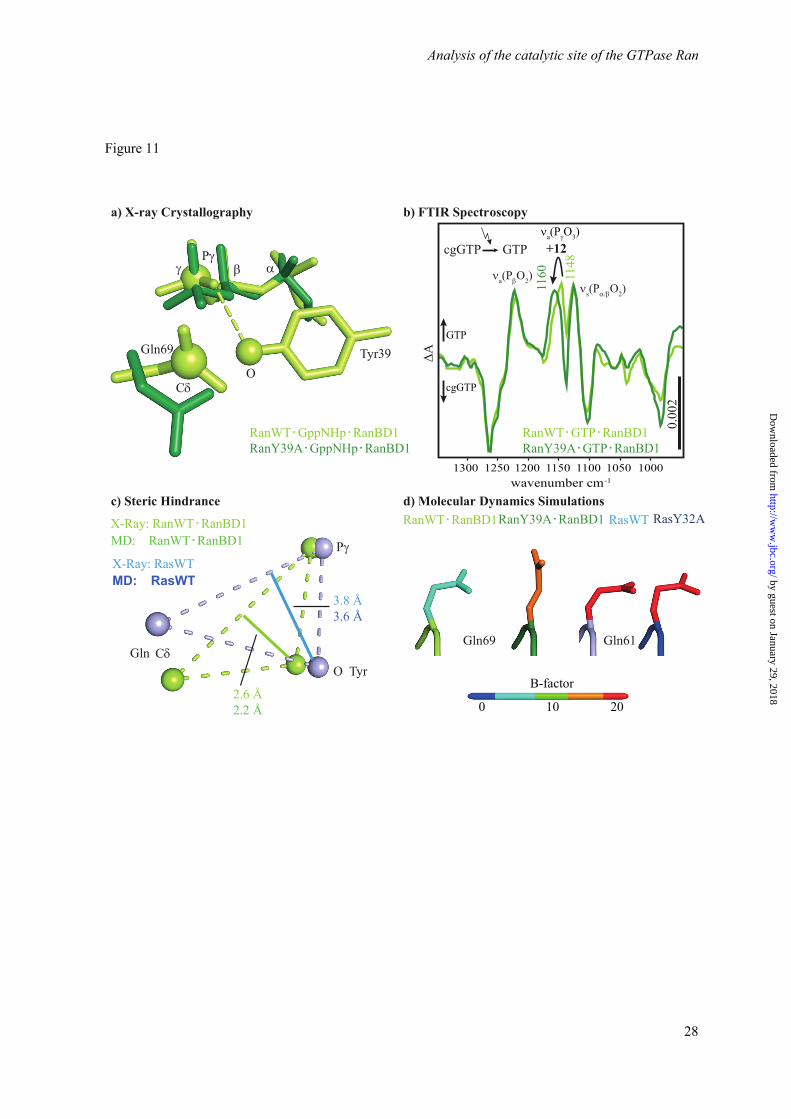
The role of Tyr39 and Gln69. The side chain of Tyr39 is found in a position close to the -phosphate in all known Ran・GTP complex structures, whereas structures of related GTPases show a greater variablility of the tyrosine orientation, ranging from positions relatively similar to Ran (called “closed” in the following) to positions where the tyrosine side chain is far away from the -phosphate (“away” position). Interestingly, there seems to be a tendency that in small GTP binding proteins with a fast GTP hydrolysis this tyrosine is preferentially in the “away” position according to X-ray- and NMR data, and the mutation to e.g. alanine does not have a large effect on the hydrolysis rate (e.g. Cdc42 (42, 43)), whereas in GTPases with a slow hydrolysis the tyrosine is close to the -phosphate (e.g. Rab6a, which is approx. 4 times slower than Ran·GTP and 8x slower than Ran・GTP・RanBD1) (44). Figure 11 a shows the side chains of Gln69 and Tyr39 in Ran・RanBD1 (1RRP) compared to the structure of RanY39A・RanBD1 solved in this work. In the available X-ray structures of Ran wildtpye, including the Ran·GDP·BeF3·RanBD1 structure solved here, Tyr39 is contacting the γ-phosphate (Figure 8). FTIR spectroscopic measurements on RanWT·GTP·RanBD1 and RanY39A·GTP·RanBD1 confirm a direct hydrogen bond between Y39 and the γ-phosphate, which can be observed by the blue-shift of the γ-phosphate vibration upon Y39A mutation by 12 cm-1 (Figure 11 b). This shift is of a similar magnitude as the one found for removing one hydrogen bond from the α-phosphate upon T25A mutation as discussed above. How does the Tyr39 hamper GTP hydrolysis? A possible explanation is the steric hindrance depicted in Figure 11c. It is
by guest on January 29, 2018http://w
ww
.jbc.org/D
ownloaded from

Analysis of the catalytic site of the GTPase Ran
10
known that Gln61(Ras)/Gln69(Ran) is important for the hydrolysis reaction because it holds the nucleophilic water molecule in the attacking position (45, 46) and mutations of this residues are often found in tumors (47). The Tyrosine side chain intrudes between the Gln and the γ-phosphate. The distance of the side chain oxygen of Tyr39 from a line between the GlnCδ and the γ-phosphor atom can be taken as a measure for the steric hindrance. This distance is 2.6 Å in Ran, but 3.8 Å in Ras, which could also explain why in Ras this effect is not seen and, accordingly, the mutation Y32A has no significant effect on the hydrolysis rate (Figure 2). As expected, this steric hindrance is removed in the Ran·RanGAP complex (46) where the corresponding distance is 3.3 Å, corroborating the idea that the tyrosine side chain interferes with the hydrolysis.
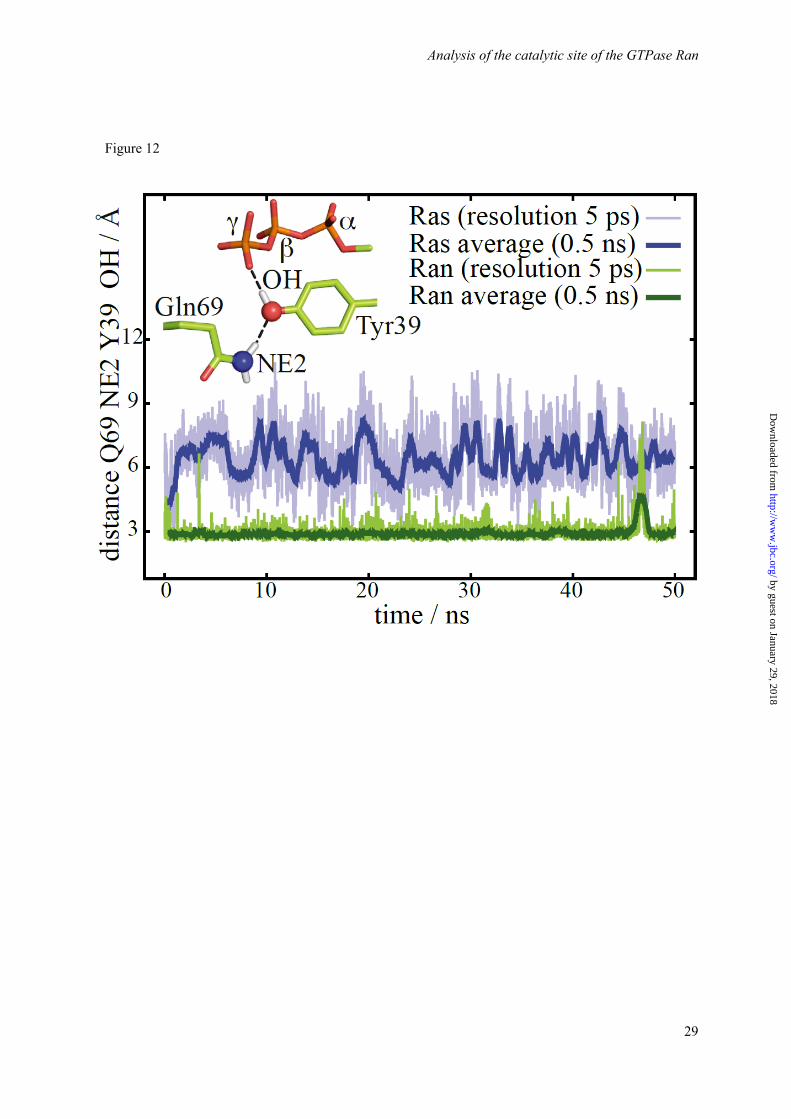
MD simulations of WT and Tyr mutants. Complementary to the analysis of the crystal structures, we analyzed our MD simulations regarding the role of the discussed Tyr and Gln residues. The distance of the side chain oxygen of Tyr39 from a line between the GlnCδ and the γ-phosphor atom averaged over the simulation trajectory is 2.2 Å for Ran and 3.6 Å for Ras, in agreement with the X-ray data (Figure 11c), confirming the steric hindrance. Furthermore, the simulation of RanWT・RanBD1 exhibits a stable positioning of Tyr39 at the γ-phosphate during a 50 ns simulation (Figure 12). The Gln69 is trapped in an unreactive conformation by a direct hydrogen bond to Tyr39. In contrast, the analogous simulation of Ras reveals a fluctuating position of the Gln61 of Ras with a larger calculated B-factor. Thus Gln61 can acquire the reactive conformation from time to time. The different flexibility of the Gln side chain is also seen in Figure 11 d, which shows the Gln color coded by the calculated B-factors. The Gln side chain of the slow hydrolyzing Ran wildtype has a very low B-factor, while the faster hydrolyzing Ran Y39A has a much higher B-factor. In the case of Ras, the Gln side chain is already flexible in Ras wildtype and unchanged in Ras Y32A (Table S2), in line with a rate more comparable to Ran Y39A for both Ras wildtype and Y32A mutant. A similar mechanism might also be present in various related slow Rab GTPases. Especially the
slow hydrolyzing Rab6a has a tyrosine in a similar position as Y39 in Ran (44).
CONCLUSION
By a combination of theoretical IR spectroscopy and time-resolved FTIR spectroscopic measurements we have shown that the Mg2+ is βγ coordinated in both proteins Ras and Ran. An in-depth analysis of existing X-ray structures together with the new X-ray structures reported here confirm a clear βγ-coordination as well. Our structure of the Ran·GDP·BeF3·RanBD1 complex has an improved resolution compared to the previous structures and thus allows a more accurate view of the nucleotide binding site. The redshift of the asymmetric α-phosphate vibration (νa(PαO2)) was shown to be due to a hydrogen bond between Thr25 and the α-phosphate oxygens in Ran that do not exist in Ras, as proven by the agreement of theoretical and experimental mutagenesis studies. Thus, the differences in the hydrolysis rate between Ras and Ran cannot be explained by a difference in the Mg2+ coordination. We therefore suggested that Tyr39 of Ran interfered with the catalytically favored position of Gln69 relative to the γ-phosphate in Ran via steric hindrance, whereas in Ras the catalytic competent structure can be obtained more frequently by the more flexible and less hindered Gln61 side chain since the Tyr32 side chain in Ras is positioned slightly different. In agreement, the hydrolysis reaction of the Tyr39A mutant of Ran is accelerated by two orders of magnitude, while the analogue Tyr32A mutant of Ras is not accelerated (Figure 2).
In addition, we present a proof of principle for the high sensitivity of the integration of theoretical and experimental IR spectroscopy. Here, we have predicted IR spectroscopic shifts of mutations, which afterwards were verified by FTIR spectroscopic measurements. The difference of one hydrogen bond was resolved by both, theory and experiment. The integration of X-ray structure analysis, QM/MM simulations and IR spectroscopy is a powerful tool to analyze the structure and dynamics of the catalytic center of a protein with atomic resolution. Only such atomic resolution provides the basis to understand protein catalysis.
by guest on January 29, 2018http://w
ww
.jbc.org/D
ownloaded from

Analysis of the catalytic site of the GTPase Ran
11
Supporting Information. Simulation Systems (Table S1); calculated B-factors (Table S2); RanY39A・RanBD1 structural details (Section S1); X-ray data collection and refinement statistics (Table S3); Used X-Ray structures in Figure 1 c (Section S2); Used X-Ray structures in Figure 4 (Section S3); MD simulated strcutures of substrate binding pocket of RasWT, RasA18T, RanWT, and RanT25A (Figure S1); FTIR difference spectra of RasWT and RasA18T (Figure S2); FTIR difference spectra of RanWT and RanT25A (Figure S3); hindrance triangle of Ras and Ran from MD simulations and X-ray structures (Figure S4)
ACKNOWLEDGMENT
We thank Dr. Frederick Großerüschkamp and Sara Stephan for the Ras・Mn2+ and RasY32A measurements, Claus Küpper for performing RanWT・RanBD1 MD simulations and Stefan Tennigkeit for help in the purification of the Ran and Ras mutants. We acknowledge PD Dr. Jürgen Schlitter for fruitful discussions and the SFB 642 of the DFG for financial support. X-ray data
collection was performed at the Swiss Light Source, beamline X10SA, Paul Scherrer Institute, Villigen, Switzerland. We would like to thank the beamline staff and Toni Meinhart, Bernhard Loll, Andrea Rocker, Wulf Blankenfeldt, Nils Schrader, and Sven Hennig for help with the data collection.
The authors declare no conflict of interest
Author Contributions
CK, IV and KG designed the study. CK, IV, TR and SJ analyzed data and wrote the paper. IV, SJ and SB expressed and purified proteins. TR performed the calculations, SJ performed the FTIR measurements, IV and SB performed the X-ray crystallography.
.
by guest on January 29, 2018http://w
ww
.jbc.org/D
ownloaded from

Analysis of the catalytic site of the GTPase Ran
12
REFERENCES
1. Wittinghofer, A., and Vetter, I. R. (2011) Structure-Function Relationships of the G Domain, a Canonical Switch Motif. Annu. Rev. Biochem. 80, 943–971
2. Cherfils, J., and Zeghouf, M. (2013) Regulation of Small GTPases by GEFs, GAPs, and GDIs. Physiol. Rev. 93, 269–309
3. Ligeti, E., Welti, S., and Scheffzek, K. (2012) Inhibition and Termination of Physiological Responses by GTPase Activating Proteins. Physiol. Rev. 92, 237–272
4. Cox, A. D., and Der, C. J. (2010) Ras history - The saga continues. Small GTPases. 1, 2–27 5. Stewart, M. (2007) Molecular mechanism of the nuclear protein import cycle. Nat Rev Mol Cell
Biol. 8, 195–208 6. Jamali, T., Jamali, Y., Mehrbod, M., and Mofrad, M. R. K. (2011) Nuclear Pore Complex. in
International Review of Cell and Molecular Biology, pp. 233–286, Elsevier, 287, 233–286 7. Görlich, D., and Kutay, U. (1999) Transport between the Cell Nucleus and the Cytoplasm. Annu.
Rev. Cell Dev. Biol. 15, 607–660 8. Kuhlmann, J., Macara, I., and Wittinghofer, A. (1997) Dynamic and Equilibrium Studies on the
Interaction of Ran with Its Effector, RanBP1. Biochemistry (Mosc.). 36, 12027–12035 9. Görlich, D., Seewald, M. J., and Ribbeck, K. (2003) Characterization of Ran-driven cargo transport
and the RanGTPase system by kinetic measurements and computer simulation. EMBO J. 22, 1088–1100
10. Kelley, J. B., Datta, S., Snow, C. J., Chatterjee, M., Ni, L., Spencer, A., Yang, C.-S., Cubenas-Potts, C., Matunis, M. J., and Paschal, B. M. (2011) The Defective Nuclear Lamina in Hutchinson-Gilford Progeria Syndrome Disrupts the Nucleocytoplasmic Ran Gradient and Inhibits Nuclear Localization of Ubc9. Mol. Cell. Biol. 31, 3378–3395
11. Brucker, S., Gerwert, K., and Kötting, C. (2010) Tyr39 of Ran Preserves the Ran.GTP Gradient by Inhibiting GTP Hydrolysis. J. Mol. Biol. 401, 1–6
12. Rudack, T., Xia, F., Schlitter, J., Kötting, C., and Gerwert, K. (2012) The Role of Magnesium for Geometry and Charge in GTP Hydrolysis, Revealed by Quantum Mechanics/Molecular Mechanics Simulations. Biophys. J. 103, 293–302
13. Scheidig, A. J., Burmester, C., and Goody, R. S. (1999) The pre-hydrolysis state of p21(ras) in complex with GTP: new insights into the role of water molecules in the GTP hydrolysis reaction of ras-like proteins. Struct Fold Des. 7, 1311–24
14. Vetter, I. R., Nowak, C., Nishimoto, T., Kuhlmann, J., and Wittinghofer, A. (1999) Structure of a Ran-binding domain complexed with Ran bound to a GTP analogue: implications for nuclear transport. Nature. 398, 39–46
15. Kötting, C., and Gerwert, K. (2004) Time-resolved FTIR studies provide activation free energy, activation enthalpy and activation entropy for GTPase reactions. Chem Phys. 307, 227–232
16. Rudack, T., Xia, F., Schlitter, J., Kötting, C., and Gerwert, K. (2012) Ras and GTPase-activating protein (GAP) drive GTP into a precatalytic state as revealed by combining FTIR and biomolecular simulations. Proc. Natl. Acad. Sci. U. S. A. 109, 15295–15300
17. Warshel, A., and Karplus, M. (1972) Calculation of ground and excited state potential surfaces of conjugated molecules. I. Formulation and parametrization. J. Am. Chem. Soc. 94, 5612–5625
18. Mroginski, M. A., Murgida, D. H., and Hildebrandt, P. (2007) The Chromophore Structural Changes during the Photocycle of Phytochrome: A Combined Resonance Raman and Quantum Chemical Approach. Acc. Chem. Res. 40, 258–266
19. Steinbrecher, T., and Elstner, M. (2013) QM and QM/MM Simulations of Proteins. in Biomolecular Simulations (Monticelli, L., and Salonen, E. eds), pp. 91–124, Humana Press, Totowa, NJ, 924, 91–124
by guest on January 29, 2018http://w
ww
.jbc.org/D
ownloaded from
Analysis of the catalytic site of the GTPase Ran
13
20. Yoo, H.-Y., Boatz, J. A., Helms, V., McCammon, J. A., and Langhoff, P. W. (2001) Chromophore Protonation States and the Proton Shuttle Mechanism in Green Fluorescent Protein: Inferences Drawn from ab Initio Theoretical Studies of Chemical Structures and Vibrational Spectra †. J. Phys. Chem. B. 105, 2850–2857
21. Kubelka, J., and Keiderling, T. A. (2001) Ab Initio Calculation of Amide Carbonyl Stretch Vibrational Frequencies in Solution with Modified Basis Sets. 1. N-Methyl Acetamide. J. Phys. Chem. A. 105, 10922–10928
22. Hess, B., Kutzner, C., van der Spoel, D., and Lindahl, E. (2008) GROMACS 4: Algorithms for highly efficient, load-balanced, and scalable molecular simulation. J. Chem. Theory Comput. 4, 435–447
23. Van der Spoel, D., Lindahl, E., Hess, B., Groenhof, G., Mark, A. E., and Berendsen, H. J. C. (2005) Gromacs: Fast, Flexible, and Free. J. Comput. Chem. 26, 1701–1718
24. Groenhof, G., Bouxin-Cademartory, M., Hess, B., De Visser, S. P., Berendsen, H. J. C., Olivucci, M., Mark, A. E., and Robb, M. A. (2004) Photoactivation of the photoactive yellow protein: Why photon absorption triggers a trans-to-cis lsomerization of the chromophore in the protein. J. Am. Chem. Soc. 126, 4228–4233
25. Frisch, M. J., Trucks, G. W., Schlegel, H. B., Scuseria, G. E., Robb, M. A., Cheeseman, J. R., J. A. Montgomery, J., Vreven, T., Kudin, K. N., Burant, J. C., Millam, J. M., Iyengar, S. S., Tomasi, J., Barone, V., Mennucci, B., Cossi, M., Scalmani, G., Rega, N., Petersson, G. A., Nakatsuji, H., Hada, M., Ehara, M., Toyota, K., Fukuda, R., Hasegawa, J., Ishida, M., Nakajima, T., Honda, Y., Kitao, O., Nakai, H., Klene, M., Li, X., Knox, J. E., Hratchian, H. P., Cross, J. B., Adamo, C., Jaramillo, J., Gomperts, R., Stratmann, R. E., Yazyev, O., Austin, A. J., Cammi, R., Pomelli, C., Ochterski, J. W., Ayala, P. Y., Morokuma, K., Voth, G. A., Salvador, P., Dannenberg, J. J., Zakrzewski, V. G., Dapprich, S., Daniels, A. D., Strain, M. C., Farkas, O., Malick, D. K., Rabuck, A. D., Raghavachari, K., Foresman, J. B., Ortiz, J. V., Cui, Q., Baboul, A. G., Clifford, S., Cioslowski, J., Stefanov, B. B., Liu, G., Liashenko, A., Piskorz, P., Komaromi, I., Martin, R. L., Fox, D. J., Keith, T., Al-Laham, M. A., Peng, C. Y., Nanayakkara, A., Challacombe, M., Gill, P. M. W., Johnson, B., Chen, W., Wong, M. W., Gonzalez, C., and Pople, J. A. (2003) Gaussian 03, Gaussian Inc., Pittsburgh PA
26. Höweler, U. (2007) MAXIMOBY 9.07 and MOBY 3.0, CHEOPS Altenberge, Deutschland 27. Fischer, N., and Kandt, C. (2011) Three ways in, one way out: Water dynamics in the trans-
membrane domains of the inner membrane translocase AcrB. Proteins Struct. Funct. Bioinforma. 79, 2871–2885
28. Walker, J. (1988) Photolabile 1-(2-nitrophenyl)ethyl phosphate esters of adenine nucleotide analogs. Synthesis and mechanism of photolysis. J Am Chem Soc. 110, 7170–7
29. Park, C.-H., and Givens, R. S. (1997) New Photoactivated Protecting Groups. 6. p-Hydroxyphenacyl: A Phototrigger for Chemical and Biochemical Probes. J Am Chem Soc. 119, 2453–2463
30. Tucker, J., Sczakiel, G., Feuerstein, J., John, J., Goody, R. S., and Wittinghofer, A. (1986) Expression of p21 proteins in Escherichia coli and stereochemistry of the nucleotide-binding site. EMBO J. 5, 1351–8
31. Hillig, R. C., Renault, L., Vetter, I. R., Drell, T. I. V., Wittinghofer, A., and Becker, J. (1999) The crystal structure of rna1p: a new fold for a GTPase-activating protein. Mol. Cell. 3, 781–791
32. John, J., Sohmen, R., Feuerstein, J., Linke, R., Wittinghofer, A., and Goody, R. S. (1990) Kinetics of interaction of nucleotides with nucleotide-free H-ras p21. Biochemistry (Mosc.). 29, 6058–65
33. Cepus, V., Scheidig, A. J., Goody, R. S., and Gerwert, K. (1998) Time-resolved FTIR studies of the GTPase reaction of H-ras p21 reveal a key role for the beta-phosphate. Biochemistry (Mosc.). 37, 10263–71
34. Kötting, C., Kallenbach, A., Suveyzdis, Y., Eichholz, C., and Gerwert, K. (2007) Surface change of Ras enabling effector binding monitored in real time at atomic resolution. ChemBioChem. 8, 781–787
by guest on January 29, 2018http://w
ww
.jbc.org/D
ownloaded from
Analysis of the catalytic site of the GTPase Ran
14
35. Hessling, B., Souvignier, G., and Gerwert, K. (1993) A model-independent approach to assigning bacteriorhodopsin’s intramolecular reactions to photocycle intermediates. Biophys J. 65, 1929–41
36. Spoerner, M., Hozsa, C., Poetzl, J. A., Reiss, K., Ganser, P., Geyer, M., and Kalbitzer, H. R. (2010) Conformational States of Human Rat Sarcoma (Ras) Protein Complexed with Its Natural Ligand GTP and Their Role for Effector Interaction and GTP Hydrolysis. J. Biol. Chem. 285, 39768–39778
37. Rohrer, M., Prisner, T. F., Brugmann, O., Kass, H., Spoerner, M., Wittinghofer, A., and Kalbitzer, H. R. (2001) Structure of the metal-water complex in Ras center dot GDP studied by high-field EPR spectroscopy and P-31 NMR spectroscopy. Biochemistry (Mosc.). 40, 1884–1889
38. Gavriljuk, K., Gazdag, E.-M., Itzen, A., Kötting, C., Goody, R. S., and Gerwert, K. (2012) Catalytic mechanism of a mammalian Rab{middle dot}RabGAP complex in atomic detail. Proc. Natl. Acad. Sci. 109, 21348–21353
39. Richards, S. A., Lounsbury, K. M., and Macara, I. G. (1995) The C Terminus of the Nuclear RAN/TC4 GTPase Stabilizes the GDP-bound State and Mediates Interactions with RCC1, RAN-GAP, and HTF9A/RANBP1. J. Biol. Chem. 270, 14405–14411
40. Demunter, A., Ahmadian, M. R., Libbrecht, L., Stas, M., Baens, M., Scheffzek, K., Degreef, H., De Wolf-Peeters, C., and van Den Oord, J. J. (2001) A novel N-ras mutation in malignant melanoma is associated with excellent prognosis. Cancer Res. 61, 4916–4922
41. Fei Xia, T. R. (2011) The specific vibrational modes of GTP in solution and bound to Ras: a detailed theoretical analysis by QM/MM simulations. Phys Chem Chem Phys 2011 13 21451-21460 Phys. Chem. Chem. Phys. 13, 21451–21460
42. Fidyk, N. J., and Cerione, R. A. (2002) Understanding the catalytic mechanism of GTPase-activating proteins: demonstration of the importance of switch domain stabilization in the stimulation of GTP hydrolysis. Biochemistry (Mosc.). 41, 15644–15653
43. Phillips, M. J., Calero, G., Chan, B., Ramachandran, S., and Cerione, R. A. (2008) Effector Proteins Exert an Important Influence on the Signaling-active State of the Small GTPase Cdc42. J. Biol. Chem. 283, 14153–14164
44. Bergbrede, T., Pylypenko, O., Rak, A., and Alexandrov, K. (2005) Structure of the extremely slow GTPase Rab6A in the GTP bound form at 1.8 A resolution. J. Struct. Biol. 152, 235–238
45. Krengel, U., Schlichting, I., Scherer, A., Schumann, R., Frech, M., John, J., Kabsch, W., Pai, E. F., and Wittinghofer, A. (1990) Three-dimensional structures of H-ras p21 mutants: molecular basis for their inability to function as signal switch molecules. Cell Camb. MA U. S. 62, 539–48
46. Seewald, M. J., Korner, C., Wittinghofer, A., and Vetter, I. R. (2002) RanGAP mediates GTP hydrolysis without an arginine finger. Nature. 415, 662–666
47. Prior, I. A., Lewis, P. D., and Mattos, C. (2012) A Comprehensive Survey of Ras Mutations in Cancer. Cancer Res. 72, 2457–2467
Figure 1. Comparison of the Mg2+ coordination in the X-ray structures of a) Ras・GTP (PDB-ID 1QRA, light blue carbon atoms), b) Ran・GppNHp・RanBD1 (PDB-ID 1RRP, light green carbon atoms), and c) various available Ran X-Ray structures with their nucleotides aligned to GppNHp of 1RRP (Ran・GppNHp・RanBD1, Mg2+ in magenta) and the Mg2+ ions shown as pink spheres. Both, the βγ- and the αβγ-form are found. A similar distribution is found for Ras complexes (Figure 4). The used X-Ray structures in Figure c) can be found in Section S2 in the Supporting Information
Figure 2. Comparison of the kinetics of Ran·RanBD1, RanY39A·RanBD1, Ras, and RasY32A. The normalized absorbance differences of adjacent bands of the GTP and GDP state are shown as a measure for the progress of the hydrolysis. The fits to single exponential functions are shown as continuous lines. Figure 3. Comparison of the FTIR difference spectra of the hydrolysis reaction ahyd of Ras (blue) and Ran·RanBD1 (green, scaled by factor 1.7). The main differences occur in the νa(PαO2)-vibrational modes, the remaining part of the phosphate region is very similar.
by guest on January 29, 2018http://w
ww
.jbc.org/D
ownloaded from

Analysis of the catalytic site of the GTPase Ran
15
Figure 4. Comparison of the Mg2+ coordination in the X-Ray structures with bound GTP or GTP analoga of a) H-Ras in complex with other proteins (averaged resolution over 14 structures: 2.4 ± 0.4 Å), b) Ran in complex with other proteins (averaged resolution: 2.7 ± 0.5 Å) c) Rab in complex with other proteins (averaged resolution over 21 structures: 2.3 ± 0.5 Å), d) uncomplexed H-Ras (averaged resolution over 67 structures: 1.8 ± 0.4 Å), and e) uncomplexed Rab (averaged resolution over 39 structures: 1.9 ± 0.4 Å). The used X-Ray structures in this figure can be found in Section S3 in the Supporting Information
Figure 5. Comparison of the averaged structures of the equilibrated last 25 ns of 50 ns molecular dynamics simulations of solvated Ras·GTP·Mg2+ (light blue carbon atoms) in the βγ-form (a) and αβγ-form (b) as well as Ran·GTP·Mg2+・RanBD1 (light green carbon atoms) in the βγ-form (c) and αβγ-form (d). In (c) the second water molecule HOHX does not exist in the X-ray structure of RanWT (1RRP) and has been added referring to the Ras structure of the βγ-form. In all four 50 ns simulation trajectories of Ran and Ras the Mg2+ remained stably tridentately or bidentately coordinated by the triphosphate depending on the starting structure. Oxygen atoms are red, nitrogen atoms are blue, phosphate atoms are orange, hydrogen atoms are light grey, and the magnesium ion is purple.
Figure 6. Comparison of the asymmetrical α-phosphate stretching modes of GTP bound to Ras or Ran, respectively. The experimental values of the hydrolysis difference spectra of Ras and Ran are compared to the calculated ones with both βγ- and αβγ- coordination of the Mg2+. The corresponding IR difference spectra are shown in Figure 5.
Figure 7. Scaled FTIR difference spectra of (a) photolysis aph and (b) hydrolysis ahyd of RasWT·GTP·Mg2+ (light blue), RasWT·GTP·Mn2+ (dark blue), RanWT·GTP·Mg2+·RanBD1 (light green), and RanWT·GTP·Mn2+·RanBD1 (dark green). The observed band shifts are summarized in Table1.
Figure 8. Superimposition of Ran·GppNHp·RanBD1 (1RRP, light green) and RanΔ191·GDP·BeF3·RanBD1 (this work, 5CLL, cyan). The side chains of Thr24, Tyr39, Thr42, and Gln69 and the nucleotides and BeF3 are shown as sticks, the magnesium atoms as spheres. The distance between the two magnesium positions is approx. 1.9 Å, and the light green magnesium ion of 1RRP occupies the position of a water molecule in RanΔ191·GDP·BeF3·RanBD1 (not shown for clarity).
Figure 9. FTIR difference spectra of photolysis aph (a) and hydrolysis ahyd (b) of RasWT·GTP·Mg2+, Ras A18T·GTP·Mg2+, RanWT·GTP·Mg2+·RanBD1, and RanT25A·GTP·Mg2+·RanBD1. The intensities are scaled to the intensity of WT proteins by multiplication with factors between 1.3 and 3. The νa(PβO2) vibrational mode does not shift, as observed best in the photolysis spectrum aph. The νa(PαO2) vibrational mode is downshifted 21 cm-1 by the A18T mutation in Ras and upshifted 19 cm-1 by the T25A mutation in Ran, observed best in the hydrolysis spectrum ahyd. The spectrum of RasA18T is very similar to the one of RanWT·RanBD1 and the spectrum of RanT25A・RanBD1 is very similar to the one of RasWT. By these mutations the Ras spectra can be transduced into Ran-like spectra and vice versa. The main spectral difference between Ras and Ran・RanBD1 are due to the additional hydrogen bond of the hydroxyl group of Thr25 in Ran. The spectra of the entire mid-infrared region are shown as Supporting Figure S6 (Ras) and Figure S7 (Ran), Supporting Information.
Figure 10. Structural changes of the triphosphate in water, bound to Ran, and Ras. The educt states are destabilized by the elongation of the distance between the γ and the β phosphorous atom. The educt state in Ran·RanBD1 is less destabilized than in Ras so the energy barrier for hydrolysis in Ran is higher than in Ras. The values are the average over six 2.5 ps QM/MM simulations. Changes are exaggerated for clarity. The triphosphate structures in water and Ras are obtained by Rudack et al. (12).
by guest on January 29, 2018http://w
ww
.jbc.org/D
ownloaded from

Analysis of the catalytic site of the GTPase Ran
16
Figure 11. In a) the comparison of the X-ray structures of RanWT・GppNHP・RanBD1 (PDB ID 1RRP) (green) and RanY39A・GppNHp (this work, 5CIW, dark green) is depicted. In RanWT Tyr39 is fixed between the γ-phosphate and Gln69. b) FTIR difference spectra of photolysis aph of RanWT·GTP·Mg2+·RanBD1 (light green), and RanY39A·GTP·Mg2+·RanBD1 (dark green). The intensity of the WT measurement is scaled by the factor 1.3. The shift of 12 cm-1 of the γ-phosphate band reveals the hydrogen bond between Tyr39 and the γ-phosphate, which is absent in RanY39A. c) Comparison of the key residues in Ras and Ran involved in the steric hindrance as obtained from X-ray structures and the MD simulations. In Ran the oxygen of the Tyr side chain is much closer to a line from the Gln-Cδ atom to the phosphor atom of the γ-phosphate, leading to the hypothesis that the Tyr39-OH hinders the Gln69 side chain from assuming an optimum catalytic position close to the γ-phosphate. This could be one of the explanations why the hydrolysis rate of Ran is slower that the one of Ras. All distances and the list of averaged PDB files used to calculate the shown atom positions are given in Figure S4, Supporting Information. In d) the averaged structure of the catalytic glutamine of the last 25 ns of 50 ns MD simulations of RanWT·GTP·RanBD1, RanY39A·GTP·RanBD1, RasWT·GTP and RasY32A·GTP are represented. The colors display the simulated B-factor averaged over the side chain and backbone atoms (Table S2, Supporting Information). Note that the simulated B-factors are obtained from the fluctuation during the MD simulation and are not directly comparable to the crystallographic B-factors.
Figure 12. Depicted in green is the distance between the nitrogen atom of the Gln69 and the oxygen atom of the Tyr39 head group of Ran・ RanBD1 compared to the distance between the nitrogen atom of the Gln61 and the oxygen atom of the Tyr32 head group of Ras. The side chain of Gln69 of Ran is fixed in a hydrolytically unfavorable position by a stable hydrogen bond to the oxygen atom of the Tyr39 head group whereas the Gln61 side chain in Ras is more flexible.
Table 1. FTIR spectroscopic measurement of Mg2+ to Mn2+ exchange in Ras and Ran show that the shifts between Ran·GTP·RanBD1·Mg2+ and Ran·GTP·RanBD1·Mn2+ are comparable to the shifts between Ras·GTP·Mg2+ and Ras·GTP·Mn2+. The corresponding IR difference spectra are shown in Figure 7.
ν a(P
αO2)
ν a(P
βO2)
ν a(P
γO3)
Ran·GTP·RanBD1·Mg2+ 1241 1224
1148
Ran·GTP·RanBD1·Mn2+ 1239 1216 11
45
Shift -2 -8 -3
Ras·GTP·Mg2+ 1262 1216 11
45
Ras·GTP·Mn2+ 1262 1206 11
45
Shift 0 -10 0
by guest on January 29, 2018http://w
ww
.jbc.org/D
ownloaded from

Analysis of the catalytic site of the GTPase Ran
17
Table 2. Comparison of the shifts of the asymmetrical phosphate stretching modes of the α- (νa(PαO2)) and β-phosphate (νa(PβO2)) group of GTP bound to Ras upon A18T mutation and Ran upon T25A mutation, respectively. The experimental value is compared to the calculated ones with both βγ- and αβγ-form. The corresponding IR difference spectra are shown in Figure 5.
M
g2+co
ordi
natio
n
Ras
A18
T S
hift
ν a
(PαO
2)
ν a(P
βO2)
ν a(P
γO3)
Ran
T25
A S
hift
ν a
(PαO
2)
ν a(P
βO2)
ν a(P
γO3)
Experiment -21 0 2 19 0 -3
Simulation βγ -16 -3 7 17 4 2
Simulation aβγ 12 10 -1
by guest on January 29, 2018http://w
ww
.jbc.org/D
ownloaded from

Analysis of the catalytic site of the GTPase Ran
18
Figure 1
Thr35
Ser17 Ala18
Mg2+
H2O
1003
H2O
1004
a) Ras・ GTP・ Mg2+ (1QRA)
Thr42Thr24
Thr25
H2O
450
Mg2+
abg
b) Ran・ GppNHp・ Mg2+・ RanBD1 (1RRP)
c) Mg2+ position in various Ran X-ray structures
Mg2+
Mg2+
by guest on January 29, 2018http://w
ww
.jbc.org/D
ownloaded from
Analysis of the catalytic site of the GTPase Ran
19
Figure 2
by guest on January 29, 2018http://w
ww
.jbc.org/D
ownloaded from
Analysis of the catalytic site of the GTPase Ran
20
Figure 3
9501000105011001150120012501300
GDP
GTP
RasRan
Hydrolysis
wavenumber cm-1
GTP GDP
0.00
2
1350
a(PO
2)
a(PO
2)
a(PO
3)
a(PO
3)
a(PO
2)
a(PO
2) a(
PO
2)
A
by guest on January 29, 2018http://w
ww
.jbc.org/D
ownloaded from
Analysis of the catalytic site of the GTPase Ran
21
Figure 4
a) b) c)
d) e)
by guest on January 29, 2018http://w
ww
.jbc.org/D
ownloaded from

Analysis of the catalytic site of the GTPase Ran
22
Figure 5
a) Ras・ GTP・ Mg2+ -form
b) Ras・ GTP・ Mg2+
-form
c) Ran・ GTP・ RanBD1・ Mg2+
-formd) Ran・ GTP・ RanBD1・ Mg2+
-form
Thr35 Ser17Ala18
Mg2+
H2O
H2O
Thr35
Ser17
Ala18
H2O
Thr42
Thr24
Thr25
H2O
Mg2+
Thr42 Thr24Thr25
H2O
Mg2+
H2O
Mg2+
by guest on January 29, 2018http://w
ww
.jbc.org/D
ownloaded from
Analysis of the catalytic site of the GTPase Ran
23
Figure 6
1262RasWT a(PO2
)
1240
1250
1260
1270/cm-1
1230
RanWT a(PO2
)
Experiment Simulation
1266
1237
1241 1241
1229
by guest on January 29, 2018http://w
ww
.jbc.org/D
ownloaded from
Analysis of the catalytic site of the GTPase Ran
24
Figure 7
Ran.Mg2+Ran.Mg2+
Ran.Mn2+Ran.Mn2+
Ras.Mg2+Ras.Mg2+
Ras.Mn2+Ras.Mn2+
- 10 cm-1
- 2 cm-1
11501200125013001350wavenumber cm -1
ΔA
ΔA
a(P
αO
2)
a(P
βO
2)
a(P
αO
2)
b)a)
11001150120012501300wavenumber cm-1
cgGTP GTPGTP GDP
a(P
βO
2)
- 8 cm-1
1350 1100
a(PO3
)
a(PO3
)
0.00
20.
002
0.00
50.
002
by guest on January 29, 2018http://w
ww
.jbc.org/D
ownloaded from
Analysis of the catalytic site of the GTPase Ran
25
Figure 8
Mg2+
BeF3
Mg2+
1.9 Å
Tyr39Gln69
Thr42
Thr24
by guest on January 29, 2018http://w
ww
.jbc.org/D
ownloaded from

Analysis of the catalytic site of the GTPase Ran
26
Figure 9
RanRanRan T25ARan T25A
RasRas
0.00
2
0.00
2
Ras A18TRas A18T
- 21 cm-1
+ 19 cm-1
11001200125013001350
wavenumber cm-1
ΔA
ΔA
a(P
αO
2)
a(P
βO
2)
a(P
αO
2)
b)a)
11001150120012501300
wavenumber cm-1
cgGTP GTPGTP GDP
a(P
βO
2)
115013500.
002
a(PO3
)
a(PO3
)
0.00
2
by guest on January 29, 2018http://w
ww
.jbc.org/D
ownloaded from

Analysis of the catalytic site of the GTPase Ran
27
Figure 10
126.7°127.6°129.7°
GTP.Mg2+
Ras.GTP.Mg2+Ran.GTP.Mg2+.RanBD12.99 Å
3.00 Å
3.03 Å
1.73 Å
1.75 Å
1.74 Å
1.61 Å
1.60 Å
1.61 Å
by guest on January 29, 2018http://w
ww
.jbc.org/D
ownloaded from
Analysis of the catalytic site of the GTPase Ran
28
Figure 11
2.6 Å2.2 Å
GlnTyr
P
CO
3.8 Å3.6 Å
a) X-ray Crystallography
RanWT・GppNHp・RanBD1Δ
A
b) FTIR Spectroscopy
1100 10001050120012501300 1150
GTP
cgGTP
cgGTP GTP
wavenumber cm-1
1160 11
48
+12
a(PO3
)
a(PO2
)
s(P/O2
)
RanWT・GTP・RanBD1RanY39A・GTP・RanBD1
0.00
2
X-Ray: RasWT
X-Ray: RanWT・RanBD1
MD: RasWT
MD: RanWT・RanBD1
RanWT・RanBD1RanY39A・RanBD1 RasWT RasY32Ad) Molecular Dynamics Simulations
Gln69 Gln61
0 10 20
B-factor
c) Steric Hindrance
Tyr39Gln69
RanY39A・GppNHp・RanBD1
P
OC
by guest on January 29, 2018http://w
ww
.jbc.org/D
ownloaded from
Analysis of the catalytic site of the GTPase Ran
29
Figure 12
by guest on January 29, 2018http://w
ww
.jbc.org/D
ownloaded from

KöttingTill Rudack, Sarah Jenrich, Sven Brucker, Ingrid R. Vetter, Klaus Gerwert and Carsten
X-ray crystallography, experimental and theoretical IR spectroscopyCatalysis of GTP hydrolysis by small GTPases at atomic detail by integration of
published online August 13, 2015J. Biol. Chem.
10.1074/jbc.M115.648071Access the most updated version of this article at doi:
Alerts:
When a correction for this article is posted•
When this article is cited•
to choose from all of JBC's e-mail alertsClick here
Supplemental material:
http://www.jbc.org/content/suppl/2015/08/13/M115.648071.DC1
by guest on January 29, 2018http://w
ww
.jbc.org/D
ownloaded from