analysis of the earned value management and earned...
TRANSCRIPT

Research ArticleAnalysis of the Earned Value Management and EarnedSchedule Techniques in Complex Hydroelectric PowerProduction Projects: Cost and Time Forecast
P. Urgilés , J. Claver , and M. A. Sebastián
Department of Construction and Manufacturing Engineering, National University of Distance Education (UNED),C/Juan del Rosal 12, 28040 Madrid, Spain
Correspondence should be addressed to P. Urgiles; [email protected] and J. Claver; [email protected]
Received 21 January 2019; Revised 7 March 2019; Accepted 13 March 2019; Published 1 April 2019
Guest Editor: Julio Blanco-Fernandez
Copyright © 2019 P. Urgiles et al.This is an open access article distributed under the Creative Commons Attribution License, whichpermits unrestricted use, distribution, and reproduction in any medium, provided the original work is properly cited.
All projects take place within a context of uncertainty. That is especially noticeable in complex hydroelectric power generationprojects, which are affected by factors such as the large number ofmultidisciplinary tasks to be performed in parallel, long executiontimes, or the risks inherent in various fields like geology, hydrology, and structural, electrical, and mechanical engineering, amongothers. Such factors often lead to cost overruns and delays in projects of this type. This paper analyzes the efficiency of the EarnedValue Management technique and its Earned Schedule extension, as means of forecasting costs and deadlines when applied tocomplex hydroelectric power production projects. It is worth noting that this analysis was based on simulation models applied toreal-life projects. The results showed that cost forecasting becomes very accurate over time, whereas duration forecasting is notreliably accurate.
1. Introduction
The production of hydroelectric power is based on theinstallation and operation of large generation plants, whichare considered to be highly complex projects. Examplesfrom the international arena demonstrate complexity withstatistics revealing significant deviations in terms of costsand execution periods compared to scheduled costs anddeadlines. Various studies, such as those by the University ofOxford [1], the Institute for Energy & the Environment [2],and Awojobi & Jenkins [3], analyzed samples of 58 to 235hydroelectric projects worldwide. The results are surprising,with average values ranging from increases of 27% to 99%over planned costs and increases up to 44% in terms ofexecution periods.
A hydroelectric power production project is made upof many interrelated and interdependent subsystems. Thesesubsystems entail several engineering disciplines, like elec-trical, electronic, civil, mechanical, industrial, and environ-mental engineering, among others. Given such a context, anumber of different organizations will naturally be involved
in these types of projects. Complex projects are consideredto be dynamic systems that develop within an environmentof great uncertainty and unpredictability [4]. They call for anexceptional level of management and in fact applying systemsdeveloped for ordinary projects is normally insufficient forthe level of complexity involved in the execution of suchcomplex projects. The effect of complexity on the projectis that it hinders the identification of goals and objectivesand it bears upon the duration, costs, and quality of theproject, which in turn affects the project’s development andmanagement [5–7].
Properly identifying and handling the complexity of aproject in its early stages is a critical factor for success.Implementing follow-up and control tasks during the devel-opment of a project aims at monitoring performance aswell as obtaining projections and measurements that mayanticipate possible deviations to the schedule. Time and costmanagement is closely linked to the monitoring and controlof any project and a fundamental support of the processesrequired to manage project completion within the deadlines.In the same way, they enable the project to be completed
HindawiComplexityVolume 2019, Article ID 3190830, 11 pageshttps://doi.org/10.1155/2019/3190830

2 Complexity
within the approved budget [8–10]. The main factors thataffect the complexity of a project are its size, interdependenceand interrelations, goals and objectives, and multidisciplineengineering and technology teams, among others [11].
Earned Value Management (EVM) is one of the mostwidely used techniques worldwide with which to assess aproject’s performance during its execution. Its application inproject management has extended to important institutionslike the National Aeronautics and Space Administration(NASA). The basis of this technique was presented by the USDepartment of Defense (DoD) in the 1960s and was furtherdeveloped and improved during the 1970s and early 1980s. In1998, the American National Standards Institute (ANSI) andthe Electronic Industries Alliance (EIA) published guidelinesfor EVM. In the year 2000, the Project Management Institute(PMI) added the terminology and basic formulas of EVM[12]. An important extension to EVM is the Earned Schedule(ES) technique, which analyzes timing performance andprovides key indicators based on duration [13].
This paper analyzes the efficiency of EVM and its exten-sion as tools for forecasting costs and duration in complexhydroelectric power production projects. The analysis wasbased on applying these techniques to simulation models ofthe schedules of actual power production projects.
2. Models and Techniques
To undertake the proposed study, four complex hydroelectricpower production projects were considered. Stochastic mod-els were built for all of them, in which the random variableswere defined as cost and duration of the jobs thatmake up therespective execution schedule. The projects used are real-lifecases and their characterization is addressed in later sections.
By using numericalmethods, simulations were set up thatenabled the probability of occurrence by project completionfor cost and duration to be calculated. In each simulation,EVM techniques and its ES extension were applied and anefficiency analysis of these techniques asmeans of forecastingcost and duration was performed. The main stages in themethodology applied are described below.
2.1. Stochastic Model of the Schedule. The uncertainty sur-rounding any complex hydroelectric power productionproject renders its planning necessarily dynamic and variableover time. In such a context, a simulationmodel is a powerfultool to enable a virtual study of the project’s actual behavior.A good simulation model allows for properties of the projectplanning and schedules to be depicted, ascertained, andpredicted [14, 15]. Furthermore, it is important to bear inmind that the way the schedule is developed has a significantinfluence on the overall management of any project [16].
The models were based on schedules made up of adistributed series of interrelated tasks, and for each of thetasks likely cost and duration ranges were assigned. Figure 1shows a graphic illustration of this idea. The dependencybetween tasks and the allocation of cost and duration to themwere defined using conventional techniques: the ProgramEvaluation and Review Technique (PERT) and the CriticalPath Method (CPM). The CPM allowed for total duration of
the project to be worked out once the individual durationof each task is known, whereas the PERT provided themeans with which to build uncertainty into those durations[17, 18]. The Monte Carlo method was used to simulate themodel, which entails a random numerical method that usesstatistical sampling techniques to find approximate solutionsto quantitative problems [19]. On each run of the models, tenthousand scenarios were simulated for each schedule.
To characterize cost and duration variability in each task,probability distributions were used, specifically the PERTdistribution function. In this way, the minimum, most likely,and maximum values were estimated according to AmericanAssociation of Cost Engineering (AACE) recommendations[20]. In this regard, the research took advantage of thelead author of this paper’s 17 years’ prior experience inhydroelectric power production projects in the Republic ofEcuador. Cost and duration randomness was estimated onthe basis of possible variations in the quantities and technicaldetails of each individual task. Exceptional events that mightoccur in projects of this type, like errors in prior studiesand project designs, lack of financial resources during projectexecution, or natural phenomena like earthquakes, amongothers, were not taken into account.
The models were developed on Microsoft Excel usingPalisade @Risk software [21]. This software enables the useof Monte Carlo simulation techniques and can generatedistributions of possible outcomes of any cell or range of cellson the model spreadsheet [22]. The decision to use @Riskfor this research was based on the expertise of the firm thatdevelops the software, which has maintained it on the marketsince 1987, currently with over 150,000 users inmore than 100countries across the world and with translations into sevenlanguages. Other software optionswith significant experienceare Crystal Ball byOracle and Risk Simulator by Real OptionsValuation [23, 24].
2.2. EVM Technique and Earned Schedule. The Earned ValueManagement technique evaluates the performance of aproject during its execution by monitoring the integratedmanagement of its scope, schedule, and costs. Specifically,this technique compares baseline performance with actualperformance in terms of duration and costs [25].
To do so, the technique takes a series of fundamentalmeasurements as the basis. The Plan Value (PV) refers to thesum of the planned costs for each task in each time period,from day 1 or the commencement of project implementationup to completion. The Earned Value technique considersthis cost planning as the baseline that will serve for futureperformance comparisons. At another level, Actual Cost(AC) refers to the sum of the costs actually incurred in eachtask and for each time period. Earned Value (EV) refersto the work actually performed, expressed as a cost. Thismeasurement is calculated by multiplying the percentage ofthe actual physical progress of each task by its budgeted cost.Finally, Budget at Completion (BAC) is the total budget asestimated in the project plan.
In addition, the Earned Value technique calculates indi-cators that numerically represent the performance of the

Complexity 3
TasksProject execution time
Month 1 Month 2 Month 3 Month 4 nt
A
B
C
n tasks
US $
US $
US $
Conclusion
Figure 1: Diagram of a schedule with variable cost and duration.
project in terms of cost and schedule over a given periodof time. The main measurements are Cost Variance (CV),Cost Performance Index (CPI), Schedule Variance (SV), andSchedule Performance Index (SPI).
TheEarnedValue technique analyzes the trends in projectperformance in terms of cost and duration, i.e., based on thehistorical performance readings calculated for each period(CV, CPI, SV, and SPI); it makes forward-looking statementsand compares them to the initial budget and schedule.The main measurements for forecasting are Estimate atCompletion (EAC) and Estimate to Complete (ETC).
Figure 2 is a Cost/Time graph showing the main indica-tors and predictors the EVM technique calculates.
An important extension to EVM is the technique calledEarned Schedule. This technique consists of calculating newvalues for SV and SP but based on the variable Time andnot on Cost, which the Earned Value technique normallycalculates. This is achieved by calculating projections on theEarned Value curve for the Plan Value compared to theabscissa of the Time variable [26, 27].
This technique is based on the variables Schedule atCompletion (SAC), Earned Schedule (ES), and Actual Time(AT). In addition, the main indicators are Time Estimate atCompletion (TEAC) and the Schedule Performance Index(SPI(t)). Figure 2 presents a Cost/Time graph showing themain indicators and predictors that the Earned Scheduletechnique calculates.
EVM finds application in very varied contexts. It is atechnique traditionally applied in the construction industry[28–30], where it has been regularly and successfully applied.But it has also been applied in different highly specializedcontexts with a large number of special features and needs.Examples of this can be the projects developed by NASAwithin the framework of aerospace engineering [12] or theconstruction of nuclear plants [31]. These examples show theability of the technique to be adapted to different scenarios.In this sense, there are interesting studies in which EVMis applied to the analysis and improvement of productiveprocesses [32–35].
To verify the efficiency of EVM and its ES extension astechniques for forecasting cost and duration, the indicators
contained in these techniques were calculated and comparedwith results obtained from the simulations, as explainedbelow.
For each of the ten thousand iterations of the model,the cost prediction indicator proposed by EVM and corre-sponding to EACwas calculated. Furthermore, the simulatedfinal cost (FCS) of the project was calculated and comparedwith EAC for each iteration. The efficiency of the predictionindicator is confirmed when the difference between EAC andFCS is similar to zero. Accuracy tolerance range was 2% ofthe total budgeted cost of the project. These calculations andcomparisons were made in periods of 5 months up until thescheduled period for project completion.
In addition to that, for each of the ten thousand iter-ations in the model, the prediction indicator for durationproposed by the ES technique and giving the TEAC wascalculated. Furthermore, simulated final project time (FTS)was calculated and compared with TEAC for each iteration.The efficiency of the prediction indicator is confirmed whenthe difference between the TEAC and FTS is similar tozero. Accuracy tolerance range was 5% of overall scheduledproject time. These calculations and comparisons were madein periods of 5 months up until the period scheduled forproject completion.
2.3. Case Studies. Four actual hydroelectric power produc-tion projects were taken as case studies. The basic technicaldetails are given in Table 1. Currently, the projects namedSantiago and Cardenillo are at the final design stage andimplementation is planned for the coming years. For theirpart,Mazar Dudas and Sopladora are fully built hydroelectricplants now in operation [36].
The four projects are located on the River Amazon inthe southeast of the Republic of Ecuador. The Santiago andCardenillo projects are located entirely within the provinceofMorona Santiago at an approximate altitude of 280 and 550meters above sea level, respectively. The Sopladora project islocated in the provinces of Azuay and Morona Santiago atan altitude of 940 meters, while the Mazar Dudas project islocated in the province of Canar at an approximate altitude

4 Complexity
Cost
EV
AC
PV
AT Time
SV
BAC
EAC
ETC
VAC
CV
ES SAC TEAC
Figure 2: Cost/Time graph showing the main variables in the EVM and Earned Schedule techniques.
Table 1: Basic technical details of the hydroelectric power production projects analyzed.
Technical information Hydroelectric projectSantiago Cardenillo Mazar Dudas Sopladora
Installed capacity [MW] 3630 595.65 20.8 487Plant factor [%] 47 65 65 60River Santiago Paute Mazar PautePowerhouse type underground underground superficial undergroundTurbine Type Francis Pelton Pelton FrancisUnits 6 6 3 3Hydraulic head [m] 134 372 300 360
of 2,300 meters above sea level. Figure 3 shows their exactlocations.
The schedules of the projects under analysis served asthe input data for the simulation models. Project scheduleslist the series of jobs or tasks, how they relate to eachother, their costs, and their distribution over time. Table 2shows the main features of project schedules, where thenumber of tasks, costs, and total duration are presentedin detail. These schedules are the ones prepared and usedby the construction companies building the Mazar Dudasand Sopladora plants. In the case of Santiago and Car-denillo, the schedules were created by engineering firms.Depending on each company’s criteria, schedules can bemore or less detailed in terms of the total number oftasks or steps, which typically range between 120 and 1306.Based on their expertise, the designers and builders of theseprojects defined duration and total cost within a rangeof 27 to 75 months and US$56 to US$2,684 million. Theforecast duration and costs illustrate that these are large scaleprojects.
The schedules enabled Accumulated Cost-DurationCurves (S-Curves) to be plotted that represent the baselinesfor comparing project progress in accordance with the EVMtechnique. The baselines for the projects in question arepresented in Figure 4.
3. Results and Discussion
Probability ranges were obtained by simulating sched-ule implementation at the hydroelectric power productionprojects in our case study.
Over the full duration of the projects, the models cal-culated possible ranges of occurrence. Table 3 shows theprobabilities calculated for durations equal to or less than thescheduled duration of the projects in this case study. In thesame way, estimated duration for each project is shown, with95% likelihood of occurrence.
The values presented in Table 3 correspond to the resultsfrom the relative frequency histograms of duration returnedby the stochastic models. Figures 5(a) and 5(b) show thehistograms from the Sopladora project model. The abscissaaxis represents duration in months, while the top bar showsthe calculated probability ranges.
As far as total cost of the projects is concerned, themodels estimated possible ranges of occurrence. Table 4shows the probabilities calculated for costs equal to or lessthan the planned costs for the projects used in our case study.Estimated costs for each project with a 95% probability ofoccurrence are also presented.
The values presented in Table 4 correspond to the resultsof the relative frequency histograms of cost from the stochas-tic models. Figures 6(a) and 6(b) present the histograms

Complexity 5
Mazar Dudas project
Sopladora project
Cardenillo project
Santiago project
Figure 3: Geographical location of hydroelectric projects in the Republic of Ecuador, prepared from [36].
0
10
20
30
40
50
60
0
500
1000
1500
2000
2500
3000
0 5 10 15 20 25 30 35 40 45 50 55 60 65 70 75
Cos
t (U
S$ m
illio
ns)
Duration (months)
Sopladora Santiago Cardenillo Mazar Dudas
Figure 4: S-Curves that represent the baselines of the projects under analysis. The secondary scale represents the costs of the Mazar Dudasproject only.
Table 2: Characteristics of the schedules for the projects under analysis.
Hydroelectric project Total tasks Summary tasks Scheduled duration Planned cost[months] [million US$]
Santiago 797 29 68 2684Cardenillo 120 37 75 944Mazar Dudas 1306 29 27 56Sopladora 562 29 47 678
Table 3: Outcome of simulation models for total duration.
Hydroelectric Schedule at Completion Duration probability equal to or Estimated duration for
project95% probability
(SAC) less than SAC[months] [%] [months]
Santiago 68 6.8 78Cardenillo 75 4.2 83Mazar Dudas 27 7.9 32Sopladora 47 14.1 55

6 Complexity
Table 4: Results of simulation models in regard to total costs.
Hydroelectric project Budget at Completion (BAC) Probability of cost equal to or less than BAC Estimated cost for 95% probability[million US$] [%] [million US$]
Santiago 2684 26.1 2839.2Cardenillo 944 26.6 999.1Mazar Dudas 56 21.6 59.29Sopladora 678 22.7 714.4
Table 5: Accuracy probability rates in cost forecasts (EVM) and duration forecasts (ES) for the Santiago project.
Analysis period Earned Value (EV) Cost Accuracy Probability (%) Duration Accuracy Probability (%)[months] [millions] [Prob. 95%] [range 2% ± 26.8 million] [range 5% ± 1.7 months]5 299.00 23.00 23.2010 685.70 28.30 31.8015 1204.90 38.90 32.1020 1613.90 43.20 36.1025 1859.90 55.60 37.7030 2055.70 72.00 40.1035 2215.60 86.20 42.4040 2356.20 96.20 45.3045 2476.60 99.50 46.3050 2528.90 100.00 47.3055 2570.30 100.00 54.6060 2607.10 100.00 61.8065 2653.00 100.00 52.0068 2678.00 100.00 52.10Completion 2684.32 100.00 100.00
resulting from theCardenillo projectmodel.The abscissa axisrepresents cost in millions of US dollars, while the upper barshows the estimated probability ranges.
By applying the EVM technique and its ES extensionto the models, the probable accuracy of the techniqueswas determined in regard to the results obtained from thesimulations.The closer this probability is to 100%, the greaterthe efficiency and accuracy of the prediction are.
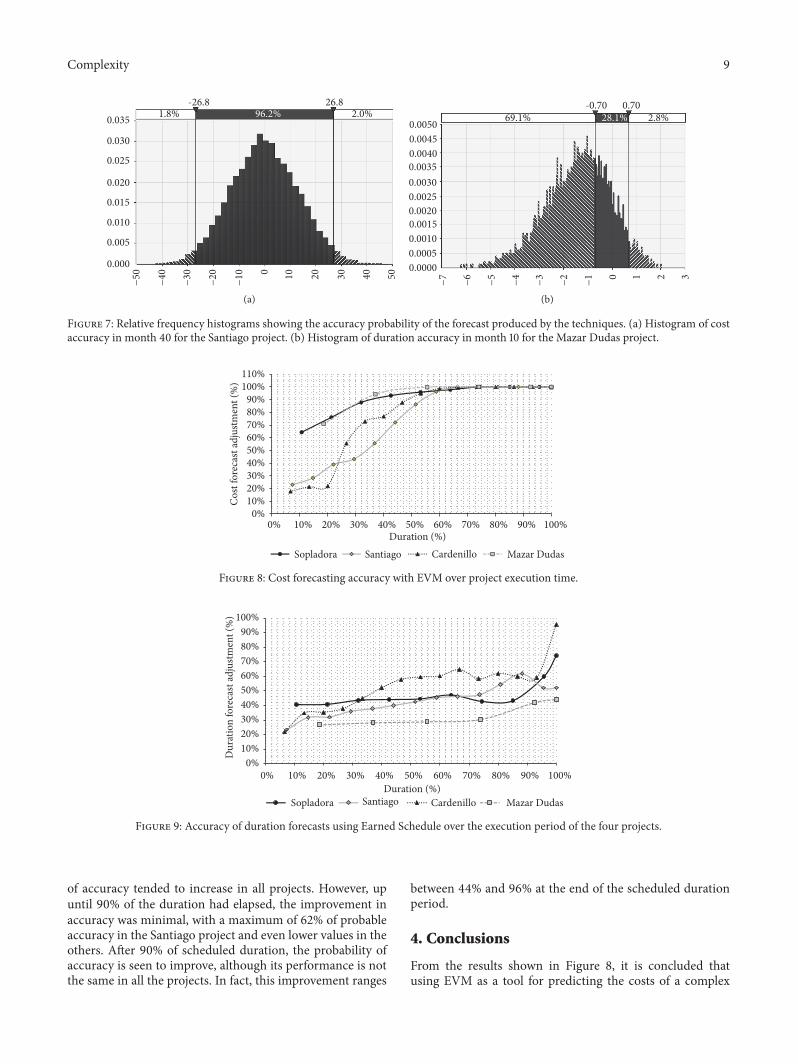
In regard to the cost and duration forecast, the modelsproduced relative frequency histograms in which the proba-bility ranges were calibrated at 2% of the total project cost and5% of the total scheduled duration of the project. Figure 7(a)presents an example using the cost histogram for the Santiagoproject for period 40 andwith the probability range calibratedto US $-26.8 and $+26.8 million, representing the 2% rangeof the total budgeted cost. Meanwhile, Figure 7(b) showsanother example, this time the duration histogram for theMazar Dudas project for period 10 and with the probabilityrange calibrated to +0.7 and -0.7 months, representing 5% ofthe total scheduled duration.
Details of the cost and duration results obtained for eachof the projects in our case study are given below.
3.1. Santiago Project. As far as forecast cost upon completionof the Santiago project is concerned, probability readingswere obtained that reflect increased efficiency or accuracyof EVM in the various periods of time under analysis. This
situation is set out in Table 5. In month 5 of execution,the probability of the predicted cost meeting the cost ofthe simulation was 23.00%, while in month 45 of execution,that probability reached 99.50% and in the following monthsit remained at 100% until completion. These probabilitycalculations were based on a range of 2% of total budgetedcost (± US$ 26.8 million).
As far as the forecast for project duration is concerned, asTable 5 shows, the probability rates obtained for the differentperiods of time in the assessment improved their accuracyover time, reaching 52.10% in month 68, which was the lastmonth in the project schedule. Probability calculations werebased on a range of 5% of scheduled duration (±1.7 months).
3.2. Cardenillo Project. Turning to the cost forecast uponcompletion of the Cardenillo project, probability rates wereobtained that demonstrated an increase in EVM accuracy orefficiency over the different periods of time under analysis, asseen in Table 6. In month 5 of execution, the probability ofthe predicted cost matching the simulated cost was 17.80 %,whereas in month 50 of execution, probability had risen to99.60% and in the following months remained at 100% untilcompletion. Probability calculations were based on a range of2% of total budgeted cost (±US$ 9.4 million).
Table 6 shows forecast duration, in which the proba-bility rates reveal improved accuracy over time, reaching59.00% in period 70, which is very close to the scheduled

Complexity 7
Table 6: Accuracy probability rates in cost forecasts (EVM) and duration forecasts (ES) for the Cardenillo project.
Analysis period Earned Value (EV) Cost Accuracy Probability (%) Duration Accuracy Probability (%)[months] [millions] [Prob. 95%] [range 2% ± 9.4 million] [range 5% ± 1.9 months]5 17.05 17.80 21.9010 32.76 21.30 34.8015 46.94 22.00 35.4020 169.70 55.60 37.8025 291.60 72.80 44.8030 417.60 76.80 52.2035 558.50 87.70 57.9040 677.00 94.90 59.6045 784.50 98.70 60.3050 860.70 99.60 64.7055 896.50 100.00 58.4060 914.40 100.00 62.0065 928.06 100.00 60.0070 939.17 100.00 59.0075 943.00 100.00 95.60Completion 944.00 100.00 100.00
Table 7: Accuracy probability rates in cost forecasts (EVM) and duration forecasts (ES) for the Mazar Dudas project.
Analysis period Earned Value (EV) Cost Accuracy Probability (%) Duration Accuracy Probability (%)[months] [millions] [Prob. 95%] [range 2% ± 0.6 million] [range 5% ± 0.7 months]5 10.85 71.00 26.7010 24.75 94.20 28.1015 40.51 99.80 28.8020 52.19 100.00 30.4025 56.41 100.00 42.0027 56.50 100.00 44.10Completion 56.55 100.00 100.00
rate upon completion. Only in period 75, which repre-sents scheduled completion, do we see a leap in prob-able accuracy up to 95.60%. The probability calculationswere based on a range of 5% of scheduled duration (±1.9months).
3.3. Mazar Dudas Project. Forecast cost upon completionof the Mazar Dudas project returns probability rates thatindicate greater accuracy, as shown in Table 7. In month 5 ofexecution, the probability of the predicted cost matching thesimulated cost was 71.00%, while in month 15 of execution,the probability was 99.80% and in the following months itstood at 100% until completion. The probability calculationswere based on a range of 2% of total planned cost (±US$ 0.6million).
As Table 7 demonstrates in regard to forecast durationof the project, the probabilities obtained improved theiraccuracy over time, to reach a value of 44.10% in period27, which is the last period in the project schedule. Theprobability calculations were based on a range of 5% ofscheduled duration (± 0.7 months).
3.4. Sopladora Project. From the results presented in Table 8,it appears that the forecast cost upon completion of theSopladora project shows probability rates with increasedaccuracy over time. In month 5 of execution, a probabilityof 64.30% was obtained, whereas in month 30 of execution,probability had risen to 97.80%. In the following months, aprobability rate of 100% was maintained until completion.The probability calculations were based on a range of 2% oftotal budgeted cost (±US$ 6.8 million).
As far as the forecast of duration for the Sopladora projectgoes, as Table 8 shows, the probabilities obtained improvedtheir accuracy over time up to a value of 74.20% in period 47.The probability calculations were based on a range of 5% ofscheduled duration (± 1.2 months).
Having seen the results obtained for the various projects,let us now discuss them as a whole. As far as cost forecastsusing EVM are concerned, in Figure 8, one can see howthe probability of accuracy in all four projects under studyperforms. From the execution start-up periods, the tendencyis for accuracy to increase in all the projects; i.e., the efficiencyof this cost forecasting is seen to improve over time. It is clear

8 Complexity
Table 8: Accuracy probability rates in cost forecasts (EVM) and duration forecasts (ES) for the Sopladora project.
Analysis period Earned Value (EV) Cost Accuracy Probability (%) Duration Accuracy Probability (%)[months] [millions] [Prob. 95%] [range 2% ± 6.8 million] [range 5% ± 1.2 months]5 102.78 64.30 40.6010 212.74 76.00 40.8015 310.30 87.80 43.6020 407.50 93.20 44.1025 502.90 95.90 44.5030 577.70 97.80 47.2035 621.20 100.00 42.8040 656.30 100.00 43.3045 676.00 100.00 59.9047 678.00 100.00 74.20Completion 678.04 100.00 100.00
0.160.140.12
0.100.080.06
0.040.020.00
42 44 46 48 50 52 54 56 58 60 62
−∞
14.1% 86.0%47.00
(a)
0.160.140.12
0.100.080.06
0.040.020.00
42 44 46 48 50 52 54 56 58 60
5.0%55.00
62
95.0%−∞
(b)
Figure 5: Relative frequency histograms of the duration of the Sopladora project. (a) Duration probability equal to or less than 47 months(SAC). (b) Duration calculated with 95% probability equal to 55 months.
26.6% 73.4%944.0
0.0160.0140.0120.0100.0080.006
0.0040.0020.000
880
900
920
940
960
980
1,00
0
1,02
0
1,04
0
−∞
(a)
95.0% 5.0%999.1
0.0160.0140.0120.0100.0080.006
0.0040.0020.000
880
900
920
940
960
980
1,00
0
1,02
0
1,04
0
−∞
(b)
Figure 6: Relative frequency histograms of cost for the Cardenillo project. (a) Cost probability is equal to or less thanUS $ 944million (BAC).(b) Cost calculated with 95% probability is equal to US$ 999.1 million.
that a probable forecast accuracy of 100% is achieved in allprojects after about 60% of execution time has elapsed andthat rate is maintained until the project is concluded.
Turning now to duration forecasting using ES, Figure 9shows how accuracy performed in the four projects understudy. From the execution start-up periods, the probability
Complexity 9
96.2% 2.0%26.8
0.035
0.030
0.025
0.020
0.015
0.010
0.005
0.000
−50
−40
−20
−10 0 10
1.8%
20 30 40 50
−30
-26.8
(a)
28.1% 2.8%0.70
0.00200.00150.00100.00050.0000
−7
−6
−4
−3
−2
−1
69.1%
0 1 2 3
−5
-0.70
0.00250.00300.00350.00400.00450.0050
(b)
Figure 7: Relative frequency histograms showing the accuracy probability of the forecast produced by the techniques. (a) Histogram of costaccuracy in month 40 for the Santiago project. (b) Histogram of duration accuracy in month 10 for the Mazar Dudas project.
0%10%20%30%40%50%60%70%80%90%
100%110%
0% 10% 20% 30% 40% 50% 60% 70% 80% 90% 100%
Cos
t for
ecas
t adj
ustm
ent (
%)
Duration (%)Sopladora Santiago Cardenillo Mazar Dudas
Figure 8: Cost forecasting accuracy with EVM over project execution time.
0%10%20%30%40%50%60%70%80%90%
100%
0% 10% 20% 30% 40% 50% 60% 70% 80% 90% 100%
Dur
atio
n fo
reca
st ad
justm
ent (
%)
Duration (%)Sopladora Santiago Cardenillo Mazar Dudas
Figure 9: Accuracy of duration forecasts using Earned Schedule over the execution period of the four projects.
of accuracy tended to increase in all projects. However, upuntil 90% of the duration had elapsed, the improvement inaccuracy was minimal, with a maximum of 62% of probableaccuracy in the Santiago project and even lower values in theothers. After 90% of scheduled duration, the probability ofaccuracy is seen to improve, although its performance is notthe same in all the projects. In fact, this improvement ranges
between 44% and 96% at the end of the scheduled durationperiod.
4. Conclusions
From the results shown in Figure 8, it is concluded thatusing EVM as a tool for predicting the costs of a complex

10 Complexity
hydroelectric power production project is seen to produceforecasts whose efficiency improves as project implemen-tation progresses to a point after about 60% of scheduledduration where the cost forecasts it provides match simulatedcosts with a 100% probability of occurrence.
Complex hydroelectric power production projects arecost intensive and call for capital outlays of many millionsof dollars implemented over several years, as shown inTable 2. In this context, EVM is a powerful tool that enablesvery efficient cost forecasting after approximately 60% ofexecution time has elapsed, thus allowing sufficient timefor decisions to be taken to correct any budget deviationsidentified.
The ES technique, as an extension of EVM applied tocomplex hydroelectric power production projects, returnedduration forecasts that tend to improve their accuracy asproject implementation progresses, as seen in Figure 9.However, these trends are individual and differ amongthe four projects in our study. Furthermore, until 90% ofscheduled duration has elapsed, its forecasting efficiency isseen to be low, as the best duration forecast correspondingto the Santiago project showed an accuracy probability of62% at 88% of scheduled duration. After 90% of scheduledduration, the tendency is for forecasting efficiency to improvesubstantially. Nevertheless, the trend varies between theprojects, ranging from 44% to 96% accuracy at 100% ofthe scheduled duration. In light of such performance, itcan be concluded that ES is not an accurate techniqueand does not offer sufficient reliability as a tool for fore-casting the duration of complex hydroelectric power plantprojects.
While ES indicators are presented in units of time, theS-Curves that the technique uses to project these indicatorsare based on costs, such as EV and PV. The baseline usedby EVM and its ES extension prioritizes the importance oftasks exclusively on the basis of their cost, so that otherfundamental variables are not taken into consideration whenweighing up the importance of a task, such as duration orthe significance of tasks that form part of a critical path. Acomplex hydroelectric power plant project is characterized bylong-lasting tasks and jobs, so it is essential to consider theirduration as a principal variable together with the costs.
This paper analyzes the efficiency of EVM and its ESextension as a tool for forecasting cost and duration incomplex hydroelectric power production projects and hasdetected certain inaccuracy in its forecasting of duration.On the basis of this diagnosis and as subsequent work to bedone as part of the lead author’s Ph.D. thesis, the intentionis to develop a new technique as a further extension ofEVM that includes duration and criticality of tasks on criticalpaths as the baselines, in addition to costs. This would entailbuilding a duration forecasting tool of suitable efficiencyto afford project managers enough time to make decisionswhen facing deviations to scheduled deadlines. This initialanalysis of how traditional techniques perform when appliedto real cases that the lead author has participated in shouldprovide a solid cornerstone in the achievement of such agoal.
Data Availability
The data used to support the findings of this study areincluded within the article.
Conflicts of Interest
The authors declare that no conflicts of interest exist in regardto the publication of this paper.
Acknowledgments
This paper is based on the ongoing activities that form partof the lead author’s Ph.D. thesis, which he is writing at theInternational School of Doctorate of the National Universityof Distance Education; therefore, the authors would liketo express their gratitude for the support provided by thisinstitution.
References
[1] A. Ansar, B. Flyvbjerg, A. Budzier, and D. Lunn, “Shouldwe build more large dams? The actual costs of hydropowermegaproject development,” Energy Policy, vol. 69, pp. 43–56,2014.
[2] B. Sovacool, A. Gilbert, and D. Nugent, “An international com-parative assessment of construction cost overruns for electricityinfraestructure,” Energy Research & Social Science, vol. 3, pp.152–160, 2014.
[3] O. Awojobi andG. P. Jenkins, “Were the hydro dams financed bythe World Bank from 1976 to 2005 worthwhile?” Energy Policy,vol. 86, pp. 222–232, 2015.
[4] International Poject Management Association IPMA, ICB-IPMA Competence Baseline Version 3.0, Nijkerk, The Nether-lands, 2003.
[5] J. Zhu, Q. Shi, P. Wu, Z. Sheng, and X. Wang, “Complexityanalysis of prefabrication contractors’ dynamic price compe-tition in mega projects with different competition strategies,”Complexity, vol. 2018, Article ID 5928235, 9 pages, 2018.
[6] S. Kermanshachi, B. Dao, J. Shane, and S. Anderson, “Projectcomplexity indicators and management strategies- a delphistudy,” Procedia Engineering, vol. 145, pp. 587–594, 2016.
[7] J. San Critobal, “Complexity in project management,” ProcediaComputer Science, vol. 121, pp. 762–766, 2017.
[8] S. W. Azim, Understanding and Managing Project Complexity,University of Manchester, 2010.
[9] J. San Cristobal, “The S-curve enveope as a tool for monitoringand control of projects,” Procedia Computer Science, vol. 121, pp.756–761, 2017.
[10] T. M. Bienvenue and R. P. Luc Cassivi, “Project planningand control in social and solidarity economy organizations: aliterature review,” Procedia Computer Science, vol. 121, pp. 692–698, 2017.
[11] J. R. San Cristobal, L. Carral, E. Diaz, J. A. Fraguela, andG. Iglesias, “Complexity and project management: a generaloverview,” Complexity, vol. 2018, Article ID 4891286, 10 pages,2018.
[12] Y. H. Kwak and F. T. Anbari, “History, practices, and future ofearned value management in government: perspectives fromNASA,” Project Management Journal, vol. 43, no. 1, pp. 77–90,2012.

Complexity 11
[13] W. Lipke, O. Zwikael, K. Henderson, and F. Anbari, “Predictionof project outcome The application of statistical methods toearned value management and earned schedule performanceindexes,” International Journal of Project Management, vol. 27,no. 4, pp. 400–407, 2009.
[14] H. Alzraiee, T. Zayed, and O. Moselhi, “Dynamic planning ofconstruction activities using hybrid simulation,” Automation inConstruction, vol. 49, pp. 176–192, 2015.
[15] P. UrgilΘs, J. Claver, M. A. Sebastian, and P. Urgiles, “Analysisof the cost schedule and earned value techniques for themonitoring and control of complex construction projects,” inProceedings of the in 22nd International Congress on ProjectManagement and Engineering, Madrid, Spain, 2018.
[16] L. S. Cardona-Meza and G. Olivar-Tost, “Modeling and simula-tion of project management through the pmbok standar usingcomplex networks,”Complexity, vol. 2017, Article ID 4791635, 12pages, 2017.
[17] Mario Vanhoucke, “An overview of recent research results andfuture research avenues using simulation studies in projectmanagement,” ISRN Computational Mathematics, vol. 2013,Article ID 513549, 19 pages, 2013.
[18] D. F. Munoz and D. F. Munoz, “Planeacion y control de proyec-tos con diferentes tipos de precedencias utilizando simulacionestocastica,” Informacion tecnologica, vol. 21, no. 4, 2010.
[19] A. Garrido and E. M. Conesa, “The Monte Carlo methodsfor use as criteria generator in construction products qualitycontrol,” Informes de la Construccion, vol. 61, no. 515, pp. 77–85,2009.
[20] American Association of Cost Engineering AACE Interna-tional, “Recommended Practice No. 66R-11: Selecting proba-bility distribution functions for use in cost and schedule risksimulation models,” AACE International, USA, 2012.
[21] Palisade Corporation, “Palisade,” https://www.palisade.com/.[22] Palisade Corporation, User’s Guide @Risk: Risk Analysis and
Simulation Add-In for Microsoft Excel, Palisade, Ithaca, NY,USA, 2015.
[23] Oracle Company, “Oracle,” https://www.oracle.com/applica-tions/crystalball/.
[24] Inc. Real Options Valuation, “Real Option Valuation,” http://www.realoptionsvaluation.com/.
[25] Project Management Institute, A Guide to the Project Manage-ment Body of Knowledge PMBOK� Guide, PMI, Pennsylvania,USA, 6th edition, 2017.
[26] W. Lipke, “Earned schedule contribution to project manage-ment,” PMWorld Journal, vol. 1, pp. 1–19, 2012.
[27] F. T. Anbari, “Advances in earned schedule and erned valuemanagement,” in Proceedings of theMethodology, TimeManage-ment, Quality Management, PMI, Dallas, TX, USA, 2011.
[28] R. G. Solıs-Carcano, G. A. Corona-Suarez, and A. J. Garcıa-Ibarra, “The use of project time management processes and theschedule performance of construction projects inMexico,” Jour-nal of Construction Engineering, vol. 2015, Article ID 868479, 9pages, 2015.
[29] A. Ziołkowska and M. Połonski, “Application of the evmmethod and its extensions in the implementation of construc-tion objects,” Engineering Structures and Technologies, vol. 7, no.4, pp. 189–196, 2016.
[30] Ahmad Jrade and Julien Lessard, “An integrated BIM systemto track the time and cost of construction projects: a casestudy,” Journal of Construction Engineering, vol. 2015, Article ID579486, 10 pages, 2015.
[31] Y. Jung, B.-S. Moon, Y.-M. Kim, and W. Kim, “Integratedcost and schedule control systems for nuclear power plantconstruction: Leveraging strategic advantages to owners andEPC firms,” Science and Technology of Nuclear Installations, vol.2015, Article ID 190925, 13 pages, 2015.
[32] M. R. Feylizadeh and M. Bagherpour, “Manufacturing perfor-mance measurement using fuzzy multi-attribute utility theoryand Z-number,” Transactions of FAMENA, vol. 42, no. 1, pp. 37–49, 2018.
[33] B. Zohoori, A. Verbraeck, M. Bagherpour, and M. Khak-daman, “Monitoring production time and cost performance bycombining earned value analysis and adaptive fuzzy control,”Computers & Industrial Engineering, 33 pages, 2018.
[34] G. H. Martins and M. G. Cleto, “Value stream mapping andearned value analysis: a case study in the paper packagingindustry in Brazil,” in Proceedings of the 22nd InternationalConference on Production Research, ICPR 2013, Brazil, August2013.
[35] M. Bagherpour, A. Zareei, S.Noori, andM.Heydari, “Designinga control mechanism using earned value analysis: an applica-tion to production environment,” The International Journal ofAdvanced Manufacturing Technology, vol. 49, no. 5-8, pp. 419–429, 2010.
[36] Ministerio de Electricidad y Energıa Renovable, Plan Maestrode Electricidad 2016-2025, MEER, Quito, Ecuador, 2017.

Hindawiwww.hindawi.com Volume 2018
MathematicsJournal of
Hindawiwww.hindawi.com Volume 2018
Mathematical Problems in Engineering
Applied MathematicsJournal of
Hindawiwww.hindawi.com Volume 2018
Probability and StatisticsHindawiwww.hindawi.com Volume 2018
Journal of
Hindawiwww.hindawi.com Volume 2018
Mathematical PhysicsAdvances in
Complex AnalysisJournal of
Hindawiwww.hindawi.com Volume 2018
OptimizationJournal of
Hindawiwww.hindawi.com Volume 2018
Hindawiwww.hindawi.com Volume 2018
Engineering Mathematics
International Journal of
Hindawiwww.hindawi.com Volume 2018
Operations ResearchAdvances in
Journal of
Hindawiwww.hindawi.com Volume 2018
Function SpacesAbstract and Applied AnalysisHindawiwww.hindawi.com Volume 2018
International Journal of Mathematics and Mathematical Sciences
Hindawiwww.hindawi.com Volume 2018
Hindawi Publishing Corporation http://www.hindawi.com Volume 2013Hindawiwww.hindawi.com
The Scientific World Journal
Volume 2018
Hindawiwww.hindawi.com Volume 2018Volume 2018
Numerical AnalysisNumerical AnalysisNumerical AnalysisNumerical AnalysisNumerical AnalysisNumerical AnalysisNumerical AnalysisNumerical AnalysisNumerical AnalysisNumerical AnalysisNumerical AnalysisNumerical AnalysisAdvances inAdvances in Discrete Dynamics in
Nature and SocietyHindawiwww.hindawi.com Volume 2018
Hindawiwww.hindawi.com
Di�erential EquationsInternational Journal of
Volume 2018
Hindawiwww.hindawi.com Volume 2018
Decision SciencesAdvances in
Hindawiwww.hindawi.com Volume 2018
AnalysisInternational Journal of
Hindawiwww.hindawi.com Volume 2018
Stochastic AnalysisInternational Journal of
Submit your manuscripts atwww.hindawi.com