analysis of the effects of mean local node-crossing time ... · pdf filetime on the evolution...
TRANSCRIPT
Analysis of the Effects of Mean Local Node-Crossing
Time on the Evolution of Sun-Synchronous Orbits*
P. Jordan, V. Blaes, and L. Roszman
COMPUTER SCIENCES CORPORATION (CSC)
J. Cooley
GODDARD SPACE FLIGHT CENTER (GSFC) /7/r
ABSTRACT
This study, an investigation of the effect of mean local node-crossing time on the evolution ofSun-synchronous orbits, was undertaken during Phase-A orbit analysis for the National
Oceanic and Atmospheric Administration (NOAA) O,P,Q environmental spacecraft. That
analysis added to the growing body of evidence that individual Sun-synchronous missions,at differing node-crossing times, experience nodal drift rates that can differ in both
magnitude and direction. A Sun-synchronous orbit is obtained by means of a nodal drift rateapproximating the 0.9856-degree-per-day apparent precession of the position of the mean
Sun. This drift rate is achieved through the interaction of the orbital semimajor axis and
inclination in Earth's geopotential field. Influencing perturbations include atmospheric dragand, most important, the effects of solar gravitation on inclination. The present analysis
examines a series of Sun-synchronous orbits with mean local node-crossing times at 1-hour
intervals from 6 a.m. to 6 p.m. It considers the fixed geometry of each orbital plane withrespect to both the Sun and the diurnal atmospheric bulge, then analyzes the influence of
these features upon the evolution of the semimajor axis and inclination and thus upon the rate
of the nodal drift in the course of 1 year.
* Thiswork was supported bythe National Aeronautics and Space Administration (NASA)/Goddard Space Flight Center
(GSFC), Greenbelt, Maryland, Contract NAS 5-31500.
177
https://ntrs.nasa.gov/search.jsp?R=19930015517 2018-05-15T01:56:42+00:00Z

1. INTRODUCTION
Because of the nonspherical mass distribution of the Earth, satellite orbits between roughly 200 kilometers
(kin) and 6000 km in altitude experience gravitational perturbations that cause the orbital plane to rotate about
the Earth's polar axis. As shown in Figure 1 (from Reference 1), the resulting nodal rotation is negative fordirect orbits [inclination (i) < 90 degrees (deg)]. For retrograde orbits (i > 90 deg) the nodal rotation ispositive. The rate of the nodal drift can be approximated by:
= - 2.06474 x 10¹⁴a-7/2 (1 - e2) -2 (cos i) (1)
where _ = nodal drift rate (deg/day)
a = semimajor axis (kin)
i = inclination (deg)
e = eccentricity
[derived from Equation (3-41), Reference 1]. In a near-circular retrograde orbit, the altitude and inclination
may be chosen to produce a nodal drift rate equal to the 0.9856 deg/day precession of the position of the mean
Sun. With such a drift rate and without other perturbations, the orbital plane would maintain a fLxed geometrywith respect to the Sun's position throughout the course of the year. In practice, the altitude and/or inclinationare selected to maintain Sun-synchronicity for a specified period within specified bounds. The orientation of a
specific Sun-synchronous orbit with respect to the Sun is idenlified by its mean local time (MLT) ofnode-crossing: i.e., the local Sun time (LST) of the nodal crossing nearest the Sun.
Figure 2 plots the results of Equation 1, showing mean altitude versus mean inclination for Sun-synchronous
orbits from 200 km to 5974 km in altitude. The resulting curve approximates the full range ofaltitudefmclination (a/i) combinations which, without other perturbations, would produce nodal drift rates
equaling the Sun's precession. A/i combinations above and to the left of this Sun-synchronous curve producenodal drift rates of less than 0.9856 deg/day. The MLT of such an orbit gradually decreases as the node moves
westward toward 06:00 LST (6 a.m.). SimiLarly, an a/i combination below and to the right of the curveproduces a drift rate greater than 0.9856 deg/day, with an MLT that gradually Increases as the node moveseastward toward 18:00 LST (6 p.m.).
It has been widely observed both in orbit determination and in theoretical studies (Table 1, References 2 and 3)
that nodal drift rates can differ significantly from mission to mission, in direction as well as in magnitude.Where the a/i's are similar, the rate differences can occur with differing MLTs. One example comes from early
mission planning for the NOAA O,P,Q series of Sun-synchronous environmental spacecraft, scheduled for
launch after 2001. These spacecraft are designed to operate in one of two orbits with similar a/i's but differingMLTs (orbit parameters are given in Table 2). Figure 3 [from orbit propagations using the Goddard Mission
Analysis System (GMAS)] shows that, when each orbit is targeted to an a/i point lying on theSun-synchronous curve, the MLT drift of the 08:00 LST morning ("AM") orbit is opposite to that of the
13:45 LST afternoon ("PM") orbit. The mean attitude and inclination for both orbits in Figure 3 are plottedagainst time in Figures 4 and 5, respectively. The differences in the altitude decay rates of the two orbits isattributed to atmospheric drag effects, which are discussed below. The directional difference in the a/i drift is
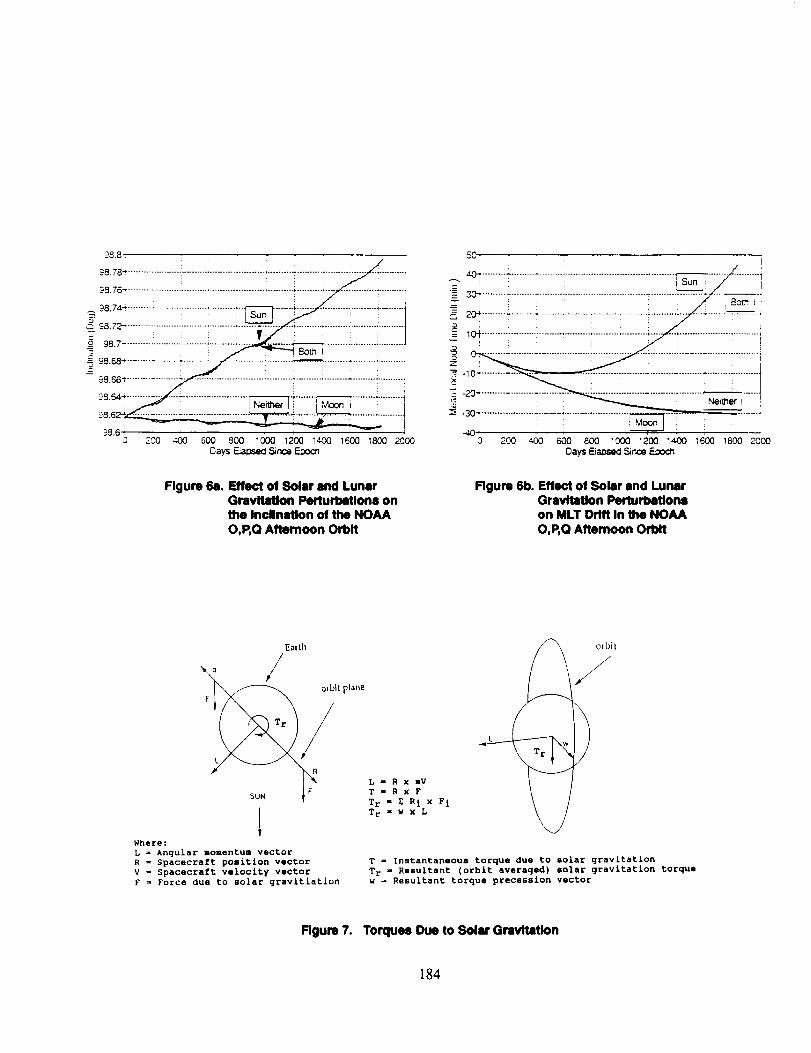
explained in Figure 5, where the inclination is shown to be increasing in the PM orbit and decreasing in theAM. As demonstrated by K. I. Duck in 1973 (References 2 and 3) and supported by analysis in GMAS (shownin Figures 6a and 6b), the source of this inclination drift is solar gravitation.
178
2. PERTURBATIONS IN SUN-SYNCHRONOUS ORBITS
Because of the fixed geometry with respect to the Sun, Sun-synchronous orbits are subject to the cumulativeeffects of solar gravitation. This force, which is greater on the Sunward side of the orbit, produces a small
resultant (orbit-averaged) torque that acts on the angular momentum vector, thereby changing the inclination
as shown diagrammatically in Figure 7 (adapted from Reference 4) and analytically (from GMAS outputs) in
Figures 6a and 6b. As can be readily deduced from Figure 7, the torque is opposite in direction for MLTs on
opposite sides of local noon, whether ascending or descending nodal crossings are involved. According to
Duck's analysis, maximum inclination drift rates should occur at 09:00 and 15:00 LST, with minimum driftsat 06:00, 12:00, and 18:00 LST. Since there is no fLxed geometry with respect to the Moon, lunar gravitation
produces no cumulative torque on the orbit but does cause the oscillation in the rate of the inclination drift
seen in Figures 5 and 6a.
As in all near-Earth orbits, the altitude is subject to decay due to atmospheric drag. Due to the fixed geometry,
however, Sun-synchronous orbits decay at differing rates depending on the orientation of the orbit plane to thediurnal bulge in Earth's atmosphere. Daily heating of the atmosphere results in a bulge of warmed air which
lies about 2 hours east of the Sun line. Thus, Sun-synchronous spacecraft with MLTs near 14:00 LST pass
through increased densities at each node crossing on the Sunward side. This causes the difference in decay
rates in Figure 4.
3. EFFECT OF NODE-CROSSING TIME ON NODAL DRIFT
To examine systematically the effect of node-crossing time, a series of 1-year orbit propagations was
generated in GMAS using the Goddard Space Flight Center (GSFC) Flight Dynamics Division (FDD)
mainframe computing system. The GMAS force model [calibrated on observed Television Infrared
Observation Satellite (TIROS) data] included the following: the Goddard Earth Model (GEM9) geopotentialfield model with a 21 x 21 matrix, atmospheric drag modeling based on modified Harris-Priester
atmospheric density tables with July 1, 1991, Schatten +20 solar flux prediction data, and solar and lunar
gravitational perturbations. The Averaged Variation of Parameters (AVGVOP) propagator was used with a
1-day step size. Identical initial Brouwer mean element sets (Table 3) were used in each run, with theexception of the right ascensions of the ascending node (RAANs, Table 4), which were chosen as necessary
for MLTs at 1-hour intervals from 06:00 to 18:00 LST. The 800-kin altitude and 98.603-deg inclination were
taken from Figure 2, with other elements from a NOAA O,P,Q, AM orbit and an epoch of January 1, 1999.Rates of change of the mean altitude and inclination over the year were calculated from the GMAS output and
plotted for analysis using the Quattro Pro commercial spreadsheet package running on an IBM PC.
The resulting 1-year drift rates in inclination and altitude are plotted against MLT in Figures 8a and 8b,
respectively. As K. I. Duck predicted (References 2 and 3), the direction of inclination drift is negative at
morning MLTs and positive at afternoon MLTs, with maximum rates at 09:00 and 15:00 LST and near-zerodrift at 06:00, 12:00, and 18:00 LST. The rates at intermediate MLTs show an orderly progression between the
predicted means and extremes, suggesting that, with appropriate altitudes, the long-term result of the Sun's
gravitational torque would be to align Sun-synchronous orbits perpendicular to the Sun vector. This variationof the drift rates across the day also accords well with the 08:00 and 13:45 LST NOAA O,P,Q inclination
changes seen in Figure 5. The drift rates at 08:00 and 14:00 LST are indeed opposite in direction, with the
same near-maximum magnitudes. As expected, the maximum altitude decay rate was at 14:00 LST, with theminimum rate 6 hours earlier at 08:00 LST, when the spacecraft would encounter the lowest atmospheric
densities. Again, this agrees with the altitude decay rates seen in the PM and AM NOAA O,P,Q orbits
(Figure 4).
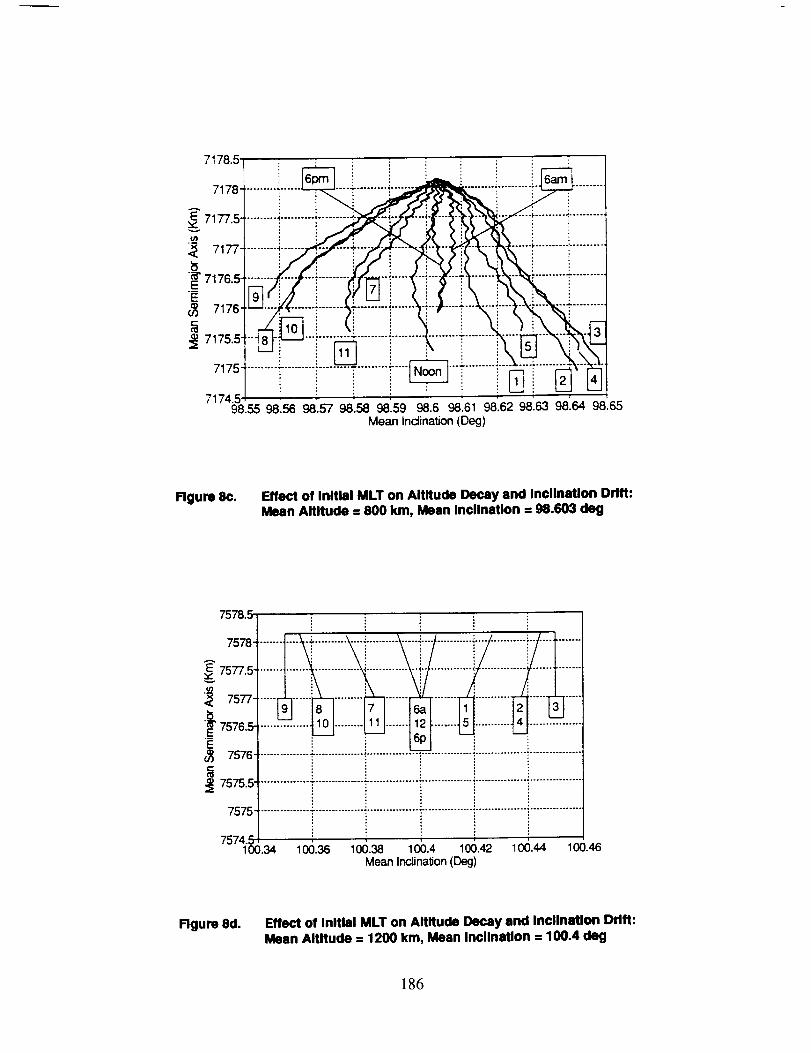
Figure 8c shows the combined changes in ali for each MLT. As expected, the lines for the 06:00 (6 a.m.), 12:00
(noon), and 18:00 (6 p.m.) LST MLTs lie near the center of the plot, indicating little inclination change. The
179
curvesforthemorning(6to 11a.m)MLTscurvetotheleft, showingdecreasing inclinations, and the curves
for afternoon (1 to 6 p.m.) MLTs curve right, showing increasing inclinations. The lengths of the curves,indicating the change in altitude, decrease from 06:00 to 08:00 LST, then increase to a maximum at 14:00
(2 p.m.) LST, after which they begin decreasing again. Figure 8d shows the inclmauon drifts in a 1200-kin
Sun-synchronous orbit where altitude decay is no longer a factor.
It is evident from Equation (1) that the initial nodal drift rate at each MLT is dependent upon both altitude and
inclination. Subsequent nodal drift rates at each MLT are controlled chiefly by the altitude and inclination
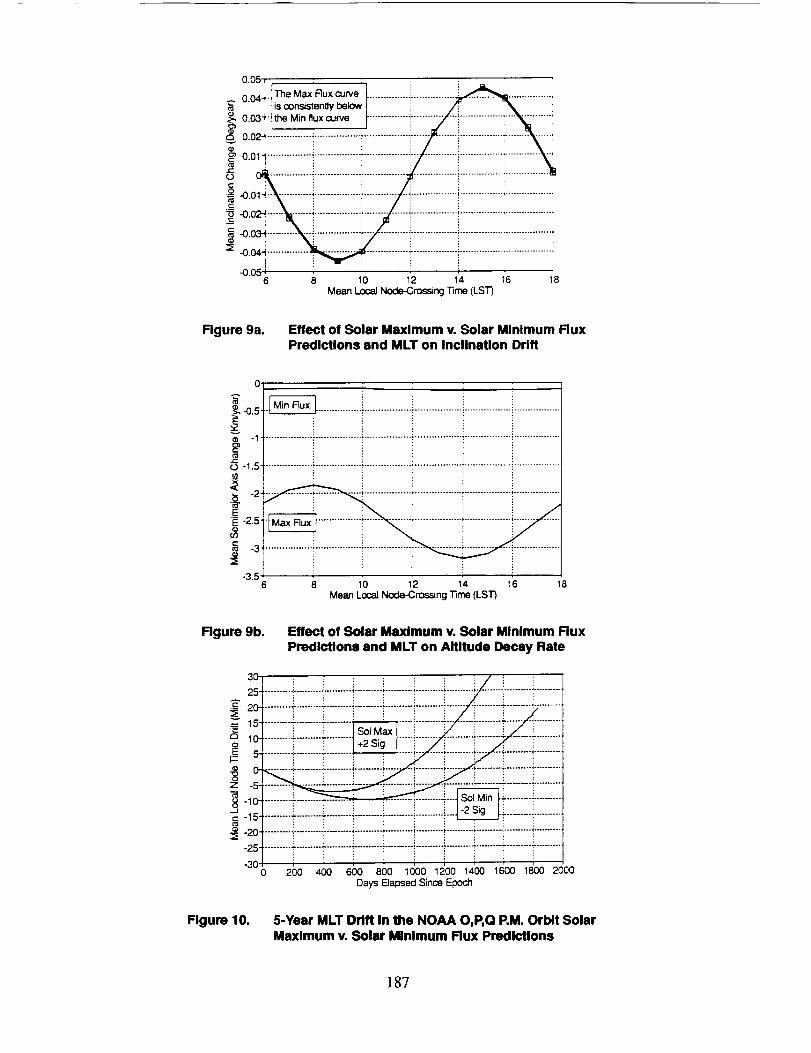
drift rates in effect at that MLT, as described above. A third factor in the determination of the long-term MLT
drift at a given MLT is the solar flux level, determined by the phase of the 11-year solar cycle, which affects the
rate of altitude decay at lower altitudes. To test this effect, an additional series of GMAS rims was performed
using the original elements (Table 3) with the MLT-specific RAANs (Table 4), but changing the epoch to 2006and the solar flux data to -2o, effectively changing the solar flux level from near maximum to near minimum.
As shown in Figure 9a, this change has little effect on inclination drift. However, the effect on altitude decay(Figure 9b) is more significant. Figure 10 shows the effect on MLT drift for the NOAA O,P,Q PM orbit due to
flux differences between the maximum and minimum phases of the solar cycle.
4. COMBINED EFFECTS OF INCLINATION, ALTITUDE, ANDNODE-CROSSING TIME ON NODAL DRIFT
How, then, do altitude decay and inclination drift rates vary across the day for Sun-synchronous orbits atvarying a/i combinations? Further GMAS propagation runs, modeled as described above, were executed for
selected a/i combinations from Table 1 and/or Figure 2. Again, the MLT-specific RAANs were taken from
Table 4 and the remaining elements from Table 3. The epoch in all cases was January 1, 1999, with +20 solar
flux data. The resulting altitude and inclination drift rates are shown in Figures 1la and 1lb, respectively. The
disparity in the inclination drift rates at 500 km is due to rapid altitude decay at that altitude. Figure 1lc showsthe resulting MLT drift rates at 14:30 LST for 500-, 800-, and 1200-km Sun-synchronous orbits.
Note the inclination drift rate (from Table 1) indicated in Figure lla by the numeral 1, a value of
0.053 deg/year as calculated in GMAS. This value agrees very well with K. I. Duck's 1973 prediction of
0.0552 deg/year inclination drift for a 3:00 p.m. (15:00 LST) orbit at this altitude (References 2 and 3). [The
inclination for the GMAS runs at this altitude was estimated using Equation (1).] Other key data points fromTable 1 are also indicated by item number on Figure lla.
5. MISSION PLANNING ISSUES
Though the drift rates in Figure 8c, 11a, and 11b will vary with the solar cycle, as has been shown, they can be
used together with the methods described in References 5 and 8 to guide the initial design of Sun-synchronousorbits. For one example, altitude-sensitive missions would do well to avoid the 13:00 to 15:00 LST MLT
range. For another, the low inclination drift rates at MLTs near 06:00, 12:00, and 18:00 LST (Figure 11a)suggest that long-duration missions might operate more efficiently at near-noon or near-terminator node
crossings. Figure 12b confirms this for orbits in the 800 km altitude range, showing how closely the 12:00
LST (noon) A/I drift tracks the Sun-synchronous line. However, with the low altitude decay rates in 1200 kin
orbits (Figure 12a), even a small inclination drift moves the A/I curve away from the Sun line very quickly.With the high altitude decay rates in 500 km orbits (Figure 12c) no MLT will hold the A/I drift near the Sun
line, but a comparison of Figures 12b and 12c suggests that, for altitudes in the 600 to 750 kin range, amorning MLT might be found which would hold the A/I drift curve very near the Sun-line. This would allow a
very stable node-crossing MLT for an extended period. Where the science or operational requirements of amission make these choices impossible, an understanding of the direction and rate of a/i drift at a given MLT,
altitude, and/or inclination can lead very quickly to a Sun-synchronous or biased-Sun-synchronous targeting
180

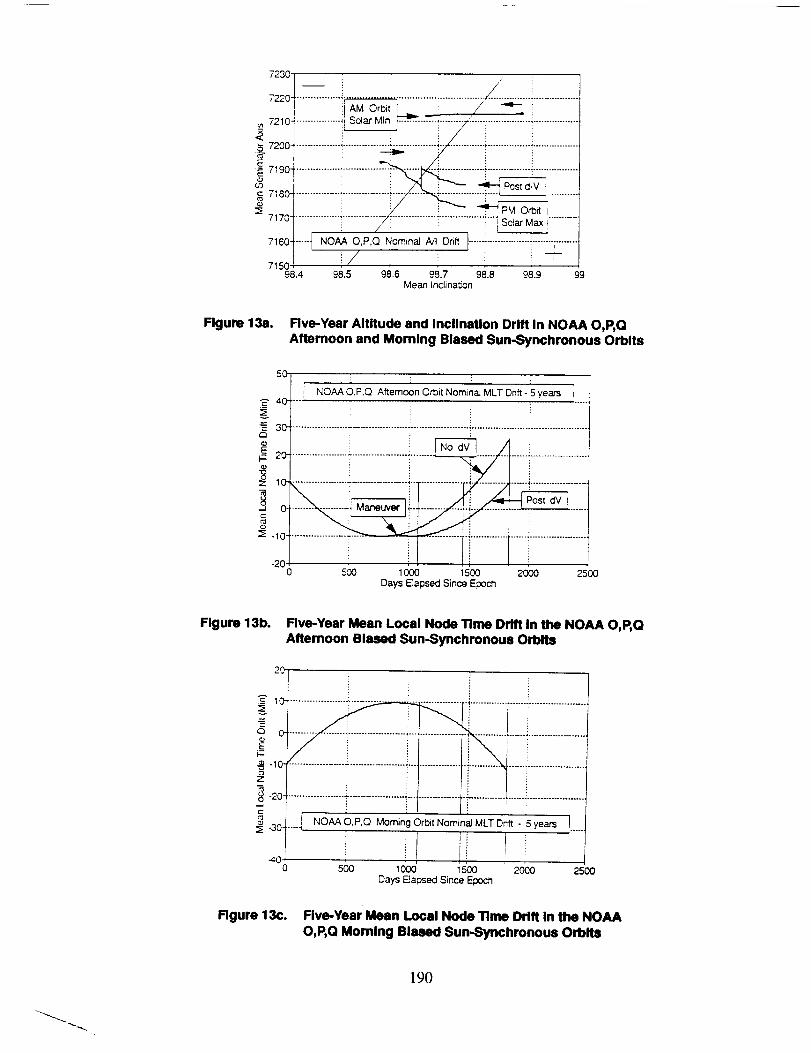
scenarioto meetthe generalMLT constraints.With sucha scenarioin hand,relativelyfew GMASpropagationrunsareneededto optimizethea/itargetsforadetailedplantomeetmissionconstraintsoveragivenphaseofthesolarfluxcycle.Asanexampleofsuchaplan,thebiasedSun-synchronousorbitplanforNOAAO,P,Q(completewitha mid-lifemaneuverfor thePMorbit)isgiveninFigures13athrough13c.Figure13ashowsthe5-yeara/i drift; theresultingMLT drifts in thePMandAM orbitsareshowninFigures13band13c,respectively.
6. SUMMARY
The evolution of the MLT of node-crossing of Sun-synchronous orbits depends upon drifts in the orbital
inclination and altitude, which arise from perturbations due to solar gravitation and atmospheric drag. As
shown in Figures 8c, 1la, and 1lb, the rates of these drifts vary with the node-crossing time as well as with theinitial altitude and inclination. Though the drift rates will vary to some extent with the solar cycle, these
figures can be used according to methods described in References 5 and 8 to simplify early mission planning
for any Sun-synchronous orbit.
REFERENCES
1. J.R. Wertz, "Summary of Orbit Properties and Terminology," Spacecraf_ Attitude and Control, New
York: D. Reidel Publishing Company, 1978
2. K.I. Duck, GSFC Memorandum 733:5, "Analysis of Solar Gravitational Effect on Sun Synchronous
Orbit Inclination," Janual'y 1973
3. K.I. Duck, GSFC Memorandum 733:73, "Inclination Biases for Sun Synchronous Spacecraft," April
1973
4. D. Folta to W. Barnes, "Analysis of Earth Observing System Zenith Angles, Sun Angles, Mean Local
Time, and Ground Track," private communication, December 12, 1990
5. D. Folta and L. Kraft, AAS 92-143, "Methodology for the Passive Control of Orbital Inclination and
Mean Local Time to Meet Sun-Synchronous Orbit Requirements," February 1992
6. Private communication with L. Kraft, NASA/GSFC, Code 554, March 12, 1992
7. Private conversations with M. Schmidt, C. Cox, and S. Goode, CSC, March 9-11, 1992
8. Goddard Space Flight Center, Flight Dynamics Division, Phase-A Orbit Feasibility Analysis for theNational Oceanic and Atmospheric Administration (NOAA ) Polar Orbiting Environmental Satellite
Series O/P,Q, P. Jordan (CSC), in preparation
BIBLIOGRAPHY
.
.
3.
National Aeronautics and Space Administration, NOAA O,P,Q Phase-A Analysis Report, Volumes I
and H, T. Karras, ed., January 29, 1992
M. D. Griffin and J. R. French, Space Vehicle Design, Washington, DC: AIAA Inc., 1991
B. Kampos, NASA CR-1008, "General Perturbation The_ry," April 1968
181

3_BI_IL / _(AN PEA_UAIATlV(
= 4GOLAm / I :_.RCE WMEN_C_I£_rLJM _ /: SATEI._.I_IE IS ASOVlE
/
, - OF "+_OE \\ ,'
, / W I/ '+.,o_,o,• '\ ,
_._TELLITE omelr ---41, /
60(_
5O(3O-
._o. . .........................................................
: i
:_ 20(_ ....... --+ ................................................ ,...........
• i i '
• : : : - , p----* .... :......... - ....... - ........ •.... _ _ i-.--,
90 100 110 120 130 140 150 160 170 180
Mean In_in_ons (De{j)
Flgure 1. Regression of Nodes Due to theEarth's Oblateness
Flgum 2. Altitude and Inclination Requiredfor Sun-Synchronous Orbits, 200to 5974 km
Table 1. Obeerved and TheoreUe_l Data on the EvoluUon of MLT Drift Ratesas a Function of MLT
ITEM 8PACGC3RAFT/COMMENT REF
I DUCK ANALYSIS 2
ESSA-8 2
TIROS-M 2
2 EOS-PM 5, 6
3 LANDSAT-4" 7
4 LANDSAT-5"* 7
5 COBE (POS'rVENTING)" 7
"ESTIMATED USING EQUATION 1"NO LONGER FULLY SUN-SYNCHRONOUS
TYPE OF ALTITUDE INCLINATION INCI.JI¢_
DATA (KM) (DEG) liLT (L81") 11ON DRIFT(DEG/YEAR)
THEORETICAL 1684.0 102 JeSO* 15:00 0.0562
OBSERVED O9:0O -0.054O
OBSERVED 15:00 0.0560
THEORETICAL 70e.3 98.1358 13:30 0.0310
OBSERVED [email protected] 98.2320 09:31 -0.0430
OBSERVED 690.7 98.2890 09:32 -0.0480
OBSERVED 881.0 99.0210 06:11 -0.0080
182
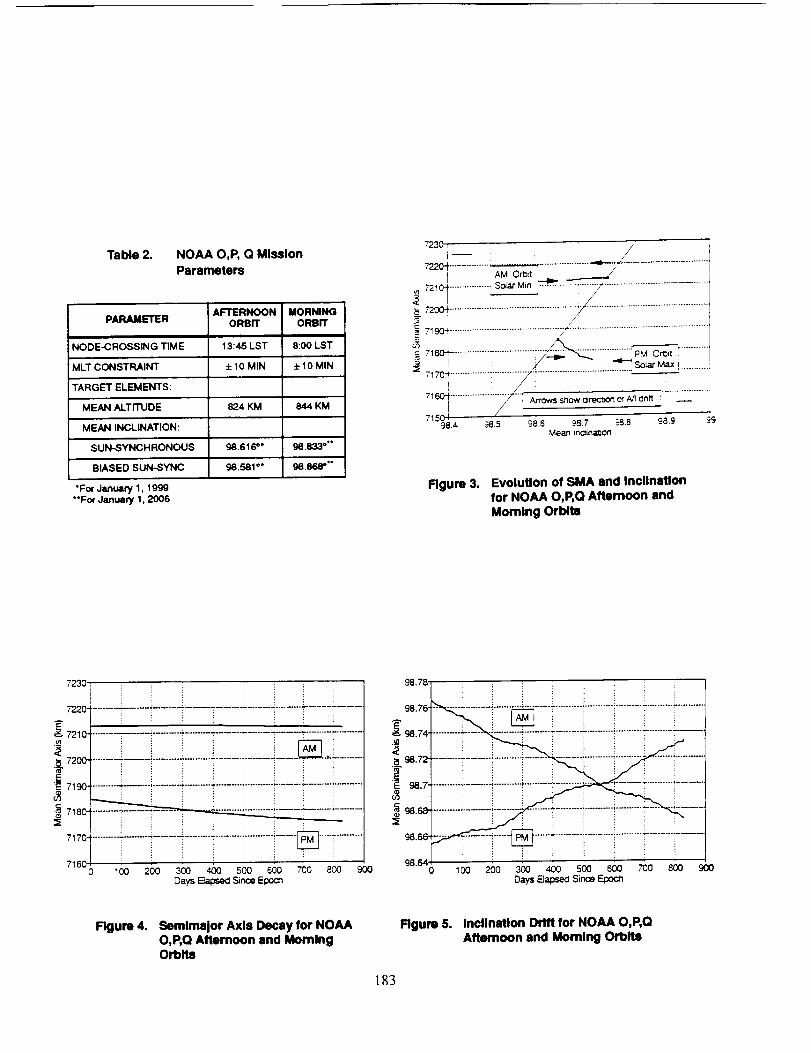
Table 2. NOAA O,P, Q Mlsslon
Parameters
AFTERNOON MORNINGPARAMETER ORBIT ORBIT
NODE-CROSSING TIME 13:45 LST 8:00 LST
MLT CONSTRAINT +10 MIN ±10 MIN
TARGET ELEMENTS:
MEAN ALTITUDE 824 KM 844 KM
MEAN INCLINATION:
SUN-SYNCHRONOUS 98616 _° 98 833"'"
BIASED SUN-SYNC 98.581 °° 98 868""
"For January I, 1999
"'For January I, 2006
7230 f
m 7210"_ ................ i Sot_u"Min .................................
7200ff ................ ' ................. i ................ '/ ............................ _..................
7_8 ............................:_ ................_ ............
= 7170"_................ :......... ""/'_ ................................... _ ,--
716Off ...................... IY'"_ Arrowssnowairec_onotA/]dntt I
i /7150 1
98.4 98.5 98.6 98.7 _8.8 98.9 _9Mean Inr_inaI2on
Rgum 3. Evolution of SMA and Inclinationfor NOAA O,P,Q Afternoon and
Morning Orbits
7230j ,.
.......- ............................................7210_ ........ -------!-----T...... ,------_i _ .... '! i..... "7"-------[]---_..... --- ....
0 100 200 300 400 500 600 700 800 900Days Bapsed S_nce El:x:x_
98.78'
98.76
9874so
98.72
"_ 98.7'
_ 98.68
98.6e
100 200 300 400 500 600 700 800 900Days Elapsed Since Epoc_
Figure 4. Semimejor Axis Decay for NOAAO,P,Q Afternoon and MorningOmits
183
Rgum 5. Inclination Drift for NOAA O,P,Q
Afternoon and Morning Orbits
98.8,
98.78_/ I
_8 76 ; : _S[ iii[iiiiiiiii : _ ,-LT...............................:.........).........:.........F.............................:..........;_8"_T.....................:..........:.........: s_'-_q_.......r........r....................1.........................................................
_ _._..............................................v_..__ .............i..........j_8-_!........T.........,_ ............._-: ........:..........
= _8664........ ±........i ................ L..........i..........:..........L.........L.........i..........
',3 ZC0 4.00 600 800 1000 1200 14.00 1600 1800 2000
Days _ S_,'_ Epom
50,
_ .........:..........: ....................:....................._........._......./.. ........= 3_ ......... " ................................................... - .......... _ .......
s 2o,.........,........., .........,..........,..........,..........-...........:/---: .......... i
@ '. .......2........., ........._..........i..................._..........!........2....................i
o ........jz, . . ! : i.==========================::!
.2o_............................_ .............i ........... _ ......i
.30 _,......... _.......... +...... ; ........ ; .............. _ ......
i____ I443+ .
0 200 400 600 800 1000 1200 1400 1600 1800 2000
Oays Ei_ Sin_ F4x_
Figure 6a. Effect o4 Solar and LunarGravitation PerturbaUona onthe IncUnatlon of the NOAAO,P,Q Afternoon Orbit
Figure 6b. Effect of Solar and LunarGravitation Perturbationson MLT Drift In the NOAAO,P,Q Afternoon Orbit
Earth
%/ olblt plane
kWhere:
L = Angular momentum vectorR = Spacecraft position vector
V = Spacecraft velocity vector
F = Force due to solar gravltiation
L-RxmV
T-RxF
T r - E R i x F i
Tr-WXL
L w
orbit
.f
T = Instantaneous torque due to solar gravitation
T r - Resultant (orbit averaged) solar gravitation torque
w _ Resultant torque precession vector
Figure 7. Torques Due to Solar Gravitation
184

Table 3. Mean Elements Used inGMAS Runs
SEMIMAJOR AXIS 7178.14
ECCENTRICITY 0.00114
INCLINATION 98.603 °
RIGHT ASCENSION OF ASCENDING SEE TABLE 4
NODE
ARGUMENT OF PERIGEE 90.0
MEAN ANOMALY 270.0
Table 4. RAANS Used in GMASRuns
MLT
06:00
RAAN
190.196
07:00 205.196
08:00 220.196
09:00 235.196
10:00 250.196
11:00 265.196
12:00 280.196
13:00 295.195
14:00 310.196
15:00 325.196
16:00 340.196
17:00 355.196
18:00 10.196
0.05 :
o.o,i................._................._................_ ............._.o,.._..........i.................i..........-fi.................i.................i.................t
cos Yi_ ,i I6 8 10 12 14 16 18
Mean Local Node-Cms_ng Time (LST)
Figure 8a. Effect of Initial MLT on Inclination Drift: MeanAltitude = 800 km, Mean IncllnaUon = 98.603 deg
-1.8-
-2-
-2.2 c
-2.4"
0
_-_!_5
a" -2,8.e_E
-3
_-3.22_
-3.4
................. 4.................. ;............... ;.................. ;................. 4................
lrO 1'2 14 16 1 8
Mean Local Node-Crossing lqme (LST)
Figure 8b. Effect of Initial MLT on Altitude Decay Rate: MeanAltitude : 800 km, Mean Inclination : 98.603 deg
185
7178.5-
7178-
_E'7_ 77.5-
_" 7177-
"EL:-7176.5-
7176-
_. 7175.5-
7175-
iiiiiiiiiiiiiill__T........._.......'.........i..........i iiiiiiii.......... 4....... ' ...... _........... i...........
T .........
98.55 98156 98'.57 98'.56 98159 98.6 98'.61 98'.62 98163 98.64 98.65
Mean Inclination (Deg)
Rgure 8c, Effect of Initial MLT on AlUtude Decay and Inclination Drift:
Mean Altitude = 800 km, Mean Inclination = 98.603 (leg
7578.5i i :
7578-
E 7577.5-
7577-
I_7576.5-Eu_ 7576 .....................................................................................................
..............._..............._................_................_................_................
7575]7574.5 ! ! : :
100.34 100.36 100.38 100.4 100.42 100.44 100.46Mean lnclina_on(Deg)
Rgure 8d. Effect of Initial MLT on Altitude Decay and Inclination Drift:
Mean Altitude = 1200 kin, Mean Inclination = 100.4 (leg
186
0.05
A 0.04-
0.03
_ O.02-
& o.or
o 0
_ 43.01-
_ 43.02
_ -o.03-
-0.04-
43.056
]is consistently below /_
_i.i_.............. 4................. ; .............. 4................. ;................................i;..................................
1'0 1'2 1'4 16 18
Mean LocaJ Node-Cros_ng Time (LST)
Rgure 9a. Effect of Solar Maximum v. Solar Minimum RuxPredictions and MLT on Inclination Drift
_ -0.5- -_ ........................................................................................
_1) °1 ............................................................................................................
(0
-1,5 ............................................................................................................
_ -3 _:.. .............
6 10 12 14 16 18Mean Local Node-Crossing "13me(LST)
Rgure 9b. Effect of Solar Maximum v. Solar Minimum FluxPredictions and MLT on Altitude Decay Rate
2 ..........:...........i........._..........;..........,.........._........... :..........;..........
-_ _ _ _ _........i.........._........_..........".........i..........
=-- 15 .........+.........- ........._-----_ .........-.:........i.........f ...... !.........._5 1 ........._........i ............. i.........i.........-_......... ......._..........
_ ........._..........._.....................I.= i i i i : ! i i i¢, ........ .;.......... ;-......... .i......... ;........ ;.......... ;....... _......... 4......... 4.........."_ i i :: _ i i i i
Z .1_ii!i}iiiiii-5......... ! ....... _"......... _....... "........... _....... :.......... "......... _ ....... _.................
= -15ff ........ _"........ _ ......... _.......... _,......... !.......... ._-"!.__ _......... "..........
-2o_...........:i...........:_.........I..........!.........;.........._.........._..........i........._..........-25_.........÷.........+.........,_.........i.........i.........!.........-.........+.........i..........-3ol :, i i :, i i _ i
0 200 400 600 800 1000 1200 1400 1600 1800 2000
Days Elapsed Since Epoch
Figure 10. 5-Year MLT Drift In the NOAA O,P,Q P.M. Orbit SolarMaximum v. Solar Minimum Flux Predictions
187

0.06, .._ ,_'!
o.o47_ ................._ //22t \\\
.............._ ................._:_...A_.I.__.....
_.o_...........................................................
6 8 10 12 14 16 18Mea_ LccaJ Node-Cross_ng T_me (LSQ
Figure 11a. Effect of Initial MLT on Inclination Drift at Varying Altitudes
20 _3 -2000km--] IInr- ' i 1
:_!L_....:.............i............i.................11i
x_C3 -60- ................................................:................_................
I
!2 14 16Mean Local Node-Cross_r_J .._me (LST)
Figure 11b. Effect ot Initial MLT on Altitude Decay Rate at Varying Altitudes
_" 1001 the 500 krn orbit will beg,n ......!.........?........._71 ..........
........._........._..........i....................!.........! :__
=6°_i ..........i..........i.........._.........T......._/--i_--z_o.._.i.........i..................._----_--i----_........................,......,...........................................................
/
0 200 400 600 800 1000 1200 1400 1600 1800 2,300Days Flapsed From Jan.l. 1999
Figure 11c. Effect of Initial Altitude and Inclination on MLT DriftRates for 1430 LST Sun-Synchronous Orbits
188

7585, : :_ .
I J_l: Ori_t / .,-/ ' F__ 758o_.........: .........:-----L _............_ ....... _.........- ..........
_. ../......._ 06.00 LST i .............. :_'57_1..........:.........:........._ ............._--i .........:.........
7565 ¢100.35100.36100.37100.38100.39 100.4 100.41100.42100.43100.44100,45
Mean tnctir'at_on (Deg)
Figure 12a. A/I Drift From the Sun Une at Specified MLTs: 1200-kmSun-Synchronous Orbit at 06:00 and 12:00 LST
7185
_" 7175-
:_ 7170"
//?
I,Mi°_ i
716598.55 98.56 98.57 98.58 98.59 98,6 98.61 98.62 98.63 98.64 98.65
Mean Inc_ina_)n (De<j)
Figure 12b. A/I Drift From the Sun Une at Specified MLTs: 800-kmSun-Synchronous Orbit at 09:00 and 12:00 LST
6880 i _ ! !_
6870- ................................... 4Sun-Synchronous Une! .............--//.-
_ ............!............i............i............i............i--/,-/---i............_ ............i,............!............i............i----__-_....._............
I i i _ :
............i............i............i............_..........:............
.......................i........................'............97.05 97.1 97.15 97.2 9725 97.3 97.35 97.4 97.45
Mean Indinal_n (Deg)
Figure 12¢. A/I Drift From the Sun Line at Specified MLTs: 500-kmSun-Synchronous Orbit at 09:00 LST
189
7250-
70 04 ................ ;................................................... /i ...........................
_ :ii'AMOrbit _ _._ _"i _ iI......................................i7_OOl................!............._ ............17_...........................i.................
:_7,4................i.............-_ ................i_ ............/ ................j..............._"_i_....__ ............
7,_o1................_............_ ................._.................t_ ..........I716o.....t No_o._.QNom,o_ _,M:Dn.I------L..............._.......:......._5o! i/ ! ! =i
98.4 98.5 98.6 98.7 98.8 98.9 99Mean InclinalJon
Figure 13a. Five-Year Altitude and Inclination Drift In NOAA O,P,QAftemoon and Morning Biased Sun-Synchronous Orbits
A
50 : :
f NOAAO.P.Q Afternoon Nominal - yearsO_it MLT Drift I
40.,
30- ............................................................. _- ...........................................
'_: ................_..................i1..............._Z ............................4_ ......!_°_._litIIS _ _...........
-20 I ; i :0 500 1000 1500
Days Elapsed Since Epoch
2000 2500
Figure 13b. Five-Year Mean Local Node Time Drift In the NOAA O,P,QAfternoon Biased Sun-Synchronous Orbits
a 0
-10"z
7
2o i 11O" ------------------_ _----I'-4 .............. ,...... _....................
................ 'iiiiiiiiiiiiiiiiii ;iii -20 ..................... _"................ _................................. .........................
i
i
l NOAA O,P,O Morning Orbit NominaJ MLT Drift - 5 years I_30
0 500 10OO 1500 2000 2500
Days FJapsed S;nce Epoch
Figure 13c. Five-Year Mean Local Node Time Drift In the NOAAO,P,Q Morning Biased Sun-Synchronous Orbits
190