analysis of the impact of croatia's accession to the eu on the agri-food sectors
TRANSCRIPT

+
Report EUR 25835 EN
20 13
BOULANGER Pierre FERRARI Emanuele MICHALEK Jerzy VINYES Cristina
Analysis of the impact of Croatia's accession to the EU on the agri-food sectors
A focus on trade and agricultural policies

European Commission
Joint Research Centre
Institute for Prospective Technological Studies
Contact information
Address: Edificio Expo. c/ Inca Garcilaso, 3. E-41092 Seville (Spain)
E-mail: [email protected]
Tel.: +34 954488318
Fax: +34 954488300
http://ipts.jrc.ec.europa.eu
http://www.jrc.ec.europa.eu
This publication is a JRC Scientific and Policy Report by the Joint Research Centre of the European Commission.
Legal Notice:
Neither the European Commission nor any person acting on behalf of the Commission
is responsible for the use which might be made of this publication.
The views expressed in this publication are the sole responsibility of the authors
and do not necessarily reflect the views of the European Commission.
Europe Direct is a service to help you find answers to your questions about the European Union
Freephone number (*): 00 800 6 7 8 9 10 11
(*) Certain mobile telephone operators do not allow access to 00 800 numbers or these calls may be billed.
A great deal of additional information on the European Union is available on the Internet.
It can be accessed through the Europa server http://europa.eu/.
JRC77246
EUR 25835 EN
ISBN 978-92-79-28779-4 (pdf)
ISSN 1831-9424 (online)
doi:10.2791/79648
Luxembourg: Publications Office of the European Union, 2013
© European Union, 2013
Reproduction is authorised provided the source is acknowledged.
Printed in Spain

Analysis of the impact of Croatia's accession to the EU on the agri-food sectors
A focus on trade and agricultural policies
BOULANGER Pierre FERRARI Emanuele MICHALEK Jerzy VINYES Cristina

2

3
Acknowledgment
This report has been prepared by IPTS scientists from AGRITRADE Action. On-going research aims at further refining the modelling work. Authors acknowledge valuable comments by IPTS Director John Bensted-Smith, AGRILIFE Head of Unit Jacques Delincé, Robert M'Barek, Sophie Hélaine, George Philippidis, John Pycroft, and Guna Salputra. They are also grateful for timely feedback by DG AGRI experts Stephan Hubertus Gay and Doretta Ghinzelli; as well as comments from DG ELARG, DG ECFIN and DG TRADE. This modelling exercise performed in summer 2012 constitutes the first in-house use of MAGNET, Modular Agricultural GeNeral Equilibrium Tool, developed by LEI-WUR. Hans van Meijl, Siemen van Berkum, Aikaterini Kavallari, and Martine Rutten provided helpful suggestions in both modelling strategy and result analysis. Anna Atkinson granted proficient editorial support.

4
Executive Summary
Croatia joined the European Union (EU) on July 1st, 2013. This report assesses the likely effects of this accession on the agricultural and food sectors, and analyses the impact on the EU, Croatia and their main trading partners, such as the Western Balkans and Mercosur countries. It considers both the harmonization of Croatia's trade instruments with those applied in the EU, and the adoption of the Common Agricultural Policy (CAP). The analysis is carried out using MAGNET, a global recursive dynamic CGE model. Results show that Croatia slightly benefits from its accession to the EU with an increase in both GDP and jobs. The impact on the EU-27's GDP is insignificant while in terms of jobs it is slightly positive for the agri-food sectors. Considerable discrepancies in the pattern of protection in the agri-food sectors applied in Croatia and the EU-27 prior to Croatia's EU accession, combined with the differently structured tariffs faced by exports of Croatia and EU-27, suggest a significant potential for trade effects. Total exports of Croatian agricultural products increase by 7.4% and those of food products decrease by 2%. By adopting European trade and agricultural policy, Croatia will face some changes in its production structure. At constant prices, agricultural production benefits (increasing by 1.1%), whereas food production contracts (decreasing by 5.5%). This result sheds some light on competitiveness limitations of the Croatian food processing industry. Croatia will experience strong price effects. As a result, the value of production at real prices decreases in both the agricultural and food processing sectors. The most affected sectors in value are vegetable and fruits, meat of pork and poultry, beverage and tobacco, wheat and other cereals. The sugar sector is especially affected with a sharp decrease in production volume on the one hand, but with an increase in production value at real prices on the other hand. The scope of this report is to model both European trade and agricultural policies. It is worth mentioning that other EU policies such as the structural or cohesion policies, and additional gains resulting from the accession such as a less risky investment environment or a more efficient regulatory framework, are not modelled. Thus outcomes from Croatia's accession presented in this report are not exhaustive and may underestimate the benefits of such an accession.

5
Acknowledgment ........................................................................................................................................ 3 Executive Summary ................................................................................................................................... 4 1. Introduction ........................................................................................................................................ 7 2. Model .................................................................................................................................................. 10 3. Database ............................................................................................................................................ 12 4. Baseline .............................................................................................................................................. 13
4.1 Bilateral tariffs and duties, export taxes and subsidies ................................................. 14 4.2 GDP and population ..................................................................................................................... 14 4.3 Employment ................................................................................................................................... 14 4.4 CAP ..................................................................................................................................................... 15
5. Scenario .................................................................................................................................................. 15
5.1 Cumulative shocks ....................................................................................................................... 16 5.2 Changes in the level and structure of tariffs ...................................................................... 17
6. Results ..................................................................................................................................................... 21
6.1 Trade ................................................................................................................................................. 21 6.2 Production ....................................................................................................................................... 28 6.3 Employment ................................................................................................................................... 31 6.4 GDP ..................................................................................................................................................... 35
7. Concluding remarks ........................................................................................................................... 37 References .................................................................................................................................................. 38 Appendix ..................................................................................................................................................... 39

6
List of Tables Table 1: GDP and population growth rate in baseline (percentage change) ......................... 14
Table 2: Projected allocation of CAP budget in EU-27 (million USD in nominal terms) ... 15
Table 3: Projected allocation of CAP budget in Croatia (million USD in nominal terms) . 16
Table 4: Import tariffs imposed by Croatia in baseline and scenario (percentage change) ............................................................................................................................................................................. 19
Table 5: Import tariffs faced by Croatia in baseline and scenario (percentage change) .. 20
Table 6: Value of EU's imports from Croatia in 2018 (million USD and % change) ........... 21
Table 7: Value of Croatia's imports from EU in 2018 (million USD and % change) ........... 22
Table 8: Value of Exports in 2018 (percentage change) ............................................................... 23
Table 9: Value of Croatia's imports in 2018 (million USD and percentage change) .......... 24
Table 10: Value of EU imports in 2018 (million USD and percentage change) .................... 25
Table 11: Value of Croatia's exports in 2018 (million USD and percentage change) ........ 26
Table 12: Value of EU exports in 2018 (million USD and percentage change) .................... 27
Table 13: Value and volume of production, and change in production prices in Croatia in 2018 (million USD and percentage change) ...................................................................................... 28
Table 14: Value of Production in EU-27 in 2018 (million USD and percentage change) . 29
Table 15: Value of production in Western Balkans, OECD, Mercosur and ROW in 2018 (million USD and percentage change) .................................................................................................. 30
Table 16: Effects on unskilled employment in Croatia in 2018 (million USD, percentage change and absolute change in unskilled full-time unskilled equivalents) ........................... 33
Table 17: Effects on unskilled employment in EU-27 in 2018 (million USD, percentage change and absolute change in unskilled full-time equivalents) ............................................... 34
List of Figures Figure 1: Employment structure in Croatia and the EU in 2007 (percentage) .................... 31
Figure 2: Structure of employment in agri-food sectors in Croatia in 2007 (million USD) ............................................................................................................................................................................. 32
Figure 3: Structure of employment in agri-food sectors in EU in 2007 (million USD) ...... 32
Figure 4: GDP absolute change following Croatia’s accession in 2018 (million USD) ...... 35

7
1. Introduction
Croatia became the 28th member of the European Union (EU) on July 1st, 2013. It was an official candidate, with the full benefits associated with this status, since 2004. As with any other Member State (MS), the agricultural sector and food processing chain have been core issues within the negotiation process. Croatia's trade with the EU has been gradually liberalised through the Stabilisation and Association Agreement (SAA) which entered into force in 2005. Prior to accession, Croatia already benefited from duty-free access to the EU for most of its agricultural exports (with some exceptions, notably for sugar, beef and wine). As the SAA was an asymmetrical trade agreement, EU agricultural exports to Croatia faced border protection that has been removed as of the date of accession. Given that trading blocs are linked through international price systems, trade relations, capital flows, etc., a comprehensive analysis of the economic consequences of Croatia's accession to the EU for the agricultural and food sectors in both regions can be a rather complex and therefore difficult exercise. Harmonisation of Croatia's trade instruments – both tariff and non-tariff measures – with those applied in the EU is expected to affect not only both regions but also their trading partners. Specifically, Croatia’s EU accession necessitates harmonization of trade instruments in the following areas:
1. Abolition of all external tariffs, subsidies and taxes on traded commodities, products and services between Croatia and the EU.
2. Full harmonization of all external tariffs, taxes and subsidies on traded commodities, products and services applied previously by Croatia to its non-EU trading partners – i.e. Western Balkans, OECD (non-EU), Mercosur and Rest of the world (ROW) which includes China, India, Russia, etc. – with those applied by the EU.
3. Adjustment of tariffs, taxes and subsidies previously applied by Croatia's non-EU trading partners – i.e. Western Balkans, OECD (non-EU), Mercosur and ROW – in relation to trade with Croatia to those valid for the EU.
Clearly, with Croatia’s EU accession, some Croatian agricultural sectors will gain via an expansion of trade (through a decrease of trade costs). For example, sectors, which before accession faced some protection on the EU side – e.g. beef – may expand with the abolition of EU tariffs, unless they become restricted by other newly introduced policy measures – e.g. by production quotas in the case of sugar. On the other hand, harmonization of tariffs applied to Croatian exports by non-EU partners with those applied to the EU may lead to an increase of some tariffs faced by Croatian exporters and therefore will reduce some trade flows with non-EU partners (trade reduction). Furthermore, trade diversion effects may occur both for Croatia as well as EU, should

8
imports from more efficient non-EU producers be substituted by imports from less efficiently producing countries within the European Union. 1 As all these adjustments, depending on scale and direction, may affect not only trade but also the level of production, employment, and GDP in Croatia and all involved regions, it is understandable that the net effect of tariff harmonisation can only be derived in a comprehensive empirical analysis. Given the accession, Croatia has to adopt the Common Agricultural Policy (CAP). The scope of this report is to model both common trade policy and CAP. It is worth mentioning that other policies exclusively designed for EU members such as the structural or cohesion policies, and additional gains resulting from the accession such as a less risky investment environment and expected increases of Foreign Direct Investments (FDIs) or a more efficient regulatory framework are not modelled. Thus outcomes from Croatia's accession presented in this report are not exhaustive. There are several studies that assess the impact of Croatia's integration, for example Sosic et al. (2005) or Bussiere et al. (2008), both of which analyse the effects of Croatia's trade integration with the use of a gravity model. The main weakness of these approaches is their incompleteness. Both of them miss the full picture of the impact of Croatia's integration as they do not include the entire economic system for all the regions/trading blocs involved. This is important when examining the overall impact of policy changes on the agri-food sectors, which necessitates consideration not only of direct effects but also of the accompanying impacts throughout the rest of the economy. However, this is feasible with a multi-country computable general equilibrium (CGE) model. Lejour et al. (2009) uses WorldScan, a global CGE model to assess the impacts of Croatia's accession to the EU. They estimate that Croatia’s GDP and consumption would increase by 1.1% and 2.6% respectively. The agriculture and food processing sectors would contract by 1.1% and 3.1% respectively. The main limits of their analysis are however that (i) the data used were from 2001 (the base year that was used to calibrate their model), (ii) the study did not consider the direct impacts of the CAP and other EU funds, and (iii) the sectors were highly aggregated, therefore, the agri-food sectors were not well represented. By contrast to previous studies, our report focuses on the impact on the individual agri-food sectors. Moreover, our study specifically contributes to the analysis by including the CAP budget, with differentiated policy measures (i.e. First pillar and Second pillar disaggregated by 5 different measures) within a CGE context. This is in strong contrast to a number of other studies which assess the impact of Croatia's access to the CAP budget without using any economic modelling tools (such as Kumric et al., 2005 or Möllers et al., 2009).
1 See Viner (1950) for the economic theory of regional integration arrangements (customs unions).

9
Key features of Croatia's economy
The Republic of Croatia is a relatively small country, with a population of 4.4 million (Eurostat 2012). Currently Croatia's GDP is 45000 million Euros (Eurostat 2012), which makes up approximately 0.36% of the EU-27 total. In per capita terms, Croatia's wealth is 60% of the EU-27 average, which is well above the current level of Bulgaria and Romania (around 47%) which accessed the EU in 2007 (Eurostat 2012). Croatia's share of agriculture in GDP is about 5.1% in 2011 (Eurostat 2012). For comparison, the share of agriculture in GDP of the EU-27 amounts to 1.7%. In Croatia, as much as 13.8% of the working population is employed in the agricultural sector while in EU-27 only 4.7% in 2010 (Eurostat 2011). From an agricultural trade perspective, the EU is Croatia's most important trading partner by far, followed by the Western Balkans treated as a single region2 and Brazil. In 2011, the EU accounted for 60% of Croatia’s exports and imports value. By contrast, Croatia captured only 0.5% of both EU exports and imports. Western Balkan countries accounted for about 10% of Croatia’s trade value. In 2008, the main export markets for Croatia’s agricultural and food products were the Western Balkan countries and the EU. The structure of Croatian imports is less concentrated, with Brazil being the main foreign provider of agricultural and food products after the EU. An extension of CAP to Croatia implies substantial EU budgetary transfers. Once it will be fully implemented in 2022, CAP budgetary support for Croatia will reach approximately 995 million USD per year.3 CAP captures about 25% of total EU budget transfers to Croatia in 2013 (European Commission, 2011).4 Furthermore, from 2013 onwards Croatia will benefit from other EU payment appropriations, especially those growth and employment programs, which include structural and cohesion funds of approximately 1900 million USD per year (not modelled in this report). In this report, a global recursive dynamic CGE model, MAGNET (described in the model section), is used to analyse the impacts of Croatia’s accession to the EU on the main macroeconomic variables such as trade, GDP, production and employment in Croatia, the EU and their main trading partners while focusing on the agri-food sectors. The second and third sections of this report present the model and data used for the analysis. Then, the baseline that covers the period 2008-2018 is explained in the fourth section, as well as the scenario performed. Results on agri-food sectors are presented in the sixth section. The last section provides some concluding remarks.
2Western Balkan countries include Albania, Serbia, Bosnia-Herzegovina, Montenegro, FYR Macedonia, and Kosovo. 3 See European Commission (2009) and European Commission (2011). 4US dollar (USD) is the currency of this study and results are provided in 2007 USD. When applied, exchange rate is established at 1 euro = 1.37 USD (average exchange rate for the year 2007).

10
2. Model
The model used to analyse the economic consequences of Croatia’s accession to the EU is Modular Agricultural GeNeral Equilibrium Tool (MAGNET).5 MAGNET is a recursive dynamic CGE model. It is a global (worldwide) economic simulation model that consists of a set of single-country CGE models linked by their trading relationship. The model can be used to study the impact of changes in trade, agricultural and renewable energy policies on international trade, production, consumption, prices and use of production factors around the world. MAGNET is based on the GTAP6 model (Hertel, 1997), a widely used tool for global trade analysis. The behavioural relationships used in MAGNET are standard GTAP: firms maximize profits using technology characterized by Constant Elasticity of Substitution (CES) production functions over primary inputs and Leontief production functions across intermediate inputs. This implies constant returns to scale technology in production. The elasticities of substitution are commodity-specific. Domestic demand is satisfied by composite commodities that are constructed in two stages. In the first stage, consumers decide on the quantity of each commodity in their consumption basket by maximizing a modified Stone-Geary utility function (where all subsistence shares are equal to zero). In the second stage, consumers minimize the cost of their commodity bundle by deciding on the shares of domestic and imported varieties that comprise each commodity. This decision is governed by an Armington import aggregation function. All commodity and activity taxes are expressed as ad valorem tax rates, while income taxes depend on household income. The price systems are linearly homogenous and thus only changes in relative prices matter. Consequently, the model has a global numeraire (world price index of primary factors), which is a benchmark of value against which changes in all other prices can be measured. All tax rates, including import tariffs, are modelled as ad valorem rates. This means that specific tariffs have to be converted to their ad valorem equivalent. Prices and quantities of all non-endowment commodities and regional incomes are endogenous variables. In general, closure rules adopted in this version of MAGNET follow the modified standard neo-classical assumptions, namely:
1. There is a fix rate of savings and the investment variable is savings-driven so that investment is forced to adjust in line with regional changes in savings.
2. The current account surplus is fixed on a regional basis, so that each region's share in the global pool of net savings is fixed.
5 MAGNET is part of the integrated Modelling Platform for Agro-economic Commodity and Policy Analysis (iMAP) hosted by the European Commission’s Joint Research Centre, Institute for Prospective Technological Studies (M'barek et al., 2012). 6 Global Trade Analysis Project, see https://www.gtap.agecon.purdue.edu/

11
3. Stocks of factors of production, skilled labour, capital and land, are exogenously given in the base year while unskilled labour is endogenously determined to allow for unemployment.
3.1. Capital is updated at the end of each period with the investment taking
place within the period minus the depreciation of the existing stock, following the usual recursive dynamic approach.
3.2. The stock of skilled labour grows in the baseline and simulation period following the population growth rate.
3.3. Skilled labour and capital are fully mobile between sectors in the same region and fully employed in all regions (wages for skilled labour and return of capital are endogenously determined, i.e. they are allowed to vary to assure that the sum of demands from all activities equals the quantity supplied).
3.4. Unskilled labour is not fully employed but is assumed to be fully mobile between sectors in the same region. For the unskilled labour real wages are exogenously fixed while the supply of unskilled labour is endogenous and adjusts so as to equate labour demand. In the EU and OECD wages for unskilled labour are fixed at their initial level while for the other regions they grow at the GDP growth rate. Both types of labour are immobile between countries (immigration is not modelled).
3.5. Land is fully employed, but its ability to freely move between sectors (imperfect mobile factors are usually called sluggish in GTAP-based models) is limited by the introduction of a CET function, which transforms one use of the endowment into another. Contrary to labour and capital, sluggish endowment commodities can exhibit differential equilibrium rental rates across uses. Land is by definition immobile between regions.
4. Technical change is exogenous to the model.
An innovative feature of MAGNET is its modular structure. MAGNET was extended in different directions with the use of various sub-modules, which can be switched on and off. This allows tailoring of the model structure to the research question at hand. For example, MAGNET has a module that can be applied to analyse land use which includes a sophisticated land supply function, and it also has a biofuel module which allows for a detailed analysis of this sector with the inclusion of by-products. Of particular interest, for this report, is the CAP module which allows the inclusion of a CAP budget (i.e. Croatia will receive 788 million USD in 2018, see Table 3). It is worth mentioning that we focus on agricultural and rural development expenditures and not on the contribution side of the CAP budget. Effects of transferring financial resources between EU-28 and related budgetary trade-offs are not taken into account. In this report the CAP budget is defined by the sum of first and second pillar payments. Decoupling of factor subsidies is handled in such a way that first pillar subsidies are linked to land (broad definition of decoupled payments), and the same is done for the agri-environmental payments of the second pillar, as they are considered subsidies to land (similar assumptions were set in the Scenar 2020 II study using LEITAP (Nowicki et al., 2009)). The other four second pillar measures are assumed to increase the overall

12
productivity (e.g. output augmenting technological change) and the input productivity (intermediate input augmenting technological change). The increase depends interalia on four coefficients which are determined exogenously (the latter are borrowed from Nowicki et al., 2009) and capture the technology effects of the types of second pillar subsidies which have already been defined. In order to reflect sugar policies, we impose a sugar production quota for the EU and Croatia which is modelled by fixing the sugar production volume in these two regions/countries and endogenizing the tax on the production of sugar.
3. Database
The data used in this study are based on the most recent GTAP database version 8 (Aguiar et al., 2012) released in March 2012 and contains data for 20077. This database contains complete bilateral trade information, transport and protection linkages. It includes 57 commodities and 129 regions, aggregated for the purpose of this study to 22 commodities of which 20 are part of the agricultural and food sectors (Appendix, Table A1) and 6 regions (Appendix, Table A2). The EU-27 and Croatia have been specified separately, as have their main trading partners, i.e. Western Balkans, non-EU-OECD countries, Mercosur and the rest of the world. Furthermore, each region's economy was disaggregated according to nine accounts8. In order to construct a baseline, projections of GDP, population and other key indicators are used and obtained from various sources. First, data on GDP and population are sourced from the USDA-ERS projections9. Projections by the World Development Indicators (WDI) are the main source of data for labour force. Last, data for capital stock projections are taken from the OECD10. The following types of CAP support are distinguished within MAGNET: (i) First pillar measures which include Single Farm Payments (SFPs), other direct payments and market measures, (ii) Investment in agriculture, (iii) Investment in human capacity, (iv) Investment in technology, (v) Support to Less Favoured Areas (LFAs), and (vi) Agri-environmental measures. Data used in the CAP module come on the one hand from the European Agricultural Guarantee Fund for first pillar measures, and on the other hand from the European Agricultural Fund for Rural Development for second pillar measures. For second pillar measures, both European and national contributions are taken into account. Data for Croatia come from the IPARD Programme 2007-2013 and financial package for the accession negotiations (European Commission, 2009a).
7 The database documentation for GTAP8 is not yet fully available at the date of writing this report. Documentation of database GTAP 7 is available in Narayanan and Walmsley (2008). 8Activities, intermediate inputs, factors, households (regional and private), government, savings & investment, taxes, margins (trade costs and transport), and rest-of-the-world (trade, transfers, etc.). 9http://www.ers.usda.gov/Data/Macroeconomics/#BaselineMacroTables
10http://www.oecd.org/home/0,2987,en_2649_201185_1_1_1_1_1,00.html

13
4. Baseline
One of the crucial aspects in any analysis of policy impacts (both at micro- as well as at macro-levels) is an appropriate modelling of the baseline (reference scenario). Given that the EU, Croatia and their main trading partners are linked through international price systems, trade relations, capital flows, etc., the baseline should, as closely as possible, reflect the expected changes in the global economy between 2007 (base year) and the period at which the anticipated results of a given policy scenario are expected to occur, all these without harmonization of Croatian and EU policies. As this study is interested in an analysis of impacts over the 5-year period after Croatia's accession on July 1st, 2013, a cut-off time for our analysis is the year 2018 and our baseline covers the period 2008-2018. In MAGNET, similarly to in other recursive dynamic CGE models, important key macro-economic variables are modelled exogenously11, i.e. GDP projections, population growth, etc. Because some statistical data for those variables was available for a period beyond the base year, i.e. years 2008-2010, the whole baseline period (2008-2018) was divided into three sub-periods:
1. 2008-2010 in which statistical data are available on GDP, population and capital stock – for all regions modelled. These data already reflect the outbreak of the global economic and financial crisis which started in this period;
2. 2010-2014 in which some preliminary data (until 2012) and short-term forecasts (e.g. post-crises GDP) were utilized;
3. 2014-2018 (after Croatia's accession) in which the most recent external
projections of further development of the main trading blocs were used (see: sub-section GDP and population, below).
Furthermore, to reflect the most recent developments of EU trade policies in the baseline we (i) updated the level and the structure of EU-27 policy instruments (i.e. model exogenously determined variables) from 2007 to those observable in sub-period 2008-2010, and (ii) made additional assumptions concerning further developments of specific policy instruments that are not directly related to Croatia’s EU accession (e.g. abolition of EU export subsidies applied to trade with third countries, continuation of sugar quota, abolishment of milk quota) – for sub-periods 2010-2014 and 2014-2018. Other important assumptions concerning the baseline were those which reflect changes in the EU-27 budget in the years 2008-2018 (see below).
11 In order to obtain policy results, which include GDP as one of the model’s endogenous variables, two further steps were needed. First, projections of GDP growth were translated into the growth of technological progress (the latter was endogenously calculated by the model for all three sub-periods). Second, given calculated rates of technological progress from the first step (now considered exogenous) the values for GDP growth were endogenously generated by the model separately for the baseline and policy scenarios.

14
4.1 Bilateral tariffs and duties, export taxes and subsidies
In the baseline, concerning the main policy instruments applied in bilateral trade relations between the EU, Croatia and third countries, it was assumed that the level and structure of tariffs and taxes imposed by all parties on imports of selected agricultural products in 2007 will prevail over the period of 2008-2018. On the other hand, the export subsidies and equivalent measures provided by the EU and OECD in 2007were assumed to be abolished in the period 2014-2018.
4.2 GDP and population
Basic assumptions concerning the real and projected rate of GDP and population growth for the EU, Croatia and their main trading partners in the periods 2007-2010, 2010-2014 and 2014-2018 are shown in Table 1. Table 1: GDP and population growth rate in baseline (percentage change)
GDP Population 2007/10 2010/14 2014/18 2007/10 2010/14 2014/18
EU -2.2 7.1 8.5 0.9 0.8 0.7 Croatia -5.1 11.5 15.7 -0.1 -0.4 -0.6 OECD -0.1 9.4 10.3 2.3 2.9 2.7 Western Balkans 13.3 17.5 19.4 -1.9 -1.7 -1.6 Mercosur 13.4 19.8 18.7 3.6 4.4. 3.9 ROW 17.5 28.4 26.9 3.9 5.1. 4.8 Source: USDA-ERS, and WDI
As shown in Table 1, the GDP in the EU, OECD countries and Croatia between 2007 and 2010 decreases due to the current economic crisis. According to projections, the GDP should recover during the rest of the baseline period. The Croatian GDP annual growth rate between 2010 and 2018 is projected to be approximately 70% higher than the EU annual growth rate reflecting the tendency for middle income countries to catch up with the more developed countries in the EU. Croatia’s population is projected to shrink in the same period, causing GDP per capita to increase even more compared to the rest of the EU.
4.3 Employment
The GTAP database contains detailed information about the structure of employment per activity (unskilled and skilled labour) and region in the base year 2007 (in value terms). In our baseline, the total level of labour supply in each region is linked directly to the share of the workforce in total population (fixed shares are applied). Allocation of total employment among individual sectors is generated by the model (employment by activity/sector of unskilled and skilled labour is an endogenous variable). As real wages of unskilled labour are fixed exogenously, an unskilled labour is allowed to be not fully employed.

15
4.4 CAP
For the purpose of this study we used data on the EU-27 budget allocation between 2008 and 2011, as well as forecasts for the CAP in 2014-2020 financial framework and CAP reform proposals. It is assumed that the shares of CAP expenditures within the first pillar (SFPs, other direct payments and market measures), and the allocation of second pillar measures across various types of support programmed for the period 2007-2013 will remain unchanged until 2018. Both European and Member States' financial contributions are taken into account for second pillar measures (Table 2).
Table 2: Projected allocation of CAP budget in EU-27 (million USD in nominal terms)
2010 2013 2018
Pillar 1 59421.7 62987.1 63266.6
Pillar 2
Investment in agriculture 7247.9 7818.4 7818.4
Investment in human capacity 2920.3 3150.2 3150.2
Wider rural development 5862.0 6323.5 6323.5
LFAs 4408.4 4755.4 4755.4
Agri-environmental measures 9351.5 10087.6 10087.6
Total 84803.5 90366.8 90646.3
Note: See Table 3 for projected allocation of CAP budget in Croatia. Source: authors' calculations on the basis of EAGF Financial Report (2008 financial year), financial plans per Member State for the programming period 2007-2013 as reported by EAFRD, and the MFF proposals and the CAP reform proposals presented in COM(2011) 628 final/2.
Beyond the CAP budget, special attention has been paid to the sugar quota applied in the EU-27. It was assumed that the EU-27 quota for sugar which in 2006/2007 amounted to 17,594,327 tonnes (16,907,591 tonnes for sugar and 686,736 for isoglucose, as reported in European Commission (2009b)) will be reduced by 2015 to 12,735,000 tonnes (-28% approximately) and thereafter (2015-2018) will stay at the same level.
5. Scenario
The policy scenario was constructed by assuming that Croatia’s accession to the EU takes place in 2013 and effects are assessed for the year 2018. All policy results presented in this report are obtained by comparing the effect of policy shocks (Croatia's EU accession) with the derived baseline on selected variables, i.e. exports, imports, production, etc. in the EU, Croatia and their main trading partners i.e. Western Balkans, OECD, Mercosur and ROW (i.e. China, India, Russia…).

16
5.1 Cumulative shocks
The following shocks are run simultaneously.
1. Abolition of all external tariffs, subsidies and taxes on traded commodities, products and services between Croatia and the EU.
2. Full harmonization of all external tariffs, taxes and subsidies on traded commodities, products and services applied previously by Croatia to its non-EU trading partners – i.e. Western Balkans, OECD, Mercosur and ROW – with those applied by the EU.
3. Adjustment of tariffs, taxes and subsidies previously applied by Croatia's non-EU trading partners – i.e. Western Balkans, OECD, Mercosur and ROW – in relation to trade with Croatia to those valid for the EU.
4. Allocation of the CAP budget to Croatian agri-food sectors according to the
accession financial package as agreed in 2009. The breakdown of rural development measures for the period 2011-2018 remains the same as for the period 2007-2010. Both European and Croatian financial contributions are taken into account (Table 3).
Table 3: Projected allocation of CAP budget in Croatia (million USD in nominal terms) 2010 2013 2018
Pillar 1 0.0 127.8 306.6
Pillar 2
Investment in agriculture 8.7 92.5 115.7
Investment in human capacity 15.2 161.0 201.3
Wider rural development 12.0 127.3 159.1
LFAs ns ns ns
Agri-environmental measures 0.5 4.9 6.1
Total 36.3 513.4 788.8
Source: authors' calculations on the basis of the IPARD Programme 2007-2013 for Croatia, and financial package for the accession negotiations (European Commission, 2009a).
5. Sugar quota in Croatia
The European sugar regime is currently experiencing significant reforms, especially with the present production quota system that will expire in 2014/2015. Consequently, it was assumed that upon EU accession (in 2013) Croatia’s level of sugar production (230,000 tonnes in 2007) will be reduced by 16% (in order to meet the sugar quota 192,877 tonnes). This amount was agreed during the accession negotiations with Croatia (European Commission, 2009a). We also assumed that in consequent periods (until 2018) the sugar quota in Croatia would remain at this level.

17
5.2 Changes in the level and structure of tariffs
The analysis of bilateral protection levels applied between the EU and Croatia shows that in 2007 most of Croatia’s agricultural products could enter the EU market at zero or very low tariffs (Table 5). Major exceptions to this are: “beverages and tobacco” with an applied tariff rate of 1.2%, “cattle meat” with a tariff rate of 2.1%, and “sugar” which faced a skyrocketing ad valorem protection of 106%.12 By contrast, the level of tariff protection applied by Croatia to imports from the EU was in general much higher than those applied by the EU to Croatian products (Table 4 & Table 5). The differences in the bilateral tariffs applied on imports of livestock and meat products were especially striking, e.g. live cattle, sheep and goats from the EU could enter the Croatian market at a high tariff rate of 20.3%, pork meat and poultry at 30.0%, cattle meat at 15.2%, dairy products at 16.6%, beverages and tobacco at 11.6%, vegetable and fruits at 9.5%, while the same products could be exported from Croatia to the EU almost duty free. Sugar exports from the EU-27 to Croatia faced an ad valorem protection tariff of approximately 22%. Data also show that the level and structure of tariffs applied in Croatia on agri-food imports from third countries in 2007 were very different from those applied by the EU, which implies some trade creation and diversion effects. This was especially true in the case of Western Balkan countries (one of Croatia’s main trading partners) where many agricultural products could enter Croatian markets at almost zero or a very low tariff rate (Table 4, Western Balkans column). For example, the EU tariff rate on imports of cattle, sheep and goat meat from the Western Balkans was set to 12.0%, while the same products could enter Croatian markets at zero tariffs. The levels of protection of wheat and other cereals imported by Croatia from the Western Balkans were also lower than EU levels. In the case of sugar imports from the Western Balkans, the differences were even higher; in the EU, out-of-quota tariffs for sugar from the Western Balkans were set to 120% while sugar imports from the Western Balkans to Croatia were duty free. In contrast, some of the tariffs applied to other agricultural imports, e.g. fruits and vegetables, from the Western Balkans were much higher in Croatia (13.7%) than in the EU (1.0%). A similar picture arises when comparing the structure and level of tariffs applied by Croatia and the EU to OECD countries on agricultural imports. Here, the biggest differences concern products such as rice (22.3% in the EU vs. 2.0% in Croatia), dairy products (37.6% in the EU vs. 22.2% in Croatia) or plant-based fibres (36.4% in the EU vs. duty free in Croatia) (Table 4, OECD column). Even bigger discrepancies could be observed between the pattern of tariff protection applied by the EU and Croatia for agricultural imports originating from the rest of the world such as for rice (10.1% in the EU vs. 1.4% in Croatia), milled rice (24.8% in the EU vs. 1.8% in Croatia), sugar (67.4% in the EU vs. 43.5% in Croatia), wheat (8.1% in the EU vs. 0.1% in Croatia), dairy
12 Sugar trade remains highly distorted. Exports from Western Balkan countries benefit from preferential access to the EU through tariff rate quotas (TRQs) mainly filled by Croatia and Serbia. One may bear in mind that TRQs replace duty-free access for Croatian exports of sugar to the EU since January 1st 2007.

18
products (9.2% in the EU vs. 0.9% in Croatia) and cattle, sheep and goat meat (9% in the EU vs. duty free in Croatia) (Table 4, ROW column). Tariffs in the EU on primary agricultural sectors are generally either low or close to the previous tariff imposed by Croatia. In the food sector, after the accession, there are significant trade diversion effects as Croatia imposes a higher tariff on beef coming from Mercosur and ROW, and a higher tariff on pork and poultry meat and dairy products from the OECD countries and ROW. After the enlargement, Croatia imposes higher tariffs on sugar cane and beet originating from other regions, i.e. OECD and Mercosur (Table 4). For raw sugar, the increases in tariff that Croatia imposes on its trading partners are significant; they are most noticeable for Western Balkans and Mercosur where they reach up to 136% (Table 4). Lastly, tariffs imposed by Croatia on manufactured goods change slightly after the accession (a small increase for OECD and a slight decrease for Mercosur and ROW). Now, turning to import tariffs faced by Croatia (Table 5), can be seen that after the accession, Croatian goods face a generally increased level of tariffs to enter OECD, Mercosur and ROW. This increase is significant for primary agricultural goods, food and, to a lesser extent, manufactured goods, for which Croatia used to enjoy free access. For example, with Croatia’s accession it will face much higher import tariffs for cereals and live cattle from the OECD members (Table 5, OECD column). In the same way, Croatia will face higher import tariffs for wool coming from ROW (Table 5, ROW column). There are considerable discrepancies in the pattern of protection in the agri-food sectors applied in Croatia and the EU-27 prior to Croatia's EU accession. These, combined with different tariffs applied to Croatian and EU exports by their trading partners, suggests significant potential for trade creation and diversion effects in Croatia after EU accession.

19
Table 4: Import tariffs imposed by Croatia in baseline and scenario (percentage change) EU Western Balkans OECD Mercosur ROW
Base. Scen. Base. Scen. % Base. Scen. % Base. Scen. % Base. Scen. % Rice 0.0 0.0 0.0 0.0 2.0 22.3 1015.1 0.0 19.0 1.4 10.1 607.7 Wheat 5.9 0.0 0.0 12.1 0.0 5.7 0.0 10.2 0.1 8.1 7127.4 Other cereals 4.6 0.0 9.6 25.3 163.7 6.4 3.0 -53.2 9.7 3.3 -65.9 6.5 6.1 -5.5 Vegetables, fruits 9.5 0.0 13.7 1.0 -92.4 11.6 4.0 -65.8 10.9 12.5 14.6 8.5 7.0 -16.8 Oilseeds 0.0 0.0 0.0 0.0 0.0 0.0 0.0 0.0 0.0 0.0 Sugar cane, sugar beet
10.0 0.0 0.0 0.0 0.0 36.4 0.0 5.0 8.1 0.4 -95.4
Plant-based fibres 0.0 0.0 0.0 0.0 0.0 0.0 0.0 0.0 0.0 0.0 Other crops 4.3 0.0 4.5 0.0 -100.5 4.0 5.3 31.6 2.3 2.8 23.0 2.8 0.3 -88.2 Live cattle, sheep, goats, horses
20.3 0.0 0.0 0.0 0.0 4.6 0.0 4.4 0.2 1.1 343.6
Live pigs, poultry, other animals
2.6 0.0 0.4 0.2 -42.0 3.3 2.3 -30.9 4.0 7.3 79.6 1.4 0.8 -41.2
Raw milk 0.0 0.0 0.0 0.0 0.0 0.0 0.0 0.0 0.0 0.0 Wool, silk-worm cocoons
0.0 0.0 0.0 0.0 0.0 0.0 0.0 0.0 0.0 0.0
Meat beef, sheep, goat, horse
15.2 0.0 0.0 12.0 23.5 14.5 -38.4 28.1 84.4 200.7 0.0 9.0
Meat pork, poultry, other
30.0 0.0 0.0 0.1 18.9 22.6 19.8 28.1 24.4 -13.0 3.4 13.5 292.2
Vegetable oils and fats
9.6 0.0 0.0 0.3 25.1 7.8 -68.8 0.2 0.7 287.0 2.8 8.4 198.0
Dairy products 16.6 0.0 0.0 0.1 22.2 37.6 69.2 36.5 8.8 -76.0 0.9 9.2 943.2 Milled Rice 0.0 0.0 0.0 0.0 0.5 23.0 4353.9 0.0 33.0 1.8 24.8 1242.5 Sugar 22.3 0.0 0.0 133.8 25.0 29.6 18.6 37.9 136.5 260.2 43.5 67.4 54.8 Other food Products 9.8 0.0 0.0 9.6 9.5 6.9 -27.7 11.4 14.6 27.7 6.5 6.7 3.2 Beverages and tobacco
11.6 0.0 0.0 10.5 12.9 4.8 -62.5 29.9 19.1 -36.3 11.9 6.9 -41.8
Source: GTAP database v. 8 for baseline and authors' calculation for scenario

20
Table 5: Import tariffs faced by Croatia in baseline and scenario (percentage change)
EU Western Balkans OECD Mercosur ROW Base. Scen. Base. Scen. % Base. Scen. % Base. Scen. % Base. Scen. %
Rice 0.0 0.0 0.0 1.4 0.0 3.0 0.0 9.3 0.0 32.8 Wheat 0.0 0.0 0.0 1.6 10.7 66.1 517.8 0.0 0.1 0.6 16.9 2698.0 Other cereals 0.0 0.0 0.0 2.1 0.2 44.9 18004.8 0.0 0.8 5.4 9.4 74.8 Vegetables, fruits 0.0 0.0 6.2 9.7 55.3 6.5 20.4 214.8 0.0 9.3 1.0 13.1 1159.6 Oilseeds 0.0 0.0 0.0 6.8 2.2 4.1 88.5 0.0 4.0 0.6 9.0 1384.2 Sugar cane, sugar beet
0.0 0.0 0.0 0.0 0.0 59.8 0.0 0.0 0.0 9.3
Plant-based fibres 0.0 0.0 0.0 1.1 0.0 0.0 0.0 0.2 0.0 2.1 Other crops 0.0 0.0 0.0 4.9 4.9 14.1 188.3 13.9 4.8 -65.4 2.8 8.1 194.9 Live cattle, sheep, goats, horses
0.6 0.0 0.0 9.2 0.0 4.1 0.0 1.4 0.0 2.4
Live pigs, poultry, other animals
0.0 0.0 0.0 3.2 1.3 16.9 1241.3 2.6 5.4 110.9 0.2 6.3 2621.0
Raw milk 0.0 0.0 0.0 0.0 0.0 0.0 0.0 0.0 0.0 0.0 Wool, silk-worm cocoons
0.0 0.0 0.0 0.0 0.0 0.8 0.0 8.0 0.1 31.2 26118.5
Meat beef, sheep, goat, horse
2.1 0.0 0.0 11.8 0.0 122.0 0.0 5.1 0.2 14.3 6875.6
Meat pork, poultry, other
0.0 0.0 0.0 15.2 7.0 37.2 430.7 0.0 9.0 25.2 22.7 -9.9
Vegetable oils and fats
0.0 0.0 0.0 1.8 5.1 6.5 28.5 0.0 10.4 0.8 12.9 1551.7
Dairy products 0.1 0.0 5.3 9.9 86.1 22.3 41.5 86.1 0.0 19.6 5.2 13.1 152.9 Milled Rice 0.0 0.0 0.0 1.5 0.0 21.1 0.0 10.6 0.0 88.8 Sugar 106.0 0.0 0.0 3.7 29.4 20.5 -30.3 0.0 4.5 6.9 16.1 132.3 Other food Products 0.7 0.0 0.5 7.4 1441.7 6.3 13.4 114.1 10.2 10.9 6.9 3.7 13.8 276.0 Beverages and tobacco
1.2 0.0 1.0 7.4 647.2 2.8 4.9 70.8 13.7 18.8 37.2 5.3 33.8 543.8
Source: GTAP database v. 8 for baseline and authors' calculation for scenario

21
6. Results
6.1 Trade
Our results show that Croatia's EU accession affects significantly Croatia’s exports of primary agricultural and food products to the EU (Table 6). Table 6: Value of EU's imports from Croatia in 2018 (million USD and % change) From Croatia Total
Baseline Scenario Diff. % Baseline Scenario Diff. %
Rice 0.0 0.0 0.0 485.0 486.0 1.0 0.2
Wheat 46.7 82.8 36.1 77.3 6,625.0 6635.0 10.0 0.2
Other cereals 5.0 5.7 0.7 13.9 7,970.0 7971.0 1.0 0.0
Vegetables, fruits 72.4 87.7 15.3 21.1 44,954.0 44953.0 -1.0 0.0
Oilseeds 11.4 15.1 3.7 32.5 7,080.0 7084.0 4.0 0.1
Sugar cane, sugar beet
0.3 0.7 0.4 121.4 65.1 65.2 0.1 0.2
Plant-based fibres
16.2 18.1 1.9 11.7 835.0 835.0 0.0 0.0
Other crops 15.9 20.0 4.1 25.8 22,231.0 22236.0 5.0 0.0
Live cattle, sheep, goats, horses
20.3 23.9 3.6 17.7 3,463.0 3467.0 4.0 0.1
Live pigs, poultry, other animals
54.5 60.0 5.5 10.1 8,684.0 8690.0 6.0 0.1
Raw milk 44.3 56.0 11.7 26.4 152.0 154.0 2.0 1.3
Wool, silk-worm cocoons
18.3 32.2 13.9 76.0 926.0 925.0 -1.0 -0.1
Agriculture 305.3 402.2 96.9 31.7 103470.1 103501.2 31.1 0.0
Meat beef, sheep, goat, horse
38.0 50.8 12.8 33.7 17269.0 17295.0 26.0 0.2
Meat pork, poultry, other
66.8 85.4 18.6 27.8 30584.0 30601.0 17.0 0.1
Vegetable oils and fats
16.9 18.1 1.2 7.1 19076.0 19077.0 1.0 0.0
Dairy products 53.5 56.3 2.8 5.2 32092.0 32125.0 33.0 0.1
Milled Rice 0.1 0.1 0.0 3.7 1380.0 1380.0 0.0 0.0
Sugar 533.0 304.0 -229.0 -43.0 9710.0 9753.0 43.0 0.4
Other food Products
156.0 164.0 8.0 5.1 121793.0 121803.0 10.0 0.0
Beverages and tobacco
78.2 78.2 0.0 0.0 44722.0 44717.0 -5.0 0.0
Food 942.5 756.9 -185.6 -19.7 276626 276751 125 0.0
Whole economy 11903 12312 409.0 3.4 5448234 5447548 -686 0.0
Source: MAGNET results
The sectors which witness the greatest positive export growth are wheat (36 million USD), vegetables and fruit (15 million USD), beef (12.8 million USD) and other meat (18.6 million USD). Interestingly, an increase in EU imports of wheat, vegetables and fruit and other meat from Croatia is not due to changes in bilateral tariffs between the EU and Croatia which were already zero, but due to trade diversion effects from different destinations (OECD, ROW or Western Balkans) to the EU (tariffs faced by Croatia in those countries after the EU accession are higher than before). In the case of beef which was protected by the EU prior to accession of Croatia, the result is a

22
combination of increased market access for Croatia and a redirection of Croatian trade. The Croatian beef sector loses 8.5 million USD of exports towards OECD countries and the ROW (Table 11) due to harmonization of tariffs towards third trade partners (trade diversion effect). While Croatia's agricultural sector increases its exports to the EU by 31.7% (96.9 million USD) the food sector decreases its EU exports by 19.7% (185.6 million USD). This decrease is driven by the sugar sector, whose exports to the EU fall by 43% (229.0 million USD). The introduction of the sugar production quota in Croatia causes production to fall hence the negative performance in exports. The situation is different when analysing Croatia’s imports from the EU (Table 7). Table 7: Value of Croatia's imports from EU in 2018 (million USD and % change)
From the EU Total Imports Baseline Scenario Diff. % Baseline Scenario Diff. %
Rice 0.4 0.5 0.0 9.7 0.5 0.5 0.0 0.0 Wheat 0.4 0.4 0.0 -7.0 0.5 0.4 -0.1 -20.0 Other cereals 38.4 34.3 -4.1 -10.7 48.7 43.6 -5.1 -10.5 Vegetables, fruits 116.0 110.0 -6.0 -5.2 172.0 157.0 -15.0 -8.7 Oilseeds 14.7 12.1 -2.6 -17.7 17.6 14.4 -3.2 -18.2 Sugar cane, sugar beet
7.1 6.0 -1.1 -16.0 9.2 7.6 -1.6 -17.7
Plant-based fibres
0.5 0.5 0.0 -4.9 1.9 1.8 -0.1 -4.8
Other crops 76.3 72.9 -3.4 -4.5 102.0 92.7 -9.3 -9.1 Live cattle, sheep, goats
115.0 122.0 7.0 6.1 116.0 122.0 6.0 5.2
Live pigs, poultry, other
65.2 61.6 -3.6 -5.5 78.9 74.2 -4.7 -6.0
Raw milk 0.1 0.0 0.0 -16.4 0.2 0.2 0.0 -15.5 Wool, silk-worm cocoons
0.0 0.0 0.0 -25.0 0.3 0.2 -0.1 -24.8
Agriculture 434.2 420.3 -13.9 -3.2 547.8 514.6 -33.2 -6.1 Meat beef, sheep, goat
10.4 22.0 11.6 111.5 40.0 31.6 -8.4 -21.0
Meat pork, poultry, other
133.0 254.0 121.0 91.0 176.0 268.0 92.0 52.3
Vegetable oils and fats
21.6 34.3 12.7 58.8 80.5 78.8 -1.7 -2.1
Dairy products 82.6 112.0 29.4 35.6 128.0 144.0 16.0 12.5 Milled Rice 4.7 5.5 0.9 18.3 8.5 7.5 -1.0 -12.0 Sugar 2.5 52.4 49.9 1971.1 130.0 212.0 82.0 63.1 Other food Products
596.0 636.0 40.0 6.7 826.0 822.0 -4.0 -0.5
Beverages and tobacco
153.0 157.0 4.0 2.6 196.0 198.0 2.0 1.0
Food 1003.8 1273.2 269.4 26.8 1585.0 1761.9 176.9 11.2 Whole economy 18288.0 16163.0 -2125.0 -11.6 30034.0 30439.0 405.0 1.3 Source: MAGNET results
Croatian imports of primary agricultural products fall by 14 million USD (-3.2%). The greatest decreases are found in the following sectors: other cereals, vegetables and fruits, oilseeds and live pigs and poultry. While agricultural imports decrease, Croatia imports of food products increase by 270 million USD (26.8%). The value of Croatian imports of cattle, sheep and goat meat from the EU increase by 11.6%, and of dairy imports by 29.4%. The products that were facing the highest protection before the

23
accession are those for which imports increase the most, e.g. Croatia was levying a tariff of 30% on pork and poultry from the EU, and after the accession Croatia's imports of these products from the EU increase by 91% (Table 7). Looking at Croatia's total imports at the aggregated level, it appears that some sectors are more affected than others. While Croatia’s accession to the EU causes an abolition of Croatian protection for imports coming from the EU, it generally leads to an increase in protection of Croatian agricultural and food sectors for imports coming from third countries. These two elements result in a drop in total agricultural imports of 6.1%, and an increase in total imports of food products of 11.2% (Table 7). After the accession to the EU, total exports of Croatian agricultural products increase by about 7.4% (Table 8). At the same time total Croatian food exports decrease by about 2.2%. Clearly, Croatia is confronted with a different rate of protection of agri-food products than it was before accession. Looking at other trading blocks, Croatia's accession to the EU does not have significant impacts on those regions in terms of percentage change in exports. Looking at table 8, one could mention raw milk but, the quantities exported are very small. In the EU-27, the value of sugar exports experiences the highest increase mostly because of the introduction of the sugar production quota in Croatia, and the increase in production market prices (see below). Table 8: Value of Exports in 2018 (percentage change)
EU Croatia Western Balkans
OECD Mercosur ROW
Rice 0.43 -79.31 0.08 0.00 0.00 Wheat -0.09 -6.56 0.00 0.06 0.05 0.04 Other cereals -0.01 -0.63 0.00 0.00 0.02 0.00 Vegetables, fruits 0.02 3.28 0.00 0.00 -0.04 -0.03 Oilseeds -0.09 0.00 0.00 -0.01 0.02 0.00 Sugar cane, sugar beet -0.97 55.02 -0.27 0.00 -0.14 -1.76 Plant-based fibres 0.00 9.31 0.00 0.01 0.14 -0.02 Other crops 0.01 9.13 0.39 0.00 0.00 -0.03 Live cattle, sheep, goats 0.54 21.24 -0.16 -0.03 -0.28 -0.12 Live pigs, poultry, other -0.01 2.14 0.00 0.01 0.00 0.00 Raw milk -6.98 29.56 -5.48 -5.56 -5.41 -5.91 Wool, silk-worm cocoons -0.40 35.97 -0.52 -0.09 -0.79 -1.14
Agriculture 0.02 7.44 -0.13 0.01 0.01 -0.05 Meat beef, sheep, goat 0.64 9.76 0.00 -0.01 -0.25 -0.13 Meat pork, poultry, other 0.63 36.63 -0.86 -0.06 -0.17 -0.20 Vegetable oils and fats 0.21 -19.22 -0.13 0.02 0.02 -0.05 Dairy products 0.27 3.89 0.00 -0.03 0.52 -0.26 Milled Rice 0.31 -48.65 0.00 0.00 0.00 -0.02 Sugar 3.10 26.70 0.66 0.41 -0.22 1.41 Other food Products 0.15 -13.17 0.00 0.00 -0.04 -0.04 Beverages and tobacco 0.07 -29.01 0.58 0.04 0.03 0.09
Food 0.24 -2.19 0.23 0.00 -0.07 0.02 Whole economy 0.00 0.07 -0.05 0.00 0.00 0.01
Source: MAGNET results
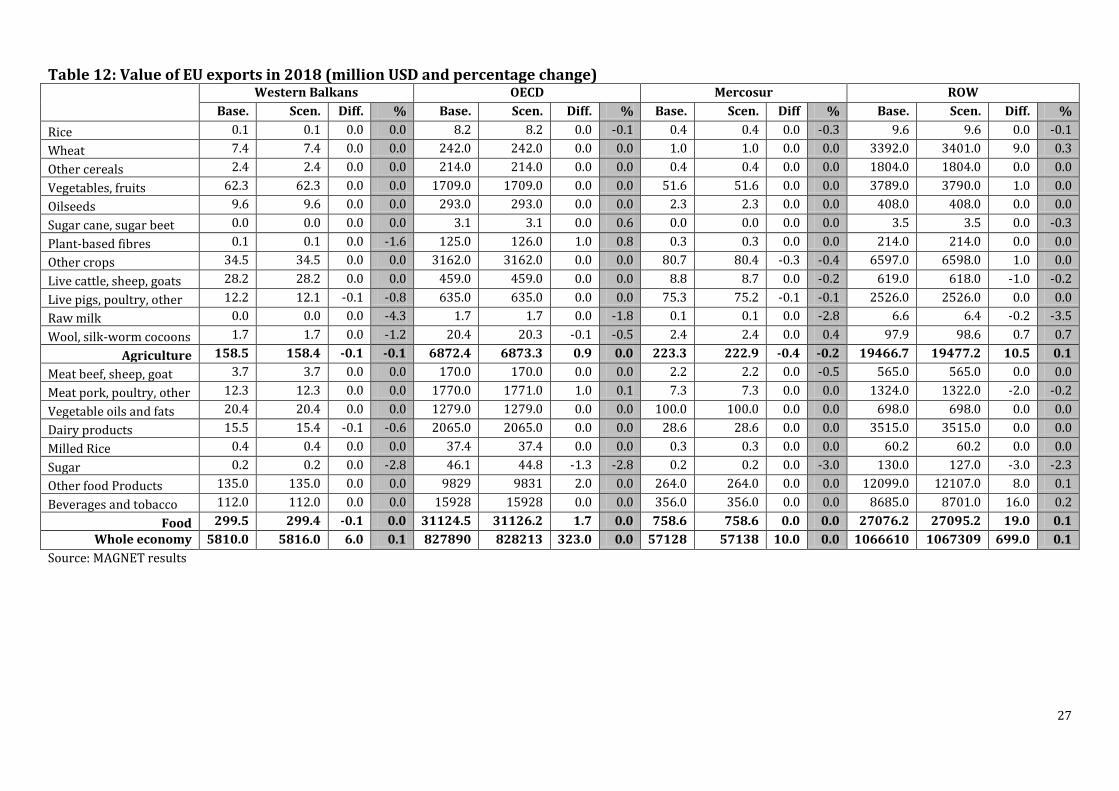
The next tables present disaggregated trade results. The value of Croatian and EU-27 imports from the Western Balkans, OECD, Mercosur and ROW are presented in Tables 9 and 10 respectively. The value of Croatian and EU-27 exports to these groups of countries are presented in Tables 11 and 12 respectively.

24
Table 9: Value of Croatia's imports in 2018 (million USD and percentage change)
Western Balkans OECD Mercosur ROW
Base. Scen. Diff. % Base Scen. Diff. % Base Scen. Diff. % Base Scen. Diff. %
Rice 0.0 0.0 0.0 -79.2 0.1 0.0 0.0 -48.0
Wheat 0.001 -0.001 -100 0.0 0.0 0.0 -50.0 0.1 0.0 -0.1 -67.5
Other cereals 0.005 0.003 -0.002 -40.0 0.9 0.8 -0.1 -12.3 7.8 7.2 -0.6 -8.2 1.6 1.4 -0.3 -16.1
Vegetables, fruits 0.034 0.036 0.002 5.9 21.0 19.6 -1.4 -6.7 5.2 3.9 -1.4 -26.0 29.7 23.7 -6.0 -20.2
Oilseeds 0.001 0.000 -0.001 -100 1.5 1.2 -0.3 -17.8 0.6 0.5 -0.1 -17.9 0.8 0.6 -0.1 -18.1
Sugar cane, sugar beet 0.0 0.0 0.0 -100 2.1 1.6 -0.5 -23.8
Plant-based fibres 0.0 0.0 0.0 -6.4 1.3 1.2 -0.1 -5.5
Other crops 0.152 0.147 -0.005 -3.3 0.6 0.4 -0.2 -29.1 15.9 11.7 -4.2 -26.4 8.7 7.5 -1.2 -13.4
Live cattle, sheep, goats 0.001 0.001 0.000 0.0 0.1 0.1 -0.1 -38.7 0.3 0.2 -0.1 -34.3
Live pigs, poultry, other 0.329 0.299 -0.030 -9.1 5.1 4.7 -0.4 -7.8 0.6 0.5 -0.1 -13.6 7.6 7.0 -0.6 -8.4
Raw milk 0.008 0.007 -0.001 -12.5 0.0 0.0 0.0 -20.0 0.0 0.0 0.0 0.0 0.2 0.1 0.0 -15.4
Wool, silk-worm cocoons 0.0 0.0 0.0 -50.0 0.0 0.0 0.0 0.0 0.3 0.2 -0.1 -24.4
Agriculture 0.531 0.493 -0.038 -7.2 29.3 26.9 -2.4 -8.3 30.2 23.8 -6.4 -21.2 52.6 43.6 -9.1 -17.2
Meat beef, sheep, goat 0.008 0.004 -0.004 -50.0 2.1 4.2 2.1 97.7 23.4 2.7 -20.7 -88.6 4.0 2.7 -1.3 -33.3
Meat pork, poultry, other 0.010 0.003 -0.007 -70.0 2.7 0.7 -2.0 -74.9 31.2 12.6 -18.6 -59.6 8.9 1.4 -7.5 -84.1
Vegetable oils and fats 0.024 0.022 -0.002 -8.3 0.4 0.9 0.5 122.3 10.5 9.8 -0.8 -7.1 47.9 33.9 -14.0 -29.2
Dairy products 0.013 0.010 -0.003 -23.1 1.3 0.5 -0.8 -62.7 3.8 12.6 8.9 236.0 40.2 18.9 -21.3 -53.0
Milled Rice 0.001 0.001 0.000 0.0 0.0 0.0 0.0 -50.0 -75.0 3.8 1.9 -1.9 -48.9
Sugar 0.001 0.000 -0.001 -100 0.1 0.9 0.8 666.4 117.0 109.0 -8.0 -6.8 10.9 49.7 38.8 356.0
Other food Products 0.027 0.016 -0.011 -40.7 42.2 36.7 -5.5 -13.0 19.6 14.6 -5.0 -25.5 168.0 135.0 -33.0 -19.6
Beverages and tobacco 0.003 0.002 -0.001 -33.3 3.8 3.7 -0.1 -2.1 0.4 0.4 0.0 -0.5 39.0 36.8 -2.2 -5.6
Food 0.087 0.058 -0.029 -33.3 52.7 47.6 -5.1 -9.6 205.9 161.6 -44 -21.5 322.7 280.3 -42.4 -13.1
Whole economy 7.9 7.0 -0.9 -11.5 1853.0 1631.0 -222 -12.0 345.0 279.0 -66 -19.1 9540.0 12359 2819 29.5
Source: MAGNET results

25
Table 10: Value of EU imports in 2018 (million USD and percentage change)
Western Balkans OECD Mercosur ROW
Base. Scen. Diff. % Base. Scen. Diff. % Base. Scen. Diff. % Base. Scen. Diff. %
Rice 10.8 10.8 0.0 0.0 126.0 126.0 0.0 0.0 129 129 0.0 0.0
Wheat 3.9 3.8 0.0 -0.5 1017.0 1011.0 -6.0 -0.6 3.6 3.5 0.0 -0.6 331 329 -2.0 -0.6
Other cereals 4.1 4.1 0.0 0.0 624.0 624.0 0.0 0.0 2054.0 2054.0 0.0 0.0 237 237 0.0 0.0
Vegetables, fruits 44.6 44.5 -0.1 -0.2 5707.0 5703.0 -4.0 -0.1 1528.0 1528 0.0 0.0 8847 8840 -7.0 -0.1
Oilseeds 15.7 15.7 0.0 0.0 1365.0 1365.0 0.0 0.0 2484.0 2485 1.0 0.0 414 414 0.0 0.0
Sugar cane, sugar beet 0.1 0.1 0.0 0.0 0.7 0.7 0.0 -0.7 0.0 0.0 0.0 0.0 4.9 4.8 0.0 -0.8
Plant-based fibres 0.0 0.0 0.0 0.0 235.0 235.0 0.0 0.0 19.8 19.7 -0.1 -0.5 391 390 -1.0 -0.3
Other crops 7.4 7.4 0.0 0.0 1349.0 1349.0 0.0 0.0 3294.0 3296 2.0 0.1 3903 3901 -2.0 -0.1
Live cattle, sheep, goats 0.4 0.4 0.0 0.0 276.0 276.0 0.0 0.0 7.6 7.6 0.0 0.0 86.2 86.2 0.0 0.0
Live pigs, poultry, other 14.6 14.6 0.0 0.0 692.0 692.0 0.0 0.0 257.0 257.0 0.0 0.0 1069 1069 0.0 0.0
Raw milk 3.1 2.8 -0.3 -9.2 11.4 10.3 -1.1 -9.6 1.5 1.4 -0.1 -9.1 78.9 71.4 -7.5 -9.5
Wool, silk-worm cocoons 0.2 0.2 0.0 -1.2 319.0 314.0 -5.0 -1.6 48.1 47.4 -0.7 -1.5 407 400 -7.0 -1.7
Agriculture 94.0 93.6 -0.4 -0.4 11606.9 11590.8 -16.1 -0.1 9823.5 9825.6 2.0 0.0 15898 15871.4 -26.5 -0.2
Meat beef, sheep, goat 4.0 4.0 0.0 -0.2 1391.0 1385.0 -6.0 -0.4 5463.0 5444 -19.0 -0.3 854 850 -4.0 -0.5
Meat pork, poultry, other 4.9 4.9 0.0 -0.2 808.0 807.0 -1.0 -0.1 4629.0 4624 -5.0 -0.1 2718 2712 -6.0 -0.2
Vegetable oils and fats 47.6 47.5 -0.1 -0.2 363.0 363.0 0.0 0.0 6495.0 6495 0.0 0.0 5149 5145 -4.0 -0.1
Dairy products 5.8 5.8 0.0 -0.2 1675.0 1672.0 -3.0 -0.2 25.2 25.1 -0.1 -0.4 1527 1524 -3.0 -0.2
Milled Rice 0.2 0.2 0.0 0.0 32.0 31.9 -0.1 -0.3 22.9 22.9 0.0 0.0 760 759 -1.0 -0.1
Sugar 13.0 13.5 0.5 3.8 171.0 177.0 6.0 3.5 951.0 985 34.0 3.6 6294 6510 216 3.4
Other food Products 93.2 93.1 -0.1 -0.1 9291.0 9285.0 -6.0 -0.1 2482.0 2481 -1.0 0.0 31086 31062 -24.0 -0.1
Beverages and tobacco 29.8 29.8 0.0 0.0 3940.0 3938.0 -2.0 -0.1 556.0 556.0 0.0 0.0 2736 2734 -2.0 -0.1
Food 198.5 198.8 0.3 0.1 17671.0 17658.9 -12.1 -0.1 20624.1 20633.0 8.9 0.0 51124 51296 172.0 0.3
Whole economy 2102.0 2101.0 -1.0 0.0 840971.0 840533.0 -438.0 -0.1 73332.0 73328.0 -4.0 0.0 1559247 1557993 -1254 -0.1
Source: MAGNET results

26
Table 11: Value of Croatia's exports in 2018 (million USD and percentage change)
Western Balkans OECD Mercosur ROW
Base. Scen. Diff. % Base. Scen. Diff. % Base. Scen. Diff % Base. Scen. Diff. %
Rice 0.0 0.0 0.0 0.0 0.0 0.0 0.0 0.0 0.0 0.1 0.0 0.0 -79.3
Wheat 0.3 0.5 0.2 52.1 2.7 0.2 -2.5 -94.1 0.2 0.4 0.2 81.4 74.4 35.0 -39.4 -53.0
Other cereals 0.0 0.0 0.0 7.7 1.7 0.8 -1.0 -56.3 0.0 0.0 0.0 14.3 9.2 9.4 0.2 2.4
Vegetables, fruits 0.2 0.2 0.0 18.0 10.0 7.9 -2.1 -21.0 0.7 0.7 -0.1 -11.2 42.9 34.1 -8.8 -20.5
Oilseeds 0.0 0.0 0.0 -2.5 2.2 2.6 0.5 21.7 0.1 0.1 0.0 11.0 32.7 28.7 -4.0 -12.2
Sugar cane, sugar beet 0.0 0.0 0.0 150.0 0.1 0.0 -0.1 -80.7 0.0 0.0 0.0 118.2 0.4 0.5 0.1 36.0
Plant-based fibres 0.0 0.0 0.0 6.7 2.2 2.4 0.3 11.5 0.2 0.2 0.0 10.7 6.1 6.2 0.1 1.1
Other crops 0.0 0.0 0.0 -8.0 2.3 1.7 -0.6 -27.7 2.9 6.2 3.3 116.5 23.9 21.4 -2.5 -10.5
Live cattle, sheep, goats 0.1 0.1 0.0 -16.7 3.2 3.2 0.0 -0.3 0.3 0.3 0.0 10.2 24.8 31.4 6.6 26.6
Live pigs, poultry, other 0.1 0.1 0.0 1.7 6.8 5.2 -1.6 -24.0 0.5 0.5 0.0 2.9 28.3 26.7 -1.6 -5.7
Raw milk 0.2 0.2 0.1 32.9 5.7 7.9 2.1 37.0 0.5 0.7 0.2 36.0 19.0 25.6 6.6 34.7
Wool, silk-worm cocoons 0.1 0.1 0.0 74.2 3.1 4.9 1.8 59.0 0.2 0.2 -0.1 -32.3 6.1 0.4 -5.7 -93.5
Agriculture 1.0 1.3 0.3 28.0 40.0 36.7 -3.3 -8.2 5.7 9.3 3.6 63.8 267.9 219.4 -48.5 -18.1
Meat beef, sheep, goat 0.1 0.0 0.0 -50.0 5.3 0.0 -5.3 -99.6 0.2 0.2 0.0 -19.8 6.6 3.4 -3.2 -48.8
Meat pork, poultry, other 0.1 0.0 0.0 -54.8 8.9 1.7 -7.2 -81.3 0.3 0.2 -0.1 -38.6 27.5 54.8 27.3 99.3
Vegetable oils and fats 0.0 0.0 0.0 0.0 0.8 0.8 0.0 -1.7 0.0 0.0 0.0 -45.0 14.2 7.2 -7.0 -49.2
Dairy products 0.3 0.5 0.3 104.1 5.6 2.6 -2.9 -52.7 0.2 0.1 -0.2 -64.9 38.1 42.0 3.9 10.2
Milled Rice 0.0 0.0 0.0 0.0 0.0 0.0 -58.3 0.0 0.0 0.0 -100.0 0.1 0.0 -0.1 -95.6
Sugar 0.0 0.0 0.0 0.0 0.0 0.0 -56.7 0.0 0.0 0.0 1.6 0.4 -1.2 -73.4
Other food Products 1.2 0.9 -0.2 -20.6 59.4 47.6 -11.8 -19.9 0.1 0.1 0.0 2.9 155.0 111.0 -44.0 -28.4
Beverages and tobacco 2.3 2.0 -0.3 -14.1 9.1 8.5 -0.5 -5.7 0.4 0.4 0.0 -10.8 176.0 101.0 -75.0 -42.6
Food 3.9 3.5 -0.4 -9.2 89.1 61.3 -27.8 -31.2 1.2 0.9 -0.4 -28.7 419.1 319.8 -99.3 -23.7
Whole economy 64.8 54.8 -10.0 -15.4 1466 1474 8.0 0.5 112.0 115.0 3.0 2.7 5050 4396 -654.0 -13.0
Source: MAGNET results
27
Table 12: Value of EU exports in 2018 (million USD and percentage change)
Western Balkans OECD Mercosur ROW
Base. Scen. Diff. % Base. Scen. Diff. % Base. Scen. Diff % Base. Scen. Diff. %
Rice 0.1 0.1 0.0 0.0 8.2 8.2 0.0 -0.1 0.4 0.4 0.0 -0.3 9.6 9.6 0.0 -0.1
Wheat 7.4 7.4 0.0 0.0 242.0 242.0 0.0 0.0 1.0 1.0 0.0 0.0 3392.0 3401.0 9.0 0.3
Other cereals 2.4 2.4 0.0 0.0 214.0 214.0 0.0 0.0 0.4 0.4 0.0 0.0 1804.0 1804.0 0.0 0.0
Vegetables, fruits 62.3 62.3 0.0 0.0 1709.0 1709.0 0.0 0.0 51.6 51.6 0.0 0.0 3789.0 3790.0 1.0 0.0
Oilseeds 9.6 9.6 0.0 0.0 293.0 293.0 0.0 0.0 2.3 2.3 0.0 0.0 408.0 408.0 0.0 0.0
Sugar cane, sugar beet 0.0 0.0 0.0 0.0 3.1 3.1 0.0 0.6 0.0 0.0 0.0 0.0 3.5 3.5 0.0 -0.3
Plant-based fibres 0.1 0.1 0.0 -1.6 125.0 126.0 1.0 0.8 0.3 0.3 0.0 0.0 214.0 214.0 0.0 0.0
Other crops 34.5 34.5 0.0 0.0 3162.0 3162.0 0.0 0.0 80.7 80.4 -0.3 -0.4 6597.0 6598.0 1.0 0.0
Live cattle, sheep, goats 28.2 28.2 0.0 0.0 459.0 459.0 0.0 0.0 8.8 8.7 0.0 -0.2 619.0 618.0 -1.0 -0.2
Live pigs, poultry, other 12.2 12.1 -0.1 -0.8 635.0 635.0 0.0 0.0 75.3 75.2 -0.1 -0.1 2526.0 2526.0 0.0 0.0
Raw milk 0.0 0.0 0.0 -4.3 1.7 1.7 0.0 -1.8 0.1 0.1 0.0 -2.8 6.6 6.4 -0.2 -3.5
Wool, silk-worm cocoons 1.7 1.7 0.0 -1.2 20.4 20.3 -0.1 -0.5 2.4 2.4 0.0 0.4 97.9 98.6 0.7 0.7
Agriculture 158.5 158.4 -0.1 -0.1 6872.4 6873.3 0.9 0.0 223.3 222.9 -0.4 -0.2 19466.7 19477.2 10.5 0.1
Meat beef, sheep, goat 3.7 3.7 0.0 0.0 170.0 170.0 0.0 0.0 2.2 2.2 0.0 -0.5 565.0 565.0 0.0 0.0
Meat pork, poultry, other 12.3 12.3 0.0 0.0 1770.0 1771.0 1.0 0.1 7.3 7.3 0.0 0.0 1324.0 1322.0 -2.0 -0.2
Vegetable oils and fats 20.4 20.4 0.0 0.0 1279.0 1279.0 0.0 0.0 100.0 100.0 0.0 0.0 698.0 698.0 0.0 0.0
Dairy products 15.5 15.4 -0.1 -0.6 2065.0 2065.0 0.0 0.0 28.6 28.6 0.0 0.0 3515.0 3515.0 0.0 0.0
Milled Rice 0.4 0.4 0.0 0.0 37.4 37.4 0.0 0.0 0.3 0.3 0.0 0.0 60.2 60.2 0.0 0.0
Sugar 0.2 0.2 0.0 -2.8 46.1 44.8 -1.3 -2.8 0.2 0.2 0.0 -3.0 130.0 127.0 -3.0 -2.3
Other food Products 135.0 135.0 0.0 0.0 9829 9831 2.0 0.0 264.0 264.0 0.0 0.0 12099.0 12107.0 8.0 0.1
Beverages and tobacco 112.0 112.0 0.0 0.0 15928 15928 0.0 0.0 356.0 356.0 0.0 0.0 8685.0 8701.0 16.0 0.2
Food 299.5 299.4 -0.1 0.0 31124.5 31126.2 1.7 0.0 758.6 758.6 0.0 0.0 27076.2 27095.2 19.0 0.1
Whole economy 5810.0 5816.0 6.0 0.1 827890 828213 323.0 0.0 57128 57138 10.0 0.0 1066610 1067309 699.0 0.1
Source: MAGNET results

28
6.2 Production
Trade liberalization is expected to affect the quantity of goods produced in Croatia and the EU, as well as in their main trading partners. Croatia Our results can be found in Table 13, and show that Croatia’s EU accession leads to an increase in production volume for the majority of agricultural products (except for sugar beet, wheat and other cereals) and a decrease in production volume for most food products (except beef, sheep and goat meat). Table 13: Value and volume of production, and change in production prices in Croatia
in 2018 (million USD and percentage change) Value of production Volume* Price**
Baseline Scenario Diff. % % %
Rice 0 0 0 - - -14.3
Wheat 873 802 -71 -8.1 -0.8 -7.5
Other cereals 759 689 -70 -9.2 -1.3 -8.1
Vegetables, fruits 2012 1872 -140 -7.0 0.3 -7.2
Oilseeds 496 459 -37 -7.5 -0.3 -7.3
Sugar cane, sugar beet 55 29 -26 -47.3 -37.1 -16.7
Plant-based fibres 104 106 2 1.9 4.7 -2.8
Other crops 216 209 -7 -3.2 1.5 -4.3
Live cattle, sheep, goats 941 914 -27 -2.9 2.2 -4.8
Live pigs, poultry, other 1449 1384 -65 -4.5 1.7 -6.0
Raw milk 1582 1548 -34 -2.1 3.2 -5.2
Wool, silk-worm cocoons 182 190 8 4.4 9.7 -4.8
Agriculture 8669 8202 -467 -5.4 1.1 --
Meat beef, sheep, goat 1198 1207 9 0.8 3.1 -2.4
Meat pork, poultry, other 1423 1295 -128 -9.0 -5.9 -3.2
Vegetable oils and fats 166 160 -6 -3.6 -2.7 -1.2
Dairy products 1247 1231 -16 -1.3 -0.5 -0.8
Milled Rice 280 281 1 0.4 1.3 -1.1
Sugar 289 324 35 12.1 -56.3 156.5
Other food Products 1911 1771 -140 -7.3 -6.2 -1.3
Beverages and tobacco 1434 1350 -84 -5.9 -7.0 1.2
Food 7948 7619 -329 -4.1 -5.5 --
Whole economy 120044 118903 -1141 -1.0 -0.20 --
*Change in volume corresponds to change in value at constant prices **Per cent change in production market prices between baseline and scenario Source: MAGNET results
While after EU accession the prices of many important agricultural and food products drop, the value of production of Croatian agri-food sectors decreases for almost all major branches (except sugar, wool and silk-worm cocoons, plant-based fibres, and beef, sheep and goat meat). In aggregated terms, the values of agri-food production decrease by about 5.4% and 4.1% respectively. The sugar sector remains an exception since the producer price in Croatia increases by about 156% (Table 13). This huge increase is led by an imposed sugar production quota that necessitates a reduction in the production of sugar in Croatia from approximately 240,000 tonnes in 2011 to 193,000 tonnes in 2013

29
(European Commission, 2009). As a result, the value of sugar production increases by about 35 million USD. The sector producing beef, sheep and goat meat experiences a positive but small development. Despite a decrease in prices, the value of production increases by about 9 million USD. Other sectors that benefit are wool, silk-worm cocoons (8 million USD), plant-based fibres (2 million USD) and milled rice (1 million USD). Larger decreases are seen for vegetables and fruits (140 million USD), other food products (140 million USD), pork, poultry and other meat (128 million USD), and the beverage and tobacco sector (84 million USD). These results illustrate the deficiency in competiveness of Croatian agricultural and food sectors in contrast to other EU Member States. Furthermore, higher tariffs faced by Croatian exporters after Croatia's EU accession (effect of harmonisation of tariffs by its previous trading partners i.e. the Western Balkans, OECD, Mercosur and ROW, to those applied to the EU) reduce Croatian exports and thus lead to significant drop in production . EU-27 and other regions Given Croatia's small share of the EU import and export markets, no sector in the EU faces a change greater than +/-0.7% (Table 14). Yet, as opposed to in Croatia, in the EU-27 both the agricultural and food producers gain (45 million USD and 428 million USD, respectively) due to an increase in exports to Croatia, the EU producers of sugar (120 million USD), of pork and poultry (118 million USD), and other food products (97 million USD) benefit the most. Table 14: Value of Production in EU-27 in 2018 (million USD and percentage change)
Baseline Scenario Diff. %
Rice 1239 1239 0 0
Wheat 30887 30862 -25 -0.08
Other cereals 29167 29169 2 0.01
Vegetables, fruits 77384 77377 -7 -0.01
Oilseeds 17304 17305 1 0.01
Sugar cane, sugar beet 3042 3040 -2 -0.07
Plant-based fibres 1907 1906 -1 -0.05
Other crops 102116 102121 5 0.00
Live cattle, sheep, goats 35288 35324 36 0.10
Live pigs, poultry, other 63309 63341 32 0.05
Raw milk 55660 55665 5 0.01
Wool, silk-worm cocoons 297 296 -1 -0.34
Agriculture 417600 417645 45 0.01
Meat beef, sheep, goat 50760 50787 27 0.05
Meat pork, poultry, other 137637 137755 118 0.09
Vegetable oils and fats 30113 30131 18 0.06
Dairy products 262673 262710 37 0.01
Milled Rice 2114 2115 1 0.05
Sugar 17651 17771 120 0.68
Other food Products 504399 504496 97 0.02
Beverages and tobacco 333013 333023 10 0.00
Food 1338360 1338788 428 0.03
Whole economy 29677602 29673954 -3648 -0.01
Source: MAGNET results
Table 15 shows the value of production in the rest of the regions of this study.

30
Table 15: Value of production in Western Balkans, OECD, Mercosur and ROW in 2018 (million USD and percentage change) Western Balkans OECD Mercosur ROW
Base Scen. Diff. % Base Scen. Diff. % Base Scen. Diff. % Base Scen. Diff. %
Rice 1 1 0 0.00 23604 23605 1 0.00 3436 3435 -1 -0.03 122856 122863 7 0.01
Wheat 185 184 -1 -0.54 30342 30353 11 0.04 4425 4426 1 0.02 79914 79930 16 0.02
Other cereals 161 161 0 0.00 66756 66755 -1 0.00 13681 13680 -1 -0.01 118764 118768 4 0.00
Vegetables, fruits 1219 1219 0 0.00 154025 154024 -1 0.00 9121 9119 -2 -0.02 719339 719381 42 0.01
Oilseeds 137 137 0 0.00 33313 33311 -2 -0.01 29643 29647 4 0.01 75741 75735 -6 -0.01
Sugar cane & beet 43 43 0 0.00 6337 6339 2 0.03 8743 8737 -6 -0.07 35573 35638 65 0.18
Plant-based fibres 1 1 0 0.00 23241 23241 0 0.00 4142 4142 0 0.00 48254 48257 3 0.01
Other crops 344 344 0 0.00 49339 49338 -1 0.00 34500 34494 -6 -0.02 127939 127939 0 0.00
Live cattle, sheep 289 289 0 0.00 63257 63254 -3 0.00 21894 21879 -15 -0.07 112533 112530 -3 0.00
Live pigs, poultry 295 295 0 0.00 76169 76168 -1 0.00 18179 18168 -11 -0.06 416051 416055 4 0.00
Raw milk 891 891 0 0.00 60754 60749 -5 -0.01 10238 10240 2 0.02 206197 206184 -13 -0.01
Wool, silk- 12 12 0 0.00 4295 4291 -4 -0.09 5145 5143 -2 -0.04 23128 23121 -7 -0.03
Agriculture 3578 3577 -1 -0.03 591432 591428 -4 0.00 163147 163110 -37 -0.02 2086289 2086401 112 0.01
Meat beef, sheep 289 289 0 0.00 147511 147509 -2 0.00 34660 34634 -26 -0.08 116851 116851 0 0.00
Meat pork, poultry 195 195 0 0.00 118072 118067 -5 0.00 23848 23825 -23 -0.10 149599 149567 -32 -0.02
Vegetable oils 149 149 0 0.00 34237 34237 0 0.00 31754 31757 3 0.01 154605 154590 -15 -0.01
Dairy products 655 655 0 0.00 178902 178896 -6 0.00 20361 20369 8 0.04 170644 170619 -25 -0.01
Milled Rice 26 26 0 0.00 32363 32363 0 0.00 6199 6199 0 0.00 111717 111722 5 0.00
Sugar 66 66 0 0.00 33079 33088 9 0.03 16122 16108 -14 -0.09 70078 70233 155 0.22
Other food 507 507 0 0.00 668105 668098 -7 0.00 61707 61696 -11 -0.02 654142 654159 17 0.00
Bev. and tobacco 407 407 0 0.00 314820 314818 -2 0.00 27693 27692 -1 0.00 258149 258221 72 0.03
Food 2294 2294 0 0.00 1527089 1527076 -13 0.00 222344 222280 -64 -0.03 1685785 1685962 177 0.01
Whole economy 37064 37062 -2 -0.01 43911540 43910702 -838 0.00 3623971 3623627 -344 -0.01 37819395 37823355 3960 0.01
Source: MAGNET results

31
The effects of Croatia's EU accession on production on third countries, are relatively minor (Table15). In percentage change is so insignificant that it is not worth highlight it, so the focus is placed in absolute terms. In the ROW, substitution of EU products on Croatian markets translates into approximately 3960 million USD in production gains, mostly outside the agri-food sectors and sugar (155 million USD). Contrary to producers in the ROW, other trading blocs like OECD and Mercosur are negatively affected since both face higher entry barriers to Croatian markets after the accession to the EU.
6.3 Employment
Analysis of employment patterns in Croatia and the EU (in 2007) shows the similarity of the employment structure outside the agricultural and food sectors (Figure 1). In both regions most of the workforce were employed in the services sector (76.5% in Croatia, and 75.6% in the EU), then in the manufacturing sector (17.8% in Croatia, and 19.6% in the EU). The main differences in employment structure concerned the agri-food sector. The percentage of people employed in the agricultural sector was much higher in Croatia (7%) than in the EU (1.9%). Similarly, the share of employment in the food sector in Croatia (4.7%) was higher than in the EU (2.7%). Figure 1: Employment structure in Croatia and the EU in 2007 (percentage)
Source: authors' calculation from GTAP database
In Croatia, the vegetable and fruit sector was the sector that contributed most to employment levels in the agri-food sector (Figure 2). This was followed by other food, milk production, wheat, and production of live pigs, poultry and other animals. In the EU, the majority of the labour force in the agricultural and food sectors was employed in the other food sector, other crops sector, and beverages and tobacco sector (Figure 3). Both in Croatia and the EU, the share of unskilled labour employed in the agri-food sector in 2007 was much higher than skilled labour.13
13 The original GTAP formulation, as well as data from most of the source input-output tables, specifies only three primary factors: agricultural land, capital, and labour. As no global data set could serve as a basis for disaggregating employment by worker type, in order to obtain necessary information about unskilled and skilled labour, in GTAP database employment in above categories was calculated on the basis of labour payment shares mapped to GTAP sectors – by using an especially developed statistical

32
Figure 2: Structure of employment in agri-food sectors in Croatia in 2007 (million USD)
Source: authors' calculation from GTAP database
Figure 3: Structure of employment in agri-food sectors in EU in 2007 (million USD)
Source: authors' calculation from GTAP database
The impact of Croatia's accession to the EU on unskilled employment14 in Croatia is shown in Table 16. The results demonstrate that in the agricultural and food sectors the unskilled employment effects are mostly negative (except for sectors such as wool, and beef, sheep and goat meat, where the level of unskilled employment marginally increases).15 In relative terms, the most negatively affected sectors are sugar beet and sugar with decreases of about 41% and 53% respectively. Yet, the impact may be
model to cover all GTAP regions and by taking into consideration respective skilled/unskilled wage differentials for each region. Following this approach, employment by worker type (skilled and unskilled) is expressed in our study in constant million USD of 2007 (see Chapter 12B on skilled and unskilled labor data, Narayanan and Walmsley, 2008). 14
The focus is on unskilled employment as skilled labour is fully employed by assumption. 15
Changes in labour market modelling or in assumption such as GDP growth would impact this result.

33
overstated here as both sectors are characterised by a relatively low unskilled employment level and are subject to a newly introduced production quota. Table 16: Effects on unskilled employment in Croatia in 2018 (million USD, percentage
change and absolute change in unskilled full-time equivalents)
Baseline in USD
Scenario in USD
Diff. in USD
% absolute changes in unskilled full-time
equivalents
Rice 0 0 0 0.00 0
Wheat 218 208 -10 -4.59 -833
Other cereals 165 156 -9 -5.45 -749
Vegetables, fruits 552 533 -19 -3.44 -1582
Oilseeds 120 116 -4 -3.33 -333
Sugar cane, sugar beet 17 10 -7 -41.18 -583
Plant-based fibres 8 8 0 0.00 0
Other crops 28 27 -1 -3.57 -83
Live cattle, sheep, goats 117 116 -1 -0.85 -83
Live pigs, poultry, other 224 220 -4 -1.79 -333
Raw milk 264 264 0 0.00 0
Wool, silk-worm cocoons 38 40 2 5.26 167
Agriculture 1751 1698 -53 -3.03 -4412
Meat beef, sheep, goat 93 96 3 3.23 250
Meat pork, poultry, other 99 93 -6 -6.06 -500
Vegetable oils and fats 16 16 0 -0.00 0
Dairy products 140 139 -1 -0.71 -83
Milled Rice 33 33 0 0.00 0
Sugar 17 8 -9 -52.94 -749
Other food Products 416 391 -25 -6.01 -2081
Beverages and tobacco 169 157 -12 -7.10 -999
Food 983 933 -50 -5.09 -4163
Whole economy 17607 17624 17 0.10 1415
Note: An average unskilled wage of approximately 1001USD/month is assumed Source: MAGNET results
In absolute terms, unskilled employment in both agricultural and food sectors in Croatia is negatively affected with a drop of about 4400 and 4100 unskilled employees respectively. The highest negative impact on unskilled employment takes place in those sectors of the Croatian economy which (i) are less competitive and therefore will have to face increasing imports from the EU and other trading partners – e.g. other food products (2081 employees), (ii) will lose their shares in export markets due to higher tariffs introduced by their traditional trading partners – e.g. beverages and tobacco (approximately 1000 employees), and (iii) will be restricted in their productive capacities by the introduction of new policy measures such as production quotas – e.g. sugar (approximately 750 employees). Among the agricultural sectors the most negatively affected in absolute terms are fruits and vegetables (approximately 1600 employees), wheat (approximately 800 employees), other cereals (approximately 750 employees) and sugar beet (approximately 600 employees). In the case of Croatia's agri-food sectors, an exogenous

34
increase in unskilled labour wages (eg. caused by an additional GDP growth), given constant or decreasing production, puts an additional pressure on labour costs that leads either to a direct increase in unemployment16 or a faster shift in employment from less profitable agricultural sectors (e.g. fruits and vegetables) to other expanding sectors (e.g. services). Table 17: Effects on unskilled employment in EU-27 in 2018 (million USD, percentage
change and absolute change in unskilled full-time equivalents)
Baseline in USD
Scenario in USD
Diff. in USD
% absolute changes in unskilled full-time
equivalents
Rice 649 649 0 0.00 0
Wheat 10219 10212 -7 -0.07 -275
Other cereals 10597 10598 1 0.01 39
Vegetables, fruits 32722 32720 -2 -0.01 -79
Oilseeds 6611 6611 0 0.00 0
Sugar cane, sugar beet 1164 1163 -1 -0.09 -39
Plant-based fibres 953 953 0 0.00 0
Other crops 40860 40863 3 0.01 118
Live cattle, sheep, goats 6619 6625 6 0.09 236
Live pigs, poultry, other 17005 17012 7 0.04 275
Raw milk 18895 18896 1 0.01 39
Wool, silk-worm cocoons 44 44 0 0.00 0
Agriculture 146338 146346 8 0.01 314
Meat beef, sheep, goat 6024 6026 2 0.03 79
Meat pork, poultry, other 12755 12765 10 0.08 393
Vegetable oils and fats 3535 3537 2 0.06 79
Dairy products 21401 21403 2 0.01 79
Milled Rice 186 186 0 0.00 0
Sugar 3306 3306 0 0.00 0
Other food Products 79266 79278 12 0.02 472
Beverages and tobacco 38053 38052 -1 0.00 -39
Food 164526 164553 27 0.02 1061
Whole economy 4506696 4506005 -691 -0.02 -27162
Note: An average unskilled wage of approximately 2120 USD/month is assumed Source: MAGNET results Contrary to the situation in Croatia, the enlargement is expected to induce positive changes in unskilled employment in the agri-food sector in the EU-27, as presented in Table 17. In absolute terms, unskilled employment levels in both the agricultural and food sectors expand by about 300 and 1100 employees respectively. Sectors that are especially positively affected are: other food products (approximately 500 employees), pork and poultry meat (approximately 400 employees), live pigs and poultry (approximately 300 employees) and live cattle, sheep and goats (approximately 240 employees). However, the rest of the economy's unskilled employment drops by about 28500 employees, a key reason for this is the improved market access of third countries into Croatia. Indeed with the accession, Croatia adopts the EU external tariffs which 16 For the unskilled labour we assumed a fix wages regime and variable employment level as model closure.

35
imply a substitution of EU-27's non-agri-food products in Croatia with those originating from the ROW.17 Clearly, changes in unskilled employment have to be seen as part of an on-going adjustment process (including, a better allocation of production factors) which takes place in both regions following a further harmonisation of trade and policy mechanisms. The total effect of this process is reflected in GDP changes as highlighted below.
6.4 GDP
The country that benefits the most from Croatia’s adoption of EU agricultural and trade policies is Croatia itself; its GDP rises by 0.33% or about 235 million USD (Figure 4) i.e. approximately 172 million euros, which it is probably an underestimate as the model doesn't include factors that will greatly benefit Croatia, such as FDI or structural funds from the EU. Nevertheless, Croatia’s GDP represents only around 0.35% of the EU’s GDP. Therefore, the impact of Croatia's accession to EU is in general very small.
Figure 4: GDP absolute change following Croatia’s accession in 2018 (million USD)
Source: MAGNET results
EU’s GDP decreases by 0.006% (1.1 billion USD). This slight loss in the EU’s GDP is insignificant and does not mean that the EU does not benefit from having Croatia access the EU, one need to take into account that the model does not capture all the different public or private transfers expected with this accession, as well as non-economic considerations such as political gains or regional stabilization. This means that our analysis probably underestimates the gains from such an accession. Moreover, beyond 2018, we would expect Croatia to keep growing and have a bigger positive impact on the EU.
17 It is worth mentioning that with the accession to the EU, import tariffs imposed by Croatia on manufacturing from the ROW drop from 2.5% to 1.5%. At the same time, import tariffs faced by Croatia's manufacturing exports to the ROW increase from 3.8% to 8.2% (GTAP database v.8).

36
At the same time, Croatia's accession to the EU raises the ROW’s GDP by 0.005% (in absolute terms by as much as 1.1 billion USD) mainly due to additional exports of non-agri-food products. On the other hand, it reduces GDP for OECD (334 million USD), Mercosur (112 million USD) and lastly for the Western Balkans (1 million USD). The decrease in GDP for these regions reflects the effects of changes in trade pattern; exports from these regions to Croatia, after its EU accession, are falling due to Croatia’s increased external protection (trade diversion effects). Overall, the impact of Croatia's accession to the EU is small and one should further analyse the accession not only including agricultural and trade policies but all the different transfers expected with this accession, being public (especially structural funds) or private (especially FDIs). These might have more significant impacts on Croatia and EU, and therefore on their GDPs.

37
7. Concluding remarks
This report assesses the likely effects of Croatia's accession to the EU on the agricultural and food sectors. The analysis is carried out using the global recursive dynamic CGE model MAGNET, and results take into consideration the shift in trade and agricultural policies in Croatia, as well as necessary adjustments of trade instruments applied by its main trading partners. It does not take into account, however, other EU policies such as the structural or cohesion policies, and additional gains resulting from the accession such as a less risky investment environment or a more efficient regulatory framework. Main results show that Croatia will benefit from its accession to the EU with modest increase in its GDP and employment. The impact on the EU-27's GDP is not significant whereas in terms of jobs it is slightly positive for the agri-food sectors. However this doesn't mean that the EU does not benefit from having Croatia access the EU, one need to take into account that the model does not capture all the different transfers expected with this accession such the ones mentioned above. By adopting European trade regime and agricultural policy, Croatia will face changes in its production and trade structure. At constant prices, Croatia's agricultural production benefits (increasing by 1.1%), whereas food production contracts (decreasing by 5.5%). It is worth mentioning that Croatia will experience strong price effects. As a result the value of production at real prices decreases in both the agricultural and food processing sectors. Moreover, our results show that Croatia's EU accession affects significantly Croatia’s exports to the EU of primary agricultural goods (raise by 32%) and of food products (fall by 20%). The sectors that gain the most are wheat, vegetables and fruits, and beef due to trade diversion effects from different countries (OECD or Western Balkans) to the EU. The situation is different when analyzing Croatia’s imports from the EU where imports of primary agricultural products fall by 3.2% whereas those of food products increase by 27%. While Croatia’s accession to the EU causes an abolition of Croatian protection for imports coming from the EU, it generally leads to an increase in protection of Croatian agricultural and food sectors for imports coming from third countries. These two elements result in a drop in total imports of agricultural products of 6.1% and an increase for food products by 11.2%. At the same time, total exports of Croatian agricultural products increase by 7.4% and total exports of food products decrease by 2%. Lastly the financial package on agriculture, granted in the accession negotiations, provide significant gains for Croatia. However outcomes from Croatia's accession presented in this report are likely to be underestimated since many other budget transfers are excluded from this modelling exercise. Moreover, an in-depth analysis of the impacts on manufacturing and service sectors would be required. In addition gains from the adoption of transparent and stable regulatory frameworks are likely to be significant, and would require further examination.

38
References
Aguiar, A.,McDougall, R., Narayanan, B., Eds, 2012. Global Trade, Assistance, and Production: The GTAP 8 Database, Center for Global Trade Analysis, Purdue University. https://www.gtap.agecon.purdue.edu/databases/v8/v8_doco.asp
Bussiere, M., Fidrmuc, J., Schnatz, B., 2008. EU Enlargement and Trade Integration: Lessons from a Gravity Model. Review of Development Economics, 12: 562–576.
European Commission, 2009. A financial package for the accession negotiation with Croatia, Communication from the Commission, COM(2009)595 final, 29.10.2009, Brussels.
European Commission, 2011. Information on the Results of the EU Accession Negotiations with Croatia, Directorate General for Enlargement, November 2011, Brussels.
Hertel, T.W., Ed., 1997. Global Trade Analysis: Modeling and Applications, Cambridge University Press.
Kumric, O. and Franic R. 2005. Using Slovenian Experience in the Croatian Agricultural Policy Adjustment to EU Requirements. Agriculturae Conspectus Scientificus, Vol. 70 No. 1 (29-36).
Lejour, A., Mervar, A., Verweij, G., 2009. The Economic Effects of Croatia's Accession to the European Union, Eastern European Economics, 47(6), 60-83.
M’barek, R., Britz, W., Burrell, A., Delincé, J., 2012. An integrated Modelling Platform for Agro-economic Commodity and Policy Analysis (iMAP) - a look back and the way forward, JRC Scientific and Policy Report, Luxembourg: Publications Office of the European Union, EUR 25267. http://ftp.jrc.es/EURdoc/JRC69667.pdf
Möllers, J., Zier, P., Frohberg, K., Buchenrieder, G., Bojnec, Š., 2009. Croatia's EU accession: socio-economic assessment of farm households and policy recommendations, Studies on the Agricultural and Food Sector in Central and Eastern Europe, Leibniz IAMO, volume 48, number 53665.
Narayanan, B., Walmsley, T., Eds., 2008. Global Trade, Assistance, and Production: The GTAP 7 Database, Center for Global Trade Analysis, Purdue University. http://www.gtap.agecon.purdue.edu/databases/v7/v7_doco.asp
Nowicki, P., et al., 2009. Scenar 2020-II – Update of Analysis of Prospects in the Scenar 2020 Study, Contract No. 30–CE-0200286/00-21. European Commission, Directorate-General Agriculture and Rural Development, Brussels. http://ec.europa.eu/agriculture/analysis/external/scenar2020ii/index_en.htm
Sosic, V., Vujcic, B., 2005. Chapter 3 in Croatian Accession to the European Union: Facing the Challenges of Negotiations, Institute of Public Finance, vol. 3, pp 61-84.
Viner, J., 1950. The customs union issue, Carnegie Endowment for International Peace, New York.
Witzke, A.P., Zintl, A., Tonini, A., 2009. The Common Agricultural Policy SIMulation (CAPSIM) Model: Dairy Reform and Western Balkan Countries Accession Scenarios, JRC Scientific and Technical Reports. Luxembourg: Publications Office of the European Union, EUR 23951. http://ftp.jrc.es/EURdoc/JRC50411.pdf

39
Appendix
Table A1: Sector aggregation in MAGNET
No Code Description of product
category HS code
1. Rice 1006 rice
2. Wheat 1001 Wheat and meslin
3.
Other cereals 1002 rye in the grain 1003 barley 1004 oats 1005 corn (maize) 1007 grain sorghum 1008 buckwheat. millet & canary seed. cereals nesoi
4. Vegetables. fruit & nuts 07 edible vegetables
08 ed. fruits & nuts. peel of citrus/melons
5.
Oilseeds 1201 Soybeans. whether or not broken 1202 peanuts (ground-nuts). raw 1203 copra 1204 flaxseed (linseed). whether or not broken 1205 rape or colza seeds. whether or not broken 1206 sunflower seeds. whether or not broken 1207 oil seeds & oleaginous fruits nesoi. broken or not 1208 flour & meal of oil seed & olea fruit (no mustard)
6. Sugar cane & sugar beet 121291 Sugar Beet
121292 Sugar Cane
7. Plant-based fibres 13 lac. natural gums. resins. etc.
14 vegetable plaiting materials
8.
Other crops 0199 Other raw vegetable materials 06 Live trees. other plants. cut flowers 1209 seeds. fruit and spores. for sowing 1210 hop cones. fresh or dried. lupulin 1211 plants etc for pharmacy. perfume. insecticides etc 121210 Locust Beans (Including Locust Bean Seeds) 121220 Seaweeds and Other Algae 121230 Apricot. Peach or Plum Stones and Kernels 121299 Other Vegetable Prods (chicory roots etc) 1213 Cereal straw & husks unprep w/n chop etc or pellet 1214 rutabagas. hay. clover & other forage products
9. Live cattle. sheep. goats. horses
0101 horses. asses. mules and hinnies. live 0102 bovine animals. live 0104 sheep and goats. live
10.
Live pigs. poultry. other unprocessed or preserved animal products
0103 swine. live 0105 chickens. ducks. geese. turkeys. and guineas. live 0106 animals. live. nesoi - not elsewhere specified of indicated. 0407 birds' eggs. in the shell. fresh. preserved or cooked 0408 birds' eggs. not in shell & yolks. fresh. dry. etc 0409 honey. natural 0410 edible products of animal origin. nesoi 05 products of animal origin
11. Raw milk 0401 milk and cream. not concentrated or
sweetened
Agr
icu
ltu
re

40
12.
Wool. silk cocoons 0296 raw animal materials used in textiles 50 silk. inc. yarns & woven fabrics thereof 51 wool & fine or coarse animal hair. inc. yarns &
woven fabrics thereof
13.
Meat cattle. sheep. goat. horse
0201 meat of bovine animals. fresh or chilled 0202 meat of bovine animals. frozen 0204 meat of sheep or goats. fresh. chilled or frozen 0205 meat of horses. asses. mules. hinnies fr. chld. fz 0206 edible offal. bovine. swine. sheep. goat. horse. etc.
14.
Meat pork. poultry. other 0203 meat of swine (pork). fresh. chilled or frozen 0207 meat & ed offal of poultry. fresh. chill or frozen 0208 meat & edible offal nesoi. fresh. chilled or frozen 0209 pig & poultry fat fresh chld frzn salted dried smkd 0210 meat & ed offal salted. dried etc. & flour & meal
15.
Vegetable oils and fats 15animal or vegetable fats. oils & waxes 2301 flour, meals etc.. 2304 oil-cake from soybean 2306 oil-cake from veg. fats
16.
Dairy products 0402 milk and cream. concentrated or sweetened 0403 buttermilk. yogurt. kephir etc. flavored etc or not 0404 whey & milk products nesoi. flavored etc. or not 0405 butter and other fats and oils derived from milk 0406 cheese and curd
17. Milled Rice Processed rice
18. Sugar 17 sugar (raw. refined. confectionery)
19.
Other food products 09 coffee. tea. mate & spices 11 milling industry products 16 ed. prep. of meat. fish. crustaceans. etc 18 cocoa & cocoa preparations 19 preps. of cereals. flour. starch or milk 20 preps of vegs. fruits. nuts. etc. 21 misc. edible preparations 2308/9 animal feed
20.
Beverages and tobacco 22 beverages. spirits & vinegar 2302/3 & 2305 & 2307 residues from food industries but oil-cakes. 24 tobacco & manuf. Tobacco substitutes
21. Manufactures (primary
and machinery) Chapters 25-49 52-87 88-98
22. Services Chapters: 9801-9835 9841-9855 9860-9884
Public services
Fo
od

41
Table A2: Regional aggregation in MAGNET
No. Code Country Economic Agreement
1. EU27
Austria, Belgium, Denmark, Finland, France, Germany, Greece, Ireland, Italy, Luxembourg, Netherlands, Portugal, Spain, Sweden, United Kingdom, Cyprus, Czech Republic, Estonia, Hungary, Latvia, Lithuania, Malta, Poland, Slovak Republic, Slovenia, Bulgaria, Romania
EU27 (Customs union)
2. Croatia Croatia No FTA. Main trading partner
3. Western Balkans Albania, Serbia, Bosnia-Herzegovina, Montenegro, Macedonia.
No FTA. Main trading partner
4. OECD-nonEU Australia, Canada, Chile, Israel, Japan, South Korea, Mexico, New Zealand, Norway, Switzerland, Turkey, USA.
No FTA. Main trading partner
5. ROW
Rest of East Asia, Cambodia, Laos, Myanmar, Vietnam, Bangladesh, Rest of South America, Belarus, Ukraine, Rest of, Kazakhstan, Kyrgyzstan, Rest of Former Soviet Union, Armenia, Azerbaijan, Georgia, Islamic Republic of Iran, Rest of Western Asia, Rest of North Africa, Taiwan, Indonesia, Malaysia, Philippines, Singapore, Thailand, Pakistan, Sri Lanka, Bolivia, Venezuela, Egypt, Morocco, Tunisia, South Africa, Rest of Europe, Rest of EFTA, Peru, Ecuador, Panama, Colombia, Costa Rica, Guatemala, Nicaragua, Rest of Central America, Nigeria, Senegal, Rest of West Africa, rest of Central Africa, rest of South Central Africa, Ethiopia, Madagascar, Malawi, Mauritius, Mozambique, Tanzania, Uganda, Zambia, Zimbabwe, Rest of Eastern Africa, Botswana, Rest of South African Customs, Caribbean Countries, Oceania, Rest of Oceania, India, Russian Federation, China, Hong Kong,
No FTA. Main trading partner
6. MERCOSUR Argentina, Brazil, Uruguay, Paraguay No FTA. Main trading partner

42
European Commission
EUR 25835 – Joint Research Centre – Institute for Prospective Technological Studies
Title: Analysis of the impact of Croatia's accession to the EU on the agri-food sectors. A focus on trade and agricultural policies.
Authors: Boulanger Pierre, Ferrari Emanuele, Michalek Jerzy, Vinyes Cristina
Luxembourg: Publications Office of the European Union
2013 – 41 pp. – 21.0 x 29.7 cm
EUR – Scientific and Technical Research series – ISSN 1831-9424 (online)
ISBN 978-92-79-28779-4 (pdf)
doi:10.2791/79648
Abstract
This report analyses the likely effects of Croatia's accession to the European Union (EU) on the agricultural and food sectors in terms of
trade, production, employment and GDP for Croatia, the EU-27 and their main trading partners. Using a multi-country Computable General
Equilibrium model (MAGNET) this study evaluates the impacts of the harmonisation of trade and agricultural policies that occur after this
enlargement on July 1st, 2013. The results show that both Croatia's GDP and employment will slightly increase. The main conclusions point
out significant market price effects as well as changes in trade patterns.

43
As the Commission’s in-house science service, the Joint Research Centre’s mission is to provide EU policies with independent, evidence-based scientific and technical support throughout the whole policy cycle. Working in close cooperation with policy Directorates-General, the JRC addresses key societal challenges while stimulating innovation through developing new standards, methods and tools, and sharing and transferring its know-how to the Member States and international community. Key policy areas include: environment and climate change; energy and transport; agriculture and food security; health and consumer protection; information society and digital agenda; safety and security including nuclear; all supported through a cross-cutting and multi-disciplinary approach.
LF-NA
-25
83
5-E
N-N