analysis of the impact of data normalization on cyber
TRANSCRIPT

Air Force Institute of TechnologyAFIT Scholar
Theses and Dissertations Student Graduate Works
3-22-2012
Analysis of the Impact of Data Normalization onCyber Event Correlation Query PerformanceSmile T. Ludovice
Follow this and additional works at: https://scholar.afit.edu/etd
Part of the Computer Sciences Commons, and the Systems Engineering Commons
This Thesis is brought to you for free and open access by the Student Graduate Works at AFIT Scholar. It has been accepted for inclusion in Theses andDissertations by an authorized administrator of AFIT Scholar. For more information, please contact [email protected].
Recommended CitationLudovice, Smile T., "Analysis of the Impact of Data Normalization on Cyber Event Correlation Query Performance" (2012). Thesesand Dissertations. 1275.https://scholar.afit.edu/etd/1275

ANALYSIS OF THE IMPACT OF DATA NORMALIZATION ON CYBER EVENT CORRELATION QUERY PERFORMANCE
THESIS
Smile T. Ludovice, Master Sergeant, USAF
AFIT/GIR/ENV/12-M03
DEPARTMENT OF THE AIR FORCE AIR UNIVERSITY
AIR FORCE INSTITUTE OF TECHNOLOGY
Wright-Patterson Air Force Base, Ohio
APPROVED FOR PUBLIC RELEASE; DISTRIBUTION UNLIMITED.

The views expressed in this thesis are those of the author and do not reflect the official
policy or position of the United States Air Force, Department of Defense, or the United
States Government. This material is declared a work of the United States Government
and is not subject to copyright protection in the United States.

AFIT/GIR/ENV/12-M03
ANALYSIS OF THE IMPACT OF DATA NORMALIZATION ON CYBER EVENT
CORRELATION QUERY PERFORMANCE
THESIS
Presented to the Faculty
Department of Systems and Engineering Management
Graduate School of Engineering and Management
Air Force Institute of Technology
Air University
Air Education and Training Command
In Partial Fulfillment of the Requirements for the
Degree of Master of Science in Information Resource Management
Smile T. Ludovice, BS
Master Sergeant, USAF
March 2012
APPROVED FOR PUBLIC RELEASE; DISTRIBUTION UNLIMITED.

AFIT/GIR/ENV/12-M03
ANALYSIS OF THE IMPACT OF DATA NORMALIZATION ON CYBER EVENT
CORRELATION QUERY PERFORMANCE
Smile T. Ludovice, BS Master Sergeant, USAF
Approved:
S I G N E D -- 8 Mar 12 __________________________________________ ______________ Michael R. Grimaila, PhD, CISM, CISSP (Chairman) Date
S I G N E D -- 8 Mar 12 __________________________________________ ______________ Robert F. Mills, PhD (Member) Date
S I G N E D -- 8 Mar 12 __________________________________________ ______________ Brent T. Langhals, LtCol, PhD (Member) Date

iv
AFIT/GIR/ENV/12-M03 Abstract
A critical capability required in the operation of cyberspace is the ability to maintain
situational awareness of the status of the infrastructure elements that comprise cyberspace.
Event logs from cyber devices can yield significant information, and when properly utilized can
provide timely situational awareness about the state of the cyber infrastructure. In addition,
proper Information Assurance requires the validation and verification of the integrity of results
generated by a commercial log analysis tool. Event log analysis can be performed using
relational databases. To enhance database query performance, previous literatures affirm
denormalization of databases; yet, database normalization can also increase query performance.
Database normalization improved majority of the queries performed using very large data sets of
router events; however, performance is also dependent on the type of query executed. Queries
performed faster on normalized table if all the necessary data are contained in the normalized
tables. Furthermore, database normalization improves table organization and maintains better
data consistency than non-normalized. Nonetheless, there are some tradeoffs when normalizing
a database such as additional preprocessing time and extra storage requirements though minimal
in this experiment. Overall, normalization improved query performance and must be considered
as an option when analyzing event logs using relational databases.

v
Acknowledgments
I would like to say many thanks to my thesis advisor, Dr. Michael Grimaila, for his
unwavering support, mentorship, and patience throughout many months school and research
effort. I would also like to thank Dr. Robert Mills and LtCol Brent Langhals for their guidance
and support. I would also like to send my appreciation to the Information Resource Management
program faculty and staff. Additionally, I want to acknowledge my fellow students and
classmates for their fellowship and camaraderie.
Thanks for the support from my friends and family. Most importantly, I would like to
say thank you to my wife for her love, support, and understanding all throughout this process.
She gave me all the strength and encouragement to successfully graduate while taking care of
our newborn son. It has been an awesome and unforgettable experience.
Smile T. Ludovice

vi
Table of Contents
Page
Abstract .......................................................................................................................................... iv
Acknowledgments............................................................................................................................v
Table of Contents ........................................................................................................................... vi
List of Figures ................................................................................................................................ ix
List of Tables ...................................................................................................................................x
List of Equations ........................................................................................................................... xii
I. Introduction .................................................................................................................................1
1.1 Research Motivation ..............................................................................................................1 1.2 Problem Statement .................................................................................................................2 1.3 Research Goals ......................................................................................................................3 1.4 Research Questions ................................................................................................................3 1.5 Scope, Assumptions, and Limitations ...................................................................................4 1.6 Thesis Overview ....................................................................................................................4
II. Literature Review .......................................................................................................................5
2.1 Chapter Overview ..................................................................................................................5 2.2 Event Logs .............................................................................................................................5
2.2.1 Types of Event Logs and Event Entries ......................................................................... 6 2.3 Current Standardization Effort ..............................................................................................7
2.3.1 Syslog Protocol .............................................................................................................. 7 2.3.2 Common Event Expression (CEE) ................................................................................ 9
2.4 Purpose of Event Logs .........................................................................................................11 2.5 Log Analysis of Security Incidents and Complexity ...........................................................13 2.6 Enhancing Situational Awareness, Information Assurance, and Mission Assurance .........15
2.6.1 Situational Awareness .................................................................................................. 15 2.6.2 Information Assurance ................................................................................................. 16 2.6.3 Mission Assurance ....................................................................................................... 18
2.7 Learning from Event Log Data ............................................................................................21 2.8 Event Correlation .................................................................................................................22 2.9 Database Normalization.......................................................................................................23
2.9.1 Steps in Normalization ................................................................................................. 24 2.9.2 Linking Normalized Tables ......................................................................................... 26
2.10 Data Warehousing .............................................................................................................27 2.11 Summary ............................................................................................................................29
III. Methodology ...........................................................................................................................30

vii
Page
3.1 Overview..............................................................................................................................30 3.2 Hardware and Database Configuration ................................................................................30 3.3 Overview of Steps in Normalization and Query Performance Analysis .............................31 3.4 Loading Event Logs and Table Normalization ....................................................................32
3.4.1 Parsing Event Logs ...................................................................................................... 32 3.4.2 Table Normalization with Index Table ........................................................................ 36 3.4.3 Table Normalization with Associative Tables ............................................................. 37
3.5 Event Log Database Queries ...............................................................................................39 3.6 Runtime Comparison of Normalized and Non-normalized Event Logs .............................44
3.6.1 Statistical Analysis ....................................................................................................... 45 3.6.2 Preprocessing and Disk Space Requirements .............................................................. 45
3.7 Summary ..............................................................................................................................47
IV. Results......................................................................................................................................48
4.1 Overview..............................................................................................................................48 4.2 Test Statistics Results ..........................................................................................................48 4.3 Query Performance Statistics ..............................................................................................52 4.4 Preprocessing of Normalized Tables ...................................................................................61
4.4.1 Preprocessing Time ...................................................................................................... 61 4.4.2 Disk Space Requirement .............................................................................................. 62
4.5 Statistical Query Results ......................................................................................................64 4.6 Summary ..............................................................................................................................64
V. Conclusion and Recommendations ..........................................................................................65
Chapter Overview ......................................................................................................................65 Conclusions of Research............................................................................................................65 Significance of Research ...........................................................................................................66 Recommendations for Action ....................................................................................................66 Recommendations for Future Research .....................................................................................68
APPENDIX A ................................................................................................................................69
APPENDIX B ................................................................................................................................70
APPENDIX C ................................................................................................................................71
APPENDIX D ..............................................................................................................................118
APPENDIX E ..............................................................................................................................121
APPENDIX F...............................................................................................................................122
APPENDIX G ..............................................................................................................................123

viii
Page
APPENDIX H ..............................................................................................................................124
APPENDIX I ...............................................................................................................................127
APPENDIX J ...............................................................................................................................128
APPENDIX K ..............................................................................................................................129
APPENDIX L ..............................................................................................................................131
APPENDIX M .............................................................................................................................147
APPENDIX N ..............................................................................................................................150
APPENDIX O ..............................................................................................................................152
APPENDIX P...............................................................................................................................156
APPENDIX Q ..............................................................................................................................161
APPENDIX R ..............................................................................................................................163
APPENDIX S...............................................................................................................................165
APPENDIX T ..............................................................................................................................169
APPENDIX U ..............................................................................................................................172
APPENDIX V ..............................................................................................................................179
Bibliography ................................................................................................................................184

ix
List of Figures
Page
Figure 1: CEE Architecture and Components ................................................................................9
Figure 2: Priority for Collecting Logs ..........................................................................................12
Figure 3: Threat Agents Yearly Trend by Percentage ..................................................................14
Figure 4: Six Steps in Normalization ............................................................................................27
Figure 5: Example of Mapping Tables with an Associative Entity ..............................................28
Figure 6: Structured and Unstructured Segments of a Cisco Router Log .....................................33
Figure 7: Sequence of File Executions .........................................................................................36
Figure 8: Visual Depiction of Normalized the Tables ..................................................................37
Figure 9: Table Structures of the Normalized Tables ...................................................................38
Figure 10: Table Structures of the Associative Tables .................................................................38
Figure 11: Example of Mapping the TBaseName_Link Associative Entity ................................39

x
List of Tables
Page
Table 1: Types of Event Logs .........................................................................................................7
Table 2: Core Fields ......................................................................................................................11
Table 3: Description of Files .........................................................................................................37
Table 4: Query Numbers and Purpose ..........................................................................................42
Table 5: SQL Queries ...................................................................................................................43
Table 6: Group Statistics ...............................................................................................................49
Table 7: Independent Samples Test ..............................................................................................51
Table 8: Q1 Statistics ....................................................................................................................52
Table 9: Q2 Statistics ....................................................................................................................53
Table 10: Q3 Statistics ..................................................................................................................53
Table 11: Q4 Statistics ..................................................................................................................54
Table 12: Q5 Statistics ..................................................................................................................54
Table 13: Q6 Statistics ..................................................................................................................55
Table 14: Q7 Statistics ..................................................................................................................55
Table 15: Q8 Statistics ..................................................................................................................56
Table 16: Q9 Statistics ..................................................................................................................56
Table 17: Q10 Statistics ................................................................................................................57
Table 18: Q11 Statistics ................................................................................................................57
Table 19: Q12 Statistics .................................................................................................................58
Table 20: Q13 Statistics ................................................................................................................59
Table 21: Q14 Statistics ................................................................................................................59

xi
Page
Table 22: Q15 Statistics ................................................................................................................60
Table 23: Types of Event Logs ......................................................................................................62
Table 24: Example Landscape Table ............................................................................................63

xii
List of Equations
Page
Equation 1 ..................................................................................................................................... 46
Equation 2 ..................................................................................................................................... 46
Equation 3 ..................................................................................................................................... 46
Equation 4 ..................................................................................................................................... 46

1
ANALYSIS OF THE IMPACT OF DATA NORMALIZATION ON CYBER EVENT CORRELATION QUERY PERFORMANCE
I. Introduction
1.1 Research Motivation
Virtually all modern organizations depend on Information and Communication
technologies (ICT), collectively called “cyberspace”, to accomplish their core mission processes.
The United States (US) Department of Defense (DoD) uses cyberspace to conduct all aspects of
military operations. The United States Air Force (USAF) is tasked to support the DoD
cyberspace effort and provides a wide variety of cyber capabilities to the Joint Force Commander
(JFC) (Donley & Schwartz, 2009). A critical capability required in the operation of cyberspace
is the ability to maintain situational awareness of the status of the infrastructure elements (e.g.,
routers, intrusion detection systems, intrusion prevention systems, firewalls, VPNs, switches,
desktop systems, servers) that comprise cyberspace. Event logs from cyber devices can yield
significant information, and when properly stored, processed, and analyzed can provide timely
situational awareness about the state of the cyber infrastructure. In addition, the ability to
monitor cyber devices across multiple locations provides the ability to identify distributed attacks
that may be missed when only viewing event logs from a single geographic location (Grimaila et
al., 2011).
In cyberspace, situational awareness requires the ability to sense, understand the sensed
data, and use it to determine future actions (Okolica et al., 2009). Cyberspace is an attractive
unconventional domain for many nation states, terrorists, and hackers; as such, mission
assurance in cyberspace is vital. For this reason, data gathered from event logs supports
Information Assurance and Mission Assurance. Mission Assurance is critical to military
strategies because it links several risk management programs including Information Assurance to

2
assure mission success (DoDD, 2010, p.19). Recent empirical studies have shown organizations
are beginning to realize the importance of event logs to diagnose error and identify malicious
activities (Shenk, 2009; Shenk, 2010). While the number of organizations with network event
log database servers has steadily grown in the past few years, the top two reported challenges in
exploiting the value of event logs are “Searching through Data” and “Analysis and Reports”
(Shenk, 2010, p. 5). Difficulties in the implementation and maintenance of an event log analysis
capability cause many organizations to under utilize their existing event logs (Baker et al., 2011).
The USAF is not impervious to these log management challenges. Each day, millions of events
are generated in USAF networks and are transported to centralized log servers where they are
stored, processed, and analyzed to extract actionable information. Analysis methods must be
carefully chosen as the number of stored events continues to grow monotonically. To exacerbate
the situation, there is no standard for the storage of event logs, which explicitly enumerates all of
the data elements present in event log that makes storage and analysis less efficient.
1.2 Problem Statement
In order to maintain situational awareness of the network, everyday USAF organizations
must collect, transport, store, process, and analyze millions of events generated by cyber devices
with limited resources. Analyzing millions of event logs can be cumbersome, inefficient, and
resource intensive (Myers, 2010). For historical and intensive analysis, event logs are captured
and stored in relational databases. Log analysts can then use database queries to conduct event
correlation and search for actionable information. The logs must be analyzed in a timely manner
and archived accordingly to save disk space. The efficient creation, storage, processing, and
dissemination of log events are essential. Currently, the USAF employs commercial log analysis
tools, which require large yearly licensing fees. However, proper Information Assurance

3
requires the validation and verification of the integrity of results generated by a commercial log
analysis tool. To this end, organizations can use a relational database to collect and analyze
event log data to provide the ability to validate results generated by commercial tools without
paying additional licensing fees.
1.3 Research Goals
The primary goal of this research is to determine the impact of database normalization on
database query performance in the context of analyzing events logs generated by routers in
USAF networks. A study will be conducted to compare query performance between a non-
normalized database and a normalized database containing the same data for a set of
representative simple and complex queries that would typically be conducted by network
security personnel. The secondary objective of this research is to provide recommendations on
when normalization should be used based upon tradeoffs in time, storage space, and query
performance.
1.4 Research Questions
There are three primary research questions addressed in this thesis:
1) What standards exist for the generation, transport, storage, and analysis of event log
data for security analysis?
2) How does database normalization impact query performance when using very large
data sets (over 30 million) of router events?
3) What are the tradeoffs between using a normalized versus non-normalized database in
terms of preprocessing time, query performance, storage requirements, and database
consistency?

4
1.5 Scope, Assumptions, and Limitations
The scope of this research is limited to the analysis of router event logs provided
collected in the Integrated Network Operations and Security Center West (INOSC-W) network
from October 2010 to March 2011. A limitation of this work is that it deals only with router
event logs, which is just one of many types of cyber event logs. Another limitation of the study
is that it uses to a fixed number of events during the analysis. This resulted from a delay in
developing and implementing the normalized database and queries. It is believed that increasing
or decreasing the number of events in the database could yield dramatically different results.
1.6 Thesis Overview
This chapter describes the goals of this research and motivates the need for understanding
how query performance is impacted by database normalization. Chapter 2 reviews background
literature in the areas of event log management, event correlation, and the technologies being
used to conduct the research. Chapter 3 presents the experimental design and the methodology
used for conducting analysis of that design. Chapter 4 describes the results of the experiment
and provides an analysis of those results. Finally, Chapter 5 presents the conclusions of the
research, recommendation for action, and recommendations on future research.

5
II. Literature Review
2.1 Chapter Overview
In this chapter, the literature relevant to the research objective will be reviewed.
Specifically, the subject of event logs and event correlation will be explored, and a review of
database performance will be covered.
2.2 Event Logs
Event logs also known as audit trails, log files, audit logs, data logs are text streams
recorded from information systems that contain a combination of the following data: timestamp,
event number, type, source, destination, user identification, and message of the event that
occurred (MITRE, 2010a; MITRE, 2010b). Initially, event logs were used as an industrial tool
for monitoring, troubleshooting, and maintenance of machines. It was a source of information to
diagnose internal technical issues without much added benefit for the enterprise network and
organization as a whole (Sah, 2002). In 1973, the DoD issued an Automatic Data Processing
(ADP) Security Manual specifically for protecting classified systems which required
maintenance of audit log or file that records the historical use of ADP systems; this allowed
administrators to regularly inspect system activities (Department of Defense, 1973). A 1980
technical report began to considered computer logs as a tool to monitor and audit security
incidents (Anderson, 1980). During the same period, event correlations in combination with
other techniques were used in artificial intelligence. Today, organizations value event logs for
more than just a passive diagnostic tool; it is a security and an operational asset (Shenk, 2010).
The advances in computer technology, techniques, and the amount of computer logs that can be
collected presents a prime opportunity to analyze and learn from multiple event logs with
millions of data using an effective and efficient methodology.

6
Essentially, there is no agreed upon format or industry standard for event logs as seen on
the examples below, which makes it more difficult to analyze (MITRE, 2010). There are some
similarities in the type of data however, for the most part each device or manufacturer has its
own format and type of fields in their event logs.
Example of Cisco of event log (Cisco Understanding, 2011)
*May 1 22:12:13.243: %SEC-6-IPACCESSLOGP: list ACL-IPv4-E0/0-IN permitted tcp 192.168.1.3(1024) -> 192.168.2.1(22), 1 packet *May 1 22:17:16.647: %SEC-6-IPACCESSLOGP: list ACL-IPv4-E0/0-IN permitted tcp 192.168.1.3(1024) -> 192.168.2.1(22), 9 packets *May 3 19:08:23.027: %IPV6-6-ACCESSLOGP: list ACL-IPv6-E0/0-IN/10 permitted tcp 2001:DB8::3(1028) (Ethernet0/0 000e.9b5a.9839) -> 2001:DB8:1000::1(22), 1 packet *May 3 19:13:32.619: %IPV6-6-ACCESSLOGP: list ACL-IPv6-E0/0-IN/10 permitted tcp 2001:DB8::3(1028) (Ethernet0/0 000e.9b5a.9839) -> 2001:DB8:1000::1(22), 9 packets
Example of Microsoft Windows Firewall (Microsoft, 2011)
2005-04-11 08:05:57 DROP UDP 123.45.678.90 123.456.78.255 137 137 78 - - - - - - - RECEIVE 2005-04-11 08:05:57 DROP UDP 123.45.678.90 255.255.255.255 1631 2234 37 - - - - - - - RECEIVE 2005-04-11 08:05:58 OPEN UDP 123.45.678.90 123.456.78.90 500 500 - - - - - - - - - 2005-04-11 08:05:58 DROP UDP 123.45.678.90 123.456.78.255 138 138 299 - - - - - - - RECEIVE 2005-04-11 08:06:02 CLOSE UDP 123.45.678.90 123.456.78.90 1027 53 - - - - - - - - - 2005-04-11 08:06:02 CLOSE UDP 123.45.678.90 123.456.78.90 137 137 - - - - - - - - - 2005-04-11 08:06:05 DROP UDP 0.0.0.0 255.255.255.255 68 67 328 - - - - - - - RECEIVE
Example of Blue Coat Firewall event log (Blue Coat, 2011)
2011-01-18 02:32:22+07:00ICT "Access Log (main): Unable to connect to remote server for log uploading" 0 E0008:1 ../alog_facility_impl.cpp:2726 2011-01-18 02:33:21+07:00ICT "Access Log FTP (main): Connecting to primary 192.168.4.66 server 192.168.4.66:21." 0 E0000:96 ../alog_ftp_client.cpp:110 2011-01-18 02:33:39+07:00ICT "Snapshot sysinfo_stats_2min has fetched /sysinfo-stats" 0 2D0006:96 ../snapshot_worker.cpp:214 2011-01-18 02:33:39+07:00ICT "Snapshot CPU_Monitor has fetched /Diagnostics/CPU_Monitor/Statistics/Advanced" 0 2D0006:96 ../snapshot_worker.cpp:214 2011-01-18 02:34:36+07:00ICT "Access Log FTP (main): Couldn't connect control socket to primary server 192.168.4.66" 3C E000A:1 ../alog_ftp_client.cpp:155
2.2.1 Types of Event Logs and Event Entries
There are several types of cyber event logs including, computers, servers, routers,
firewalls, and intrusion detection systems. Each device can potentially capture and record events

7
into a file or log. Table 1 lists the different types of event logs, examples, and types of log
entries and functions.
Table 1. Types of Event Logs (MITRE, 2010; Hucaby, 2005; Microsoft Types, 2011)
Common Types of Event Logs Examples Log Entry Types/Functions
Computer Personal computers, portable devices
Application, Security, System
Servers Web servers, Email, Database, Domain
Application, Security, System, Directory Service, DNS Server, File Service
Network Layer Devices Routers, Switches Alert, Warning, Error, Information
Network Security Devices Firewalls, Intrusion Detection Systems
Allow and Deny Audit, Protocol usage, Traffic Log
2.3 Current Standardization Effort
2.3.1 Syslog Protocol
The creation of the syslog daemon and protocol is largely credited to Eric Allman of
Sendmail and originally described in Request for Comments (RFC) 3164 The Berkley Software
Distribution (BSD) syslog Protocol by the Internet Engineering Task Force (IETF) (Lonvick,
2001). RFC 3164 was categorized for informational purposes but has become the de-facto
standard (Lonvick, 2001). The protocol allowed the transmission of event logs across IP
networks to syslog servers. The simplicity of the protocol allowed programmers to write codes
independently with no strict requirements on the type of source or format of the message.
Simplicity is one of the reasons for its wide acceptance among industry leaders (Lonvick, 2001).
Cisco Systems is one of the companies that have leniently adopted the syslog protocol.

8
However, the flexibility of the protocol resulted in divergent formats that make correlation and
analysis challenging for administrators.
The Syslog Protocol RFC 5424, which superseded RFC 3164, is a document in a
Proposed Standard status of the IETF as opposed to informational (Gerhards, 2009). Although
the BSD syslog protocol became a de-facto standard, it was never formalized. Actual industry
implementations have many different variations for every platform (Gerhards, 2009). RFC 5424
provides a foundation for standard syslog format and transport methods using layered
architecture. The three syslog conceptual layers are content, application, and transport. This
research is primarily concerned with the content layer and to some extent the application layer.
The syslog content layer deals with the “information contained in the syslog message”
(Gerhards, 2009, p. 4) while the syslog application layer “handles generation, interpretation,
routing, and storage of syslog message” (Gerhards, 2009, p. 4). Furthermore, the transport layer
in RFC 3164 recommended utilizing user datagram protocol (UDP) port 514 could now use any
transport protocol and port number as long as it does not alter the content. Another addition in
RFC 5424 is a mechanism for structured-data that enable “easily parseable and interpretable data
format” (Gerhards, 2009, p. 15). Some of the challenges when storing, sorting, and querying
event logs are being able to efficiently and accurately parse the different data elements.
Structured-data provides a standard format with vital meta-information in the log message such
as IP addresses or event ID for efficient parsing. In addition to structured information format, it
also permits vendor specific extensions and free-form text. RFC 5424 also provides flexibility to
reformat contents for backwards compatibility with RFC 3164. In general, log messages
compliant to RFC 5424 should be consistent and contain distinct field separations that are easily
parseable.

9
2.3.2 Common Event Expression (CEE)
Other organizations such as MITRE, a non-profit entity that receives sponsorships from
government agencies and private enterprises, had also initiated log standardization effort known
as CEE. The goal of CEE’s architecture is to provide a foundation for “standardizing the
creation and interpretation” of event logs particularly from computers and sensors (MITRE,
2010c, p. 4). A similar goal between RFC 5424 and CEE is to make parsing of event logs
simple. Figure 1 shows the CEE architecture and components; the bidirectional arrows represent
the ability not only to generate event logs but also to recreate the events based on the logs.
Figure 1. CEE Architecture and Components (MITRE, 2010c)
Four major components transform an event into a log and vice versa. Common Event Log
Recommendations (CELR) provides recommendations on which events should be recorded and
the type of situations it should be recorded. CEE Dictionary and Taxonomy (CDET) defines the
event terminology such as field names and value types in the dictionary while taxonomy contains
a collection of categories of events that provide common vocabulary and similarity of events.
Common Log Syntax (CLS) describes the representation of the event and event data when it is
produced by the source and processed by the event consumer. Finally, the Common Log

10
Transport (CLT) provides specific guidance for reliable and secure transport of the log. CEE has
identified six core fields, shown in Table 2, that are common to most logs; these are pre-defined
fields to make processing simpler. Each CEE compliant event log must have all the fields
specified. However, there could be cases where one or more fields do not have a value; in such
cases, the field should represent a null value (Heinbockel, 2011). In Cisco logs, the ID, time,
action, status, and p_sys_id fields are most common while the p_prod_id field is less common.
RFC 5424 and CEE are possible standards that future event logs should comply with to make
generation, transmission, storage, and analysis more efficient.
Table 2. Core Fields (Heinbockel, 2011; Heinbockel & Graves, 2011)
Field Field Type Description
id string Event ID
time timestamp Event start time
action tag Primary action of the event
status tag Result of the event action
p_sys_id string ID of the producing system
p_prod_id string ID of the producing product

11
2.4 Purpose of Event Logs
The National Institute of Standards and Technology (NIST), underscore the importance
of event logs when investigating security incidents, fraud, policy breach, and auditing just to
name a few (Kent & Souppaya, 2006). Federal law and regulations such as the Federal
Information Security Management Act of 2002 (FISMA), the Health Insurance Portability and
Accountability Act of 1996 (HIPAA), the Sarbanes-Oxley Act of 2002 (SOX), the Gramm-
Leach-Bliley Act (GLBA), and the Payment Card Industry Data Security Standard (PCI DSS)
require organizations to “store and analyze certain logs” few (Kent & Souppaya, 2006, p. 2-11).
Furthermore, in the private sector, a 2006 report from a key organization in information security
underlines five essential log reports: failed attempts to gain access through existing accounts,
failed file access attempts, unauthorized changes, systems that are most vulnerable to attack, and
suspicious or unauthorized network traffic patterns (Brenton, Bird, & Ranum, 2006). In a 2010
survey shown in Figure 2 of over 500 organizations of different sizes and information technology
budgets, showed that 63% would like to use logs to “Detect/prevent unauthorized access and
insider abuse” as their top priority. The second highest objectives which are all statistically tied
at 40% include, “Meet regulatory requirements”, “Forensic analysis and correlation”, and
“Ensure Regulatory Compliance” (Shenk, 2010, p. 4). These reports show that network security
and compliance are top priorities for most organizations and they believe that event logs can be a
very useful tool for this. In fact, an overwhelming number of the respondents (91%) suggest that
logs were “useful or very useful for tracking suspicious behavior”. Regardless of this optimistic
view of event logs’ usefulness, many still believe that searching and analyzing logs can be better.
Thirty-six percent believe that “Searching through data” is cumbersome and 32% view “Analysis

12
and reports (and ability to interpret results)” as very challenging, both ranking as the top
obstacles (Shenk, 2010, p. 4).
Figure 2. Priority for Collecting Logs (Shenk, 2010, p. 4)
There are several propriety solutions and services for event log management and analysis
being offered presently. According to a review, leading hardware and software solutions for log
management are NitroSecurity NitroView, ArcSight Logger, and LogRhythm, which varies in
prices starting from $20,000 up to $40,000 for an initial price (Grimes, 2010). The pros and cons
vary and it depends on the organization’s goal and structure, which one fits them better. The
USAF is currently using ArcSight as its log management tool and the licensing price could cost
millions of dollars. There should be alternatives that are less expensive yet simple tools for
analyzing event logs.

13
2.5 Log Analysis of Security Incidents and Complexity
In a 2010 joint study by the U.S. Secret Service (USSS) and Verizon involving 761
investigated reports of network security breaches, found that 3.8 million known records were
compromised (Baker et al., 2011). The study showed an exponential increase on the number of
breaches based on previous years although there was a significant drop in the number of
compromised data. The study could not conclusively pinpoint the reasons for this phenomenon.
Figure 3 suggest that external threat had steadily increased according to the Verizon data and it
significantly increased according to the USSS data from 2007 to 2010. Organized criminals
mostly perpetrated the external threats based on the report. Additionally, investigators found that
the number of unknown external attacks decreased, mostly in part, because larger organizations
who managed their event logs adequately allowed the authorities to identify and prosecute the
perpetrators. On the other hand, smaller companies who did not or could not keep sufficient log
data were unsuccessful in identifying the attackers (Baker et al., 2011). Events logs added
another tool that standard forensic methods would have missed. This report highlighted the
importance of external security threats, why event logs are important in mitigating these risks,
and potentially learning new information from the logs.

14
Figure 3. Threat Agents Yearly Trend by Percentage (Baker et al., 2011)
Each device on the network can produce hundreds of thousands of audit logs a day. A
large organization with several firewalls, routers, and servers can easily generate hundreds of
gigabytes a day. Sifting through this enormous amount of data can be a daunting task this is why
an earlier study found that over 60% of the respondents consider either “Searching through data”
or “Analysis and Reports” as the first or second most challenging tasks for them (Shenk, 2010, p.
4). The NIST Guide to Computer Security Log Management enumerated many of the challenges
in log management; the three main categories are log generation and storage, log protection, and
log analysis (Kent, & Souppaya, 2006). This research focuses on log analysis; however, the
techniques also address some aspects of the other two categories. One of the main challenges in
log analysis for administrators is that they do not have the proper tools to efficiently analyze
security incidents and threats. Moreover, this additional task is not the most glamorous job, and
administrators would rather perform other maintenance and troubleshooting duties (Kent, &

15
Souppaya, 2006). A simple and efficient process should make log analysis quick and easy.
Additionally, when more logs are accumulated the more complicated analysis becomes, thus
necessitating better methods (Kent, & Souppaya, 2006). Many of the current log analysis
techniques are insufficient such as using predefined algorithms, frequent patterns, and algorithms
that ignore patterns other than event types (Vaarandi, 2002). Based on the studies and surveys
discussed previously, organizations have ample reasons to invest in event logs to improve
information security, decision-making, and more importantly mission accomplishment.
2.6 Enhancing Situational Awareness, Information Assurance, and Mission Assurance
2.6.1 Situational Awareness
Situational awareness is “the perception of elements in the environment within a volume
of time and space, the comprehension of their meaning, and the projection of their status in the
near future” according to Endsley (1995, p. 1; Okolica et al., 2009, p. 47). A cyber situational
awareness system must be able to sense the situation, interpret the sense data, and predict future
outcome (Okolica et al., 2009, p. 47). To understand the sense data, the system depends on
several types of event logs to construct a known “insider threat” profile, for example (Okolica et
al,. 2009, p. 47). Moreover, in Information Assurance, a process called System Security
Engineering and Assurance (SSEA) involves managing complex interrelations between
engineering, situational awareness, and maintenance (Capitan, 2008). SSEA combines mission
assurance, information assurance, and security through systems engineering concepts (Capitan,
2008, p. 7). Using the systems engineering approach, event logs will provide better situational
awareness hence improving both mission and information assurance. Archiving event logs in
data warehouses could provide long-term use throughout the system’s development life cycle.
There could be several situations where more information is needed in the future, management
16
may come up with new questions, and network security personnel will have to retrieve archived
event logs. In each case, proactively searching for valuable knowledge in a stack of logs remains
challenging. Information systems personnel in general, could use built-in reporting templates or
the Top 10 list of well-known security profiles to create an executive summary for upper
management and later build on this report based on management and user feedback (Babbin,
2006, p. 16). There are tools and methods available to create standard and management-level
reports that show the effectiveness of the security policies using event logs (Babbin, 2006, pg.
32). Management normally would require metrics and statistical data when new network
security investments are needed or immediately after a new installation. Event logs can
significantly contribute to management’s cyber situational awareness through information
system reports and feedback. Information Assurance personnel can provide reports to
management on the effectiveness of the organization’s security investment and policies by
utilizing event logs. Event logs when properly utilized contributes to better situational awareness
for the operators, leadership, and upper management.
2.6.2 Information Assurance
Information Assurance and information security are similarly defined in the Committee
on National Security Systems (CNSS) National Information Assurance Glossary (2010) and
include the three tenets of information namely confidentiality, integrity, and availability (CIA).
Information Assurance is defined as “measures that protect and defend information and
information systems by ensuring their availability, integrity, authentication, confidentiality, and
non-repudiation. These measures include providing for restoration of information systems by
incorporating protection, detection, and reaction capabilities.” (CNSS, 2010, p. 35) Information
security, likewise, is defined as “the protection of information and information systems from

17
unauthorized access, use, disclosure, disruption, modification, or destruction in order to provide
confidentiality, integrity, and availability.” (CNSS, 2010, p. 37) Both definitions highlight three
tenets of information. In most cases, the value of information as an asset depends upon
maintaining its CIA (Pipkin, 2000, p. 14). Specifically, confidentiality is an Information
Assurance attribute that limits access to those individuals or organizations on a need to know
basis; integrity or accuracy of information guarantees that it is correct and has not been tampered
with; and availability is access to information when and where it is needed (Pipkin, 2000, p. 14).
The value of event logs evolved from being just a passive diagnostic tool to a more
valuable network security and operational asset (Shenk, 2010). Event logs today, can play a
major role in the quality on each of the CIA attributes if manage properly. Confidentiality
requires limiting access to information; event logs can record important information and track
timestamps, usernames, IP addresses, port numbers, protocols, and whether access was permitted
or denied. This information, if properly managed, can provide investigators valuable clues if
someone tried to access a resource without proper authority. The integrity of information
depends on two major components: known good source and accuracy of data (Pipkin, 2000, p.
14). Event logs support the first component of integrity by identifying the source such as the
username, IP address, process, and product that produced the information. This is not a
foolproof process; however, it can still provide valuable knowledge. The accuracy of the
information, similarly, can be verified using event logs by recording modifications,
transmissions, and storage of files. Accuracy can also be protected using the “tripwire”
technique by creating and securely storing hash values of critical files. The hash value of each
file is unique; hence, it can then be calculated and compared to the original value in a consistent
manner to detect any unauthorized modifications. The tripwire methodology also produces logs
18
that records important events that can be analyzed for additional information (Tripwire, 2011).
Availability is another attribute of Information Assurance which is arguably the most difficult to
ensure because it involves wide range of resources and most of them may not be under the
control of a single organization (Pipkin, 2000, p. 149). Availability means providing
accessibility and usability of information to authorized personnel wherever and whenever
requested. To maintain a high level of availability, an organization must prevent outages
especially unscheduled interruptions such as long-lasting equipment failures. Network devices
normally produce event logs that warn the administrator of an impending failure. For example,
error messages could be generated stating if a fan is malfunctioning on a critical router. Total
outage and lengthy downtime could be avoided if the hardware is repaired on time. Proper
monitoring of event logs will avoid lengthy downtime. Another concern for information systems
availability is Denial of Service (DOS) attack, which could be both intentional and unintentional.
In a DOS attack, event logs can record the source of attack and assist investigators in finding and
possibly prosecuting the perpetrators. Unintentional DOS attack can also be monitored and
detected in different ways depending on its source.
2.6.3 Mission Assurance
The heavy dependence of the United States military on information systems in
accomplishing its goals and objectives makes it vulnerable to attacks from cyberspace. In
today’s modern warfare, cyberspace is an attractive unconventional domain for many nation
states, terrorists, and hackers; as such, mission assurance in cyber domain is vital. Some authors
described cyberspace as the “center of gravity” because of the reliance of mission essential
functions on its capabilities (Jabbour & Mucio, 2011, pg. 62). Mission assurance is critical to
military strategies because it links several risk management programs including Information

19
Assurance (DoDD, 2010, p.19). As discussed previously, proper event log management can lead
to effective Information Assurance and therefore enhance mission assurance.
There are several definitions for mission assurance, which varies upon on the individual
or organization’s perspective. One definition by Alberts and Dorofee (2005, pg. 23) from a
Carnegie Mellon University, defines mission assurance as “establishing a reasonable degree of
confidence in mission success.” According to the authors, it is not an on/off binary aspect, but
rather, a continuous attribute that range from guaranteed failure to guaranteed success. The DoD
defines Mission Assurance as “a process to ensure that assigned tasks or duties can be performed
in accordance with the intended purpose or plan. It is a summation of the activities and measures
taken to ensure that required capabilities and all supporting infrastructures are available to the
Department of Defense to carry out the National Military Strategy.” (DoDD, 2010, p.19)
Some authors suggest that traditional engineering focuses more on building complex
systems that perform in a tolerant cyber environment; however, these systems fail when
operating in a hostile environment (Jabbour & Mucio, 2011, pg. 63). Yet, this is the type of
cyber warfare domain where the military is expected to operate. A reliable system does not
equal a secure system especially in a hostile environment (Jabbour & Mucio, 2011, pg. 64). Risk
is considered the loss of any of the three attributes of Information Assurance, namely,
confidentiality, integrity, and availability of information (CNSS, 2010, p. 61); it is also the
intersection of threat, vulnerability, and resource. Jabbour and Mucio (2011, p. 64) suggest that
threat and vulnerability are dependent variables hence “there is no threat without vulnerability.”
Cyber security should therefore focus more on the vulnerabilities rather than the threat (Jabbour
& Mucio, 2011, pg. 64). This may sound like a noble idea, however, vulnerabilities in software
with millions of codes and hardware from thousands of manufacturers are difficult to avoid.

20
Nevertheless, developers have more control over limiting vulnerabilities on their products than
the threats coming from hackers, terrorists, nation states, and criminals. Moreover, event logs
can be useful both in limiting vulnerabilities and in detecting threats.
It is important to record and document events throughout the life cycle of information
systems in order to maintain mission assurance. In today’s military operations, most missions
depend on cyberspace to attain a level of confidence for a successful mission. Jabbour and
Mucio (2011) proposed 13 rules for building and designing future secure systems and a four-step
methodology for already existing systems. In the 13 rules they proposed, event logs could be
very useful for generation, processing, storage, communication, consumption, and destruction.
Each stage could produce substantial amount of logs for documentation and analysis that could
enhance system design, operation, and maintenance. The four-step stopgap methodology for
existing systems includes prioritization, mission mapping, vulnerability assessment, mitigation,
and an optional red teaming. Likewise, all these steps would benefit from proper use of event
logs particularly in mission mapping, vulnerability assessment, and threat mitigation. Mission
mapping identifies the military missions dependent on the functionality of cyber processes as
well as their internal and external interactions with other processes (Jabbour & Mucio, 2011, pg
69). More specifically, event logs can be valuable in two particular steps, identifying “all data
communication among cyber processes” and documenting “the data format, speed, and protocol
for each data communication”. In vulnerability assessment, event logs perform a major role
during identification, documentation, and estimation of vulnerabilities. Additionally, event logs
are also valuable in threat mitigation during threat identification and intrusion detection.
Event logs can be very instrumental tools to enhancing situational awareness, Information
Assurance, and mission assurance. However, one must realize that raw event logs are simply

21
data generated by information systems. At present, system managers still need to collect,
correlate, and analyze these logs to get meaningful information from them and possibly gain
knowledge. Understanding how raw log data can turn into actionable information and useful
knowledge is essential to analyzing event logs.
2.7 Learning from Event Log Data
Computer systems use event logs to communicate to the users. Presently however, raw
log data are still difficult to comprehend. Computers are still far from communicating system
events in non-technical human understandable form. Event logs currently produced by most
computers are nothing more than data. Davenport and Prusak (2000) defined data as “a set of
discrete, objective facts about events” (p. 2). It is raw numbers, facts, and “a structured records
of transactions” (Davenport & Prusak, 2000, p. 2; Alavi & Leidner, 2001). Computer logs by
itself do not mean anything unless someone adds context to it. When context and structure is
combined with facts, it turns into information (Tuomi, 2000). Information gathered from a
single event log or even a collection of logs may still be insufficient to form a broader situational
awareness of an organization’s network. When a person or an analyst personally processes the
information in his or her mind using concepts, procedures, understandings, experiences,
judgments and given meaning then it becomes knowledge (Alavi & Leidner, 2001; Davenport &
Prusak, 2000; Tuomi, 2000). Therefore, to effectively analyze these event logs and form
actionable knowledge one should be mindful of these elements and their distinctions.
Consequently, organizations should realize that current log analysis tools and technologies could
only achieve so much. At some point personalized human knowledge and analysis of data that is
beyond any computer or analytical technique becomes critical. Analyst must understand the
organization’s mission in order to gain a better understanding of the log data. Organizations who

22
over emphasize and set excessive expectations from these tools often leads disappointment
(Davenport & Prusak, 2000; Feld & Stoddard, 2004; Van den Hoven, 2001). This could a reason
why majority of organizations in the surveys, who after millions of dollars and years of investing
in log management systems, still find analyzing data very challenging. Despite these challenges,
information technology systems are still critical enablers in managing data and information to
most organizations (Alavi & Leidner, 2001).
2.8 Event Correlation
Event correlation is the process of discovering the relationship between events for the
purpose of finding the source of a fault and sorting out unnecessary information (Grimaila, et al.,
2011; Hasan, Sugla, & Viswanathan, 1999). It is dependent on event-based management model
were the system translate relevant information into form of events (Lee, 1995). Event correlators
had become popular tools for managing complex enterprise network (Jakobson, Weissman,
Brenner, Lafond, & Matheus, 2000). In the past, the main function of audit logs data
communications network was for investigating faults and outages (Jakobson et al., 2000). A
large organization would normally have several hundreds if not thousands of network devices
that generates event logs. Event correlation can potentially make it simpler to digest all the
different information. At present, log correlation can be used in tracing and discovering network
security incidents. This technique in addition to case-based reasoning had also been proposed to
assist in battlefield management, specifically in military planning and operations where
situations are often fluid (Lee, 1995). In large networks were faulty equipments can produce
large amount of logs in a short amount of time flooding the network, in these conditions event
correlations can filter the data (Vaarandi, 2002). Obviously, event correlation provides

23
administrator with better knowledge of the status of an organization’s network (Grimaila, et al.,
2011).
2.9 Database Normalization
One of the fundamental first steps in learning and mining for information in databases is
data normalization (Ogasawara, 2010). It is a process of refining the raw data sequentially into
well-structured relations devoid of all the anomalies (Hoffer et al., 2009; Sanders, & Shin, 2001).
According to Hoffer et al. (2009), these are the main reasons for normalization:
1. Minimize data redundancy, thereby avoiding anomalies and conserving storage space. 2. Simplify the enforcement of referential integrity constraints 3. Make it easier to maintain data 4. Provide a better design that is an improved representation of the real world and a
stronger basis for future growth. (p. 226) Event logs are collected non-normalized without any well-defined structures, therefore
redundancy and anomalies exist making analysis less efficient and more complex. This also
adds to the difficulty of maintaining data. The lack of structure and standardization make mining
and correlating data more challenging (MITRE, 2010c). Normalization takes several steps when
filtering all the dependencies until all the anomalies are gone (see Figure 4).
Nonetheless, there are some drawbacks to normalization. Firstly, writing the queries will
be more complex thus reducing the ease of use (Sanders, & Shin, 2001). Typically, whenever
the number of tables increases, so as the number of joins and possibly the number of sub-queries,
this makes queries more complicated. Secondly, normalization reduces system performance
because of added query processing (Hoffer et al., 2009; Lee, 1995; Sanders, & Shin, 2001;
Westland, 1992). This could be particularly true when the amount of data stored and being
retrieved is relatively small (Westland, 1992). Hoffer et al., (2009) cited a report by William H.
Inmon, which showed that fully normalized tables performed slower. However, the highest

24
number of rows contained in each of the eight normalized tables in the study was only 50,000. If
the amount of data being queried is rather large, it could be that query performance of
normalized table will outperform non-normalized. Smaller normalized tables can be queried
using SQL joins. According to Plivna (2008) databases are designed to handle joins very
efficiently. Relational databases are also known for its power when processing multiple tables
(Hoffer et al., 2009) such as in SQL queries.
Some database administrators may prefer the denormalized form. Denormalization is
defined as “the process of transforming normalized relations into unnormalized physical record
specifications” (Hoffer et al., 2009, p. 266). The idea is to reduce the number of tables and
consequently the number of joins when writing queries. This research does not consider
denormalization because it can only optimize certain queries but sacrifices the performance of
others (Hoffer et al., 2009). Additionally, if for some reason the most frequently used query
changes, then the tables will have to be denormalized again or the performance advantage will no
longer apply. Further, developing or finding the most frequently used queries for event logs now
can be short sighted as this list can change whenever new demands or threats come up which will
make database maintenance complex and time consuming.
2.9.1 Steps in Normalization
There are seven identified forms of normalization: first normal form (1NF), second
normal form (2NF), third normal form (3NF), Boyce-Codd normal form (BCNF), and fourth
normal form (4NF) as shown in Figure 4. The fifth normal form (5NF) and Domain-Key
Normal Form (DKNF) are mentioned but not discussed in this paper. The goal in each step is to
remove anomalies and dependencies. The first step is to remove multivalued attributes in a table
in order to be considered in 1NF. Each cell in the table should only have one value and there are

25
no duplicate rows. To move into the 2NF, a table must not have any partial dependencies.
Partial functional dependency is “a functional dependency in which one or more nonkey
attributes are functionally dependent on part (but not all) of the primary key” (Hoffer et al., 2009,
p. 233). Each nonkey attribute must be fully dependent on one primary key. The next step is
3NF; where in all transitive dependencies must be removed. A transitive dependency is a
functional dependency of attributes to another attribute that is not the primary key. A quicker
way to achieve 3NF is to create tables based on functional dependencies of determinants (Hoffer
et al., 2009). After a table is in 3NF anomalies can still exist when there is more than one
candidate key. The BCNF proposed by R. F. Boyce and E. F. Codd, makes certain that every
determinant in the table is a candidate key. A determinant is an attribute that other attributes are
functionally dependent on. For example, a person’s name, address, and birthdate are
functionally dependent on the Social Security Number. A candidate key is an attribute that is
unique and nonredundant (Hoffer et al., 2009). The final normalization step discussed in this
paper is the 4NF. This phase ensures that there are no multivalued dependencies in a table
(Wyllys, 2010). To comply with this step, the attributes with multivalued dependencies should
be stored in separate tables; otherwise, the table will contain redundant information that can
cause anomalies and confusion. Some authors consider tables in 3NF to be satisfactory for
databases used in most practical applications (Hoffer et al., 2009, p. 651) while Wyllys (2010)
consider 4NF sufficient in practice. The last two normalization steps, 5NF and DKNF, are not
discussed, mainly because the 5NF is difficult to define and has little practical value (Hoffer et
al., 2009; Wyllys, 2010) while DKNF has a simple definition but minimal practical significance
(Hoffer et al., 2009). In summary, when creating tables “strive for single-theme” to achieve
normalization and avoid anomalies (Wyllys, 2010).

26
Figure 4. Six Steps in Normalization (Hoffer et al., 2009, p. 227)
2.9.2 Linking Normalized Tables
Normalized tables may need to be linked together to identify applicable associations and
reduce the complexity of queries. One way of doing this is to create an additional table or an
associative entity. This entity is also known as an associative relation (Hoffer et al., 2009).
Often times, an associative entity is used when the relationship between two entities are many-
to-many (M:N) (see Figure 5a). After the associative table is created, the database designer
needs to decide if an identifier needs to be assigned. The identifier has to uniquely identify the
each instance in the table. If an identifier is not assigned, then the foreign keys, which are the
primary keys from the two tables, become the identifier (see Figure 5b) (Hoffer et al., 2009).

27
(a) Two entities with M:N relationship
(b) Three resulting tables from the two entities with M:N relationship
Figure 5. Example of Mapping Tables with an Associative Entity (Hoffer et al., 2009).
2.10 Data Warehousing
Normalization and denormalization strategies are normally found in data warehousing
depending on the design chosen. Data warehouse is a subject-oriented, integrated, time-variant,
non-updatable collection of data used in support of management decision-making processes
(Hoffer et al., 2009). It contains informational data, derived from operational data, which can
then support planning and forecasting (Dunham, 2003). The main driver for data warehousing
development was the discovery of the difference between operational systems and informational
systems (Hoffer et al., 2009). Organizations extract meaning and information to enhance
Composite primary key as an identifier

28
decision-making and performance from informational assets (Hoffer et al., 2009). Since the
early 1990s, data warehousing techniques have been used to find and learn new information from
a collection of data. Data warehouse has become significant because it is a vital tool in
integrated management of decision support data in organizations (Shin, 2003). Organizations
use it in planning, target marketing, decision-making, data analysis, and customer services (Shin,
2003). Organizations that use this tool appropriately will have a critical knowledge-based
competitive advantage over competitors (Shin, 2003). One of the challenges in data
warehousing is its complexity because it pulls data from different sources like transactional and
operational databases, external data, and others. Improving system throughput and response are
major challenges developers should address (Shin, 2003). Databases designed for data
warehousing should be less concerned with update consistency compared to operational real-
time databases (Inmon, 2000).
Data mining tools and techniques have been used in data warehousing to improve
decision-making and develop solutions for specific problems. Analysts have constructed
predictive models using warehouse data to forecast the outcomes of different decision
alternatives (Apte, Pednault, & Smyth, 2002). Data mining is knowledge discovery using a
sophisticated blend of techniques from traditional statistics, artificial intelligence, and computer
graphics (Westland, 1992). Data mining is the process of finding hidden information in a
database; it is an exploratory data analysis, data driven discovery, and deductive learning
(Dunham, 2003). The three goals of data mining are explanatory, to explain some observed
event or condition; confirmatory, to confirm a hypothesis; and exploratory, to analyze data for
new or unexpected relationships (Hoffer et al., 2009).

29
2.11 Summary
The two prevailing event log standards today are, MITRE’s CEE and the Syslog protocol
(RFC 5424). Regulatory compliance and network security issues have increased the importance
of event logs to many organizations. Log analysis still remain complex due to lack of industry
standards, lack of simple and efficient analysis methods to process numerous amount of logs
generated daily. Event logs can provide cyber situational awareness to management and other
network users in the organization. Proper event log utilization through information systems
monitoring and threat detection enhances mission assurance and information assurance.
Database analysis of event logs is only one of the tools in the information system security
toolbox that is still limited and dependent on the human operator’s understanding and knowledge
of the entire situation. One way to increase understanding of a situation is to correlate different
events wherein logs contribute critical data for analysis. A relational database can be used as a
tool for log analysis; a proper methodology for this process will be discussed in the next chapter.

30
III. Methodology
3.1 Overview
This research utilized an experimental methodology, which consists of two major parts.
The first part involves loading the router event logs into the database and normalizing the
database into single-themed tables. The database was normalized based on functional themes or
relevance of the data such as the Basename, ReportIP, DestinationPort, and others. Once
normalized, the second part consists of measuring the query runtimes on both normalized and
non-normalized configuration. Two sets of similar queries were developed one for normalized
and the other for non-normalized. The differences in runtimes were recorded and statistically
measured. The main goal is to measure if there are any differences in query runtimes between
normalized and non-normalized router log data. The differences between the performances were
calculated using a t-test of independent samples. The chosen methodology was designed to
specifically fulfill the research goals and answer the research question described in Chapter 1,
which are briefly revisited in the next section. Additionally, the database used for this
experiment is not for operational real-time transactions that need to be consistently updated
although it can be for data mining and warehousing purposes. The experiment’s focus is on the
structuring of data for efficient query processing. Therefore, ensuring well-structured relations
and complete normalization were not the main concerns.
3.2 Hardware and Database Configuration
The computer setup consists of database server running on a Hewlett-Packard Compaq
8710w with Intel Pentium III Xenon 2.6 gigahertz processor, 150 gigabytes of hard drive space,
and 4 gigabytes of random access memory. The operating system is Windows XP Professional

31
Service Pack 3. The database platform is Oracle Database 10g Enterprise Edition Release
10.2.0.1 using only the default settings with no additional performance tuning involved.
3.3 Overview of Steps in Normalization and Query Performance Analysis
This research used approximately 30 million records of actual unprocessed USAF-
network router event logs. In order to load the logs into a database and query their contents
several steps were taken. This process was not based on any known standard approach for event
log normalization; rather, the steps were developed using systematic experimental process as
well as trial and error. The steps are briefly described here.
1. Parse the unprocessed network event logs in text format into comma-separated values
(CSV) format.
2. Parsed event logs were exported into a flat non-normalized table.
3. Eight normalized tables were created based on the log data context ensuring that each
table only has a single theme.
4. The eight normalized tables were populated using the data from the non-normalized
table.
5. Eight associative tables that link the normalized tables together as well as to the flat
non-normalized table were created.
6. The associative link tables were populated using the primary keys of the flat non-
normalized table and the respective normalized table creating a composite primary
key.
7. A set of 15 queries were developed based on Information Assurance principles,
network security best practices, and general statistical information about the event
logs.

32
8. The queries’ runtime performance on both normalized and non-normalized sets of
tables were recorded.
9. The differences in runtime performance where analyzed using a t-test of independent
samples.
3.4 Loading Event Logs and Table Normalization
The original text format of event logs can be unreadable to most network analyst;
therefore, the logs must be partitioned into separate logical classifications according to their
purpose. As described in the previous steps, the logs must be parsed, loaded into the database,
and then finally normalized. The first attempt to normalize the flat table took much longer than
expected and was ultimately unsuccessful. The database table of event logs was consequently
normalized based on functional theme or relevance of the data into eight tables. There are
several reasons for normalizing the table, namely, to remove unnecessary duplication of data,
maintain consistency, and to create well-structured relations (Hoffer et al., 2009).
3.4.1 Parsing Event Logs
The Cisco router event logs have two separate portions, structured and unstructured, as
shown in Figure 6; RFC 5424, which is the most recent version of the syslog protocol, refers to a
similar format (Gerhards, R., 2009). The structured portion has a format that remains constant
through all the event logs regardless of the Cisco router device. In contrast, the unstructured
segment contains the free text form of the message. In the structured portion, the first set of date
and time records when the event took place in the log server. The subsequent IP address belongs
to the reporting router. Following this IP address is a router message sequence number. This is a
globally unique number for each router terminal and can range from 000,000,001 to 999,999,999
(Cisco, 2011). Then, the second set of date, time, and time zone are recorded from the reporting

33
Structured Jan 1 01:03:44 132.35.194.5 233361: Jan 1 01:03:43.815 GMT: %SEC-6-IPACCESSLOGP:
Unstructured list ingress denied tcp 192.168.1.3(1024) -> 192.168.2.1(22), 9 packets
router. The words preceded by a % sign is the event message type, which in this example, has a
format of “%<facility>-<severity>-<mnemonic>:” (Cisco System Log). Facility codes as well as
mnemonic codes could vary in meaning depending on the device. The severity codes are
described in a table in Appendix A. Finally, the parser also appended the Basename for every
event where the logs came from.
Figure 6. Structured and Unstructured Segments of a Cisco Router Log
The unstructured part of the event log contains free text message. The format can vary
because of the different designs of hardware and software as well as the various types of network
traffic (Cisco IPhelp, Understanding, 2011). In Figure 6, it starts with the type of Access Control
List (ACL) followed by the ACL name or list name, which on this example is ingress. In some
cases, the ACL name can be a number instead. Next, it states that this specific event was denied.
This value can be either permitted or denied based on the ACL policy outcome. TCP identifies
that the ACL is applied to Transmission Control Protocol (TCP) ports; in this example, the TCP
port number is 22. The first IP address, 192.168.1.3(1024), identifies the source with the
ephemeral port number inside the parenthesis. This IP address is extracted by the parser and
placed in the SourceIP attribute of the LogMessage table along with its decimal or long IP
notation. The purpose of having the decimal equivalent of the IP address is to readily calculate,
compare, and query the IP addresses and ranges if necessary. The second IP address after the

34
right-arrow represents the destination of the network packet with the port number inside the
parenthesis. Lastly, the number indicates the number of packets that was recorded for the event.
This categorization allowed the logs to be exported into a database and given some
context. The first step in normalizing the router event logs was to parse them into CSV files that
can be entered in Microsoft Excel. The attributes assigned to the logs are listed and described in
Appendix B. The program used to parse the logs is a Perl script named, Parselog.pl, shown in
Appendix C. Oracle’s Structured Query Language (SQL) files and Microsoft Disk Operating
System (MS-DOS) batch files are used to create the tables, parsed the log files into CSV files,
and loaded the CSV files into the Oracle database tables. The CreateLogMessage.SQL shown in
Appendix D creates the Oracle database tables named LogMessage and IPToCountry. The
LogMessage table structure is shown in Appendix E. The IPToCountry table contains a range of
IP addresses and the known countries they belong. The IPToCountry table structure is shown in
Appendix F. The MS-DOS batch file called Doit.bat in Appendix G, invokes the PERL parser
for the log files from a particular USAF base, and invokes the CTL file that loads the resultant
CSV file into the LogMessage table. An overall control batch file called Redoit.BAT (see
Appendix H) invokes CreateLogMessage.SQL, LoadIPCountry.CTL and Doit.BAT. This file
displays the start time and end time. It also logs-in to Oracle using sqlplus with username and
password and calls the CreateLogMessage.SQL file. Then the LoadIPCountry.CTL (see
Appendix I) is invoked using sqlldr with the same username and password. A loadipcountry.log
is generated. After all the doit batch files for each base are executed the finished time is
displayed and a redoit.log file is generated. The LoadBasename.CTL (see Appendix J) loads the
tokens in the CSV file into the “LogMessage” table. Each base has its own
load<basename>.CTL file, specific to the path name for each base. A brief description of each

35
of the files is in Table 3. Figure 7 describes the diagram of the sequence in which the files were
executed.
Table 3. Description of Files
Filename Description Parselog.PL Parser that accepts Cisco log files for
each base,tokenizes each log file record, and outputs the tokens into a CSV file
CreateLogMessage.SQL Creates the Oracle tables named “LogMessage” and “IPToCountry”
Doit.BAT Batch file that invokes the PERL parser for the log files at a particular base, and invokes the CTL file that loads the resultant CSV file into the “LogMessage” table. Each base has its own Doit.BAT file, specific to the path name for each base, and base name for parser input
Redoit.BAT Overall control batch file. It invokes CreateLogMessage.SQL, LoadIPCountry.CTL and Doit.BAT
Load<basename>.CTL Loads the tokens in the CSV file into the “LogMessage” table. Each base has its own Load<basename>.CTL file, specific to the path name for each base
LoadIPCountry.CTL Loads the IP ranges of each country into the “IPToCountry” table

36
Figure 7. Sequence of File Executions
3.4.2 Table Normalization with Index Table
After the log data is parsed and loaded into the database, it is all contained in one flat
non-normalized table. This table as it stands can be queried. The query performance, however,
may not be efficient in some cases which normalization can improve. The first attempt to
normalize the database was unsuccessful due to the complexity of the algorithm and number of
attributes and records involved. The process is described briefly for informational purposes. To
summarize, Figure 8 visually depicts the tables, their attributes, primary keys, and the foreign
keys after normalization; for readability purposes, it is not in a standard entity-relationship
diagram and not all the tables are displayed. A message ID was appended to each record to
«OV-6» seq Operational Activ ity Sequence and Timing Descriptions [INOSC Log File Project]
CreateLogMessage.SQL /Creates LogMessage,IPToCountry Tables
Redoit.BAT /Overall Control
Batch File
LoadIPCountry.CTL /Loads Country Info into
IPToCountry Table
Doit.BAT / ControlsParsing and LoadingData for Each Base
Parselog.PL /Tokenizes the Log
Files
Load<basename>.CTL/ Loads the CSV File
into LogMessage Table
loop For Ev ery Set of Base Log Files
CD <to Directory for Base>()
Parses Base Log Filesinto CSV Files()

37
uniquely identify it because the sequence number produced by the reporting device is not
distinctive enough when combined with logs from other devices. SQL scripts were created to
normalized the tables and their attributes. This pre-processing method of linking the primary
keys using a MsgIndex Table (see Figure 8) took longer than expected which would not have
been practical for this experiment or in real-world implementation. The methodology therefore
had to be revised which is described in the next section.
Figure 8. Visual Depiction of Normalized the Tables
3.4.3 Table Normalization with Associative Tables
For this experiment, eight normalized tables were created for performance comparison
(see Figure 9). The normalized tables were created based on the purpose of the log data; the
SQL script to create the tables is in Appendix K. The normalized tables created are single-
themed and at least in 4NF. Then, the tables are populated using eight individual SQL scripts
shown combined in Appendix L.

38
Figure 9. Table Structure of the Normalized Tables
In order to link the normalized tables to the non-normalized table, an associative entity is
created for each table (see Figure 10). These associative entities also allow the network analyst
to write less complex normalized queries. Each of the associative entity contains foreign keys
from the non-normalized table and the normalized that are combined to form a composite
primary key (see Figure 11). There are eight associative tables created using a SQL script
detailed in Appendix M. After the associative entities are created, they are populated using a
SQL script described in Appendix N. At this point, all the tables necessary are created and
populated; queries can now be run on both non-normalized and normalized configuration.

39
Figure 10. Table Structure of the Associative Tables
Figure 11. Example of Mapping the TBaseName_Link Associative Entity
3.5 Event Log Database Queries
Once the log data had been normalized, SQL queries can be created to search for
statistical data, network security analysis, and other related information a network defender may
request. Examples include the number of distinct types of messages that are found in the logs,
the number of routers reporting from each location, the IP addresses associated to certain well-
known protocols. These simple queries can be built upon for more complex and informative
queries. To build the queries, SQL joins were used to efficiently combine tables into a single
view or table. Examples of the joins used include natural joins where duplicate columns are
excluded; inner join, a join where rows must have matching values in order to appear in the
result table; and outer joins where rows that do not have matching values in common columns
are included in the result (Hoffer et al., 2009, pg. 360-361). The results were analyzed for any
trends or commonality. Based on the results of the analysis, more advanced queries, sub-queries,
and joins were developed.

40
Two sets of 15 queries were developed for both non-normalized (see Appendix O) and
normalized (see Appendix P) tables that are representative of simple and complex queries that
would typically be conducted by network security personnel. These queries were customized
according to the specific situation and purpose. Queries were also developed based on industry
best practices and event log analysis. The queries answer specific questions described in Table
4. The actual outputs of the queries were inspected to make sure the results matched and if there
are any discrepancies that they could be explained. The set of queries were specifically
developed to have a combination of both simple and complex queries to measure any
performance differences. In general, the complexity of the non-normalized queries does not vary
significantly in terms of number of joins as seen in Table 5a. The lengths of the queries are also
generally longer for normalized (see Table 5b), for more details on the queries see Appendix O
and P.

41
Table 4. Query Numbers and Purpose
Query Number
Description/Purpose
Q1 What are the different message types? Q2 What are the different base names? Q3 What are the report IP addresses from each base? Q4 What are the destination ports and how many events? Q5 What are the Top 10 destination ports for January? Q6 What bases have port 445 as a destination port and how many events?
Q7 What bases have port 445 as destination port and how many events occurred in January?
Q8 How many events used port 23 (Telnet) as destination port? Q9 What bases have port 23 as destination port and how many events?
Q10 What are the bases and message types with message severity of 2 (see Appendix A) and the number of events?
Q11 What are the bases, ReportIPs, message types, with message severity of 2 and the number of events during the month of January?
Q12 What bases have sourceIP from a user defined table in January and what country?
Q13
What LogID, Basename, ReportIP, SourceIP, Country, Token3, and Token4 have sourceIP from Enemy table that is on the egress list and permitted and what country?
Q14
What Basename, ReportIP, SourceIP, Country_Name, DestinationIP Egress/Ingress, Permitted/Denied did a source IP address from a user defined table show up in the log?
Q15 What are the Top 10 message types in the log?

42
Table 5. SQL Queries
(a) Non-normalized Queries
Query Number
Non-normalized Syntax
Q1 SELECT DISTINCT (Messagetype) FROM Logmessage;
Q2 SELECT DISTINCT (Basename) FROM Logmessage ORDER BY Basename;
Q3 SELECT DISTINCT BASENAME, ReportIP FROM LOGMESSAGE ORDER BY BASENAME;
Q4 SELECT Destinationport, Count(*) AS "Number of Events" FROM Logmessage WHERE Destinationport LIKE '%' GROUP BY Destinationport ORDER BY "Number of Events";
Q5
SELECT * FROM (SELECT Destinationport, "Number of Events", RANK () OVER (ORDER BY "Number of Events" DESC) Rank FROM (SELECT Destinationport, Count(*) AS "Number of Events" FROM Logmessage WHERE Destinationport LIKE '%' AND (logdatetime >= '01-jan-11' and logdatetime<= '31-jan-11') GROUP BY Destinationport ORDER BY "Number of Events")) WHERE Rank <=10;
Q6 SELECT BaseName, Destinationport, Count(*) AS "Number of Events" FROM Logmessage WHERE Destinationport = '445' GROUP BY BaseName, Destinationport ORDER BY "Number of Events";
Q7
SELECT BaseName, Destinationport, Count(*) AS "Number of Events" FROM Logmessage WHERE Destinationport = '445' AND (logdatetime >= '01-Jan-11' AND logdatetime<= '31-Jan-11') GROUP BY BaseName, Destinationport ORDER BY "Number of Events";
Q8
SELECT Destinationport, Count(*) AS "Number of Events" FROM Logmessage WHERE Destinationport = '23' GROUP BY Destinationport ORDER BY "Number of Events";
Q9
SELECT BaseName, Destinationport, Count(*) AS "Number of Events" FROM Logmessage WHERE Destinationport = '23' GROUP BY BaseName, Destinationport ORDER BY "Number of Events";
Q10
SELECT DISTINCT Basename, Messagetype, Count(*) AS "Number of Events" FROM Logmessage WHERE messagetype LIKE '%-2-%' GROUP BY Basename, Messagetype ORDER BY "Number of Events";
Q11
SELECT Basename, ReportIP, Messagetype, Count(*) AS "Number of Events" FROM Logmessage WHERE Messagetype LIKE '%-2-%' AND (Logmessage.logdatetime >= '01-jan-11' and Logmessage.logdatetime <= '31-jan-11') GROUP BY Basename, ReportIP, Messagetype ORDER BY "Number of Events";
Q12
SELECT BASENAME, ReportIP, SourceIP, COUNTRY_NAME FROM LOGMESSAGE L, ENEMY E WHERE L.SourceIPNum <= E.IP_TO AND L.SourceIPNum >= E.IP_FROM AND (L.logdatetime >= '01-jan-11' and L.logdatetime <= '31-jan-11');
Q13
SELECT LogID, Basename, ReportIP, SourceIP, COUNTRY_NAME, Token3, Token4 FROM LOGMESSAGE L, ENEMY E WHERE L.SourceIPNum <= E.IP_TO AND L.SourceIPNum >= E.IP_FROM AND TOKEN3 LIKE '%egress%' AND TOKEN4 = 'permitted';
Q14
SELECT SourceIP, LogDateTime, Basename, ReportIP, DestinationIP COUNTRY_NAME, Token3, Token4 FROM Logmessage, Enemy WHERE SourceIP = '203.171.234.174' AND (Logmessage.SourceIPNum <= Enemy.IP_TO and Logmessage.SourceIPNum >= Enemy.IP_FROM);
Q15
SELECT * FROM (SELECT MessageType, "Number of Events", RANK () OVER (ORDER BY "Number of Events" DESC) Rank FROM (SELECT MessageType, Count(*) AS "Number of Events" FROM Logmessage WHERE MessageType LIKE '%' GROUP BY MessageType ORDER BY "Number of Events") ) WHERE Rank <=10;

43
(b) Normalized Queries
Query Number
Normalized Syntax
Q1 SELECT MsgType FROM TMESSAGE_TYPE ORDER BY MsgType;
Q2 SELECT BaseName FROM TBASENAME ORDER BY BaseName;
Q3
SELECT DISTINCT BaseName, ReportIP FROM TBASENAME, TBASENAME_LINK, TREPORTIP, TREPORTIP_LINK WHERE TBASENAME.Base_ID = TBASENAME_LINK.Base_ID AND TBASENAME_LINK.LOGID = TREPORTIP_LINK.LOGID AND TREPORTIP_LINK.REPORTIP_ID = TREPORTIP.REPORTIP_ID ORDER BY BaseName;
Q4
SELECT DISTINCT PortNum, Count(*) AS "Number of Events" FROM TDESTPORTS, TDESTPORT_LINK WHERE TDESTPORT_LINK.DPort_ID = TDESTPORTS.DestPort_ID GROUP BY PortNum ORDER BY "Number of Events";
Q5
SELECT * FROM (SELECT Destinationport, "Number of Events", RANK () OVER (ORDER BY "Number of Events" DESC) RANK FROM (SELECT Destinationport, Count(*) AS "Number of Events" FROM Logmessage WHERE Logmessage.LOGID IN (SELECT TDESTPORT_LINK.LOGID FROM TDESTPORTS, TDESTPORT_LINK WHERE TDESTPORTS.DestPort_ID = TDESTPORT_LINK.DPort_ID) AND (Logmessage.logdatetime >= '01-jan-11' and Logmessage.logdatetime <= '31-jan-11') GROUP BY Destinationport ORDER BY "Number of Events")) WHERE RANK <=10;
Q6
SELECT DISTINCT TBASENAME.BASENAME, TDESTPORTS.PortNum, Count(*) AS "Number of Events" FROM TBASENAME, BASENAME_LINK, TDESTPORTS, TDESTPORT_LINK WHERE TBASENAME.Base_ID = TBASENAME_LINK.Base_ID AND TBASENAME_LINK.LOGID = TDESTPORT_LINK.LOGID AND TDESTPORT_LINK.DPort_ID = TDESTPORTS.DestPort_ID AND TDESTPORTS.PortNum = '445' GROUP BY TBASENAME.BASENAME, TDESTPORTS.PortNum ORDER BY "Number of Events";
Q7
SELECT BASENAME, DestinationPort, Count(*) AS "Number of Events" FROM Logmessage WHERE Logmessage.LogID IN (SELECT TDESTPORT_LINK.LOGID FROM TDESTPORTS, TDESTPORT_LINK WHERE DESTPORTS.DestPort_ID = TDESTPORT_LINK.DPort_ID AND TDESTPORTS.PortNum = '445') AND (Logmessage.logdatetime >= '01-jan-11' and Logmessage.logdatetime <= '31-jan-11') GROUP BY BASENAME, DestinationPort ORDER BY "Number of Events";
Q8
SELECT DISTINCT PortNum, Count(*) AS "Number of Events" FROM TDESTPORTS, TDESTPORT_LINK WHERE TDESTPORT_LINK.DPort_ID = TDESTPORTS.DestPort_ID AND TDESTPORTS.PortNum = '23' GROUP BY PortNum ORDER BY "Number of Events";
Q9
SELECT DISTINCT TBASENAME.BASENAME, TDESTPORTS.PortNum, Count(*) AS "Number of Events" FROM TBASENAME, TBASENAME_LINK, TDESTPORTS, TDESTPORT_LINK WHERE TBASENAME.Base_ID = TBASENAME_LINK.Base_ID AND TBASENAME_LINK.LOGID = TDESTPORT_LINK.LOGID AND TDESTPORT_LINK.DPort_ID = TDESTPORTS.DestPort_ID AND TDESTPORTS.PortNum = '23' GROUP BY TBASENAME.BASENAME, TDESTPORTS.PortNum ORDER BY "Number of Events";
Q10
SELECT DISTINCT Basename, Msgtype, Count(*) AS "Number of Events" FROM TBASENAME, TBASENAME_LINK, TMESSAGE_TYPE, TMESSAGE_TYPE_LINK WHERE TBASENAME.BASE_ID = TBASENAME_LINK.BASE_ID AND TMESSAGE_TYPE_LINK.MSGTYPE_ID = TMESSAGE_TYPE.MSGTYPE_ID AND TBASENAME_LINK.LOGID = TMESSAGE_TYPE_LINK.LOGID AND TMESSAGE_TYPE.MSGTYPE LIKE '%-2-%' GROUP BY Basename, Msgtype ORDER BY "Number of Events";
Q11
SELECT Basename, ReportIP, Messagetype, Count(*) AS "Number of Events" FROM Logmessage WHERE Logmessage.LOGID IN ( SELECT TMESSAGE_TYPE_LINK.LOGID FROM TMESSAGE_TYPE, TMESSAGE_TYPE_LINK WHERE TMESSAGE_TYPE_LINK.MSGTYPE_ID = TMESSAGE_TYPE.MSGTYPE_ID AND TMESSAGE_TYPE.MSGTYPE LIKE '%-2-%') AND (Logmessage.logdatetime >= '01-jan-11' and Logmessage.logdatetime <= '31-jan-11') GROUP BY Basename, ReportIP, Messagetype ORDER BY "Number of Events";

44
Q12
SELECT Basename, ReportIP, SourceIP, COUNTRY_NAME FROM Logmessage, Enemy WHERE Logmessage.LOGID IN ( SELECT TBASENAME_LINK.LOGID FROM TBASENAME, TBASENAME_LINK, TSOURCE_IP, TSOURCE_IP_LINK WHERE TBASENAME.BASE_ID = TBASENAME_LINK.BASE_ID AND TSOURCE_IP.SOURCEIP_ID = TSOURCE_IP_LINK.SOURCEIP_ID AND TBASENAME_LINK.LOGID = TSOURCE_IP_LINK.LOGID) AND (Logmessage.logdatetime >= '01-jan-11' and Logmessage.logdatetime <= '31-jan-11') AND (Logmessage.SourceIPNum <= Enemy.IP_TO and Logmessage.SourceIPNum >= Enemy.IP_FROM);
Q13
SELECT LogID, Basename, ReportIP, SourceIP, COUNTRY_NAME, Token3, Token4 FROM Logmessage JOIN Enemy ON Logmessage.LOGID IN ( SELECT TBASENAME_LINK.LOGID FROM TBASENAME, TBASENAME_LINK, TSOURCE_IP, TSOURCE_IP_LINK WHERE TBASENAME.BASE_ID = TBASENAME_LINK.BASE_ID AND TSOURCE_IP.SOURCEIP_ID = TSOURCE_IP_LINK.SOURCEIP_ID AND TBASENAME_LINK.LOGID = TSOURCE_IP_LINK.LOGID) AND (Logmessage.SourceIPNum <= Enemy.IP_TO and Logmessage.SourceIPNum >= Enemy.IP_FROM) AND TOKEN3 LIKE '%egress%' AND TOKEN4 = 'permitted';
Q14
SELECT SourceIP, LogDateTime, Basename, ReportIP, DestinationIP, COUNTRY_NAME, Token3, Token4 FROM Logmessage, Enemy WHERE Logmessage.LogID IN (SELECT TSOURCE_IP_LINK.LogID FROM TSOURCE_IP, TSOURCE_IP_LINK WHERE TSOURCE_IP.SourceIP_ID = TSOURCE_IP_LINK.SourceIP_ID AND TSOURCE_IP.SourceIP = '203.171.234.174') AND (Logmessage.SourceIPNum <= Enemy.IP_TO and Logmessage.SourceIPNum >= Enemy.IP_FROM);
Q15
SELECT * FROM (SELECT MsgType, "Number of Events", RANK () OVER (ORDER BY "Number of Events" DESC) RANK FROM (SELECT MsgType, Count(*) AS "Number of Events" FROM TMESSAGE_TYPE, TMESSAGE_TYPE_LINK WHERE TMESSAGE_TYPE.MsgType_ID = TMESSAGE_TYPE_LINK.MsgType_ID GROUP BY MsgType ORDER BY "Number of Events"))WHERE RANK <=10;
3.6 Runtime Comparison of Normalized and Non-normalized Event Logs
A series of 32 query runs, both non-normalized and normalized, are performed and the
runtime for each of the 15 queries was recorded using Oracle’s timing command. According to
the central limit theorem as the sample size grows larger (more than 30) the sampling
distribution becomes normal and has a mean equal to the population mean (Fields, 2009, pg. 42).
In order to collect the necessary timing and statistical data without accumulating the large output
and still be able to fetch the queries, the script executes Oracle’s “autotrace traceonly” command.
For more details, see Appendix O and P. Two more SQL scripts where created to invoke the
non-normalized and normalized queries automatically (see Appendix Q and R). Oracle’s timing
format is hh:mm:ss.ss. In order to have a simple numerical format for statistical analysis, the
runtime unit of measurement was converted to seconds.

45
3.6.1 Statistical Analysis
To analyze if there are differences between the means of non-normalized and normalized
queries, a Student’s t-test of independent samples was employed. The null and alternative
hypotheses are:
H0 = There are no statistical differences between the means of non-normalized and
normalized queries.
HA = There are statistical differences between the means of non-normalized and
normalized queries.
The program used for statistical analysis is SPSS release 16.0. Fifteen variables were created in
SPSS to represent the 15 queries and a grouping variable with values of 1 and 2 for non-
normalized and normalized groups respectively. Sixty-four timing data points were entered in
SPSS and assigned into two groups of 32. The groupings identify whether a query is non-
normalized or normalized. The complete dataset can be found in Appendix S. The results of the
queries, timing, and statistical analysis are discussed in the next chapter.
3.6.2 Preprocessing and Disk Space Requirements
When comparing the runtimes between non-normalized and normalized it is necessary to
consider the preprocessing time incurred to create and populate the normalized tables. This
processing time overhead can be found in the SQL logs when the tables were created and
populated (see Table 21). The break-even point can be determined by calculating the
preprocessing time divided by the difference of the average mean time of the non-normalized
(NN) and normalized (N) queries.

46
Equation 1
(Note: make font color of caption white) (1)
Equaticaption white)
(2)
ote: make font color of caption white)(3)
Note: make font color of caption h(4)
To be specific, the break-even point is the number of times the queries need to be ran to pay off
for the normalization preprocessing overhead. The tables are only created once but can be
updated whenever necessary. For this experiment, however, the normalized tables were
populated one time using a fixed amount of 30 million event logs. In some real-world situations,
the preprocessing would only occur if a new value or data does not already exist in the
normalized tables.
Creating the normalized tables will obviously incur additional disk space to
accommodate the extra tables. There are several ways to determine the table sizes. One is using
Oracle’s Database Control Interface. Using Oracle’s web-based graphical user interface, the
table sizes are located in the Administration tab, Schema, Database Objects, Tables, search for
the table name, and the table size is under Statistics called Sample Size. However, there is a lack
of documentation on what this parameter actually measures. The second and preferred option
uses the average row length multiplied by the number of rows. According to Oracle’s
15
1
mean time average NNi
i
15
1
mean time average Ni
i
mean time average N - mean time average NN = Difference
Difference / timeingPreprocess =point even -Break

47
documentation, AVG_ROW_LEN is the “average row length, including the row overhead, in
bytes” (2005). The SQL syntax is:
SELECT TABLE_NAME, ROUND ((AVG_ROW_LEN * NUM_ROWS / 1024), 2) SIZE_KB FROM USER_TABLES ORDER BY TABLE_NAME;
3.7 Summary
This chapter explained, in detail, each step taken to perform the experiment and be able
to reproduce it as accurately as possible. The main steps explained include parsing and loading
the event logs, normalizing the database, running and comparing the queries, and calculating the
preprocessing time and disk space. The next chapter shows and analyzes the results of the
methods described in this chapter.

48
IV. Results
4.1 Overview
The results of the statistical analysis and query performance will be analyzed in this
chapter. First, the results of the t-test from SPSS are discussed as it relates to the experiment,
specifically the test statistic (t), degrees of freedom (df), and the probability value (p-value) of
the test statistic. Information from the group or summary statistics will also be briefly discussed.
The main findings of the statistical analysis are in the independent samples test. Second, the
runtimes and statistical output from the actual queries will be discussed explaining the difference
in performance between non-normalized and normalized configuration.
4.2 Test Statistics Results
Table 6 shows the summary statistics of the t-test. Each row represents one of the 15
queries (Q1-15). The first column indicates the results for non-normalized or normalized
queries. As mentioned in Chapter 3, according to the central limit theorem as the sample size
grows larger (more than 30) the sampling distribution becomes normal and has a mean equal to
the population mean (Fields, 2009, pg. 42). Each query ran 32 times (N) and the mean runtime
in seconds including the standard deviation and standard error mean are also included in the
table.

49
Table 6. Group Statistics
Is this query Normalized or Non-Normalized N Mean Std. Deviation Std. Error Mean
Q1 Non-Normalized 32 179.1747 3.37547 .59671
Normalized 32 .0088 .02136 .00378
Q2 Non-Normalized 32 178.7297 3.62914 .64155
Normalized 32 .0150 .03844 .00679
Q3 Non-Normalized 32 179.8128 4.47180 .79051
Normalized 32 147.5572 14.22413 2.51449
Q4 Non-Normalized 32 178.9691 3.51893 .62206
Normalized 32 7.1028 .60959 .10776
Q5 Non-Normalized 32 180.7591 6.94209 1.22720
Normalized 32 227.1262 5.83329 1.03119
Q6 Non-Normalized 32 178.5216 4.16421 .73613
Normalized 32 22.7825 5.17363 .91458
Q7 Non-Normalized 32 179.5547 6.31525 1.11639
Normalized 32 428.8850 21.87962 3.86781
Q8 Non-Normalized 32 179.0097 3.29555 .58258
Normalized 32 5.9631 1.43762 .25414
Q9 Non-Normalized 32 178.4925 3.67427 .64953
Normalized 32 22.9162 2.04290 .36114
Q10 Non-Normalized 32 179.7838 5.02242 .88785
Normalized 32 32.7353 3.60482 .63725
Q11 Non-Normalized 32 178.4147 3.71542 .65680
Normalized 32 336.3216 13.58484 2.40148
Q12 Non-Normalized 32 3835.8384 233.20236 41.22474
Normalized 32 769.9984 15.10613 2.67041
Q13 Non-Normalized 32 179.8703 3.49814 .61839
Normalized 32 259.1588 7.28158 1.28721
Q14 Non-Normalized 32 178.7362 3.99942 .70700
Normalized 32 7.7987 1.37545 .24315
Q15 Non-Normalized 32 179.8806 4.23768 .74912
Normalized 32 21.0847 .72725 .12856
The main results of the t-test are in Table 7. Again, each row represents one of the 15
queries, additionally, the first column indicates if the null hypothesis (H0) of “There are no
statistical differences between the means of non-normalized and normalized queries” is either
Rejected or Failed to reject. SPSS also includes the Levene’s test for equality of variances that is

50
similar to a t-test, wherein, it tests if the variances are assumed equal or are assumed different. If
the p-value (Sig) of the Levene’s test is less than 0.05 then there is a significant chance that the
variances are assumed to be different. If p > 0.05, then the variances are assumed equal. For
example, Q1 in the table has a Levene’s test of p < 0.05, therefore, the variances are assumed to
be different; however, Q3 has p = 0.149 that is larger than 0.05, therefore, variances are assumed
equal. Other queries with p > 0.05 are Q5, Q6, Q10, and Q13.
The remaining columns in Table 7 show the results of the t-test for equality of means.
The test statistic column shows the t-value used by SPSS in conjunction with the df to calculate
probability that H0 is true. Furthermore, the negative t-value denotes that non-normalized
condition has smaller mean and performed faster than the normalized condition. The non-
normalized queries that performed faster are Q5, Q7, Q11, and Q13. The p-values (Sig. 2-tailed)
of the t-test are all exceedingly less than 0.05 (p = 0.000) which signify that there is enough
evidence to reject the H0. The first column shows that H0 is rejected in all of the queries. The
full SPSS table output is in Appendix T; the last column of the table shows additional
information about the confidence interval for the mean difference at 95%. These boundaries
suggest where the true values of the mean difference can be found. The findings, in general,
suggest that most of the normalized queries performed faster than the non-normalized queries
except for Q5, Q7, Q11, and Q13 and they were all significant at p < 0.05.

51
Table 7. Independent Samples Test
Reject or Accept null F Sig. t df
Sig. (2-tailed)
Equal variances assumed 91.353 0.000 300.253 62.000 0.000
RejectEqual variances not assumed 300.253 31.002 0.000Equal variances assumed 101.004 0.000 278.553 62.000 0.000
RejectEqual variances not assumed 278.553 31.007 0.000
RejectEqual variances assumed 2.134 0.149 12.237 62.000 0.000Equal variances not assumed 12.237 37.069 0.000Equal variances assumed 61.590 0.000 272.229 62.000 0.000
RejectEqual variances not assumed 272.229 32.859 0.000
RejectEqual variances assumed 0.581 0.449 -28.927 62.000 0.000Equal variances not assumed -28.927 60.213 0.000
RejectEqual variances assumed 0.379 0.540 132.653 62.000 0.000Equal variances not assumed 132.653 59.292 0.000Equal variances assumed 17.805 0.000 -61.935 62.000 0.000
RejectEqual variances not assumed -61.935 36.130 0.000Equal variances assumed 25.719 0.000 272.259 62.000 0.000
RejectEqual variances not assumed 272.259 42.386 0.000Equal variances assumed 28.285 0.000 209.341 62.000 0.000
RejectEqual variances not assumed 209.341 48.495 0.000
RejectEqual variances assumed 0.847 0.361 134.553 62.000 0.000Equal variances not assumed 134.553 56.241 0.000Equal variances assumed 20.825 0.000 -63.425 62.000 0.000
RejectEqual variances not assumed -63.425 35.612 0.000Equal variances assumed 34.776 0.000 74.213 62.000 0.000
RejectEqual variances not assumed 74.213 31.260 0.000
RejectEqual variances assumed 2.546 0.116 -55.522 62.000 0.000Equal variances not assumed -55.522 44.586 0.000Equal variances assumed 38.343 0.000 228.634 62.000 0.000
RejectEqual variances not assumed 228.634 38.232 0.000Equal variances assumed 10.650 0.002 208.922 62.000 0.000
RejectEqual variances not assumed 208.922 32.824 0.000
Levene's Test for Equality of Variances t-test for Equality of Means
Q1
Q2
Q3
Q4
Q5
Q6
Q7
Q8
Q13
Q14
Q15
Q9
Q10
Q11
Q12

52
4.3 Query Performance Statistics
As mentioned in the previous section, all of the normalized queries outperformed non-
normalized queries except Q5, Q7, Q11, and Q13. Several factors could affect performance
depending on each specific query. The most common issues are the maximum number of
records involved, the number of joins, the number of physical hard drive reads, or a combination
of any of these factors. According to Oracle’s documentation, physical reads is defined as the
“total number of data blocks read from disk”; it is a combination of direct, cache, and private
buffer reads (2009). Each of the 15 queries both non-normalized (NN) and normalized (N) will
be compared side by side using one of the query logs and discussed why one may have
outperformed the other. The number of physical hard drive reads varies from run to run;
however, the maximum number of records involved and the number of joins stays the same.
Refer to Table 4 for the query description, Table 5a and 5b for non-normalized and normalized
query syntax.
4.3.1 Q1: What are the different message types?
Table 6. Q1 Statistics
Q1 Mean Max Number of Rows Number of Joins Physical Reads
NN 179.1747 30M 0 925255
N .0088 169 0 0
Q1 results in Table 6 shows that N (M = .0088) exceedingly outperforms NN (M =
179.1747). The big difference is in number of records and physical hard drive reads. The N
query only had to sort through 169 rows compared to 30 million for NN. In addition the number
of physical reads for N query is virtually zero.

53
4.3.2 Q2: What are the different base names?
Table 7. Q2 Statistics
Q2 Mean Max Number of Rows Number of Joins Physical Reads
NN 178.7297
30M 0 925434
N .0150
44 0 0
Q2 results in Table 7 shows that N (M = . 0150) exceedingly outperforms NN (M =
178.7297). Q2 is very similar to Q1 in terms of structure. The only difference is the type of
attribute involved as seen in the syntax. Similarly, the big difference is in number of records and
physical hard drive reads. The N query only had to sort through 44 rows compared to 30 million
for NN. In addition, the number of physical reads for N query is virtually zero.
4.3.3 Q3: What are the report IPs from each base?
Table 8. Q3 Statistics
Q3 Mean Max Number of Rows Number of Joins Physical Reads
NN 179.8128
30M 0 925436
N 147.5572
30M 3 249874
Q3 results in Table 8 shows that N (M = 147.5572) outperforms NN (M = 147.5572).
The difference in this query is the number of joins and physical hard drive reads, while the
maximum number of rows is the same. The N query involves four tables and even if it has three
times the number joins. The number of physical reads is less than one-third.
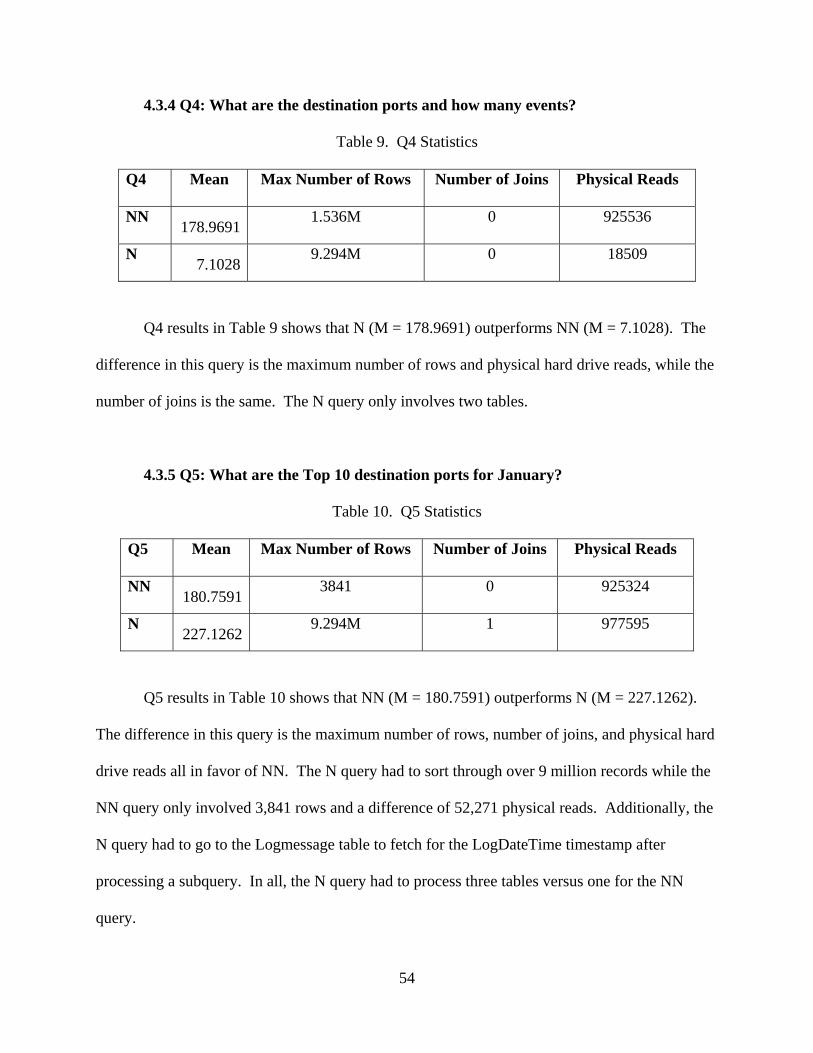
54
4.3.4 Q4: What are the destination ports and how many events?
Table 9. Q4 Statistics
Q4 Mean Max Number of Rows Number of Joins Physical Reads
NN 178.9691
1.536M 0 925536
N 7.1028
9.294M 0 18509
Q4 results in Table 9 shows that N (M = 178.9691) outperforms NN (M = 7.1028). The
difference in this query is the maximum number of rows and physical hard drive reads, while the
number of joins is the same. The N query only involves two tables.
4.3.5 Q5: What are the Top 10 destination ports for January?
Table 10. Q5 Statistics
Q5 Mean Max Number of Rows Number of Joins Physical Reads
NN 180.7591
3841 0 925324
N 227.1262
9.294M 1 977595
Q5 results in Table 10 shows that NN (M = 180.7591) outperforms N (M = 227.1262).
The difference in this query is the maximum number of rows, number of joins, and physical hard
drive reads all in favor of NN. The N query had to sort through over 9 million records while the
NN query only involved 3,841 rows and a difference of 52,271 physical reads. Additionally, the
N query had to go to the Logmessage table to fetch for the LogDateTime timestamp after
processing a subquery. In all, the N query had to process three tables versus one for the NN
query.

55
4.3.6 Q6: What are the bases with port 445 as destination port and how many
events?
Table 11. Q6 Statistics
Q6 Mean Max Number of Rows Number of Joins Physical Reads
NN 178.5216
364K 0 925989
N 22.7825
30M 3 77602
Q6 results in Table 11 shows that N (M = 22.7825) outperforms NN (M = 178.5216).
The difference in this query is the maximum number of rows, number of joins, and physical hard
drive reads. The N query had to sort through 30 million rows in table TBASENAME_LINK
how ever it is a smaller table with only two columns. There are three times the number of joins
in query N however, the physical reads is 848,387 less than NN.
4.3.7 Q7: What are the bases with port 445 as destination port and how many events
in January?
Table 12. Q7 Statistics
Q7 Mean Max Number of Rows Number of Joins Physical Reads
NN 179.5547
910 0 925632
N 428.8850
9.294M 1 149889
Q7 results in Table 12 shows that NN (M = 179.5547) outperforms N (M = 428.8850).
The difference in this query is the maximum number of rows and number of joins both in favor
of NN. However, the physical reads, although it is lower for the N query by 775,743 reads the
performance remained slow. Q7 is similar to Q5 in that it has to go to the Logmessage table to

56
fetch for the LogDateTime timestamp after processing a subquery in a nested loop. In all, the N
query had to process three tables versus one for the NN query.
4.3.8 Q8: How many events have port 23 (Telnet) as destination port?
Table 13. Q8 Statistics
Q8 Mean Max Number of Rows Number of Joins Physical Reads
NN 179.0097
8293 0 925627
N 5.9631
9.294M 1 18680
Q8 results in Table 13 shows that N (M = 5.9631) outperforms NN (M = 179.0097). The
difference in this query is the maximum number of rows and number of joins both in favor of
NN. The physical reads is lower for the N query by 906,947. These statistics are very similar to
Q7 except N outperformed NN on this case. The major difference is that the N query in this case
did not have to go to the Logmessage table to fetch for the LogDateTime timestamp. The N
query also had to process only two tables.
4.3.9 Q9: What bases use port 23 (Telnet) and how many?
Table 14. Q9 Statistics
Q9 Mean Max Number of Rows Number of Joins Physical Reads
NN 178.4925
8293 0 925627
N 22.9162
30M 3 77615
Q9 results in Table 14 shows that N (M = 22.9162) outperforms NN (M = 178.4925).
The difference in this query is the maximum number of rows and number of joins both in favor
of NN. However, the physical reads is lower for the N query by 848,012. This query is similar

57
to Q8 in terms of the question but with additional data such as the base names. It also took
longer by a few seconds.
4.3.10 Q10: What are the bases and message types with message severity of 2 and
the number of events?
Table 15. Q10 Statistics
Q10 Mean Max Number of Rows Number of Joins Physical Reads
NN 179.7838
1.536M 0 925638
N 32.7353
30M 3 119950
Q10 results in Table 15 shows that N (M = 32.7353) outperforms NN (M = 179.7838).
The difference in this query is the maximum number of rows and number of joins both in favor
of NN. However, the number of physical reads is lower for N by 805,688 reads. Further, the N
query does not have to go to the Logmessage to get additional data.
4.3.11 Q11: What are the bases, ReportIP, message type, with message severity of 2
and the number of events during the month of January 2011?
Table 16. Q11 Statistics
Q11 Mean Max Number of Rows Number of Joins Physical Reads
NN 178.4147
3841 0 925653
N 336.3216
30M 2 1093787
Q11 results in Table 16 shows that NN (M = 178.4147) outperforms N (M = 336.3216).
The difference in this query is the maximum number of rows, number of joins, and number of
physical reads all in favor of NN. This is similar to Q5 and Q7 in that it has to go to the

58
Logmessage table to fetch for the LogDateTime timestamp after processing a subquery in a
nested loop. In all, the N query had to process three tables versus one for the NN query.
4.3.12 Q12: What bases have sourceIP from Enemy table in January 2011 and what
country and reportIP?
Table 17. Q12 Statistics
Q12 Mean Max Number of Rows Number of Joins Physical Reads
NN 3835.8384
196K 3 13734324
N 769.9984
30 M 5 1189702
Q12 results in Table 17 shows that N (M = 769.9984) outperforms NN (M = 3835.8384).
The difference in this query is the maximum number of rows and number of joins both in favor
of NN. However, the number of physical reads is lower for N by 685,738 reads. This query has
the highest difference in means (3,065 seconds). This is also one of the two queries with the
highest number of joins and tables for both N and NN. There are two tables involved in the NN
query and six tables in the N query. The N query still outperformed NN even though the N
query had to go to the Logmessage table to fetch for the LogDateTime timestamp. However, the
NN query also had to use three joins and filter results using the timestamp, which could have
caused the slow performance.

59
4.3.13 Q13: What LogID, Basename, ReportIP, SourceIP, Country, Token3, and
Token4 have sourceIP from Enemy table that is on the egress list and permitted and what
country?
Table 18. Q13 Statistics
Q13 Mean Max Number of Rows Number of Joins Physical Reads
NN 179.8703
1023 3 926290
N 259.1588
30M 5 1066356
Q13 results in Table 18 shows that NN (M = 179.8703) outperforms N (M = 259.1588).
The difference in this query is the maximum number of rows, number of joins, and number of
physical reads all in favor of NN. This query is similar to Q12 but with additional data such
Token 3 and 4 minus the timestamp. The physical reads in this query is lower for NN by
140,066 reads. The NN query was faster because the N query needed to fetch more data (Token
3 and 4) from the non-normalized Logmessage table.
4.3.14 Q14: What Basename, LogDateTime, ReportIP, SourceIP,
COUNTRY_NAME, DestinationIP Egress/Ingress (Token3), Permitted/Denied (Token4)
did a source IP address from Enemy table show up in the log?
Table 19. Q14 Statistics
Q14 Mean Max Number of Rows Number of Joins Physical Reads
NN 178.7362
36493 3 925580
N 7.7987
11M 4 26592

60
Q14 results in Table 19 shows that N (M = 7.7987) outperforms NN (M = 178.7362).
The difference in this query is the maximum number of rows and number of joins both in favor
of NN. However, the number of physical reads is lower for N by 898,988 reads. This query is
similar to Q13 but with additional information and it searches for a specific IP address from the
Enemy table. Oracle also automatically implemented an index unique scan for the N query for
this instance.
4.3.15 Q15: What are the Top 10 message types in the log?
Table 20. Q15 Statistics
Q15 Mean Max Number of Rows Number of Joins Physical Reads NN
179.8806 30M 0 925581
N 21.0847
30M 1 60841
Q15 results in Table 20 shows that N (M = 21.0847) outperforms NN (M = 179.8806).
The difference in this query is the number of joins and physical hard drive reads. The NN query
did not use any joins and the N query used one join. The number of physical reads is lower for N
by 864,740 reads. The maximum number of rows is the same. This query is similar to Q5;
however, the N query does not have to go to the Logmessage table for additional data, hence, the
query was faster.
In general, the query with higher physical hard drive reads performs slower except in
cases where the normalized queries have to access the non-normalized Logmessage for
additional data. The mean and physical hard drive reads for NN queries remained relatively
constant throughout the experiment while the N queries have values that vary from query to
query. This experiment showed that query performance is faster on normalized table if all the

61
necessary data are contained in the normalized tables. If however, the query needs to fetch
additional data from the non-normalized table, then query performance decreases.
4.4 Preprocessing of Normalized Tables
4.4.1 Preprocessing Time
The query performance results showed that in some cases, it is possible to normalized the
tables based on consequential queries if the queries are known ahead of time. Nevertheless,
completely normalizing a large table incurs pre-processing time that can negate any query
performance advantage. The pre-processing in real-world network log analysis would be to
update the normalized tables only if new log data does not exist already. In other words, the
normalized tables will only be updated if new data is introduced from the logs. Therefore,
majority of the pre-processing time will only be incurred during the initial setup of the
normalized tables. Generally, static tables such as the Basename, Timezones, and MessageTypes
should not change often. The actual pre-processing time will also depend on the overall size of
the log. The preprocessing times can be found in the Table 21. As discussed in section 3.6.1,
below are the preprocessing parameters.
NN average mean time = 423.04 seconds
N average mean time = 152.63 seconds
Difference 423.04 - 152.63 = 270.41 seconds
Total preprocessing time = 8,655.63 seconds
Break-even point
8,655.63/270.41 = 32 times
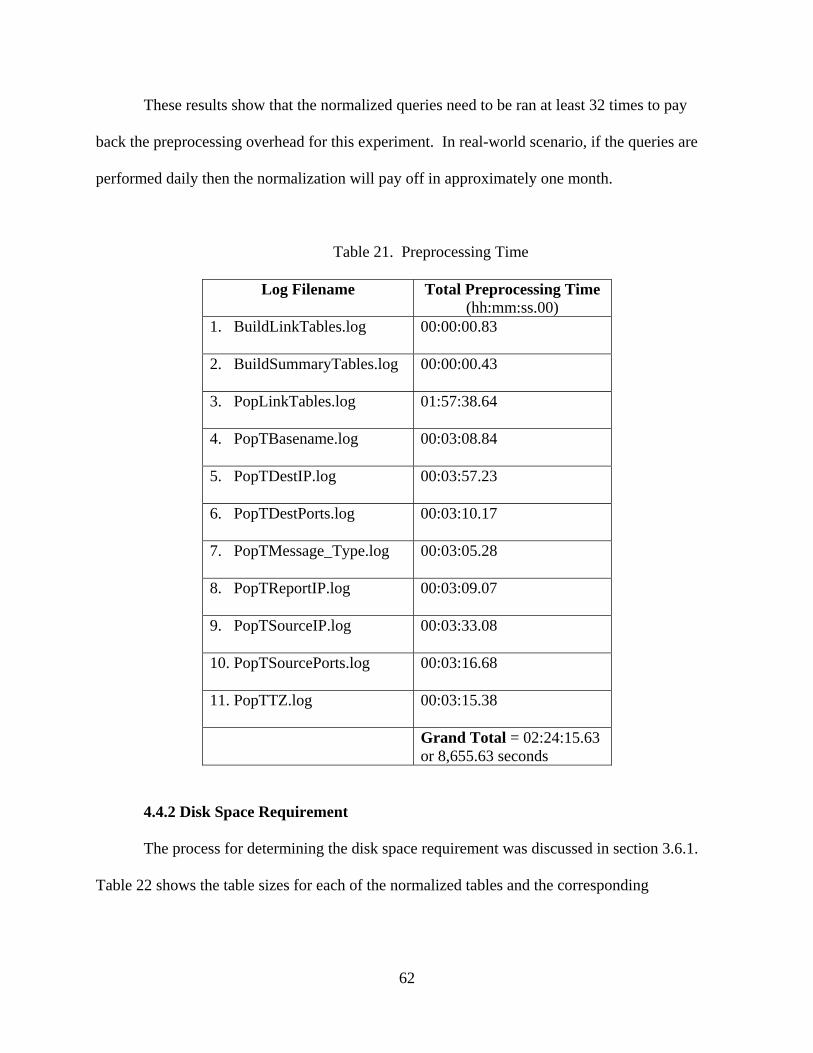
62
These results show that the normalized queries need to be ran at least 32 times to pay
back the preprocessing overhead for this experiment. In real-world scenario, if the queries are
performed daily then the normalization will pay off in approximately one month.
Table 21. Preprocessing Time
Log Filename Total Preprocessing Time (hh:mm:ss.00)
1. BuildLinkTables.log 00:00:00.83
2. BuildSummaryTables.log 00:00:00.43
3. PopLinkTables.log 01:57:38.64
4. PopTBasename.log 00:03:08.84
5. PopTDestIP.log 00:03:57.23
6. PopTDestPorts.log 00:03:10.17
7. PopTMessage_Type.log 00:03:05.28
8. PopTReportIP.log 00:03:09.07
9. PopTSourceIP.log 00:03:33.08
10. PopTSourcePorts.log 00:03:16.68
11. PopTTZ.log 00:03:15.38
Grand Total = 02:24:15.63 or 8,655.63 seconds
4.4.2 Disk Space Requirement
The process for determining the disk space requirement was discussed in section 3.6.1.
Table 22 shows the table sizes for each of the normalized tables and the corresponding

63
associative tables. The sizes are measured in kilobytes (KB) and the total in gigabytes (GB).
The additional disk space of 1.36GB is not a substantial increase.
Table 22. Table Sizes
Table Name Size KB
TBASENAME .47
TBASENAME_LINK 240194.84
TDESTINATION_IP 15693.54
TDESTINATION_IP_LINK 110054.61
TDESTPORTS 544.05
TDESTPORT_LINK 81689.03
TMESSAGE_TYPE 3.47
TMESSAGE_TYPE_LINK 270435.92
TREPORTIP 4.16
TREPORTIP_LINK 269978.55
TSOURCEPORTS 568.93
TSOURCEPORT_LINK 81665.1
TSOURCE_IP 7016.52
TSOURCE_IP_LINK 113502.11
TTIMEZONE .05
TTIMEZONE_LINK 231300.3
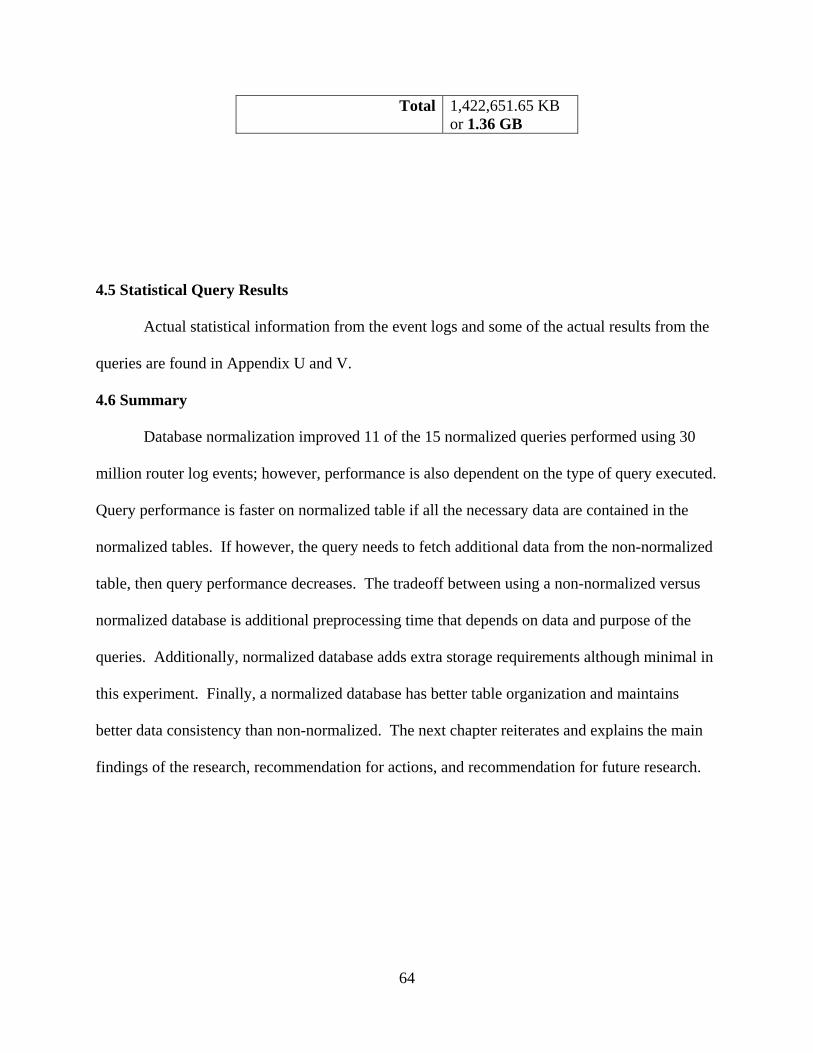
64
Total 1,422,651.65 KB or 1.36 GB
4.5 Statistical Query Results
Actual statistical information from the event logs and some of the actual results from the
queries are found in Appendix U and V.
4.6 Summary
Database normalization improved 11 of the 15 normalized queries performed using 30
million router log events; however, performance is also dependent on the type of query executed.
Query performance is faster on normalized table if all the necessary data are contained in the
normalized tables. If however, the query needs to fetch additional data from the non-normalized
table, then query performance decreases. The tradeoff between using a non-normalized versus
normalized database is additional preprocessing time that depends on data and purpose of the
queries. Additionally, normalized database adds extra storage requirements although minimal in
this experiment. Finally, a normalized database has better table organization and maintains
better data consistency than non-normalized. The next chapter reiterates and explains the main
findings of the research, recommendation for actions, and recommendation for future research.

65
V. Conclusion and Recommendations
Chapter Overview
This chapter discusses the conclusions of the research, its significance, recommendation
for actions and future research.
Conclusions of Research
The two prevailing event log standards today are, MITRE’s CEE and the Syslog protocol
(RFC 5424). Regulatory compliance and network security issues have increased the importance
of event logs to many organizations. Log analysis still remain complex due to lack of industry
standards, lack of simple and efficient analysis methods to process numerous amount of logs
generated daily.
Event logs can provide cyber situational awareness to management and other network
users in the organization. Proper event log utilization through information systems monitoring
and threat detection enhances mission assurance and information assurance. Database analysis
of event logs is only one of the tools in the information system security toolbox that is still
limited and dependent on the human operator’s understanding and knowledge of the entire
situation. One way to increase understanding of a situation is to correlate different events
wherein logs contribute critical data for analysis.
Event log analysis can be performed using relational databases. To enhance database
query performance, databases are usually denormalized. However, database normalization can
also increase query performance. Database normalization improved majority of the queries
performed using 30 million router log events; however, performance is also dependent on the
type of query executed. Query performance is faster on normalized table if all the necessary data
are contained in the normalized tables. If however, the query needs to fetch additional data from

66
the non-normalized table, then query performance decreases. The tradeoff between using a non-
normalized versus normalized database is additional preprocessing time that depends on data and
purpose of the queries. Additionally, normalized database adds extra storage requirements
although minimal in this experiment. Finally, a normalized database has better table
organization and maintains better data consistency than non-normalized.
Significance of Research
This research explored the different standards for event log generation, transport, storage,
and analysis. It showed that database normalization does not always decrease query performance
on databases. Database normalization enhanced performance for majority of the queries and will
improve event log analysis for network defenders. Eleven of the 15 of the normalized queries,
on average performed 2.77 times faster than non-normalized queries. There is a total of 270
seconds advantage in average mean query time for normalized queries. This experiment also
established an early model for log analysis that is simple, customizable, and cost effective option
to commercial log analyzers.
Recommendations for Action
One of the main findings of this research is that database query performance on event
logs can be faster using normalized tables if all the data required is in the normalized tables. In
most cases where the data required are not contained in the normalized tables, query
performance degrades. If the queries that need to be performed on the event logs are known
ahead of time, then the tables can be normalized to fit the queries in order to capture all the
required data and avoid fetching them from the non-normalized table. Queries must be written to
exclusively utilize the normalized tables and avoid referring back to the non-normalized table as
much as possible to take advantage of faster performance. However, there are cases when the

67
queries and questions that an organization needs to ask are not pre-determined. If a new type of
query is needed, the normalized tables can be updated and renormalized. The analyst, therefore,
should consider the pre-processing time required and the frequency of the queries. For example,
if a query is only required once, it may not be practical to normalize the tables for this purpose as
the analyst can just directly query the non-normalized table. The decision to normalize the tables
should be a balance between the pre-processing time required and the desired purpose of the
query. Organizations can also implement a weighted-query approach where certain queries are
assigned levels of importance and normalization can be tailored to the most important ones.
Since performances vary from the type of queries, organizations may prefer a slower
performance on some and faster on queries that are more important.
There is no fail-safe solution for normalizing event logs. Just like any other information
systems solutions, the decision should be made based on the mission. Not every organization or
base has similar missions and therefore the purpose for analyzing event logs could vary
significantly. For instance, an organization that still uses Telnet to perform its mission may not
be very interested in Telnet permitted connections; however, an organization that does not use
Telnet should be very interested in Telnet type logs. IT personnel who understand the local
mission can make better judgments of the results and take timely and decisive actions. Finally,
proper Information Assurance requires the validation and verification of the integrity of results
generated by a commercial log analysis tool. Network defenders can use this relational database
to collect and analyze event log data to provide the ability to validate results generated by
commercial tools.

68
Recommendations for Future Research
Despite the important and significant findings of this research, there are still several
follow-up studies that can expand the results. This research was only conducted on one set of
30M records. A future study can perform further performance analysis using lower incremental
amount of event logs (300K and 30K) and compare the performances. What is the query
performance difference between non-normalized and normalize databases if the total size of the
logs is 30M, 300K, and 30K? Does the total size of event logs affect the query performance of
non-normalized and normalize databases? Moreover, can further normalization of the logs by
creating additional normalized tables increase or decrease query performance? Creating
additional normalized tables will minimize the need to fetch for additional data from the non-
normalized logs, which can improve query performance, however it can complicate the queries
and add additional joins. Another future research is to create a model to determine what
variables are predictive of slowing down query performance. Does the maximum number of
rows processed, number of joins, physical reads and others correlate to slow query performance?
Finally, this experiment only used Cisco router and switch event logs but should be applicable to
other cyber logs; a future study using other event logs can validate the results.

69
APPENDIX A
Severity Level Description
0 - emergency System is unusable
1 - alert Immediate action required
2 - critical Critical condition
3 - error Error condition
4 - warning Warning condition
5 - notification Normal but significant condition
6 - informational Informational message only
7 - debugging Message that appears during debugging only
Event Logs Severity Code (Lonvick, 2001) p. 9

70
APPENDIX B
Attribute Type Description
LogID INTEGER, Primary key and unique identifier for each record BaseName VARCHAR2(20), The name of the base/location where the log came
from LogDateTime TIMESTAMP, The timestamp from the log server ReportIP VARCHAR2(20), The IP address of the reporting router ReportIPNum INTEGER, The decimal equivalent of the report IP address RouterNum INTEGER, The router sequence number assigned to each
event RouterNum2 INTEGER, A second router sequence number assigned to each
event RouterDateTime TIMESTAMP, The timestamp from the router RouterMsecs INTEGER, Millisecond from the timestamp from the router TimeZone VARCHAR2(6), Time zones in the logs MessageType VARCHAR2(35), Identifies the type of message or event SourceIP VARCHAR2(20), Source IP address of the event recorded SourceIPNum INTEGER, The decimal equivalent of the Source IP address SourcePort INTEGER, Source port numbers in the logs DestinationIP VARCHAR2(20), Destination IP address of the event recorded DestinationIPNum INTEGER, The decimal equivalent of the destination IP
address DestinationPort INTEGER, Destination port numbers in the logs

71
APPENDIX C
Parselog.PL Description This a script to extract relevant elements from a Cisco syslog file and write it into a CSV file that can be easily imported into Oracle. This file must be present in each of the base folders. #!/usr/bin/perl use warnings; # use strict; # # parselog.pl -- a script to extract relevant elements from a cisco syslog file # and write it into a CSV file that can be easily imported into oracle # # Version 1.0 - Initial version - 02/28/11 # Version 1.2 - Fixed error in line count - 03/01/11 # Version 1.2 - Fixed variable router message numbers - 03/02/11 # Version 1.3 - Fixed millisecond to zero when not present - 03/03/11 # Version 1.4 - Fixed status message - 03/03/11 # Version 1.5 - Fixed bug in identifying dotted decimal - 03/04/11 # Version 1.6 - Fixed bug in router time trailing colon - 03/04/11 # Version 1.7 - Rewrite - 03/06/11 # Version 1.8 - Debug - 03/07/11 # Version 1.9 - Debug - 03/09/11 # Version 2.0 - Debug - 03/10/11 # Version 2.1 - Debug - 03/16/11 # Version 2.2 - Debug - 03/17/11 # # Oracle create table contents: # BaseName VARCHAR2(10), # LogDateTime TIMESTAMP, # ReportIP VARCHAR2(20), # ReportIP_Long INTEGER, # RouterNum INTEGER, # RouterNum2 INTEGER, # RouterDateTime TIMESTAMP, # RouterMsecs INTEGER, # TimeZone VARCHAR2(5), # MessageType VARCHAR2(35), # SourceIP VARCHAR2(20), # SourceIPNum INTEGER, # SourcePort INTEGER, # DestinationIP VARCHAR2(20), # DestinationIPNum INTEGER,

72
# DestinationPort INTEGER, # Token1 VARCHAR2(40), # Token2 VARCHAR2(40), # Token3 VARCHAR2(40), # Token4 VARCHAR2(40), # Token5 VARCHAR2(40), # Token6 VARCHAR2(40), # Token7 VARCHAR2(40), # Token8 VARCHAR2(40), # Token9 VARCHAR2(40), # Token10 VARCHAR2(40), # Token11 VARCHAR2(40), # Token12 VARCHAR2(40), # Token13 VARCHAR2(40), # Token14 VARCHAR2(40), # Token15 VARCHAR2(40), # Token16 VARCHAR2(40), # Token17 VARCHAR2(40), # Token18 VARCHAR2(40), # Token19 VARCHAR2(40), # Token20 VARCHAR2(40), # Token21 VARCHAR2(40), # Token22 VARCHAR2(40), # Token23 VARCHAR2(40), # Token24 VARCHAR2(40), # Token25 VARCHAR2(40), # Token26 VARCHAR2(40), # Token27 VARCHAR2(40), # Token28 VARCHAR2(40), # Token29 VARCHAR2(40), # Token30 VARCHAR2(40)); # subroutine to convert IP dotted decimal to LONG integer sub ip2long { my $address = $_[0]; (my $a, my $b, my $c, my $d) = split '\.', $address; my $decimal = $d + ($c * 256) + ($b * 256**2) + ($a * 256**3); return $decimal; } # Subroutine to convert LONG integer to IP dotted decimal sub dec2dot { my $address = $_[0]; my $d = $address % 256; $address -= $d; $address /= 256;

73
my $c = $address % 256; $address -= $c; $address /= 256; my $b = $address % 256; $address -= $b; $address /= 256; my $a = $address; my $dotted="$a.$b.$c.$d"; return $dotted; } # Subroutine to check if month is legal sub checkmonth { my $month = $_[0]; my $result = 0; if( ($month eq "Jan") || ($month eq "Feb") || ($month eq "Mar") || ($month eq "Apr") || ($month eq "May") || ($month eq "Jun") || ($month eq "Jul") || ($month eq "Aug") || ($month eq "Sep") || ($month eq "Oct") || ($month eq "Nov") || ($month eq "Dec") ) { # its a valid month $result = 1; return $result; } else { # it is not a valid month $result = 0; return $result; } return $result; } # Subroutine to check if string is a valid day sub checkday { my $day = $_[0]; my $result = 0; # check to assure day is in range if( ($day >= 1) && ($day <= 31) ) { # it is a valid day $result = 1; return $result; } else { # it is not a valid day

74
$result = 0; return $result; } return $result; } # Subroutine to check if string is a time sub checktime { my $time = $_[0]; my $result = 0; # print "checktime: " . $time . "\n"; (my $hour, my $minute, my $second) = split '\:', $time; # print "H: " . $hour . " M: " . $minute . " S: " . $second . "\n"; # check to assure time is in range if( ($hour >= 0) && ($hour <= 23) && ($minute >= 0) && ($minute <= 59) && ($second >= 0) && ($second <= 59) ) { # it is a valid time $result = 1; return $result; } else { # it is not a valid time $result = 0; return $result; } return $result; } # Subroutine to check if string is a time with milliseconds sub checkmtime { my $time = $_[0]; my $result = 0; my $isaperiod = "."; # print "checkmtime: " . $time . "\n"; (my $hour, my $minute, my $second) = split '\:', $time;

75
my $msecond = ""; my $hasfraction = rindex $second,$isaperiod; if ($hasfraction eq -1) { # does not have a period, so no fraction $result = 0; return $result; } else { # does have a period, so we need to extract it $msecond = substr($second,-3); $second = substr($second,0,-4); } # print "H: " . $hour . " M: " . $minute . " S: " . $second . " Milli: " . $msecond . "\n"; # check to assure time is in range if( ($hour >= 0) && ($hour <= 23) && ($minute >= 0) && ($minute <= 59) && ($second >= 0) && ($second <= 59) && ($msecond >= 0) && ($msecond <= 999) ) { # it is a valid time $result = 1; return $result; } else { # it is not a valid time $result = 0; return $result; } return $result; } # Subroutine to check if string has a trailing colon sub checktrailingcolon { my $message = $_[0]; my $result = 0; my $colon = ":"; # get string length

76
my $length = length $message; # valid message should have trailing colon my $found = index $message,$colon; # adjust for zero position string $found = $found + 1; # print "String Length: " . $length . " Colon Found at: " . $found . "\n"; if($found ne $length) { $result = 0; return $result; } else { $result = 1; return $result; } return $result; } # Subroutine to check if string is a valid time zone sub checktimezone { my $timezone = $_[0]; my $result = 0; # check for trailing colon my $hastrailingcolon = checktrailingcolon($timezone); if($hastrailingcolon eq 1) { # verify time zone is valid eventually $result = 1; return $result; } else { # invalid time zone $result = 0; return $result; } return $result; } # Subroutine to check if string is a message type

77
sub checkmessagetype { my $message = $_[0]; my $result = 0; my $colon = ":"; my $percent = "%"; # print "checkmessagetype: " . $message . "\n"; # get string length my $length = length $message; # valid message should have leading percent my $foundpercent = index $message,$percent; # valid message should have trailing colon my $foundcolon = index $message,$colon; # print "String Length: " . $length . " Colon Found at: " . $foundcolon . " Percent Found at: " . $foundpercent . "\n"; if($foundcolon ne ($length-1)) { $result = 0; return $result; } else { if($foundpercent eq 0) { $result = 1; return $result; } else { $result = 0; return $result; } } return $result; } sub checkmessagenumber { my $message = $_[0]; my $result = 0;

78
# make sure this ends with a colon my $trailingcolon = checktrailingcolon($message); if($trailingcolon eq 1) { # it has a trailing colon } else { # no trailing colon $result = 0; return $result; } # now verify that it has only numbers # strip trailing colon $message = substr($message,0,-1); if($message =~ /^[+-]?\d+$/ ) { # it is a number $result = 1; return $result; } else { # it is not a number, but had a colon $result = 2; return $result; } return $result; } # Subroutine to check if there are three dots in string sub checkthreedots { my $address = $_[0]; my $result = 0; my $i = 0; my $found = 0; my $look = 1; my $dot = "."; # get string length my $length = length $address; # check to see if there are three dots in the string

79
for($i = 1; $i <= 3; $i++) { $found = index $address,$dot,$found+1; if($found eq -1) { $result = 0; # print "checkthreedots: NO three dots! " . $address . "\n"; return $result; } } $result = 1; # print "checkthreedots: YES three dots! " . $address . "\n"; return $result; } # Subroutine to check if string is a valid IP address # we are checking for 129.12.34.22 or (129.23.34.55) sub checkIPAddress { my $address = $_[0]; my $result = 0; my $i = 0; my $found = 0; my $foundopen = 0; my $foundclose = 0; my $foundcomma = 0; my $look = 1; my $dot = "."; my $openparen = "("; my $closeparen = ")"; my $comma = ","; # set result to OK $result = 1; # get string length my $length = length $address; # printf "checkIPaddress checking: " . $address . "\n"; # check to see if there are three dots in the string for($i = 1; $i <= 3; $i++) { $found = index $address,$dot,$found+1; if($found eq -1) {

80
$result = 0; return $result; } } # printf "checkIPaddress saw three dots! " . $address . "\n"; # check to see if there is an open parenthesis $foundopen = index $address,$openparen; # check to see if there is an close parenthesis $foundclose = index $address,$closeparen; # see if there is a comma $foundcomma = index $address,$comma; # print "Open: " . $foundopen . " Close: " . $foundclose . " Comma: " . $foundcomma . " Length: " . $length . "\n"; # check for (IP address) my $endofstring = $length - 1; if( ($foundopen eq 0) && ($foundclose eq $endofstring) ) { # print "Removing parenthesis\n"; # yes, so remove leading and trailing parenthesis $result = 2; # strip out leading paren from IP address $address = substr($address,1); # strip out trailing paren chop $address; } else { if($foundcomma eq $endofstring) { $result = 3; # strip out trailing comma chop $address; } } (my $a, my $b, my $c, my $d) = split '\.', $address; if( ( $a =~ /^[+-]?\d+$/ ) && ( $b =~ /^[+-]?\d+$/ ) && ( $c =~ /^[+-]?\d+$/ ) && ( $d =~ /^[+-]?\d+$/ ) ) {

81
# it is a number } else { # it is not a number $result = 0; return $result; } # print "IP elements: " . $a . "." . $b . "." . $c . "." . $d . "\n"; # check to assure each element is in range if( ($a >= 0) && ($a <= 255) && ($b >= 0) && ($b <= 255) && ($c >= 0) && ($c <= 255) && ($d >= 0) && ($d <= 255) ) { # it is a valid IP address # printf "checkIPaddress reports valid: " . $address . "\n"; return $result; } else { # it is not a valid IP address $result = 0; return $result; } return $result; } # Subroutine to check if string is a valid IP and port address combined # we are check for this type of string 207.133.169.118(57785) # can also be 201.22.33.44:23 sub checkIPPortAddress { my $address = $_[0]; my $result = 0; my $i = 0; my $found = 0; my $foundopen = 0; my $foundclose = 0; my $foundcolon = 0; my $look = 1; my $dot = "."; my $comma = ","; my $colon = ":"; my $openparen = "(";
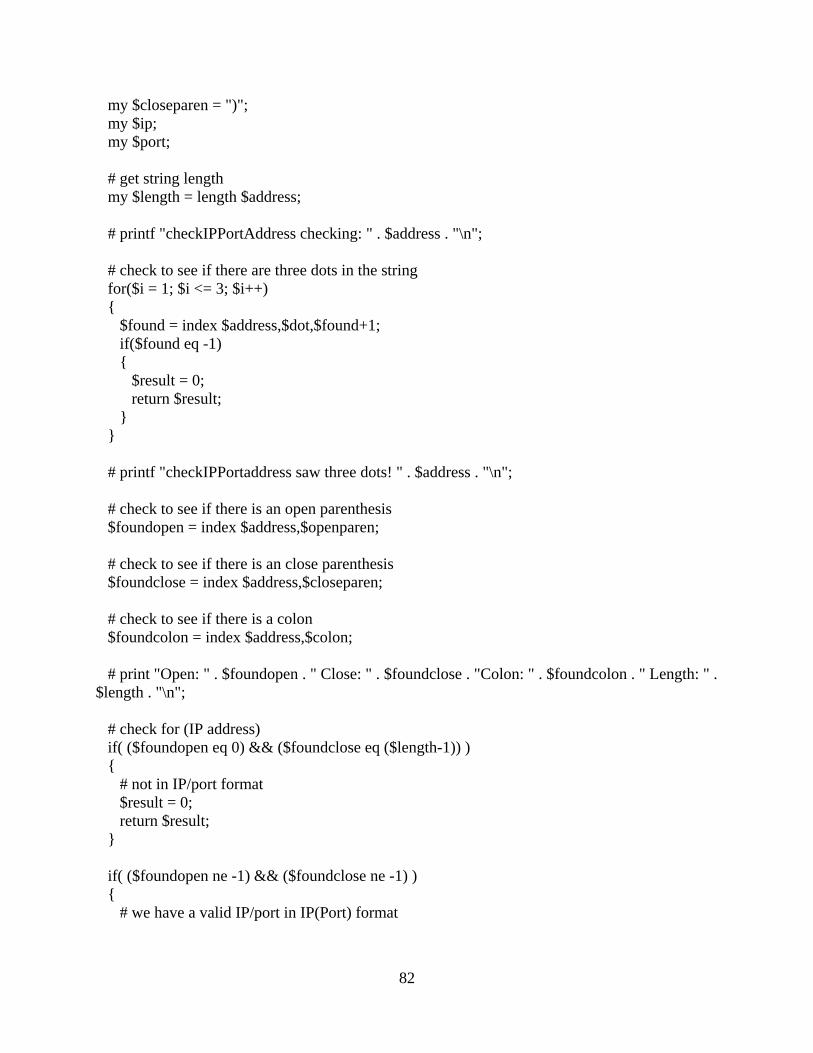
82
my $closeparen = ")"; my $ip; my $port; # get string length my $length = length $address; # printf "checkIPPortAddress checking: " . $address . "\n"; # check to see if there are three dots in the string for($i = 1; $i <= 3; $i++) { $found = index $address,$dot,$found+1; if($found eq -1) { $result = 0; return $result; } } # printf "checkIPPortaddress saw three dots! " . $address . "\n"; # check to see if there is an open parenthesis $foundopen = index $address,$openparen; # check to see if there is an close parenthesis $foundclose = index $address,$closeparen; # check to see if there is a colon $foundcolon = index $address,$colon; # print "Open: " . $foundopen . " Close: " . $foundclose . "Colon: " . $foundcolon . " Length: " . $length . "\n"; # check for (IP address) if( ($foundopen eq 0) && ($foundclose eq ($length-1)) ) { # not in IP/port format $result = 0; return $result; } if( ($foundopen ne -1) && ($foundclose ne -1) ) { # we have a valid IP/port in IP(Port) format

83
# separate IP and port number $port = substr($address,$foundopen+1); # get rid of last character, if its a , we must chop again my $res = chop $port; if($res eq $comma) { chop $port; } $ip = substr($address, 0, $foundopen); } else { if( $foundcolon ne -1) { # we have a valid IP/port in IP:port format # separate IP and port number $port = substr($address,$foundcolon+1); $ip = substr($address, 0, $foundcolon); } else { # no a valid IP/port $result = 0; return $result; } } # print "IP: " . $ip . " Port: " . $port . "\n"; (my $a, my $b, my $c, my $d) = split '\.', $ip; # print "IP elements: " . $a . "." . $b . "." . $c . "." . $d . "\n"; if( ( $a =~ /^[+-]?\d+$/ ) && ( $b =~ /^[+-]?\d+$/ ) && ( $c =~ /^[+-]?\d+$/ ) && ( $d =~ /^[+-]?\d+$/ ) ) { # it is a number } else { # it is not a number $result = 0; return $result; } # check to assure each element is in range

84
if( ($a >= 0) && ($a <= 255) && ($b >= 0) && ($b <= 255) && ($c >= 0) && ($c <= 255) && ($d >= 0) && ($d <= 255) ) { # it is a valid IP address $result = 1; # printf "checkIPPortaddress reports valid: " . $address . " IP: " . $ip . " Port: " . $port . "\n"; return $result; } else { # it is not a valid IP address $result = 0; return $result; } return $result; } # main programs starts here! # get the number of command line arguments my $numArgs = $#ARGV + 1; # assure there are three arguments: infile base year if($numArgs ne 3) { # foreach $argnum (0 .. $#ARGV) # { # print "$ARGV[$argnum]\n"; # } print "USAGE: parselog logfilename base year\n"; # beep print "\a"; exit(1); } # extract infile, base, year my $logfilename = $ARGV[0]; my $basename = $ARGV[1]; my $logyear = $ARGV[2]; # create output file name my $outfilename = $logfilename . ".csv"; # print status message print "Logname: " . $logfilename . " Base: " . $basename . " Year: " . $logyear . " Out File: " . $outfilename . "\n"; # open input file for read

85
open(INLOG, "<$logfilename") or die "Can't open input log file: $logfilename : $!"; # open output file for write open(OUTFILE, ">$outfilename") or die "Can't open output csv file: $outfilename : $!"; # number of lines processed my $count = 0; # maximum number of elements my $maxelements = 0; # set up some string constants for comparison my $isacolon = ":"; my $isaperiod = "."; my $isanasterix = "*"; my $isapercent = "%"; my $isaopenparen = "("; my $isacloseparen = ")"; my $isacomma = ","; # element counter my $i = 0; # variables to identify is given character is in a substring my $hascolon = 0; my $hasaperiod = 0; my $hasdots = 0; # variable to identity elements as bad my $goodbase = 1; my $goodlogdatetime = 1; my $goodreportIP = 1; my $goodmsgnum1 = 1; my $goodmsgnum2 = 1; my $goodrepdatetime = 1; my $goodrepmilli = 1; my $goodtimezone = 1; my $goodmessagetype = 1; my $goodsourceip = 1; my $goodsourcedate = 1; my $gooddestip = 1; my $gooddestport = 1; while (<INLOG>) { my $line = $_;

86
# variable used to identify the current line type my $linetype = 0; my $formatted = ""; my $isvalidIP = 0; my $isvalidlogmonth = 0; my $isvalidlogday = 0; my $isvalidlogtime = 0; my $isvalidgenmonth = 0; my $isvalidgenday = 0; my $isvalidgentime = 0; my $logIPnum = 0; my $hastwomessagenumbers = 0; my $scrub = ""; my $sourceip = 0; my $sourceport = 0; my $destip = 0; my $destport = 0; my $foundopen = 0; my $foundclose = 0; my $foundcolon = 0; my $gentimelength = 0; my $missingtimezone = 0; my $k = 0; # added 09 JAN 2012 my @IPs = (); my @IPNums = (); my @Port = (); $count = $count + 1; # print "Processing line " . $count . "\n"; $i = 1; # make sure signame array is clear for each line before filling for($k=1; $k<35; $k++) { $signame[$k] = ""; } # split the line into tokens - I have seen as many as 33! foreach my $name (split(' ', $line)) { $signame[$i] = $name;

87
# printf("Element: " . $i . " Name: " . $name . " Value: " . $signame[$i] . "\n"); $i++; } if($i > $maxelements) { $maxelements = $i; } # this chunk of code is used to determine line type $linetype = 0; # set logyear based upon current month if( ($signame[1] eq "Jan") || ($signame[1] eq "Feb") || ($signame[1] eq "Mar") ) { $logyear = "2011"; } else { $logyear = "2010"; } # check fourth element to assure its a valid IP address $isvalidIP = checkIPAddress($signame[4]); if($isvalidIP eq 1) { # it is a valid IP address $logIPnum = ip2long($signame[4]); # now check each of the basic elements of the line # Jan 1 00:00:25 132.35.194.5 233343: Jan 1 00:00:24.502 GMT: %LINK-4-ERROR: FastEthernet0/21 is experiencing errors # Month Day Time IP MessageNum Month Day Time TimeZOne Message Type Message_Elements $isvalidlogmonth = checkmonth($signame[1]); if($isvalidlogmonth eq 1) { # it is a valid log month } else { # invalid log month printf("Invalid log month: " . $signame[1] . "\n"); }

88
$isvalidlogday = checkday($signame[2]); if($isvalidlogday eq 1) { # it is a valid log day } else { # invalid log day printf("Invalid log day: " . $signame[2] . "\n"); } $isvalidlogtime = checktime($signame[3]); if($isvalidlogtime eq 1) { # it is a valid log time } else { # invalid log time printf("Invalid log time: " . $signame[3] . "\n"); } # check first message number $isvalidmsgnum1 = checkmessagenumber($signame[5]); if($isvalidmsgnum1 eq 1) { # it is a valid message number # strip trailing colon # $signame[5] = substr($signame[5],0,-1); chop $signame[5]; } else { # Dec 21 16:14:47 138.13.215.203 last message repeated 3 times # this is a status line that starts at element 5 $linetype = 5; # skip additional processing goto CHECKTOIPCHECKER; # invalid message number printf("Invalid message number: " . $signame[5] . "\n"); } # check for a second message number $isvalidmsgnum2 = checkmessagenumber($signame[6]); if($isvalidmsgnum2 eq 1) {

89
# it is a number - has two message numbers $hastwomessagenumbers = 1; $linetype = 3; # it is a valid message number # strip trailing colon # $signame[6] = substr($signame[6],0,-1); chop $signame[6]; $isvalidgenmonth = checkmonth($signame[7]); if($isvalidgenmonth eq 1) { # it is a valid gen month } else { # invalid gen month # try again after striping first character as we have seen # Jan 4 21:17:32 131.47.101.2 1867: *Jan 4 21:36:43 UTC: %LINK-3-UPDOWN: Interface FastEthernet0/16 changed state to down $tryagain = substr($signame[7],1); $isvalidgenmonth = checkmonth($tryagain); if($isvalidgenmonth eq 1) { # it is a valid gen month $signame[7] = substr($signame[7],1); } else { printf("Invalid gen month: " . $signame[7] . "\n"); } } $isvalidgenday = checkday($signame[8]); if($isvalidgenday eq 1) { # it is a valid gen day } else { # invalid gen day printf("Invalid gen day: " . $signame[8] . "\n"); } $isvalidgenmtime = checkmtime($signame[9]); if($isvalidgenmtime eq 1) {

90
# it is a valid gen mtime } else { # invalid gen mtime $isvalidgentime = checktime($signame[9]); if($isvalidgentime eq 1) { # it is a valid gen time } else { printf("Invalid gen time: " . $signame[9] . " Line: " . $count . "\n"); } } $gentimelength = length $signame[9]; if( ( $gentimelength eq 9 ) || ( $gentimelength eq 13 ) ) { # missing timezone because times HH:MM:SS: or HH:MM:SS:mm: results in no TZ # print "Missing TZ\n"; $missingtimezone = 1; } # print "signame[9]: " . $signame[9] . "gentimelength: " . $gentimelength . "\n"; if($missingtimezone eq 0) { # validate time zone $goodtimezone = checktimezone($signame[10]); if($goodtimezone eq 1) { # it is a valid timezone # strip out trailing : from time zone $signame[10] = substr($signame[10],0,-1); } else { # invalid timezone printf("Invalid time zone: " . $signame[10] . "\n"); } # validate message type $goodmessagetype = checkmessagetype($signame[11]); if($goodmessagetype eq 1) { # it is a valid message type # strip out leading % from message type

91
$signame[11] = substr($signame[11],1); # strip out trailing : from message type # $signame[11] = substr($signame[11],0,-1); chop $signame[11]; } else { # invalid message type printf("Invalid message type: " . $signame[11] . " Line: " . $count . " Linetype: " . $linetype . "\n"); } } else { # validate message type $goodmessagetype = checkmessagetype($signame[10]); if($goodmessagetype eq 1) { # it is a valid message type # strip out leading % from message type $signame[10] = substr($signame[10],1); # strip out trailing : from message type # $signame[10] = substr($signame[10],0,-1); chop $signame[10]; } else { # invalid message type printf("Invalid message type: " . $signame[10] . " Line: " . $count . " Linetype: " . $linetype . "\n"); } } } else { if($isvalidmsgnum2 eq 2) { # odd ball # example: Jan 4 00:35:53 131.47.103.1 35299: 1y8w: %SEC-6-IPACCESSLOGS: list 25 denied 131.47.102.47 3 packets $linetype = 2; } else { # no second message number, so default line type 0 is OK $hastwomessagenumbers = 0;

92
$isvalidgenmonth = checkmonth($signame[6]); if($isvalidgenmonth eq 1) { # it is a valid gen month } else { # invalid gen month # try again after striping first character as we have seen # Jan 4 21:17:32 131.47.101.2 1867: *Jan 4 21:36:43 UTC: %LINK-3-UPDOWN: Interface FastEthernet0/16 changed state to down $tryagain = substr($signame[6],1); $isvalidgenmonth = checkmonth($tryagain); if($isvalidgenmonth eq 1) { # it is a valid gen month $signame[6] = substr($signame[6],1); } else { # this is a status line that starts at element 6 $linetype = 4; # skip additional processing goto CHECKTOIPCHECKER; # this is a status message # printf("Invalid gen month: " . $signame[6] . "\n"); } } $isvalidgenday = checkday($signame[7]); if($isvalidgenday eq 1) { # it is a valid gen day } else { # invalid gen day printf("Invalid gen day: " . $signame[7] . "\n"); } $isvalidgenmtime = checkmtime($signame[8]); if($isvalidgenmtime eq 1) { # it is a valid gen mtime }

93
else { # invalid gen mtime $isvalidgentime = checktime($signame[8]); if($isvalidgentime eq 1) { # it is a valid gen time } else { printf("Invalid gen time: " . $signame[8] . " Line: " . $count . "\n"); } } $gentimelength = length $signame[8]; if( ( $gentimelength eq 9 ) || ( $gentimelength eq 13 ) ) { # missing timezone because times HH:MM:SS: results in no TZ # print "Missing TZ\n"; $missingtimezone = 1; } # print "signame[8]: " . $signame[8] . "gentimelength: " . $gentimelength . "\n"; if($missingtimezone eq 0) { # validate time zone $goodtimezone = checktimezone($signame[9]); if($goodtimezone eq 1) { # it is a valid timezone # strip out trailing : from time zone $signame[9] = substr($signame[9],0,-1); } else { # invalid timezone printf("Invalid time zone: " . $signame[9] . "\n"); } # validate message type $goodmessagetype = checkmessagetype($signame[10]); if($goodmessagetype eq 1) { # it is a valid message type # strip out leading % from message type $signame[10] = substr($signame[10],1); # strip out trailing : from message type

94
# $signame[10] = substr($signame[10],0,-1); chop $signame[10]; } else { # invalid message type printf("Invalid message type: " . $signame[10] . " Line: " . $count . " Linetype: " . $linetype . "\n"); } } else { # validate message type $goodmessagetype = checkmessagetype($signame[9]); if($goodmessagetype eq 1) { # it is a valid message type # strip out leading % from message type $signame[9] = substr($signame[9],1); # strip out trailing : from message type # $signame[9] = substr($signame[9],0,-1); chop $signame[9]; } else { # invalid message type printf("Invalid message type: " . $signame[9] . " Line: " . $count . " Linetype: " . $linetype . "\n"); } } } } } else { # invalid IP address $linetype = 1; # printf("Invalid IP address: " . $signame[4] . " Line: " . $count . "\n"); } # print "Linetype: " . $linetype . " HasTwoMessageNumbers: " . $hastwomessagenumbers . "\n"; my $routertime = ""; my $routerfraction = ""; my $routertimehastrailingcolon = 0;

95
my $hasperiod = 0; my $haspercent = 0; my $hasfraction = ""; my $hasanasterix = 0; my $timelength = 0; # extract router time and router fraction # remove : from time zone # remove % and : from message type if($hastwomessagenumbers eq 1) { # this has two message numbers so # month = signame[7] # day = signame[8] # time = signame[9] # print "Two message numbers Time: " . $signame[9] . "\n"; $hasfraction = rindex $signame[9],$isaperiod; if ($hasfraction eq -1) { # does not have a period, so no fraction $routertime = $signame[9]; # the time should be HH:MM:SS so length = 8 $timelength = length $routertime; # print "Time Length: " . $timelength . "\n"; # if there is a trailing colon, nuke it if($timelength eq 9) { # $routertime = substr($routertime,0,-1); chop $routertime; # flag this $routertimehastrailingcolon = 1; } $routerfraction = 0; } else { # does have a period, so we need to extract the time and the fraction #$routertime = substr($signame[9],0,-4); $routertime = substr($signame[9],0,$hasfraction); # print "Router Time: " . $routertime . "\n"; # the time should be HH:MM:SS so length = 8

96
$timelength = length $routertime; # print "Time Length: " . $timelength . "\n"; # if there is a trailing colon, nuke it if($timelength eq 9) { # $routertime = substr($routertime,0,-1); chop $routertime; $routertimehastrailingcolon = 1; } #$routerfraction = substr($signame[9],-3); $routerfraction = substr($signame[9],$hasfraction+1); # print "Router Fraction: " . $routerfraction . "\n"; # check for trailing colon $hascolon = rindex $routerfraction,$isacolon; if ($hascolon eq -1) { # no colon } else { # has a colon $routertimehastrailingcolon = 1; chop $routerfraction; } # print "Router Fraction: " . $routerfraction . "\n"; } # make sure month does not have a leading * $hasanasterix = rindex $signame[7],$isanasterix; if ($hasanasterix eq -1) { # does not have an asterix, so do nothing } else { # does have an asterix, so we need to delete it $signame[7] = substr($signame[7],1); } } else { # this has one message number so # month = signame[6] # day = signame[7] # time = signame[8]

97
$hasfraction = rindex $signame[8],$isaperiod; if ($hasfraction eq -1) { # does not have a period, so no fraction $routertime = $signame[8]; # the time should be HH:MM:SS so length = 8 $timelength = length $routertime; # print "Time Length: " . $timelength . "\n"; # if there is a trailing colon, nuke it if($timelength eq 9) { # $routertime = substr($routertime,0,-1); chop $routertime; $routertimehastrailingcolon = 1; } $routerfraction = 0; } else { # does have a period, so we need to extract it # take first eight characters of time # $routertime = substr($signame[8],0,8); $routertime = substr($signame[8],0,$hasfraction); # the time should be HH:MM:SS so length = 8 $timelength = length $routertime; # print "Time Length: " . $timelength . "\n"; # if there is a trailing colon, nuke it if($timelength eq 9) { # $routertime = substr($routertime,0,-1); chop $routertime; $routertimehastrailingcolon = 1; } # $routerfraction = substr($signame[8],-3); $routerfraction = substr($signame[8],$hasfraction+1); # $fractionlength = length $routerfraction; # check for trailing colon $hascolon = rindex $routerfraction,$isacolon; if ($hascolon eq -1) { # no colon }

98
else { # has a colon $routertimehastrailingcolon = 1; chop $routerfraction; } # print "Router Fraction: " . $routerfraction . "\n"; } # make sure month does not have a leading * $hasanasterix = rindex $signame[6],$isanasterix; if ($hasanasterix eq -1) { # does not have an asterix, so do nothing } else { # does have an asterix, so we need to delete it $signame[6] = substr($signame[6],1); } } #for($j=1; $j<$i; $j++) #{ # print "Element \$signame [" . $j . "]: " . $signame[$j] . " Length: " . (length $signame[$j]) . "\n"; #} CHECKTOIPCHECKER: # try to extract IP and port addresses from regular (non status) messages my $hasplainip = 0; my $hasipport = 0; my $hasthreedots = 0; my $ipsfound = 0; my $startlookingat = 0; if($hastwomessagenumbers eq 1) { # start looking at $signame[12] if TZ is there, otherwise at $signame[11] if($missingtimezone eq 0) { $startlookingat = 12; } else { $startlookingat = 11;
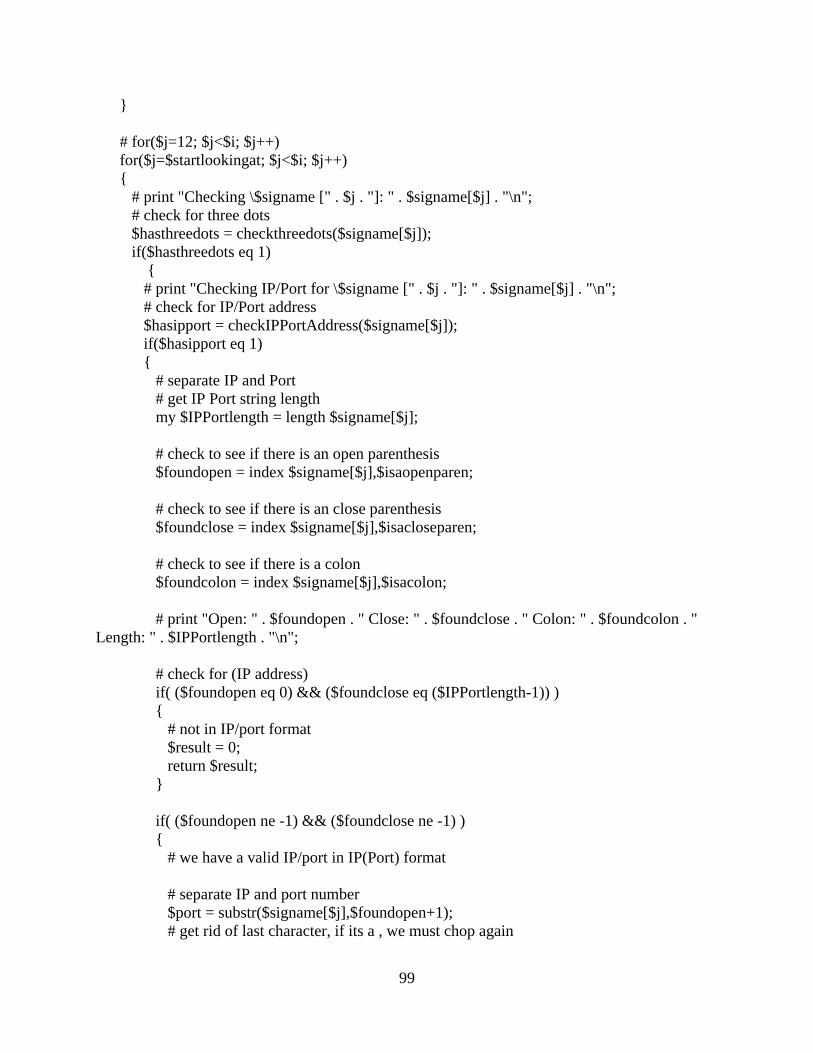
99
} # for($j=12; $j<$i; $j++) for($j=$startlookingat; $j<$i; $j++) { # print "Checking \$signame [" . $j . "]: " . $signame[$j] . "\n"; # check for three dots $hasthreedots = checkthreedots($signame[$j]); if($hasthreedots eq 1) { # print "Checking IP/Port for \$signame [" . $j . "]: " . $signame[$j] . "\n"; # check for IP/Port address $hasipport = checkIPPortAddress($signame[$j]); if($hasipport eq 1) { # separate IP and Port # get IP Port string length my $IPPortlength = length $signame[$j]; # check to see if there is an open parenthesis $foundopen = index $signame[$j],$isaopenparen; # check to see if there is an close parenthesis $foundclose = index $signame[$j],$isacloseparen; # check to see if there is a colon $foundcolon = index $signame[$j],$isacolon; # print "Open: " . $foundopen . " Close: " . $foundclose . " Colon: " . $foundcolon . " Length: " . $IPPortlength . "\n"; # check for (IP address) if( ($foundopen eq 0) && ($foundclose eq ($IPPortlength-1)) ) { # not in IP/port format $result = 0; return $result; } if( ($foundopen ne -1) && ($foundclose ne -1) ) { # we have a valid IP/port in IP(Port) format # separate IP and port number $port = substr($signame[$j],$foundopen+1); # get rid of last character, if its a , we must chop again

100
my $res = chop $port; if($res eq $isacomma) { chop $port; } $ip = substr($signame[$j], 0, $foundopen); } else { if( $foundcolon ne -1) { # we have a valid IP/port in IP:port format # separate IP and port number $port = substr($signame[$j],$foundcolon+1); $ip = substr($signame[$j], 0, $foundcolon); } else { # no a valid IP/port print "Error: Cannot find IP/Port: " . $signame[$j] ."\n"; } } # print "IP: " . $ip . " Port: " . $port . "\n"; # found ip/port address push(@IPs,"$ip"); push(@IPNums,ip2long($ip)); push(@Port,$port); $ipsfound = $ipsfound+1; } else { #print "Checking IP for \$signame [" . $j . "]: " . $signame[$j] . "\n"; # not a IP/Port, so check for plain IP $hasplainip = checkIPAddress($signame[$j]); if($hasplainip eq 1) { # found ip address push(@IPs,$signame[$j]); push(@IPNums,ip2long($signame[$j])); # push a null instead of 0 push(@Port,""); $ipsfound = $ipsfound+1; } else

101
{ if($hasplainip eq 2) { # yes, but surround by parenthesis so remove leading and trailing parenthesis # strip out leading ( from IP address $signame[$j] = substr($signame[$j],1); # strip out trailing ) chop $signame[$j]; push(@IPs,$signame[$j]); push(@IPNums,ip2long($signame[$j])); # push a null instead of 0 push(@Port,""); $ipsfound = $ipsfound+1; } else { if($hasplainip eq 3) { # yes, but ends in a comma so remove it # strip out trailing , chop $signame[$j]; push(@IPs,$signame[$j]); push(@IPNums,ip2long($signame[$j])); # push a null instead of 0 push(@Port,""); $ipsfound = $ipsfound+1; } else { # not an IP or IP/Port } } } } } } } else { # start looking at $signame[11] if TZ is there, otherwise at $signame[10] if($missingtimezone eq 0) { $startlookingat = 11; } else {

102
$startlookingat = 10; } # for($j=11; $j<$i; $j++) for($j=$startlookingat; $j<$i; $j++) { # print "Inside for loop STARTLOOKING:" . $startlookingat . " J:" . $j . " I:" . $i . "\n"; # print "Checking \$signame [" . $j . "]: " . $signame[$j] . "\n"; # check for three dots $hasthreedots = checkthreedots($signame[$j]); if($hasthreedots eq 1) { # print "Checking IP/Port for \$signame [" . $j . "]: " . $signame[$j] . "\n"; # check for IP/Port address $hasipport = checkIPPortAddress($signame[$j]); # print "Before test hasipport: " . $hasipport . "\n"; if($hasipport eq 1) { # get IP Port string length my $IPPortlength = length $signame[$j]; # check to see if there is an open parenthesis $foundopen = index $signame[$j],$isaopenparen; # check to see if there is an close parenthesis $foundclose = index $signame[$j],$isacloseparen; # check to see if there is a colon $foundcolon = index $signame[$j],$isacolon; # print "Open: " . $foundopen . " Close: " . $foundclose . " Colon: " . $foundcolon . " Length: " . $IPPortlength . "\n"; # check for (IP address) if( ($foundopen eq 0) && ($foundclose eq ($IPPortlength-1)) ) { # not in IP/port format $result = 0; return $result; } if( ($foundopen ne -1) && ($foundclose ne -1) ) { # we have a valid IP/port in IP(Port) format

103
# separate IP and port number $port = substr($signame[$j],$foundopen+1); # get rid of last character, if its a , we must chop again my $res = chop $port; if($res eq $isacomma) { chop $port; } $ip = substr($signame[$j], 0, $foundopen); } else { if( $foundcolon ne -1) { # we have a valid IP/port in IP:port format # separate IP and port number $port = substr($signame[$j],$foundcolon+1); $ip = substr($signame[$j], 0, $foundcolon); } else { # no a valid IP/port print "Error: Cannot find IP/Port: " . $signame[$j] ."\n"; } } # print "Found IPPort IP: " . $ip . " Port: " . $port . "\n"; # found ip/port address push(@IPs,"$ip"); push(@IPNums,ip2long($ip)); push(@Port,$port); $ipsfound = $ipsfound+1; } else { # print "Checking Plain IP for \$signame [" . $j . "]: " . $signame[$j] . "\n"; # not a IP/Port, so check for plain IP $hasplainip = checkIPAddress($signame[$j]); # print "J: " . $j . " signame[" . $j . "]: " . $signame[$j] . "hasPlainIP: " . $hasplainip . "\n"; if($hasplainip eq 1) { # found ip address push(@IPs,$signame[$j]); push(@IPNums,ip2long($signame[$j]));

104
# push a null instead of 0 push(@Port,""); $ipsfound = $ipsfound+1; } else { if($hasplainip eq 2) { # yes, but surround by parenthesis so remove leading and trailing parenthesis # strip out leading ( from IP address $signame[$j] = substr($signame[$j],1); # strip out trailing ) chop $signame[$j]; push(@IPs,$signame[$j]); push(@IPNums,ip2long($signame[$j])); # push a null instead of 0 push(@Port,""); $ipsfound = $ipsfound+1; } else { if($hasplainip eq 3) { # yes, but ends in a comma so remove it # strip out trailing , chop $signame[$j]; push(@IPs,$signame[$j]); push(@IPNums,ip2long($signame[$j])); # push a null instead of 0 push(@Port,""); $ipsfound = $ipsfound+1; } else { # not an IP or IP/Port } } } } } else { # not a candidate IP } } }

105
# print "I found " . $ipsfound . " IP addresses\n"; # for($j=0; $j<$ipsfound; $j++) # { # print "Element [" . $j . "] IP String: " . $IPs[$j] . " IP Num: " . $IPNums[$j] . " Port: " . $Port[$j] . "\n"; # } # print "Linetype: " . $linetype . "\n"; # this chunk of code is used to create the outline based upon the identified line type if($linetype eq 1) { # linetype 1 - missing IP address, so it is a status message # example: Jan 4 00:35:53 .. # build the output string # base , $formatted = $basename . ","; # log server day-month-year HH:MM:SS $formatted = $formatted . $signame[2] . "-" . $signame[1] . "-" . $logyear . " " . $signame[3] . ","; # NULL IP in dotted decimal, NULL IP unsigned long, $formatted = $formatted . ",,"; # NULL router message, NULL router message 2 $formatted = $formatted . ",,"; # NULL date/time, NULL Fraction $formatted = $formatted . ",,"; # NULL Time Zone $formatted = $formatted . ","; # Message Type $formatted = $formatted . "Status,"; # NULL Source IP in dotted decimal, NULL Source IP in long $formatted = $formatted . ",,"; # NULL Source port $formatted = $formatted . ","; # NULL Destination IP in dotted decimal, NULL Destination IP in long $formatted = $formatted . ",,"; # NULL Destination port $formatted = $formatted . ","; # rest of message seperated by commas until we figure out all message formats for($j=4; $j<$i; $j++) { $formatted = $formatted . "," . $signame[$j]; }

106
$formatted = $formatted . "\n"; } else { if($linetype eq 2) { # linetype 2 - bad second message number # example: Jan 4 00:35:53 131.47.103.1 35299: 1y8w: %SEC-6-IPACCESSLOGS: list 25 denied 131.47.102.47 3 packets # build the output string # base , $formatted = $basename . ","; # log server day-month-year HH:MM:SS $formatted = $formatted . $signame[2] . "-" . $signame[1] . "-" . $logyear . " " . $signame[3] . ","; # NULL IP in dotted decimal, NULL IP unsigned long, $formatted = $formatted . $signame[4] . "," . $logIPnum . ","; # NULL router message, NULL router message 2 $formatted = $formatted . $signame[5] . ",,"; # NULL date/time, NULL Fraction $formatted = $formatted . ",,"; # NULL Time Zone $formatted = $formatted . ","; # Message Type # strip out any % $haspercent = rindex $signame[7],$isapercent; if($haspercent eq -1) { # no percent sign } else { # get rid of leading % sign $signame[7] = substr($signame[7],1); } # strip out trailing colon #$signame[7] = substr($signame[7],0,-1); chop $signame[7]; $formatted = $formatted . $signame[7] . ","; if($ipsfound > 0) { # Source IP in dotted decimal, Source IP in long $formatted = $formatted . $IPs[0] . "," . $IPNums[0] . ","; # Source port $formatted = $formatted . $Port[0] . ",";

107
} else { # NULL Source IP in dotted decimal, NULL Source IP in long $formatted = $formatted . ",,"; # NULL Source port $formatted = $formatted . ","; } if($ipsfound > 1) { # Dest IP in dotted decimal, Dest IP in long $formatted = $formatted . $IPs[1] . "," . $IPNums[1] . ","; # Dest port $formatted = $formatted . $Port[1] . ","; } else { # NULL Dest IP in dotted decimal, NULL Dest IP in long $formatted = $formatted . ",,"; # NULL Dest port $formatted = $formatted . ","; } # rest of message seperated by commas until we figure out all message formats for($j=4; $j<$i; $j++) { $formatted = $formatted . "," . $signame[$j]; } $formatted = $formatted . "\n"; } else { if($linetype eq 3) { # linetype 3 - two message numbers # example: Dec 30 12:00:02 131.47.120.11 966247: 966244: Dec 30 12:00:01.894 GMT: %SEC-6-IPACCESSLOGS: list 13 permitted 131.15.50.254 1 packet # build the output string # base , $formatted = $basename . ","; # log server day-month-year HH:MM:SS $formatted = $formatted . $signame[2] . "-" . $signame[1] . "-" . $logyear . " " . $signame[3] . ","; # IP in dotted decimal, IP unsigned long, $formatted = $formatted . $signame[4] . "," . $logIPnum . ","; # router message, NULL router message 2 $formatted = $formatted . $signame[5] . "," . $signame[6] . ",";

108
# reporting router day-month-year HH:MM:SS,millisecond $formatted = $formatted . $signame[8] . "-" . $signame[7] . "-" . $logyear . " " . $routertime . "," . $routerfraction . ","; # Time Zone if($routertimehastrailingcolon eq 1) { # print null time zone and adjust all subsequent indexes by -1 $formatted = $formatted . ","; } else { # print time zone $formatted = $formatted . $signame[10] . ","; } if($routertimehastrailingcolon eq 1) { # adjust index by -1 # Message Type # strip out any % # ALREADY STRIPPED #$haspercent = rindex $signame[11],$isapercent; #if($haspercent eq -1) #{ # # no percent sign #} #else #{ # # get rid of leading % sign # $signame[11] = substr($signame[11],1); #} # strip out trailing colon #$signame[11] = substr($signame[11],0,-1); $formatted = $formatted . $signame[11] . ","; if($ipsfound > 0) { # Source IP in dotted decimal, Source IP in long $formatted = $formatted . $IPs[0] . "," . $IPNums[0] . ","; # Source port $formatted = $formatted . $Port[0] . ","; } else { # NULL Source IP in dotted decimal, NULL Source IP in long $formatted = $formatted . ",,";
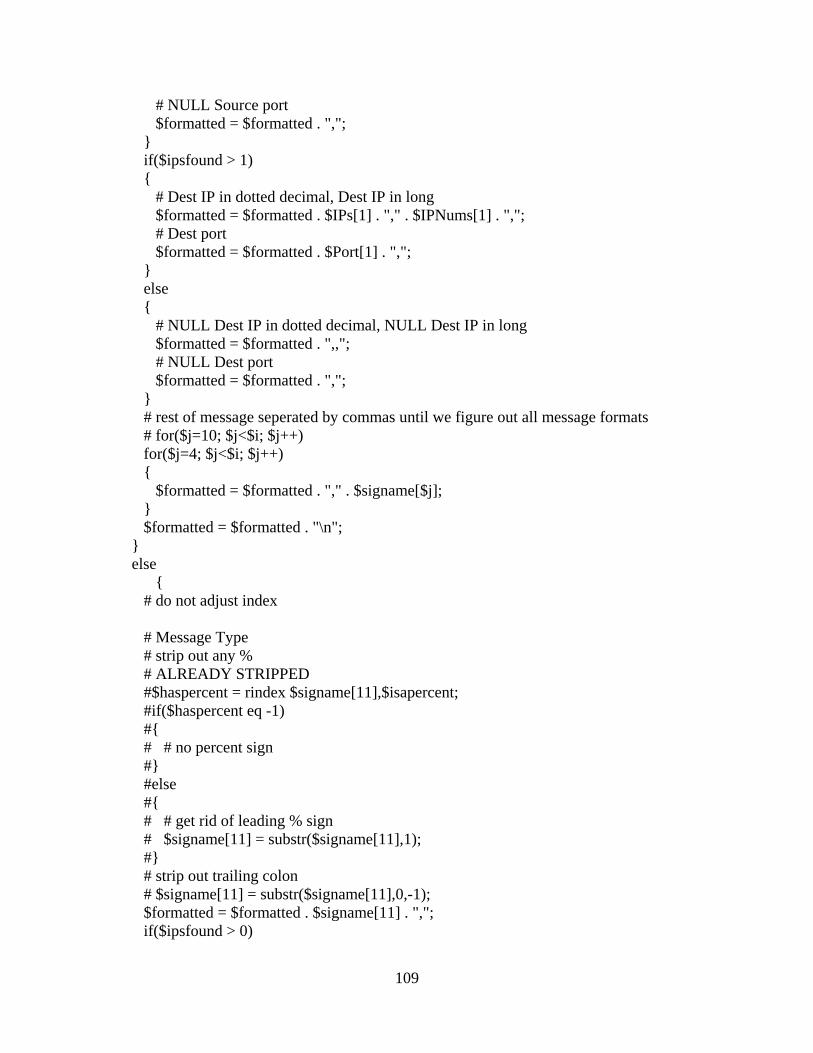
109
# NULL Source port $formatted = $formatted . ","; } if($ipsfound > 1) { # Dest IP in dotted decimal, Dest IP in long $formatted = $formatted . $IPs[1] . "," . $IPNums[1] . ","; # Dest port $formatted = $formatted . $Port[1] . ","; } else { # NULL Dest IP in dotted decimal, NULL Dest IP in long $formatted = $formatted . ",,"; # NULL Dest port $formatted = $formatted . ","; } # rest of message seperated by commas until we figure out all message formats # for($j=10; $j<$i; $j++) for($j=4; $j<$i; $j++) { $formatted = $formatted . "," . $signame[$j]; } $formatted = $formatted . "\n"; } else { # do not adjust index # Message Type # strip out any % # ALREADY STRIPPED #$haspercent = rindex $signame[11],$isapercent; #if($haspercent eq -1) #{ # # no percent sign #} #else #{ # # get rid of leading % sign # $signame[11] = substr($signame[11],1); #} # strip out trailing colon # $signame[11] = substr($signame[11],0,-1); $formatted = $formatted . $signame[11] . ","; if($ipsfound > 0)

110
{ # Source IP in dotted decimal, Source IP in long $formatted = $formatted . $IPs[0] . "," . $IPNums[0] . ","; # Source port $formatted = $formatted . $Port[0] . ","; } else { # NULL Source IP in dotted decimal, NULL Source IP in long $formatted = $formatted . ",,"; # NULL Source port $formatted = $formatted . ","; } if($ipsfound > 1) { # Dest IP in dotted decimal, Dest IP in long $formatted = $formatted . $IPs[1] . "," . $IPNums[1] . ","; # Dest port $formatted = $formatted . $Port[1] . ","; } else { # NULL Dest IP in dotted decimal, NULL Dest IP in long $formatted = $formatted . ",,"; # NULL Dest port $formatted = $formatted . ","; } # rest of message seperated by commas until we figure out all message formats # for($j=12; $j<$i; $j++) for($j=4; $j<$i; $j++) { $formatted = $formatted . "," . $signame[$j]; } $formatted = $formatted . "\n"; } } else { if($linetype eq 4) { # linetype 4 # example: Jan 21 12:27:25 132.47.136.249 19: Cisco IOS Software, C3750 Software (C3750-IPBASEK9-M), Version 12.2(50)SE3, RELEASE SOFTWARE (fc1) # build the output string # base , $formatted = $basename . ",";

111
# log server day-month-year HH:MM:SS $formatted = $formatted . $signame[2] . "-" . $signame[1] . "-" . $logyear . " " . $signame[3] . ","; # IP in dotted decimal, IP unsigned long, $formatted = $formatted . $signame[4] . "," . $logIPnum . ","; # router message num, NULL router message 2 $formatted = $formatted . $signame[5] . ",,"; # NULL date/time, NULL Fraction $formatted = $formatted . ",,"; # NULL Time Zone $formatted = $formatted . ","; # Message Type $formatted = $formatted . "Status,"; if($ipsfound > 0) { # Source IP in dotted decimal, Source IP in long $formatted = $formatted . $IPs[0] . "," . $IPNums[0] . ","; # Source port $formatted = $formatted . $Port[0] . ","; } else { # NULL Source IP in dotted decimal, NULL Source IP in long $formatted = $formatted . ",,"; # NULL Source port $formatted = $formatted . ","; } if($ipsfound > 1) { # Dest IP in dotted decimal, Dest IP in long $formatted = $formatted . $IPs[1] . "," . $IPNums[1] . ","; # Dest port $formatted = $formatted . $Port[1] . ","; } else { # NULL Dest IP in dotted decimal, NULL Dest IP in long $formatted = $formatted . ",,"; # NULL Dest port $formatted = $formatted . ","; } # NULL Source IP in dotted decimal, NULL Source IP in long # $formatted = $formatted . ",,"; # NULL Source port

112
# $formatted = $formatted . ","; # NULL Destination IP in dotted decimal, NULL Destination IP in long # $formatted = $formatted . ",,"; # NULL Destination port # $formatted = $formatted . ","; # rest of message seperated by commas until we figure out all message formats for($j=4; $j<$i; $j++) { $formatted = $formatted . "," . $signame[$j]; } $formatted = $formatted . "\n"; } else { if($linetype eq 5) { # linetype 5 # build the output string # base , $formatted = $basename . ","; # log server day-month-year HH:MM:SS $formatted = $formatted . $signame[2] . "-" . $signame[1] . "-" . $logyear . " " . $signame[3] . ","; # IP in dotted decimal, IP unsigned long, $formatted = $formatted . $signame[4] . "," . $logIPnum . ","; # NULL router message num, NULL router message 2 $formatted = $formatted . ",,"; # NULL date/time, NULL Fraction $formatted = $formatted . ",,"; # NULL Time Zone $formatted = $formatted . ","; # Message Type $formatted = $formatted . "Status,"; if($ipsfound > 0) { # Source IP in dotted decimal, Source IP in long $formatted = $formatted . $IPs[0] . "," . $IPNums[0] . ","; # Source port $formatted = $formatted . $Port[0] . ","; } else { # NULL Source IP in dotted decimal, NULL Source IP in long $formatted = $formatted . ",,";

113
# NULL Source port $formatted = $formatted . ","; } if($ipsfound > 1) { # Dest IP in dotted decimal, Dest IP in long $formatted = $formatted . $IPs[1] . "," . $IPNums[1] . ","; # Dest port $formatted = $formatted . $Port[1] . ","; } else { # NULL Dest IP in dotted decimal, NULL Dest IP in long $formatted = $formatted . ",,"; # NULL Dest port $formatted = $formatted . ","; } # NULL Source IP in dotted decimal, NULL Source IP in long # $formatted = $formatted . ",,"; # NULL Source port # $formatted = $formatted . ","; # NULL Destination IP in dotted decimal, NULL Destination IP in long # $formatted = $formatted . ",,"; # NULL Destination port # $formatted = $formatted . ","; # rest of message seperated by commas until we figure out all message formats # for($j=5; $j<$i; $j++) for($j=4; $j<$i; $j++) { $formatted = $formatted . "," . $signame[$j]; } $formatted = $formatted . "\n"; } else { # default $linetype = 0 # example: Dec 30 12:00:30 131.47.102.1 34106: Dec 30 12:00:29 GMT: %SEC-6-IPACCESSLOGS: list 13 permitted 131.15.50.254 14 packets # build the output string # base , $formatted = $basename . ","; # log server day-month-year HH:MM:SS

114
$formatted = $formatted . $signame[2] . "-" . $signame[1] . "-" . $logyear . " " . $signame[3] . ","; # IP in dotted decimal, IP unsigned long, $formatted = $formatted . $signame[4] . "," . $logIPnum . ","; # router message, NULL router message 2 $formatted = $formatted . $signame[5] . ",,"; # reporting router day-month-year HH:MM:SS,millisecond $formatted = $formatted . $signame[7] . "-" . $signame[6] . "-" . $logyear . " " . $routertime . "," . $routerfraction . ","; # Time Zone if($routertimehastrailingcolon eq 1) { # print null time zone and adjust all subsequent indexes by -1 $formatted = $formatted . ","; } else { # print time zone $formatted = $formatted . $signame[9] . ","; } if($routertimehastrailingcolon eq 1) { # adjust index by -1 # Message Type # strip out any % # ALREADY STRIPPED #$haspercent = rindex $signame[10],$isapercent; #if($haspercent eq -1) #{ # # no percent sign #} #else #{ # # get rid of leading % sign # $signame[10] = substr($signame[10],1); #} # strip out trailing colon #$signame[10] = substr($signame[10],0,-1); $formatted = $formatted . $signame[10] . ","; if($ipsfound > 0) { # Source IP in dotted decimal, Source IP in long $formatted = $formatted . $IPs[0] . "," . $IPNums[0] . ",";

115
# Source port $formatted = $formatted . $Port[0] . ","; } else { # NULL Source IP in dotted decimal, NULL Source IP in long $formatted = $formatted . ",,"; # NULL Source port $formatted = $formatted . ","; } if($ipsfound > 1) { # Dest IP in dotted decimal, Dest IP in long $formatted = $formatted . $IPs[1] . "," . $IPNums[1] . ","; # Dest port $formatted = $formatted . $Port[1] . ","; } else { # NULL Dest IP in dotted decimal, NULL Dest IP in long $formatted = $formatted . ",,"; # NULL Dest port $formatted = $formatted . ","; } # rest of message seperated by commas until we figure out all message formats for($j=10; $j<$i; $j++) { $formatted = $formatted . "," . $signame[$j]; } $formatted = $formatted . "\n"; } else { # do not adjust index # Message Type # strip out any % # ALREADY STRIPPED #$haspercent = rindex $signame[10],$isapercent; #if($haspercent eq -1) #{ # # no percent sign #} #else #{ # # get rid of leading % sign

116
# $signame[10] = substr($signame[10],1); #} # strip out trailing colon #$signame[10] = substr($signame[10],0,-1); $formatted = $formatted . $signame[10] . ","; if($ipsfound > 0) { # Source IP in dotted decimal, Source IP in long $formatted = $formatted . $IPs[0] . "," . $IPNums[0] . ","; # Source port $formatted = $formatted . $Port[0] . ","; } else { # NULL Source IP in dotted decimal, NULL Source IP in long $formatted = $formatted . ",,"; # NULL Source port $formatted = $formatted . ","; } if($ipsfound > 1) { # Dest IP in dotted decimal, Dest IP in long $formatted = $formatted . $IPs[1] . "," . $IPNums[1] . ","; # Dest port $formatted = $formatted . $Port[1] . ","; } else { # NULL Dest IP in dotted decimal, NULL Dest IP in long $formatted = $formatted . ",,"; # NULL Dest port $formatted = $formatted . ","; } # rest of message seperated by commas until we figure out all message formats for($j=11; $j<$i; $j++) { $formatted = $formatted . "," . $signame[$j]; } $formatted = $formatted . "\n"; } } } } } } print OUTFILE $formatted

117
} # example conversion from dotted decimal # dotted decimal 132.35.194.5 # binary 10000100001000111100001000000101 # decimal 2216935941 # hexidecimal 8423C205 printf ("Processed: " . $count . " lines. Maximum Elements: " . $maxelements . ".\n"); close (OUTFILE); close(INLOG); exit(0);

118
APPENDIX D
CreateLogMessage.SQL
Description This file creates the Oracle database tables named LogMessage and IPToCountry. spool CreateNewLogMessage.log REM Set environmental variables SET ECHO ON SET HEADING ON SET NEWPAGE NONE SET LINESIZE 300 SET FEEDBACK ON SET COLSEP '|' SET TIMING ON REM Nuke tables if they exist DROP SEQUENCE Log_seq; DROP TRIGGER Log_trigger; ALTER TABLE LOGMESSAGE DROP CONSTRAINT log_message_nn; ALTER TABLE NEWLOGMESSAGE DROP CONSTRAINT log_message_nn; DROP TABLE LOGMESSAGE CASCADE CONSTRAINTS; DROP TABLE IPTOCOUNTRY CASCADE CONSTRAINTS; REM Create LOGMESSAGE table CREATE TABLE LOGMESSAGE ( LogID INTEGER NOT NULL, BaseName VARCHAR2(20), LogDateTime TIMESTAMP, ReportIP VARCHAR2(20), ReportIPNum INTEGER, RouterNum INTEGER, RouterNum2 INTEGER, RouterDateTime TIMESTAMP, RouterMsecs INTEGER, TimeZone VARCHAR2(6), MessageType VARCHAR2(35), SourceIP VARCHAR2(20), SourceIPNum INTEGER, SourcePort INTEGER, DestinationIP VARCHAR2(20), DestinationIPNum INTEGER, DestinationPort INTEGER,

119
Token1 VARCHAR2(80), Token2 VARCHAR2(80), Token3 VARCHAR2(80), Token4 VARCHAR2(80), Token5 VARCHAR2(80), Token6 VARCHAR2(80), Token7 VARCHAR2(80), Token8 VARCHAR2(80), Token9 VARCHAR2(80), Token10 VARCHAR2(80), Token11 VARCHAR2(80), Token12 VARCHAR2(80), Token13 VARCHAR2(80), Token14 VARCHAR2(80), Token15 VARCHAR2(80), Token16 VARCHAR2(80), Token17 VARCHAR2(80), Token18 VARCHAR2(80), Token19 VARCHAR2(80), Token20 VARCHAR2(80), Token21 VARCHAR2(80), Token22 VARCHAR2(80), Token23 VARCHAR2(80), Token24 VARCHAR2(80), Token25 VARCHAR2(80), Token26 VARCHAR2(80), Token27 VARCHAR2(80), Token28 VARCHAR2(80), Token29 VARCHAR2(80), Token30 VARCHAR2(80), CONSTRAINT log_message_nn PRIMARY KEY (LogID)); REM Create the sequence CREATE SEQUENCE Log_seq start with 1 increment by 1 nomaxvalue; REM Create the trigger CREATE OR REPLACE TRIGGER Log_trigger BEFORE INSERT ON LOGMESSAGE FOR EACH ROW WHEN (new.LogID IS NULL) BEGIN SELECT Log_seq.NEXTVAL INTO :new.LogID

120
FROM dual; END; / REM Create IPTOCOUNTRY Table CREATE TABLE IPTOCOUNTRY ( ip_from NUMBER(32,0) , ip_to NUMBER(32,0) , country_code2 VARCHAR2(2) , country_code3 VARCHAR2(3) , country_name VARCHAR2(50) ) ; spool off; exit;

121
APPENDIX E
LogMessage Table Structure
LogMessage
.!.2g!Q
Base Name LogDateTime ReportiP ReportiPNum RouterNum RouterNum2 RouterDateTime RouterMsecs TimeZone Message Type SourceiP SourceiPNum SourcePort DestinationiP DestinationiPNum Destination Port Tokenl Token2 Token3 Token4 TokenS Token6 Token7 TokenS Token9 TokenlO Tokenll Token12 Token13 Token14 TokenlS Token16 Token17 Token18 Token19 Token20 Token21 Token22 Token23 Token24 Token25 Token26 Token27 Token28 Token29 Token30

122
APPENDIX F
IPToCountry Table Structure

123
APPENDIX G
Doit.BAT Description This file invokes the PERL parser for the log files from a particular USAF base, and invokes the CTL file that loads the resultant CSV file into the LogMessage table.
REM Edit “pathname\basename\parselog.pl” basename del *.csv for %%A in (cisco*.log) do perl "D:\INOSCWest561st\basename\parselog.pl" %%A basename 2011 copy *.csv all-basename.log.csv sqlldr user1/pass1 loadbasename.ctl type loadbasename.log

124
APPENDIX H
Redoit.BAT Description This file is the overall control batch file. It invokes CreateLogMessage.SQL, LoadIPCountry.CTL and Doit.BAT. This file displays the start time and end time. It also logs-in to Oracle using sqlplus with username and password and calls the CreateLogMessage.SQL file. Then the LoadIPCountry.CTL is invoked using sqlldr with the same username and password. A loadipcountry.log is generated. After all the doit batch files for each base are executed the finished time is displayed and a redoit.log file is generated. When executing redoit.bat, there maybe messages stating “Commit point reached - logical record count...”, this is normal and not to be concerned about. This batch process can take up to several hours depending on the system. Below is the actual batch file: echo Starting at %time% sqlplus username/password @CREATELOGMESSAGE sqlldr username/password loadipcountry.ctl type loadipcountry.log REM Change directory to pathname\Basename cd C:\INOSCWest561st\Altus call doit cd C:\INOSCWest561st\Andersen call doit cd C:\INOSCWest561st\CapeCod call doit cd C:\INOSCWest561st\Cavalier call doit cd C:\INOSCWest561st\Charleston call doit cd C:\INOSCWest561st\Clear call doit cd C:\INOSCWest561st\Columbus call doit cd C:\INOSCWest561st\DiegoGarcia call doit cd C:\INOSCWest561st\Dover call doit cd C:\INOSCWest561st\Elmendorf call doit cd C:\INOSCWest561st\Fairchild call doit cd C:\INOSCWest561st\FEWarren

125
call doit cd C:\INOSCWest561st\Guam call doit cd C:\INOSCWest561st\Hickam call doit cd C:\INOSCWest561st\Kadena call doit cd C:\INOSCWest561st\KaenaPoint call doit cd C:\INOSCWest561st\Keesler call doit cd C:\INOSCWest561st\Kunsan call doit cd C:\INOSCWest561st\Lackland call doit cd C:\INOSCWest561st\Laughlin call doit cd C:\INOSCWest561st\LosAngeles call doit cd C:\INOSCWest561st\Luke call doit cd C:\INOSCWest561st\MacDill call doit cd C:\INOSCWest561st\Malmstrom call doit cd C:\INOSCWest561st\McChord call doit cd C:\INOSCWest561st\McConnell call doit cd C:\INOSCWest561st\McGuire call doit cd C:\INOSCWest561st\NewBoston call doit cd C:\INOSCWest561st\Oakhanger call doit cd C:\INOSCWest561st\Onizuka call doit cd C:\INOSCWest561st\Osan call doit cd C:\INOSCWest561st\Patrick call doit cd C:\INOSCWest561st\Pope call doit cd C:\INOSCWest561st\Randolph call doit cd C:\INOSCWest561st\Randolph-NOSC

126
call doit cd C:\INOSCWest561st\Scott-NOSC call doit cd C:\INOSCWest561st\Sheppard call doit cd C:\INOSCWest561st\Thule call doit cd C:\INOSCWest561st\Travis call doit cd C:\INOSCWest561st\Tyndall call doit cd C:\INOSCWest561st\USAFA call doit cd C:\INOSCWest561st\Vandenberg call doit cd C:\INOSCWest561st\Yokota call doit echo Finished at %time% type redoit.log

127
APPENDIX I
LoadIPCountry.CTL Description Loads the IP ranges of each country into the “IPToCountry” table. REM cd to pathname\ip-to-country.csv' load data infile 'D:Country IPs\ip-to-country.csv' into table IPTOCOUNTRY fields terminated by "," optionally enclosed by '"' TRAILING NULLCOLS (IP_FROM, IP_TO, COUNTRY_CODE2, COUNTRY_CODE3, COUNTRY_NAME)

128
APPENDIX J
LoadBasename.CTL
Description Loads the tokens in the CSV file into the “LogMessage” table. Each base has its own load<basename>.CTL file, specific to the path name for each base. REM Edit “pathname\all-basenamelog.csv” load data infile 'D:\INOSCWest561st\ basename \all-basename.log.csv' into table LOGMESSAGE append fields terminated by "," optionally enclosed by '"' TRAILING NULLCOLS
(BaseName, LogDateTime DATE 'DD-MON-YYYY HH24.MI.SS', ReportIP, ReportIPNum, RouterNum, RouterNum2, RouterDateTime DATE 'DD-MON-YYYY HH24.MI.SS', RouterMsecs, TimeZone, MessageType, SourceIP, SOurceIPNum, SourcePort, DestinationIP, DestinationIPNum, DestinationPort, Token1, Token2,Token3, Token4, Token5, Token6, Token7, Token8, Token9, Token10, Token11, Token12, Token13, Token14, Token15, Token16, Token17, Token18, Token19, Token20, Token21, Token22, Token23, Token24, Token25, Token26, Token27, Token28, Token29, Token30)
129
APPENDIX K
BuildSummaryTables.SQL Description This script builds the normalized tables. spool BuildSummaryTables.log SET ECHO ON SET HEADING ON SET NEWPAGE NONE SET LINESIZE 300 SET FEEDBACK ON SET COLSEP '|' SET TIMING ON REM Nuke tables in case they exist DROP TABLE TTIMEZONE CASCADE CONSTRAINTS; DROP TABLE TBASENAME CASCADE CONSTRAINTS; DROP TABLE TREPORTIP CASCADE CONSTRAINTS; DROP TABLE TMESSAGE_TYPE CASCADE CONSTRAINTS; DROP TABLE TSOURCE_IP CASCADE CONSTRAINTS; DROP TABLE TDESTINATION_IP CASCADE CONSTRAINTS; DROP TABLE TSOURCEPORTS CASCADE CONSTRAINTS; DROP TABLE TDESTPORTS CASCADE CONSTRAINTS; REM Create TTIMEZONE table CREATE TABLE TTIMEZONE ( TZ_ID INTEGER NOT NULL PRIMARY KEY, TZ VARCHAR(6)); REM Create TBASENAME table CREATE TABLE TBASENAME ( Base_ID INTEGER NOT NULL PRIMARY KEY, BaseName VARCHAR(30)); REM Create TREPORTIP table CREATE TABLE TREPORTIP ( REPORTIP_ID INTEGER NOT NULL PRIMARY KEY, ReportIP VARCHAR2(20), ReportIPNum INTEGER); REM Create TMESSAGE_TYPE table CREATE TABLE TMESSAGE_TYPE (

130
MsgType_ID INTEGER NOT NULL PRIMARY KEY, MsgType VARCHAR2(35)); REM Create TSOURCE_IP table CREATE TABLE TSOURCE_IP ( SourceIP_ID INTEGER NOT NULL PRIMARY KEY, SourceIP VARCHAR2(20), SourceIPNum INTEGER); REM Create TSOURCEPORTS table CREATE TABLE TSOURCEPORTS ( SourcePort_ID INTEGER NOT NULL PRIMARY KEY, PortNum INTEGER, PortDesc VARCHAR(30)); REM Create TDESTINATION_IP table CREATE TABLE TDESTINATION_IP ( DestIP_ID INTEGER NOT NULL PRIMARY KEY, DestIP VARCHAR2(20), DestIPNum INTEGER); REM Create TDESTPORTS table CREATE TABLE TDESTPORTS ( DestPort_ID INTEGER NOT NULL PRIMARY KEY, PortNum INTEGER, PortDesc VARCHAR(30)); spool off;

131
APPENDIX L
PopTZ.sql Description This populates TTIMEZONE table spool PopTTZ.log REM Populate TTIMEZONE table SET ECHO ON SET HEADING ON SET NEWPAGE NONE SET LINESIZE 500 SET FEEDBACK ON SET COLSEP '|' SET TIMING ON REM Remove tables and views if exist DROP VIEW VTTIMEZONE CASCADE CONSTRAINTS; DROP SEQUENCE TIMEZONE_seq; DROP TRIGGER TIMEZONE_trigger; REM Now we want to populate the TTIMEZONE table REM First create a VIEW of daily logs to get a list of distinct TIMEZONE from LOGMESSAGE table CREATE VIEW VTTIMEZONE AS SELECT DISTINCT TIMEZONE FROM LOGMESSAGE WHERE TIMEZONE IS NOT NULL; REM Since Oracle does not have an autonumber function, REM we have to create it using a sequence and a trigger REM Create the sequence CREATE SEQUENCE TIMEZONE_seq start with 1 increment by 1 nomaxvalue; REM Create the trigger CREATE OR REPLACE TRIGGER TIMEZONE_trigger BEFORE INSERT ON TTIMEZONE

132
FOR EACH ROW WHEN (new.TZ_ID IS NULL) BEGIN SELECT TIMEZONE_seq.NEXTVAL INTO :new.TZ_ID FROM dual; END; / REM Now, lets populate the TTIMEZONE table using the VTTIMEZONE view INSERT INTO TTIMEZONE (TZ) SELECT TIMEZONE FROM VTTIMEZONE; SELECT * FROM TTIMEZONE; SELECT COUNT(*) FROM TTIMEZONE; spool off;

133
popTBasename.sql
Description This populates the TBASENAME table. spool popTBasename.log REM Populate TBASENAME table SET ECHO ON SET HEADING ON SET NEWPAGE NONE SET LINESIZE 500 SET FEEDBACK ON SET COLSEP '|' SET TIMING ON REM Remove tables and views if exist DROP VIEW VTBASENAME CASCADE CONSTRAINTS; DROP SEQUENCE Basename_seq; DROP TRIGGER Basename_trigger; REM Now we want to populate the TBASENAME table REM First create a VIEW to get a list of distinct BASENAME from LOGMESSAGE table CREATE VIEW VTBASENAME AS SELECT DISTINCT BaseName FROM LOGMESSAGE WHERE Basename IS NOT NULL; REM Since Oracle does not have an autonumber function, REM we have to create it using a sequence and a trigger REM Create the sequence CREATE SEQUENCE Basename_seq start with 1 increment by 1 nomaxvalue; REM Create the trigger CREATE OR REPLACE TRIGGER Basename_trigger BEFORE INSERT ON TBASENAME FOR EACH ROW WHEN (new.Base_ID IS NULL) BEGIN SELECT Basename_seq.NEXTVAL

134
INTO :new.Base_ID FROM dual; END; / REM Now, lets populate the TBASENAME table using the VTBASENAME view INSERT INTO TBASENAME (BaseName) SELECT Basename FROM VTBASENAME; SELECT * FROM TBASENAME; SELECT COUNT(*) FROM TBASENAME; spool off;

135
PopTMessage_Type.sql Description This populates the TMESSAGE_TYPE table spool PopTMessage_Type.log REM Populate TMESSAGE_TYPE table SET ECHO ON SET HEADING ON SET NEWPAGE NONE SET LINESIZE 500 SET FEEDBACK ON SET COLSEP '|' SET TIMING ON REM Remove tables and views if exist DROP VIEW VTMESSAGE_TYPE CASCADE CONSTRAINTS; DROP SEQUENCE MessageType_seq; DROP TRIGGER MessageType_trigger; REM Now we want to populate the TMESSAGE_TYPE table REM First create a VIEW of daily logs to get a list of distinct MessageType from LOGMESSAGE table CREATE VIEW VTMESSAGE_TYPE AS SELECT DISTINCT MessageType FROM LOGMESSAGE WHERE MessageType IS NOT NULL; REM Since Oracle does not have an autonumber function, REM we have to create it using a sequence and a trigger REM Create the sequence CREATE SEQUENCE MessageType_seq start with 1 increment by 1 nomaxvalue; REM Create the trigger CREATE OR REPLACE TRIGGER MessageType_trigger BEFORE INSERT ON TMESSAGE_TYPE FOR EACH ROW WHEN (new.MsgType_ID IS NULL)

136
BEGIN SELECT MessageType_seq.NEXTVAL INTO :new.MsgType_ID FROM dual; END; / REM Now, lets populate the TMESSAGE_TYPE table using the VTMESSAGE_TYPE view INSERT INTO TMESSAGE_TYPE (MsgType) SELECT MessageType FROM VTMESSAGE_TYPE; spool off;

137
PopTReportIP.sql
Description This populates the TReportIP table spool PopTReportIP.log REM Populate TREPORTIP table SET ECHO ON SET HEADING ON SET NEWPAGE NONE SET LINESIZE 500 SET FEEDBACK ON SET COLSEP '|' SET TIMING ON REM Remove tables and views if exist DROP VIEW VTREPORTIP CASCADE CONSTRAINTS; DROP SEQUENCE REPORTIP_seq; DROP TRIGGER REPORTIP_trigger; REM Now we want to populate the TREPORTIP table REM First create a VIEW of daily logs to get a list of distinct REPORTIP from LOGMESSAGE table CREATE VIEW VTREPORTIP AS SELECT DISTINCT REPORTIP, REPORTIPNUM FROM LOGMESSAGE WHERE REPORTIP IS NOT NULL; REM Since Oracle does not have an autonumber function, REM we have to create it using a sequence and a trigger REM Create the sequence CREATE SEQUENCE REPORTIP_seq start with 1 increment by 1 nomaxvalue; REM Create the trigger CREATE OR REPLACE TRIGGER REPORTIP_trigger BEFORE INSERT ON TREPORTIP FOR EACH ROW

138
WHEN (new.REPORTIP_ID IS NULL) BEGIN SELECT REPORTIP_seq.NEXTVAL INTO :new.REPORTIP_ID FROM dual; END; / REM Now, lets populate the TREPORTIP table using the VTREPORTIP view INSERT INTO TREPORTIP (REPORTIP, REPORTIPNUM) SELECT REPORTIP, REPORTIPNUM FROM VTREPORTIP;
spool off;

139
PopTSourceIP.sql Description This populates the TSOURCE_IP table spool PopTSourceIP.log REM Populate TSOURCE_IP table SET ECHO ON SET HEADING ON SET NEWPAGE NONE SET LINESIZE 500 SET FEEDBACK ON SET COLSEP '|' SET TIMING ON REM Remove tables and views if exist DROP VIEW VTSOURCE_IP CASCADE CONSTRAINTS; DROP SEQUENCE SOURCEIP_seq; DROP TRIGGER SOURCEIP_trigger; REM Now we want to populate the TSOURCE_IP table REM First create a VIEW of daily logs to get a list of distinct SOURCEIP from LOGMESSAGE table CREATE VIEW VTSOURCE_IP AS SELECT DISTINCT SOURCEIP, SOURCEIPNUM FROM LOGMESSAGE WHERE SOURCEIP IS NOT NULL; REM Since Oracle does not have an autonumber function, REM we have to create it using a sequence and a trigger REM Create the sequence CREATE SEQUENCE SOURCEIP_seq start with 1 increment by 1 nomaxvalue; REM Create the trigger CREATE OR REPLACE TRIGGER SOURCEIP_trigger BEFORE INSERT ON TSOURCE_IP FOR EACH ROW WHEN (new.SOURCEIP_ID IS NULL)

140
BEGIN SELECT SOURCEIP_seq.NEXTVAL INTO :new.SOURCEIP_ID FROM dual; END; / REM Now, lets populate the TSOURCE_IP table using the VTSOURCE_IP view with REM the SOURCEIPs not in the TSOURCE_IP table already INSERT INTO TSOURCE_IP (SOURCEIP, SOURCEIPNUM) SELECT SOURCEIP, SOURCEIPNUM FROM VTSOURCE_IP; spool off;

141
popTSourcePorts.log Description This populates the TSOURCEPORTS table spool popTSourcePorts.log REM Populate TSOURCEPORTS table SET ECHO ON SET HEADING ON SET NEWPAGE NONE SET LINESIZE 500 SET FEEDBACK ON SET COLSEP '|' SET TIMING ON REM Remove tables and views if exist DROP VIEW VTSOURCEPORTS CASCADE CONSTRAINTS; DROP SEQUENCE SOURCEPORT_seq; DROP TRIGGER SOURCEPORT_trigger; REM Now we want to populate the TSOURCEPORTS table REM First get a list of distinct SOURCEPORTS from LOGMESSAGE table CREATE VIEW VTSOURCEPORTS AS SELECT DISTINCT SourcePort FROM LOGMESSAGE WHERE SourcePort IS NOT NULL; REM Since Oracle does not have an autonumber function, REM we have to create it using a sequence and a trigger REM Create the sequence CREATE SEQUENCE SOURCEPORT_seq start with 1 increment by 1 nomaxvalue; REM Create the trigger CREATE OR REPLACE TRIGGER SOURCEPORT_trigger BEFORE INSERT ON TSOURCEPORTS FOR EACH ROW WHEN (new.SOURCEPORT_ID IS NULL) BEGIN SELECT SOURCEPORT_seq.NEXTVAL

142
INTO :new.SOURCEPORT_ID FROM dual; END; / REM Now, lets populate the TSOURCEPORTS table using the VTSOURCEPORTS view INSERT INTO TSOURCEPORTS (PortNum) SELECT SourcePort FROM VTSOURCEPORTS; spool off;

143
popTDestIP.sql Description This populates the TDESTINATION_IP table spool PopTDestIP.log REM Populate TDESTINATION_IP table SET ECHO ON SET HEADING ON SET NEWPAGE NONE SET LINESIZE 500 SET FEEDBACK ON SET COLSEP '|' SET TIMING ON REM Remove tables and views if exist DROP VIEW VTDESTINATION_IP CASCADE CONSTRAINTS; DROP SEQUENCE DestIP_seq; DROP TRIGGER DestIP_trigger; REM Now we want to populate the TDESTINATION_IP table REM First create a VIEW of daily logs to get a list of distinct DestIP from LOGMESSAGE table CREATE VIEW VTDESTINATION_IP AS SELECT DISTINCT DestinationIP, DestinationIPNUM FROM LOGMESSAGE WHERE DestinationIP IS NOT NULL; REM Since Oracle does not have an autonumber function, REM we have to create it using a sequence and a trigger REM Create the sequence CREATE SEQUENCE DestIP_seq start with 1 increment by 1 nomaxvalue; REM Create the trigger CREATE OR REPLACE TRIGGER DestIP_trigger BEFORE INSERT ON TDESTINATION_IP FOR EACH ROW WHEN (new.DestIP_ID IS NULL) BEGIN

144
SELECT DestIP_seq.NEXTVAL INTO :new.DestIP_ID FROM dual; END; / REM Now, lets populate the TDESTINATION_IP table using the VTDESTINATION_IP view INSERT INTO TDESTINATION_IP (DestIP, DestIPNUM) SELECT DestinationIP, DestinationIPNUM FROM VTDESTINATION_IP; spool off;

145
PopTDestPorts.log Description This populates the TDESTPORTS table spool PopTDestPorts.log REM Populate TDESTPORTS table SET ECHO ON SET HEADING ON SET NEWPAGE NONE SET LINESIZE 500 SET FEEDBACK ON SET COLSEP '|' SET TIMING ON REM Remove tables and views if exist DROP VIEW VTDESTPORTS CASCADE CONSTRAINTS; DROP SEQUENCE DESTPORT_seq; DROP TRIGGER DESTPORT_trigger; REM Now we want to populate the TDESTPORTS table REM First get a list of distinct DESTPORTS from LOGMESSAGE table CREATE VIEW VTDESTPORTS AS SELECT DISTINCT DestinationPort FROM LOGMESSAGE WHERE DestinationPort IS NOT NULL; REM Since Oracle does not have an autonumber function, REM we have to create it using a sequence and a trigger REM Create the sequence CREATE SEQUENCE DESTPORT_seq start with 1 increment by 1 nomaxvalue; REM Create the trigger CREATE OR REPLACE TRIGGER DESTPORT_trigger BEFORE INSERT ON TDESTPORTS FOR EACH ROW WHEN (new.DESTPORT_ID IS NULL) BEGIN

146
SELECT DESTPORT_seq.NEXTVAL INTO :new.DESTPORT_ID FROM dual; END; / REM Now, lets populate the TDESTPORTS table using the VTDESTPORTS view INSERT INTO TDESTPORTS (PortNum) SELECT DestinationPort FROM VTDESTPORTS; spool off;

147
APPENDIX M
Description This script builds the eight associative link tables. SPOOL BuildLinkTables.LOG SET ECHO ON SET HEADING ON SET NEWPAGE NONE SET LINESIZE 500 SET FEEDBACK ON SET COLSEP '|' SET TIMING ON REM Nuke tables in case they exist DROP TABLE TTIMEZONE_LINK CASCADE CONSTRAINTS; DROP TABLE TBASENAME_LINK CASCADE CONSTRAINTS; DROP TABLE TREPORTIP_LINK CASCADE CONSTRAINTS; DROP TABLE TMESSAGE_TYPE_LINK CASCADE CONSTRAINTS; DROP TABLE TSOURCE_IP_LINK CASCADE CONSTRAINTS; DROP TABLE TDESTINATION_IP_LINK CASCADE CONSTRAINTS; DROP TABLE TSOURCEPORT_LINK CASCADE CONSTRAINTS; DROP TABLE TDESTPORT_LINK CASCADE CONSTRAINTS; REM Create the Link Tables that will link the normalized tables to the big table REM Create TTIMEZONE_LINK table CREATE TABLE TTIMEZONE_LINK ( LogID INTEGER NOT NULL, TZ_ID INTEGER NOT NULL, CONSTRAINT TZLINK_PK PRIMARY KEY (LogID,TZ_ID), CONSTRAINT TZLINK_FK1 FOREIGN KEY (LogID) REFERENCES LOGMESSAGE(LogID), CONSTRAINT TZLINK_FK2 FOREIGN KEY (TZ_ID) REFERENCES TTIMEZONE(TZ_ID)); REM Create TBASENAME_LINK table CREATE TABLE TBASENAME_LINK ( LogID INTEGER NOT NULL, Base_ID INTEGER NOT NULL, CONSTRAINT BASELINK_PK PRIMARY KEY (LogID,Base_ID), CONSTRAINT BASELINK_FK1 FOREIGN KEY (LogID) REFERENCES LOGMESSAGE(LogID),

148
CONSTRAINT BASELINK_FK2 FOREIGN KEY (Base_ID) REFERENCES TBASENAME(Base_ID)); REM Create TREPORTIP_LINK table CREATE TABLE TREPORTIP_LINK ( LogID INTEGER NOT NULL, REPORTIP_ID INTEGER NOT NULL, CONSTRAINT REPORTIP_PK PRIMARY KEY (LogID,REPORTIP_ID), CONSTRAINT REPORTIP_FK1 FOREIGN KEY (LogID) REFERENCES LOGMESSAGE(LogID), CONSTRAINT REPORTIP_FK2 FOREIGN KEY (REPORTIP_ID) REFERENCES TREPORTIP(REPORTIP_ID)); REM Create TMESSAGE_TYPE_LINK table CREATE TABLE TMESSAGE_TYPE_LINK ( LogID INTEGER NOT NULL, MsgType_ID INTEGER NOT NULL, CONSTRAINT MESSAGETYPELINK_PK PRIMARY KEY (LogID,MsgType_ID), CONSTRAINT MESSAGETYPELINK_FK1 FOREIGN KEY (LogID) REFERENCES LOGMESSAGE(LogID), CONSTRAINT MESSAGETYPELINK_FK2 FOREIGN KEY (MsgType_ID) REFERENCES TMESSAGE_TYPE(MsgType_ID)); REM Create TSOURCE_IP_LINK table CREATE TABLE TSOURCE_IP_LINK ( LogID INTEGER NOT NULL, SourceIP_ID INTEGER NOT NULL, CONSTRAINT SOURCE_IP_LINK_PK PRIMARY KEY (LogID,SourceIP_ID), CONSTRAINT SOURCE_IP_LINK_FK1 FOREIGN KEY (LogID) REFERENCES LOGMESSAGE(LogID), CONSTRAINT SOURCE_IP_LINK_FK2 FOREIGN KEY (SourceIP_ID) REFERENCES TSOURCE_IP(SourceIP_ID)); REM Create TDESTINATION_IP_LINK table CREATE TABLE TDESTINATION_IP_LINK ( LogID INTEGER NOT NULL, DestIP_ID INTEGER NOT NULL, CONSTRAINT DESTINATION_IP_LINK_PK PRIMARY KEY (LogID,DestIP_ID), CONSTRAINT DESTINATION_IP_LINK_FK1 FOREIGN KEY (LogID) REFERENCES LOGMESSAGE(LogID), CONSTRAINT DESTINATION_IP_LINK_FK2 FOREIGN KEY (DestIP_ID) REFERENCES TDESTINATION_IP(DestIP_ID)); REM Create TSOURCEPORT_LINK table CREATE TABLE TSOURCEPORT_LINK ( LogID INTEGER NOT NULL,

149
SPort_ID INTEGER NOT NULL, CONSTRAINT SOURCEPORT_LINK_PK PRIMARY KEY (LogID,SPort_ID), CONSTRAINT SOURCEPORT_LINK_FK1 FOREIGN KEY (LogID) REFERENCES LOGMESSAGE(LogID), CONSTRAINT SOURCEPORT_LINK_FK2 FOREIGN KEY (SPort_ID) REFERENCES TSOURCEPORTS(SourcePort_ID)); REM Create TDESTPORT_LINK table CREATE TABLE TDESTPORT_LINK ( LogID INTEGER NOT NULL, DPort_ID INTEGER NOT NULL, CONSTRAINT DESTPORT_LINK_PK PRIMARY KEY (LogID,DPort_ID), CONSTRAINT DESTPORT_LINK_FK1 FOREIGN KEY (LogID) REFERENCES LOGMESSAGE(LogID), CONSTRAINT DESTPORT_LINK_FK2 FOREIGN KEY (DPort_ID) REFERENCES TDESTPORTS(DestPort_ID)); SPOOL OFF;

150
APPENDIX N
PopLinkTables.sql Description This populates the associative link tables. spool PopLinkTables.log REM Populate link tables SET ECHO ON SET HEADING ON SET NEWPAGE NONE SET LINESIZE 500 SET FEEDBACK ON SET COLSEP '|' SET TIMING ON REM Now we want to populate the TTIMEZONE_LINK table INSERT INTO TTIMEZONE_LINK (LogID, TZ_ID) SELECT l.LogID, t.TZ_ID FROM Logmessage l JOIN TTimeZone t ON l.TimeZone = t.TZ; SELECT * FROM TTIMEZONE_LINK WHERE ROWNUM <21; REM Now we want to populate the TBASENAME_LINK table INSERT INTO TBASENAME_LINK (LogID, Base_ID) SELECT l.LogID, b.Base_ID FROM Logmessage l JOIN TBASENAME b ON l.BaseName = b.BaseName; SELECT * FROM TBASENAME_LINK WHERE ROWNUM <21; REM Now we want to populate the TREPORTIP_LINK table INSERT INTO TREPORTIP_LINK (LogID, REPORTIP_ID) SELECT l.LogID, r.REPORTIP_ID FROM Logmessage l JOIN TREPORTIP r ON l.ReportIP = r.ReportIP; SELECT * FROM TREPORTIP_LINK WHERE ROWNUM <21; REM Now we want to populate the TMESSAGE_TYPE_LINK table INSERT INTO TMESSAGE_TYPE_LINK (LogID, MsgType_ID)

151
SELECT l.LogID, m.MsgType_ID FROM Logmessage l JOIN TMESSAGE_TYPE m ON l.MessageType = m.MsgType; SELECT * FROM TMESSAGE_TYPE_LINK WHERE ROWNUM <21; REM Now we want to populate the TSOURCE_IP_LINK table INSERT INTO TSOURCE_IP_LINK (LogID, SourceIP_ID) SELECT l.LogID, sip.SourceIP_ID FROM Logmessage l JOIN TSOURCE_IP sip ON l.SourceIP = sip.SourceIP; SELECT * FROM TSOURCE_IP_LINK WHERE ROWNUM <21; REM Now we want to populate the TDESTINATION_IP_LINK table INSERT INTO TDESTINATION_IP_LINK (LogID, DestIP_ID) SELECT l.LogID, dip.DestIP_ID FROM Logmessage l JOIN TDESTINATION_IP dip ON l.DestinationIP = dip.DestIP; SELECT * FROM TDESTINATION_IP_LINK WHERE ROWNUM <21; REM Now we want to populate the TSOURCEPORT_LINK table INSERT INTO TSOURCEPORT_LINK (LogID, SPort_ID) SELECT l.LogID, s.SourcePort_ID FROM Logmessage l JOIN TSourcePorts s ON l.SourcePort = s.PortNum; SELECT * FROM TSOURCEPORT_LINK WHERE ROWNUM <21; REM Now we want to populate the TDESTPORT_LINK table INSERT INTO TDESTPORT_LINK (LogID, DPort_ID) SELECT l.LogID, d.DestPort_ID FROM Logmessage l JOIN TDestPorts d ON l.DestinationPort = d.PortNum; SELECT * FROM TDESTPORT_LINK WHERE ROWNUM <21; spool off;

152
APPENDIX O
Description This is an example of the non-normalized script of 15 queries. SPOOL NonNormalized.LOG SET ECHO ON SET HEADING ON SET NEWPAGE NONE SET LINESIZE 500 SET FEEDBACK ON SET COLSEP '|' SET TIMING ON SET AUTOTRACE TRACEONLY REM These are the queries using the UNnormalized flat table REM Query 1: What are the different message types? select distinct (messagetype) from logmessage; REM Query 2: What are the different base names? select distinct (basename) from logmessage order by basename; REM Query 3: What are the report IPs from each base? SELECT DISTINCT BASENAME, ReportIP FROM LOGMESSAGE ORDER BY BASENAME; REM Query 4: What are the destination ports and how many events? SELECT Destinationport, Count(*) AS "Number of Events" FROM Logmessage WHERE Destinationport LIKE '%' GROUP BY Destinationport ORDER BY "Number of Events"; REM Query 5: What are the Top 10 destination ports for January? SELECT * FROM (SELECT Destinationport, "Number of Events", RANK () OVER (ORDER BY "Number of Events" DESC) Rank FROM (SELECT Destinationport, Count(*) AS "Number of Events"

153
FROM Logmessage WHERE Destinationport LIKE '%' AND (logdatetime >= '01-jan-11' and logdatetime<= '31-jan-11') GROUP BY Destinationport ORDER BY "Number of Events") ) WHERE Rank <=10; REM Query 6: What bases have port 445 as destination port and how many events? SELECT BaseName, Destinationport, Count(*) AS "Number of Events" FROM Logmessage WHERE Destinationport = '445' GROUP BY BaseName, Destinationport ORDER BY "Number of Events"; REM Query 7: What bases have port 445 as destination port and how many events in REM January? SELECT BaseName, Destinationport, Count(*) AS "Number of Events" FROM Logmessage WHERE Destinationport = '445' AND (logdatetime >= '01-Jan-11' AND logdatetime<= '31-Jan-11') GROUP BY BaseName, Destinationport ORDER BY "Number of Events"; REM Query 8: How many events use port 23 (TELNET) as destination port? SELECT Destinationport, Count(*) AS "Number of Events" FROM Logmessage WHERE Destinationport = '23' GROUP BY Destinationport ORDER BY "Number of Events"; REM Query 9: What bases have port 23 as destination port and how many events? SELECT BaseName, Destinationport, Count(*) AS "Number of Events" FROM Logmessage WHERE Destinationport = '23' GROUP BY BaseName, Destinationport ORDER BY "Number of Events"; REM Query 10: What are the bases and message types with message severity of 2 and the number REM of events?

154
SELECT DISTINCT Basename, Messagetype, Count(*) AS "Number of Events" FROM Logmessage WHERE messagetype LIKE '%-2-%' GROUP BY Basename, Messagetype ORDER BY "Number of Events"; REM Query 11: What are the bases, ReportIP, message type, with message severity of 2 and the number REM of events during the month of January 2011? SELECT Basename, ReportIP, Messagetype, Count(*) AS "Number of Events" FROM Logmessage WHERE Messagetype LIKE '%-2-%' AND (Logmessage.logdatetime >= '01-jan-11' and Logmessage.logdatetime <= '31-jan-11') GROUP BY Basename, ReportIP, Messagetype ORDER BY "Number of Events"; REM Query 12: What bases have sourceIP from Enemy table in January 2011 REM and what country? REM First create the Enemy Table DROP TABLE ENEMY CASCADE CONSTRAINTS; CREATE TABLE ENEMY AS SELECT * FROM IPTOCOUNTRY WHERE (COUNTRY_NAME LIKE 'ISLAMIC REPUBLIC OF IRAN') OR (COUNTRY_NAME LIKE 'CHINA'); SELECT BASENAME, ReportIP, SourceIP, COUNTRY_NAME FROM LOGMESSAGE L, ENEMY E WHERE L.SourceIPNum <= E.IP_TO AND L.SourceIPNum >= E.IP_FROM AND (L.logdatetime >= '01-jan-11' and L.logdatetime <= '31-jan-11'); REM Query 13: What LogID, Basename, ReportIP, SourceIP, Country, Token3, REM and Token4 have sourceIP from Enemy table that is on the egress REM list and permitted and what country? SELECT LogID, Basename, ReportIP, SourceIP, COUNTRY_NAME, Token3, Token4 FROM LOGMESSAGE L, ENEMY E WHERE L.SourceIPNum <= E.IP_TO AND L.SourceIPNum >= E.IP_FROM AND TOKEN3 LIKE '%egress%' AND TOKEN4 = 'permitted';

155
REM Query 14: What Basename, ReportIP, SourceIP, COUNTRY_NAME, DestinationIP REM Egress/Ingress (Token3), Permitted/Denied (Token4) did a source IP address from Enemy table REM show up in the log? SELECT SourceIP, LogDateTime, Basename, ReportIP, DestinationIP COUNTRY_NAME, Token3, Token4 FROM Logmessage, Enemy WHERE SourceIP = '203.171.234.174' AND (Logmessage.SourceIPNum <= Enemy.IP_TO and Logmessage.SourceIPNum >= Enemy.IP_FROM); REM Query 15: What are the Top 10 message types in the log? SELECT * FROM (SELECT MessageType, "Number of Events", RANK () OVER (ORDER BY "Number of Events" DESC) Rank FROM (SELECT MessageType, Count(*) AS "Number of Events" FROM Logmessage WHERE MessageType LIKE '%' GROUP BY MessageType ORDER BY "Number of Events") ) WHERE Rank <=10; SPOOL OFF;

156
APPENDIX P
Description This is an example of the normalized script of 15 queries. SPOOL Normalized.LOG SET ECHO ON SET HEADING ON SET NEWPAGE NONE SET LINESIZE 500 SET FEEDBACK ON SET COLSEP '|' SET TIMING ON SET AUTOTRACE ON STATISTICS SET AUTOTRACE TRACEONLY REM These are the queries using ONLY the normalized/summary tables REM Query 1: What are the different message types? SELECT MsgType FROM TMESSAGE_TYPE ORDER BY MsgType; REM Query 2: What are the different base names? SELECT BaseName FROM TBASENAME ORDER BY BaseName; REM Query 3: What are the report IPs from each base? SELECT DISTINCT BaseName, ReportIP FROM TBASENAME, TBASENAME_LINK, TREPORTIP, TREPORTIP_LINK WHERE TBASENAME.Base_ID = TBASENAME_LINK.Base_ID AND TBASENAME_LINK.LOGID = TREPORTIP_LINK.LOGID AND TREPORTIP_LINK.REPORTIP_ID = TREPORTIP.REPORTIP_ID ORDER BY BaseName; REM Query 4: What are the destination ports and how many events? SELECT DISTINCT PortNum, Count(*) AS "Number of Events" FROM TDESTPORTS, TDESTPORT_LINK WHERE TDESTPORT_LINK.DPort_ID = TDESTPORTS.DestPort_ID GROUP BY PortNum ORDER BY "Number of Events";

157
REM Query 5: What are the Top 10 destination ports for January? SELECT * FROM (SELECT Destinationport, "Number of Events", RANK () OVER (ORDER BY "Number of Events" DESC) RANK FROM (SELECT Destinationport, Count(*) AS "Number of Events" FROM Logmessage WHERE Logmessage.LOGID IN (SELECT TDESTPORT_LINK.LOGID FROM TDESTPORTS, TDESTPORT_LINK WHERE TDESTPORTS.DestPort_ID = TDESTPORT_LINK.DPort_ID) AND (Logmessage.logdatetime >= '01-jan-11' and Logmessage.logdatetime <= '31-jan-11') GROUP BY Destinationport ORDER BY "Number of Events") ) WHERE RANK <=10; REM Query 6: What are the bases with port 445 as destination port and how many events? SELECT DISTINCT TBASENAME.BASENAME, TDESTPORTS.PortNum, Count(*) AS "Number of Events" FROM TBASENAME, TBASENAME_LINK, TDESTPORTS, TDESTPORT_LINK WHERE TBASENAME.Base_ID = TBASENAME_LINK.Base_ID AND TBASENAME_LINK.LOGID = TDESTPORT_LINK.LOGID AND TDESTPORT_LINK.DPort_ID = TDESTPORTS.DestPort_ID AND TDESTPORTS.PortNum = '445' GROUP BY TBASENAME.BASENAME, TDESTPORTS.PortNum ORDER BY "Number of Events"; REM Query 7: What are the bases with port 445 as destination port and how many events in REM January? SELECT BASENAME, DestinationPort, Count(*) AS "Number of Events" FROM Logmessage WHERE Logmessage.LogID IN (SELECT TDESTPORT_LINK.LOGID FROM TDESTPORTS, TDESTPORT_LINK WHERE TDESTPORTS.DestPort_ID = TDESTPORT_LINK.DPort_ID AND TDESTPORTS.PortNum = '445') AND (Logmessage.logdatetime >= '01-jan-11' and Logmessage.logdatetime <= '31-jan-11') GROUP BY BASENAME, DestinationPort ORDER BY "Number of Events"; REM Query 8: How many events have port 23 (TELNET) as destination port? SELECT DISTINCT PortNum, Count(*) AS "Number of Events" FROM TDESTPORTS, TDESTPORT_LINK

158
WHERE TDESTPORT_LINK.DPort_ID = TDESTPORTS.DestPort_ID AND TDESTPORTS.PortNum = '23' GROUP BY PortNum ORDER BY "Number of Events"; REM Query 9: What baseS use port 23 (TELNET) and how many? SELECT DISTINCT TBASENAME.BASENAME, TDESTPORTS.PortNum, Count(*) AS "Number of Events" FROM TBASENAME, TBASENAME_LINK, TDESTPORTS, TDESTPORT_LINK WHERE TBASENAME.Base_ID = TBASENAME_LINK.Base_ID AND TBASENAME_LINK.LOGID = TDESTPORT_LINK.LOGID AND TDESTPORT_LINK.DPort_ID = TDESTPORTS.DestPort_ID AND TDESTPORTS.PortNum = '23' GROUP BY TBASENAME.BASENAME, TDESTPORTS.PortNum ORDER BY "Number of Events"; REM Query 10: What are the bases and message types with message severity of 2 and the number REM of events? SELECT DISTINCT Basename, Msgtype, Count(*) AS "Number of Events" FROM TBASENAME, TBASENAME_LINK, TMESSAGE_TYPE, TMESSAGE_TYPE_LINK WHERE TBASENAME.BASE_ID = TBASENAME_LINK.BASE_ID AND TMESSAGE_TYPE_LINK.MSGTYPE_ID = TMESSAGE_TYPE.MSGTYPE_ID AND TBASENAME_LINK.LOGID = TMESSAGE_TYPE_LINK.LOGID AND TMESSAGE_TYPE.MSGTYPE LIKE '%-2-%' GROUP BY Basename, Msgtype ORDER BY "Number of Events"; REM Query 11: What are the bases, ReportIP, message type, with message severity of 2 and the number REM of events during the month of January 2011? SELECT Basename, ReportIP, Messagetype, Count(*) AS "Number of Events" FROM Logmessage WHERE Logmessage.LOGID IN ( SELECT TMESSAGE_TYPE_LINK.LOGID FROM TMESSAGE_TYPE, TMESSAGE_TYPE_LINK WHERE TMESSAGE_TYPE_LINK.MSGTYPE_ID = TMESSAGE_TYPE.MSGTYPE_ID AND TMESSAGE_TYPE.MSGTYPE LIKE '%-2-%') AND (Logmessage.logdatetime >= '01-jan-11' and Logmessage.logdatetime <= '31-jan-11')

159
GROUP BY Basename, ReportIP, Messagetype ORDER BY "Number of Events"; REM Query 12: What bases have sourceIP from Enemy table in January 2011 REM and what country and reportIP? REM First create the Enemy Table DROP TABLE ENEMY CASCADE CONSTRAINTS; CREATE TABLE ENEMY AS SELECT * FROM IPTOCOUNTRY WHERE (COUNTRY_NAME LIKE 'ISLAMIC REPUBLIC OF IRAN') OR (COUNTRY_NAME LIKE 'CHINA'); SELECT Basename, ReportIP, SourceIP, COUNTRY_NAME FROM Logmessage, Enemy WHERE Logmessage.LOGID IN ( SELECT TBASENAME_LINK.LOGID FROM TBASENAME, TBASENAME_LINK, TSOURCE_IP, TSOURCE_IP_LINK WHERE TBASENAME.BASE_ID = TBASENAME_LINK.BASE_ID AND TSOURCE_IP.SOURCEIP_ID = TSOURCE_IP_LINK.SOURCEIP_ID AND TBASENAME_LINK.LOGID = TSOURCE_IP_LINK.LOGID) AND (Logmessage.logdatetime >= '01-jan-11' and Logmessage.logdatetime <= '31-jan-11') AND (Logmessage.SourceIPNum <= Enemy.IP_TO and Logmessage.SourceIPNum >= Enemy.IP_FROM); REM Query 13: What LogID, Basename, ReportIP, SourceIP, Country, Token3, REM and Token4 have sourceIP from Enemy table that is on the egress REM list and permitted and what country? SELECT LogID, Basename, ReportIP, SourceIP, COUNTRY_NAME, Token3, Token4 FROM Logmessage JOIN Enemy ON Logmessage.LOGID IN ( SELECT TBASENAME_LINK.LOGID FROM TBASENAME, TBASENAME_LINK, TSOURCE_IP, TSOURCE_IP_LINK WHERE TBASENAME.BASE_ID = TBASENAME_LINK.BASE_ID AND TSOURCE_IP.SOURCEIP_ID = TSOURCE_IP_LINK.SOURCEIP_ID AND TBASENAME_LINK.LOGID = TSOURCE_IP_LINK.LOGID) AND (Logmessage.SourceIPNum <= Enemy.IP_TO and Logmessage.SourceIPNum >= Enemy.IP_FROM) AND TOKEN3 LIKE '%egress%' AND TOKEN4 = 'permitted';

160
REM Query 14: What Basename, ReportIP, SourceIP, COUNTRY_NAME, DestinationIP REM Egress/Ingress (Token3), Permitted/Denied (Token4) did a source IP address from Enemy table REM show up in the log? SELECT SourceIP, LogDateTime, Basename, ReportIP, DestinationIP, COUNTRY_NAME, Token3, Token4 FROM Logmessage, Enemy WHERE Logmessage.LogID IN (SELECT TSOURCE_IP_LINK.LogID FROM TSOURCE_IP, TSOURCE_IP_LINK WHERE TSOURCE_IP.SourceIP_ID = TSOURCE_IP_LINK.SourceIP_ID AND TSOURCE_IP.SourceIP = '203.171.234.174') AND (Logmessage.SourceIPNum <= Enemy.IP_TO and Logmessage.SourceIPNum >= Enemy.IP_FROM); REM Query 15: What are the Top 10 message types in the log? SELECT * FROM (SELECT MsgType, "Number of Events", RANK () OVER (ORDER BY "Number of Events" DESC) RANK FROM (SELECT MsgType, Count(*) AS "Number of Events" FROM TMESSAGE_TYPE, TMESSAGE_TYPE_LINK WHERE TMESSAGE_TYPE.MsgType_ID = TMESSAGE_TYPE_LINK.MsgType_ID GROUP BY MsgType ORDER BY "Number of Events") ) WHERE RANK <=10; SPOOL OFF;

161
APPENDIX Q
RunNNQueries.sql
Description This script invokes the 32 individual non-normalized queries. spool RunNNQueries.log REM Run non-Normalized Queries 20x SET ECHO ON SET HEADING ON SET NEWPAGE NONE SET LINESIZE 500 SET FEEDBACK ON SET COLSEP '|' SET TIMING ON @15NN1 @15NN2 @15NN3 @15NN4 @15NN5 @15NN6 @15NN7 @15NN8 @15NN9 @15NN10 @15NN11 @15NN12 @15NN13 @15NN14 @15NN15 @15NN16 @15NN17 @15NN18 @15NN19 @15NN20 @15NN21 @15NN22 @15NN23 @15NN24 @15NN25

162
@15NN26 @15NN27 @15NN28 @15NN29 @15NN30 @15NN31 @15NN32 spool off;

163
APPENDIX R
RunNQueries.sql
Description This script invokes the 32 individual normalized queries. spool RunNQueries.log REM Run Normalized Queries SET ECHO ON SET HEADING ON SET NEWPAGE NONE SET LINESIZE 500 SET FEEDBACK ON SET COLSEP '|' SET TIMING ON @15N1 @15N2 @15N3 @15N4 @15N5 @15N6 @15N7 @15N8 @15N9 @15N10 @15N11 @15N12 @15N13 @15N14 @15N15 @15N16 @15N17 @15N18 @15N19 @15N20 @15N21 @15N22 @15N23 @15N24 @15N25 @15N26

164
@15N27 @15N28 @15N29 @15N30 @15N31 @15N32 spool off;

165
APPENDIX S
Dataset
Description This is the dataset collected and entered into SPSS. The unit of measurement is in seconds.
RunQueryType Group Q1 Q2 Q3 Q4 Q5 Q6 Q7 Q8 Q9 Q10 Q11 Q12 Q13 Q14 Q15
NNRun1 1 179.81 185.4 191.71 180.7 183.31 179.06 183.62 183.4 179.87 180.78 180.32 3764.04 182.84 179.93 180.75
NNRun2 1 178.86 183.1 182.59 179.78 181.84 181.14 184.68 185.79 183.46 180.82 180.59 4176.65 180.92 181.12 181.59
NNRun3 1 182.06 179.96 181.17 181.68 182.56 192.29 208.51 178.95 184.07 185.42 180.81 3764.95 178.9 182.09 182.03
NNRun4 1 182.28 181.81 178.96 182.89 183.62 180.76 185 179.96 182.78 183.39 183.14 4007.18 183.79 185.76 181.07
NNRun5 1 182.68 184.23 182.39 182.64 179.53 182.64 181.57 182.28 182.37 179.82 180.25 3761.68 183.6 183.51 178.9
NNRun6 1 182.81 181.2 179.78 182.68 183.67 179.71 181.98 179.57 181.61 201.98 185.32 4273.17 181.29 183.75 179.12
NNRun7 1 181.82 182.54 182.1 181.39 182.98 182.75 182.4 178.96 181.25 180.18 182.39 3881.81 190.71 178.71 183.92
NNRun8 1 185.7 181.5 182.1 179.04 214.4 182.45 180.7 180.82 179.79 183.15 182.65 4214.01 183.11 186.92 180.62
NNRun9 1 179.54 183.6 194.82 184.04 185.46 178.84 182.54 183.59 181.71 181.1 178.84 3898.81 186.17 181.04 180.62
NNRun10 1 180.4 181.73 183.26 182.14 180.18 182.03 183.15 186.31 182.17 179.14 180.85 4205.53 179.12 184.82 182.29
NNRun11 1 180.03 181.48 178.92 182.78 182.87 179.73 181.17 181.93 182.51 184.76 179.57 3885.4 181.7 183.31 180.89
NNRun12 1 181.65 178.39 182.26 183.29 182.43 181.75 178.7 180.64 182.65 180.87 181.81 4226.67 180.11 182.42 180.73
NNRun13 1 181.65 182.86 179.82 180.75 183.32 180.89 182.01 180.76 179.75 180.59 181.01 3890.14 181.75 178.64 184.2

166
NNRun14 1 185.4 180.68 183.23 180.29 184.5 181.96 178.76 180.81 180.36 184.15 182.15 4207.17 183.32 182.64 180.43
NNRun15 1 179.96 182.21 183.62 186.42 184.62 180.34 180.15 183.79 182.18 181.42 178.93 3903.81 182.73 180.56 179.57
NNRun16 1 182.7 172.5 174.45 179.9 177.82 173.15 173.1 175.03 175.03 176.15 174.04 3823.14 177.09 176.93 175.95
NNRun17 1 175.09 173.04 175.98 175.9 175.92 174.03 173.21 174.23 174.96 175.25 172.81 3530.39 174.48 173.04 180.35
NNRun18 1 176.21 174.18 178.59 172.78 175.45 178.34 174.25 175.56 173.15 175.7 176.17 3821.92 176.18 173.04 175.14
NNRun19 1 176.34 175.28 174.89 173.51 176.92 174.09 176.09 177.31 173.51 174.75 178.26 3525.53 179.95 173.48 175.57
NNRun20 1 173.17 178 175.06 175.5 175.39 172.92 175.37 176.57 173.75 175.86 187 3856.09 176.9 174.46 175.76
NNRun21 1 173.96 178.7 179.28 175.87 175.32 172.85 178.84 176.28 174.14 175.15 175.26 3556.14 176.84 176.37 177.37
NNRun22 1 174.87 174.15 175.48 178.23 177.18 174.57 174.4 176.17 181.64 177.51 175.61 3826.89 176.59 176.71 178.53
NNRun23 1 174.68 174.17 175.26 178.48 176.98 176 174.71 175.53 177.31 175.95 174.57 3524.82 176.48 173.87 178.98
NNRun24 1 181.48 177.37 177.71 174.68 177.71 176.59 175.89 177.61 173.64 176.53 174.6 3820.64 176.92 173.92 178.01
NNRun25 1 177.45 176.37 176.4 174.32 177.32 177.32 177.62 176.21 174.12 178.21 175.54 3521.92 177.28 174.84 176.57
NNRun26 1 174.87 176.92 177.78 175.21 176.4 174.75 178.54 176.67 176.37 177.96 173.4 3822.48 180.18 176.21 177.93
NNRun27 1 177.57 177.85 178.34 175.42 176.4 173.89 177.6 177.9 174.87 176.1 174 3526.59 177.11 178.21 178.79
NNRun28 1 175.75 175.78 176.73 179.59 178.73 176 175.07 177.93 179.07 178.17 174.68 3823.48 176.17 177.31 177.25
NNRun29 1 175.96 175.1 176.89 179.18 177.04 176.12 175.48 174.54 178.89 179.36 175.03 3534.01 178.68 177.15 199.37
NNRun30 1 180.81 175.26 177.62 175.68 176.79 183.03 176.21 176.43 174.32 177.9 177.51 3821.75 176.65 175.25 178.26
NNRun31 1 180.35 175.53 178.73 176.18 179.87 177.39 176 176.21 174.14 178.21 176.46 3526.96 178.25 176.07 176.98
NNRun32 1 177.68 178.46 178.09 176.07 177.76 175.31 178.43 180.57 176.32 176.75 175.7 3823.06 180.04 177.48 178.64
NRun1 2 0.03 0 144.42 6.25 226.7 23.32 490.65 5.04 24.71 38.29 342.84 790.71 261.1 8.35 23.21
NRun2 2 0 0 165.76 6.96 227.98 22.6 419.14 5.86 23.04 32.35 345.42 764.85 256.35 8.71 20.15

167
NRun3 2 0 0 141.95 7.06 228.2 18.48 416.48 6.48 22 32.03 352.92 804.93 258.37 8.87 21.18
NRun4 2 0 0 143.06 6.78 227.34 21.5 415.26 10.76 26.84 32.7 321.53 761.71 255.65 7.14 20.51
NRun5 2 0.09 0 148.67 9.23 255.57 22.92 419.43 5.56 21.96 34.93 341.42 773.48 263.12 8.43 20.75
NRun6 2 0.06 0.01 146.64 7.36 231.04 22.92 450.29 5.59 23.21 33.48 337.43 758.54 259.36 11.18 20.93
NRun7 2 0 0 144.61 8.17 221.04 16.68 417.92 5.42 26.18 44.14 330.54 760.1 253.04 7.6 21.76
NRun8 2 0 0 141.32 6.75 225.26 18.14 412.34 4.9 21.31 27.01 338.76 775.68 259.46 7.85 20.06
NRun9 2 0 0 144.15 6.84 225.39 20.42 461.84 6 24.54 31.78 329.48 764.39 255.79 5.93 20.93
NRun10 2 0.01 0 146.78 7.09 229.03 23.12 412.23 6.78 22.51 34.45 333.1 752.87 281.51 7.59 21.5
NRun11 2 0.01 0 146.64 6.53 225.04 21.04 425.46 5.87 23.65 35.36 321.89 768.81 255.21 10.2 21.35
NRun12 2 0 0 140.54 6.53 224.71 19.79 419.04 5.68 23.25 35.56 370.15 755.62 254.96 7.59 21.32
NRun13 2 0 0 144.18 6.75 223.39 19.86 416.26 4.92 22.29 29.21 326.6 763.29 259.18 7.31 21.75
NRun14 2 0 0 153.15 7.07 224.25 22.9 412.03 4.56 18.36 29.48 329.15 758.34 256.37 7.4 22.4
NRun15 2 0 0 144.75 6.75 223.14 22.51 425.68 6.01 20.87 33.18 325.04 792.32 260.84 7.56 21.64
NRun16 2 0.06 0.03 142.46 7.42 233.26 24.32 494.17 7.89 25.03 31.07 338.92 789.4 280.81 5.32 21.62
NRun17 2 0.01 0.07 142.75 7.23 228.2 24.14 429.81 6.79 25.87 25.29 332.54 764.76 255.09 7.78 21.67
NRun18 2 0 0.17 142.57 6.9 224.29 22.73 402.95 4.95 23.6 33.68 372.5 756.18 254.65 7.87 20.51
NRun19 2 0 0 142.67 7.45 224.53 27.06 431.65 5.56 23.21 33.45 336 767.07 253.31 8.03 21.73
NRun20 2 0 0.01 220.85 6.87 232.25 25.79 439.85 5.68 22.73 31.79 325.45 756.48 255.78 8.04 21.14
NRun21 2 0 0 141.56 7.5 226.43 21.31 424.26 5.25 24.15 31.17 320.2 793.95 258.81 6.73 20.56
NRun22 2 0 0 142.6 6.78 224 20.65 419.31 6.84 19.65 31.5 346.18 760.65 252.4 5.32 21.06
NRun23 2 0 0 141.31 6.39 227.12 30.29 434.26 4.78 22.98 33.51 346 756.42 256.98 8.51 20.31

168
NRun24 2 0 0 143.07 7.12 224.14 18.9 409.56 5.25 22.43 35.14 338.36 758.71 256.68 6.76 21.25
NRun25 2 0.01 0 143.28 8.29 227.62 46.64 421.32 5.37 22.67 32.39 335.48 777.65 257.15 7.9 20.45
NRun26 2 0 0.09 141.23 6.76 226.45 22.71 462.12 10.68 22.75 33.25 319.92 765.29 256.68 7.37 20.67
NRun27 2 0 0 144.85 6.65 227.64 22.79 411.43 5.51 24.39 32.89 331.98 763.64 278.18 8.12 20.85
NRun28 2 0 0 144.28 7.76 223.5 17.84 433.45 5.84 22.06 36.23 320.31 760.29 255.15 11.25 20.95
NRun29 2 0 0.1 144.9 6.62 226.46 22.12 407.89 5.68 23.43 35.4 359.82 767.53 257.07 5.2 19.92
NRun30 2 0 0 147.98 6.82 224.89 18.46 440.86 5.57 23.31 33.01 320.15 781.5 256.03 8.11 20.31
NRun31 2 0 0 153.71 7.01 225.45 23.03 420.6 5.11 23.5 25.78 342.81 763.67 259.64 7.95 20.32
NRun32 2 0 0 145.14 7.6 223.73 24.06 426.78 4.64 16.84 28.03 329.4 811.12 258.36 7.59 21.95

169
APPENDIX T
SPSS Output: Independent Samples Test
Levene's Test
for Equality of
Variances t-test for Equality of Means
F Sig. t df Sig. (2-tailed)
Mean
Difference
Std. Error
Difference
95% Confidence Interval
of the Difference
Lower Upper
Q1
Equal variances assumed 91.353 .000 300.253 62 .000 179.16594 .59672 177.97312 180.35876
Equal variances not assumed 300.253 31.002 .000 179.16594 .59672 177.94893 180.38295
Q2
Equal variances assumed 101.004 .000 278.553 62 .000 178.71469 .64158 177.43218 179.99719
Equal variances not assumed 278.553 31.007 .000 178.71469 .64158 177.40618 180.02319
Q3
Equal variances assumed 2.134 .149 12.237 62 .000 32.25562 2.63583 26.98668 37.52457
Equal variances not assumed 12.237 37.069 .000 32.25562 2.63583 26.91526 37.59599
Q4 Equal variances assumed 61.590 .000 272.229 62 .000 171.86625 .63133 170.60424 173.12826

170
Equal variances not assumed 272.229 32.859 .000 171.86625 .63133 170.58159 173.15091
Q5
Equal variances assumed .581 .449 -28.927 62 .000 -46.36719 1.60293 -49.57139 -43.16299
Equal variances not assumed -28.927 60.213 .000 -46.36719 1.60293 -49.57328 -43.16109
Q6
Equal variances assumed .379 .540 132.653 62 .000 155.73906 1.17403 153.39221 158.08591
Equal variances not assumed 132.653 59.292 .000 155.73906 1.17403 153.39008 158.08805
Q7
Equal variances assumed 17.805 .000 -61.935 62 .000 -249.33031 4.02570 -257.37757 -241.28305
Equal variances not assumed -61.935 36.130 .000 -249.33031 4.02570 -257.49379 -241.16683
Q8
Equal variances assumed 25.719 .000 272.259 62 .000 173.04656 .63560 171.77602 174.31710
Equal variances not assumed 272.259 42.386 .000 173.04656 .63560 171.76422 174.32890
Q9
Equal variances assumed 28.285 .000 209.341 62 .000 155.57625 .74317 154.09067 157.06183
Equal variances not assumed 209.341 48.495 .000 155.57625 .74317 154.08240 157.07010
Q10
Equal variances assumed .847 .361 134.553 62 .000 147.04844 1.09287 144.86383 149.23305
Equal variances not assumed 134.553 56.241 .000 147.04844 1.09287 144.85937 149.23751
Q11
Equal variances assumed 20.825 .000 -63.425 62 .000 -157.90687 2.48968 -162.88368 -152.93007
Equal variances not assumed -63.425 35.612 .000 -157.90687 2.48968 -162.95809 -152.85566

171
Q12
Equal variances assumed 34.776 .000 74.213 62 .000 3065.84000 41.31114 2983.26020 3148.41980
Equal variances not assumed 74.213 31.260 .000 3065.84000 41.31114 2981.61378 3150.06622
Q13
Equal variances assumed 2.546 .116 -55.522 62 .000 -79.28844 1.42805 -82.14307 -76.43381
Equal variances not assumed -55.522 44.586 .000 -79.28844 1.42805 -82.16541 -76.41146
Q14
Equal variances assumed 38.343 .000 228.634 62 .000 170.93750 .74765 169.44298 172.43202
Equal variances not assumed 228.634 38.232 .000 170.93750 .74765 169.42427 172.45073
Q15
Equal variances assumed 10.650 .002 208.922 62 .000 158.79594 .76007 157.27657 160.31530
Equal variances not assumed 208.922 32.824 .000 158.79594 .76007 157.24924 160.34263

172
APPENDIX U Statistical information about the actual event logs.
1. Number of records in the event logs: 30,721,104
2. Number of bases in the event logs: 43
3. Date range of the logs: 19-OCT-10 06.00.26.00000 AM to 04-Mar-11 11.59.55.000000 AM
4. Number of message types: 169
5. Number of events for each month: October -------------------------- 6642 November --------------------------- 36237 December --------------------------- 4828245 January -------------------------- 13934721 Febuary -------------------------- 10347568 March ------------------------ 427357

173
6. Number of rows from each base: 'Altus': 66783 'Andersen': 99464 'CapeCod': 19986 'Cavalier': 1701 'Charleston': 189990 'Clear': 121976 'Columbus': 81173 'DiegoGarcia': 16957 'Dover': 10277 'Elmendorf': 34661 'Fairchild': 887871 'FEWarren': 398925 'Guam: 21251 'Hickam': 343545 'Kadena': 35842 'KaenaPoint': 15985539 'Keesler': 180701 'Kunsan': 124285 'Lackland': 1366585 'Laughlin': 29870 'LosAngeles': 1087035 'Luke': 432406 'MacDill': 24 'Malmstrom': 738313 'McChord': 299468 'McConnell': 60 'McGuire': 234 'NewBoston': 128303 'Oakhanger': 610043 'Onizuka': 814354 'Osan': 46321 'Patrick': 24838 'Pope': 55136 'Randolph': 266027 'Randolph-NOSC': 182062 'Scott-NOSC': 194029 'Sheppard': 68633 'Thule': 450173 'Travis': 19482 'Tyndall': 336178 'USAFA': 1153317 'Vandenberg': 3279791 'Yokota': 17452

174
7. Number of events with message types: 'SEC-6-IPACCESSLOGP'; COUNT(*) ---------- 8908417 'SEC-6-IPACCESSLOGDP'; COUNT(*) ---------- 1554588 'SEC-6-IPACCESSLOGNP'; COUNT(*) ---------- 20309 'SEC-6-IPACCESSLOGRL'; COUNT(*) ---------- 667451 'SEC-6-IPACCESSLOGRP'; COUNT(*) ---------- 15029 'SEC-6-IPACCESSLOGS'; COUNT(*) ---------- 289062
8. Bases that use a second Router Sequence Number Andersen Guam Hickam Kadena KaenaPoint Kunsan Malmstrom McConnell NewBoston Pope Sheppard
9. The different message types found in the logs:

175
MESSAGETYPE ----------------------------------- AMDP2_FE-5-LATECOLL AUTHMGR-5-FAIL AUTHMGR-5-START AUTHMGR-5-SUCCESS Attempte Attempted Attempting Authentication BGP-3-NOTIFICATION BGP-5-ADJCHANGE Blocking C6KPWR-SP-2-PSFAIL C6KPWR-SP-4-INPUTCHANGE C6KPWR-SP-4-PSNOREDUNDANCY C6KPWR-SP-4-PSOK C6KPWR-SP-4-PSOUTPUTDROP C6KPWR-SP-4-PSREDUNDANTBOTHSUPPLY C6KPWR-SP-4-PSREDUNDANTMISMATCH C6KPWR-SP-4-PSREDUNDANTONESUPPLY CDP-4-DUPLEX_MISMATCH CDP-4-NATIVE_VLAN_MISMATCH CI-3-PSFAIL CLEAR-5-COUNTERS CONTROLLER-5-UPDOWN CRYPTO-4-IKMP_NO_SA CRYPTO-4-PKT_REPLAY_ERR CRYPTO-4-RECVD_PKT_INV_SPI CRYPTO-4-RECVD_PKT_MAC_ERR Card Clear Configure Configured DIAG-SP-6-DIAG_OK DIAG-SP-6-RUN_MINIMUM DOT1X-5-FAIL DOT1X-5-SUCCESS DTP-SP-5-DOMAINMISMATCH DUAL-5-NBRCHANGE DVMRP-5-NBRDOWN DVMRP-5-NBRUP EC-5-CANNOT_BUNDLE2 EC-5-COMPATIBLE EC-5-L3DONTBNDL2

176
EC-SP-5-CANNOT_BUNDLE2 EIGRP-IPv4:(511) EIGRP-IPv4:(513) ENTITY_ALARM-6-INFO ENVIRONMENT-2-FAN_FAULT Extended FABRIC-SP-5-CLEAR_BLOCK FABRIC-SP-5-FABRIC_MODULE_BACKUP FastEthernet0/1 FastEthernet0/12 FastEthernet0/15 FastEthernet0/17 FastEthernet0/18 FastEthernet0/2 FastEthernet0/20 FastEthernet0/22 FastEthernet0/23 FastEthernet0/24 FastEthernet0/7 Firewalled Group HARDWARE-2-FAN_ERROR HARDWARE-5-FAN_OK Host IP-3-LOOPPAK IP-EIGRP(0) ISSU_PROCESS-SP-3-SYSTEM Interfac Interface LINEPROTO-5-UPDOWN LINK-3-UPDOWN LINK-4-ERROR LINK-5-CHANGED Lin Line MAB-5-FAIL MLS_RATE-4-DISABLING MV64340_ETHERNET-5-LATECOLLISION Module NHRP-4-QUOTA NTP-4-PEERUNREACH NTP-6-PEERREACH Native Netflow OIR-3-LONGSTALL OIR-6-INSCARD

177
OIR-6-REMCARD OIR-SP-6-INSCARD OSPF-5-ADJCHG PFINIT-SP-5-CONFIG_SYNC PFREDUN-SP-4-BOOTSTRING_INVALID PFREDUN-SP-4-VERSION_MISMATCH PIM-5-DRCHG PIM-5-NBRCHG PLATFORM_ENV-1-FAN PM-4-ERR_DISABLE PM-4-ERR_RECOVER PM-4-SVI_ADD_CORRESPONDING_L2_VLAN PORT_SECURITY-2-PSECURE_VIOLATION PORT_SECURITY-2-SECURITYREJECT PORT_SECURITY-6-VLAN_REMOVED Port RADIUS-3-NOSERVERS RADIUS-4-RADIUS_ALIVE RADIUS-4-RADIUS_DEAD RCMD-4-RSHPORTATTEMPT RF-SP-5-RF_TERMINAL_STATE RTD-1-LINK_FLAP Received SEC-6-IPACCESSLOGDP SEC-6-IPACCESSLOGNP SEC-6-IPACCESSLOGP SEC-6-IPACCESSLOGRL SEC-6-IPACCESSLOGRP SEC-6-IPACCESSLOGS SNMP SNMP-3-AUTHFAIL SNMP-5-CHASSISALARM SNMP-5-COLDSTART SNMP-5-MODULETRAP SPANTREE-2-BLOCK_BPDUGUARD SPANTREE-SP-2-BLOCK_PVID_LOCAL SPANTREE-SP-2-BLOCK_PVID_PEER SPANTREE-SP-2-LOOPGUARD_BLOCK SPANTREE-SP-2-LOOPGUARD_UNBLOCK SPANTREE-SP-2-RECV_PVID_ERR SPANTREE-SP-2-UNBLOCK_CONSIST_PORT SSH SSH-4-SSH2_UNEXPECTED_MSG SSH-5-DISABLED SSH-5-ENABLED STACKMGR-4-STACK_LINK_CHANGE

178
STACKMGR-5-MASTER_READY STACKMGR-5-SWITCH_READY SW_VLAN-6-VTP_DOMAIN_NAME_CHG SW_VLAN-SP-4-VTP_USER_NOTIFICATION SYS-3-CPUHOG SYS-5-CONFIG SYS-5-CONFIG_I SYS-5-RELOAD SYS-5-RESTART SYS-5-SCHEDULED_RELOAD SYS-5-SCHEDULED_RELOAD_CANCELLED SYS-6-BOOTTIME SYS-6-CLOCKUPDATE SYS-6-LOGGINGHOST_STARTSTOP SYS-SP-3-LOGGER_FLUSHED SYSTEM_CONTROLLER-3-ERROR Security Status Sync'ing System TAC-3-SECRETDEFINEFAILED TCP-6-BADAUTH The Unblocking VPN_HW-1-PACKET_ERROR Vlan239 Vlan24 Vlan747 access-list list neighbor power psecure-violation sent
10. Message types with message severity of 1 and the number of events
MSGTYPE Number of Events
RTD-1-LINK_FLAP 5
PLATFORM_ENV-1-FAN 20
VPN_HW-1-PACKET_ERROR 48

179
APPENDIX V
Excerpts of the actual results from the queries (Q5-Q10):
Query 5: What are the Top 10 destination ports for January?
DESTINATIONPORT Number of Events RANK
53 1117081 1
0 1002738 2
445 119130 3
137 96312 4
139 64883 5
161 60630 6
80 34504 7
5060 27736 8
22 19256 9
51715 18014 10

180
Query 6: What are the bases with port 445 as destination port and how many events?
BASENAME PORTNUM Number of Events
Andersen 445 2
Randolph 445 5
CapeCod 445 11
Scott-NOSC 445 35
Malmstrom 445 143
LosAngeles 445 192
Thule 445 237
Onizuka 445 610
USAFA 445 679
FEWarren 445 777
Tyndall 445 1971
NewBoston 445 3125
Patrick 445 3310
Lackland 445 3344
Clear 445 9900
McChord 445 40939
Vandenberg 445 311819
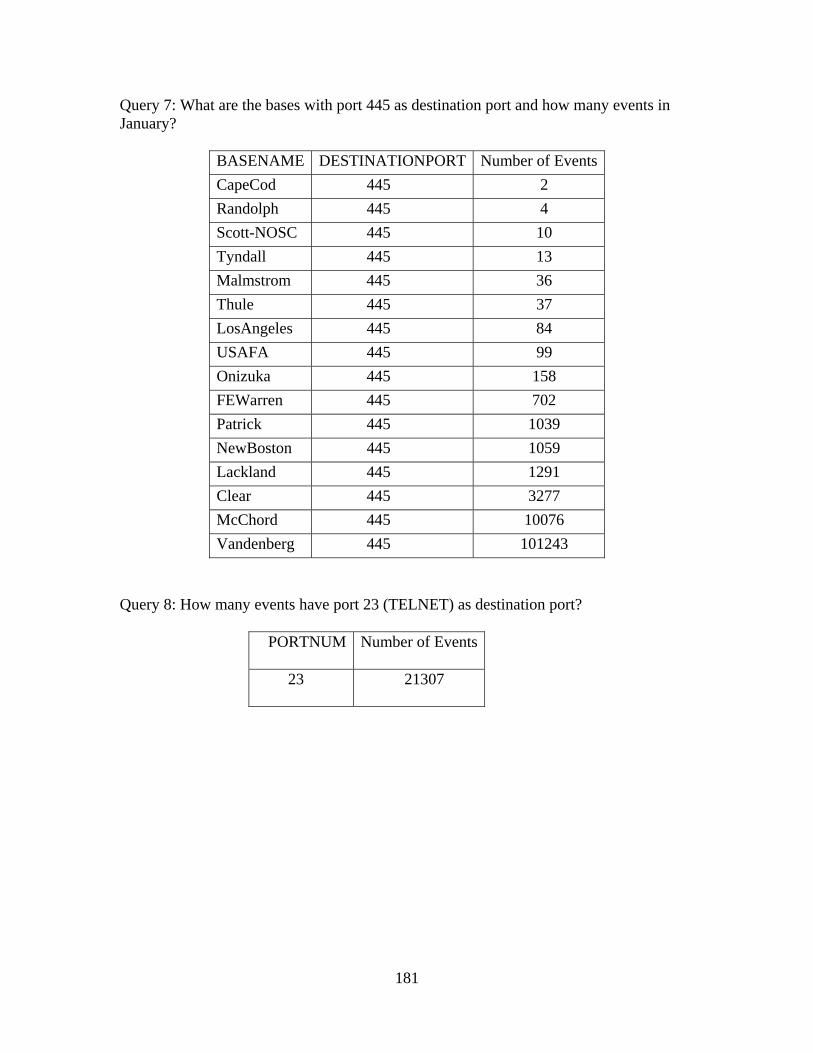
181
Query 7: What are the bases with port 445 as destination port and how many events in January?
BASENAME DESTINATIONPORT Number of Events
CapeCod 445 2
Randolph 445 4
Scott-NOSC 445 10
Tyndall 445 13
Malmstrom 445 36
Thule 445 37
LosAngeles 445 84
USAFA 445 99
Onizuka 445 158
FEWarren 445 702
Patrick 445 1039
NewBoston 445 1059
Lackland 445 1291
Clear 445 3277
McChord 445 10076
Vandenberg 445 101243
Query 8: How many events have port 23 (TELNET) as destination port?
PORTNUM Number of Events
23 21307

182
Query 9: What bases use port 23 (TELNET) and how many?
BASENAME PORTNUM Number of Events
Scott-NOSC 23 4
LosAngeles 23 6
McChord 23 106
Columbus 23 109
Dover 23 151
Sheppard 23 152
McGuire 23 159
Randolph 23 162
Travis 23 187
Laughlin 23 208
Onizuka 23 340
Andersen 23 426
CapeCod 23 490
Luke 23 510
NewBoston 23 623
Patrick 23 669
Malmstrom 23 2891
Thule 23 4327
FEWarren 23 4484
Clear 23 5303
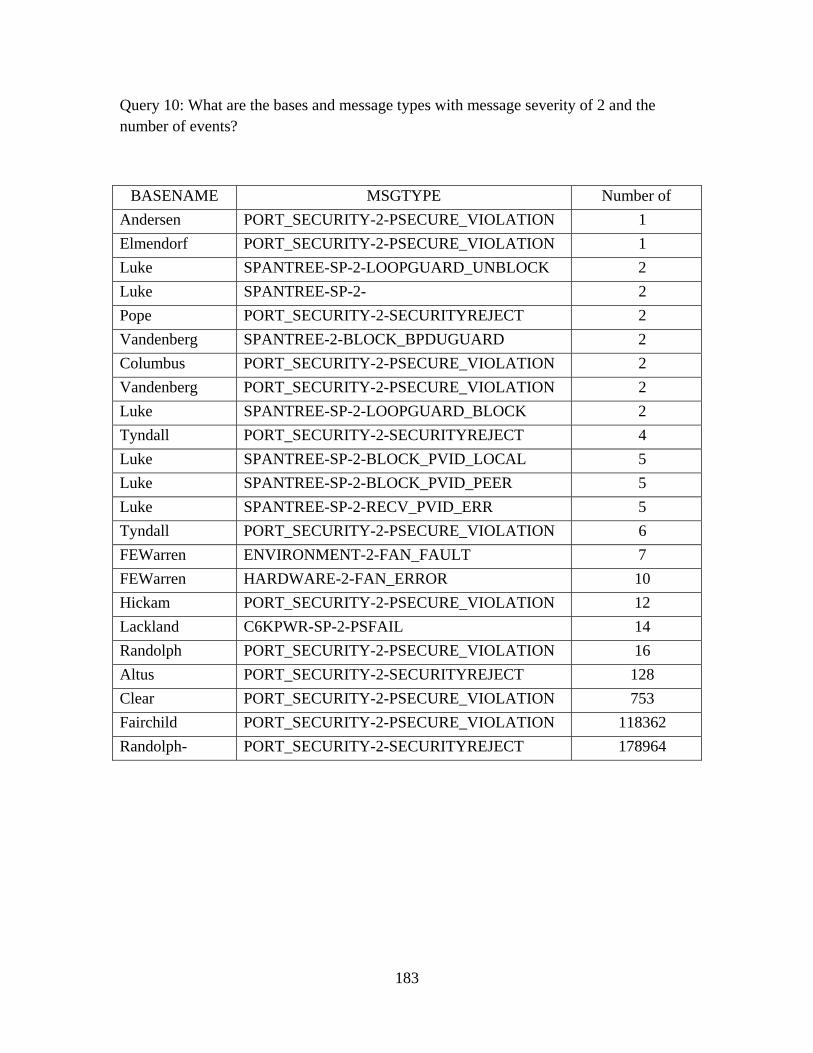
183
Query 10: What are the bases and message types with message severity of 2 and the number of events?
BASENAME MSGTYPE Number of
Andersen PORT_SECURITY-2-PSECURE_VIOLATION 1
Elmendorf PORT_SECURITY-2-PSECURE_VIOLATION 1
Luke SPANTREE-SP-2-LOOPGUARD_UNBLOCK 2
Luke SPANTREE-SP-2- 2
Pope PORT_SECURITY-2-SECURITYREJECT 2
Vandenberg SPANTREE-2-BLOCK_BPDUGUARD 2
Columbus PORT_SECURITY-2-PSECURE_VIOLATION 2
Vandenberg PORT_SECURITY-2-PSECURE_VIOLATION 2
Luke SPANTREE-SP-2-LOOPGUARD_BLOCK 2
Tyndall PORT_SECURITY-2-SECURITYREJECT 4
Luke SPANTREE-SP-2-BLOCK_PVID_LOCAL 5
Luke SPANTREE-SP-2-BLOCK_PVID_PEER 5
Luke SPANTREE-SP-2-RECV_PVID_ERR 5
Tyndall PORT_SECURITY-2-PSECURE_VIOLATION 6
FEWarren ENVIRONMENT-2-FAN_FAULT 7
FEWarren HARDWARE-2-FAN_ERROR 10
Hickam PORT_SECURITY-2-PSECURE_VIOLATION 12
Lackland C6KPWR-SP-2-PSFAIL 14
Randolph PORT_SECURITY-2-PSECURE_VIOLATION 16
Altus PORT_SECURITY-2-SECURITYREJECT 128
Clear PORT_SECURITY-2-PSECURE_VIOLATION 753
Fairchild PORT_SECURITY-2-PSECURE_VIOLATION 118362
Randolph- PORT_SECURITY-2-SECURITYREJECT 178964

184
Bibliography
Air Intelligence Agency Public Affairs. (2006, 7/5/2006). Air force stands up first
network warfare wing. 2011(May 15), Available:
http://www.af.mil/news/story_print.asp?id=123022799
Alavi, M. & Leidner, D. E. (2001). Review: Knowledge management and knowledge
management systems: Conceptual foundations and research issues. MIS Quarterly
25(1), 107-136.
Anderson, J. P. (1980). Computer security threat monitoring and surveillance. No. 98.
Technical report. James P. Anderson Company: Fort Washington, Pennsylvania.
Apte, C., Liu, B., Pednault, E. P. D., & Smyth, P. (2002). Business applications of data
mining. Communications of the ACM, 45(8), 49-53.
Babbin, J., Kleiman, D., Carter, E. F., Faircloth, J., Burnett, M., & Gutierrez, E. (2006).
Security log management. Identifying patterns in the chaos. Syngress
Publishing: Rockland, MA.
Baker, W., Hutton, A., Hylender, C. D., Pamula, J., Porter, C., & Spitler, M. (2011).
2011 Data breach investigations report: Verizon RISK Team with cooperation
from the U.S. Secret Service and the Dutch High Tech Crime Unit. Retrieved
from http://www.secretservice.gov/Verizon_Data_Breach_2011.pdf
Blue Coat (2011) Retrieved from
https://kb.bluecoat.com/index?page=content&id=FAQ1246&actp=search&viewlo
cale=en_US&searchid=1306532896872
Brenton, C., Bird, T., & Ranum, M. (2006). Top 5 essential log reports. Retrieved from
http://www.sans.org/security-resources/top5_logreports.pdf

185
Cisco (2011). Understanding access control list logging. Retrieved from
http://www.cisco.com/web/about/security/intelligence/acl-logging.html
Committee on National Security Systems (CNSS). (2010). National Information
Assurance (IA) Glossary. (CNSS Instruction No. 4009).
Davenport, T. H., & Prusak, L. (2000). Working knowledge: How organizations manage
what they know. Boston, Massachusetts: Harvard Business School Press.
Department of Defense. (1973). ADP Security Manual: Techniques and Procedures for
Implementing, Deactivating, Testing and Evaluating Secure Resource-Sharing
ADP Systems. (DOD 5200.28-M). Washington, DC.
Donley, M. B., & Schwartz, N. A. (2009). Memorandum for all airmen: Air force
cyberspace mission alignment. Unpublished manuscript.
Dunham, M. (2003). Data mining introductory and advanced topics. New Jersey:
Pearson.
Endsley, M. R. (1995). Measurement of situation awareness in dynamic systems.
Human Factors, 37(1), 65-84.
Feld, C. S. & Stoddard, D. B. (2004). Getting IT right. Harvard Bussiness Review 82(2),
72-79.
Field, A. (2009) Discovering statistics using SPSS. London: SAGE Publications.
Gerhards, R. (2009). The syslog protocol RFC 5424. Retrieved from
http://tools.ietf.org/html/rfc5424
Grimaila, M. R., Myers, J., Mills, R. F., & Peterson, G. (2011). Design and analysis of a
dynamically configured log-based distributed security event detection

186
methodology. The Journal of Defense Modeling and Simulation: Applications,
Methodology, Technology, 1-23. doi: 10/1177/1548512911399303
Grimes, R. A., (2010, August 4). InfoWorld review: Better network security, compliance
with log management. Retrived from http://www.infoworld.com/d/data-
explosion/infoworld-review-meeting-the-network-security-and-compliance-
challenge-658?page=0,0.
Hasan, M., Sugla, B., & Viswanathan, R. (1999). A conceptual framework for network
management event correlation and filtering systems. Paper presented at the
Integrated Network Management, 1999. Distributed Management for the
Networked Millennium. Proceedings of the Sixth IFIP/IEEE International
Symposium, 233-246.
Heinbockel, W. (2011, July 8). CEE Event Record and CLS Encoding Specification
draft-cee-cls-06-8. Retrieved from
http://cee.mitre.org/repository/downloads/CEE_Common_Log_Syntax-
v0.6.html#core-fields
Heinbockel, W., & Graves, T. (2011). Introduction to CEE v0.6. Retrieved from
http://scap.nist.gov/events/2011/itsac/presentations/day3/Heinbockel%20-
%20CEE.pdf
Hoffer, J. A., Prescott, M. B., & Toppi, H. (2009) Modern database management. Upper
Saddle River, NJ: Pearson Prentice Hall.
Hucaby, D. (2005, Nov 4). Cisco ASA and PIX firewall logging. Retrieved from
http://www.ciscopress.com/articles/article.asp?p=424447

187
Inmon, W. H. (2000). What is a data warehouse? Retrieved from
https://www.business.auc.dk/oekostyr/file/What_is_a_Data_Warehouse.pdf
Jabbour, K. & Muccio, S. (2011). The science of mission assurance. Journal of Strategic
Security, 6(2), 61-74.
Jakobson, G., Weissman, M., Brenner, L., Lafond, C., & Matheus, C. (2000). GRACE:
Building next generation event correlation services. Paper presented at the
Network Operations and Management Symposium, 2000. NOMS 2000. 2000
IEEE/IFIP, 701-714.
Kent, K., & Souppaya, M. (2006) Guide to computer security log management. (NIST
Special Publication 800-92).
Lee, H. (1995). Justifying database normalization: A cost/benefit model. Information
Processing & Management, 31(1), 59-67.
Lonvick, C. (2001). The BSD syslog protocol RFC 3164. Retrieved from
http://tools.ietf.org/html/rfc3164
Martin-Flatin, J. P., Jakobson, G., & Lewis, L. (2007). Event correlation in integrated
management: Lessons learned and outlook. Journal of Network and Systems
Management, 15(4), 481-502.
Microsoft (2011a). Interpreting the windows firewall log. 2011(May 15), Available:
http://technet.microsoft.com/en-us/library/cc758040(WS.10).aspx
Microsoft (2011b). Types of event log entries. Retrieved from
http://msdn.microsoft.com/en-us/library/zyysk5d0.aspx
MITRE (2010a, May 27). CEE Terminology. Retrieved from
http://cee.mitre.org/terminology.html

188
MITRE (2010b, May 27). Frequently Asked Questions. Retrieved from
http://cee.mitre.org/faqs.html#a2
MITRE (2010c). Common Event Expression, Architecture Overview. Retrieved from
http://cee.mitre.org/docs/CEE_Architecture_Overview-v0.5.pdf
Myers, J. (2010). A dynamically configurable log-based distributed security event
detection methodology. (Unpublished masteral thesis). Air Force Institute of
Technology, Wright-Patterson Air Force Base, Ohio.
Ogasawara, E., Martinez, L. C., de Oliveira, D., Zimbrão, G., Pappa, G. L., & Mattoso,
M. (2010). Adaptive normalization: A novel data normalization approach for non-
stationary time series. Paper presented at the Neural Networks (IJCNN), the 2010
International Joint Conference, 1-8.
Okolica, J., McDonald, J. T., Peterson, G. L., Mills, R. F., & Hass, M. (2009).
Developing systems for cyber situational awareness. Proceedings of the 2nd
Cyberspace Research Workshop. Shreveport, LA.
Oracle database reference 10g release 2 (10.2) (2005). Analyze. Retrieved from
http://docs.oracle.com/cd/B19306_01/server.102/b14200/statements_4005.htm
Oracle database reference 10g release 2 (10.2) (2009). Statistics Description. Retrieved
from
http://docs.oracle.com/cd/B19306_01/server.102/b14237/stats002.htm
Pipkin, D. L. (2000). Information security: protecting the global enterprise. Upper
Saddle River, NJ: Prentice Hall PTR.
Plivna, G. (2008, July 28). SQL join types. Retrieved from
http://www.gplivna.eu/papers/sql_join_types.htm

189
Rist, O. (2005). Attack of the auditors. InfoWorld 27(12), 34-40.
Sah, A. (2002). A new architecture for managing enterprise log data. LISA, 121-132.
Sanders, G., & Shin, S. (2001). Denormalization effects on performance of RDBMS.
Paper presented at the HICSS, 3013.
Shenk, J. (2009). SANS annual 2009 log management survey. A SANS Whitepaper.
Retrieved from
http://www.sans.org/reading_room/analysts_program/logMgtSurvey_Apr09.pdf
Shenk, J. (2010). SANS sixth annual log management survey report. SANS Sixth
Annual Log Management Survey Report. SANS Whitepaper. Retrieved from
http://www.sans.org/reading_room/analysts_program/logmgtsurvey-2010.pdf
Shin, B. (2003). An exploratory investigation of system success factors in data
warehousing. Journal of the Association for Information Systems, 4, 141-168.
Tripwire. (2010). All Logs Archived. Every log available. Retrieve from
http://www.tripwire.com/it-security-software/log-event-management/log-
management/
Tuomi, I. (2000). Data is more than knowledge: Implications of the reversed knowledge
hierarchy for knowledge management and organizational memory. Journal of
Management Information Systems 16(3), 103-117.
Vaarandi, R. (2002). Platform independent event correlation tool for network
management. IEEE. Department of Computer Engineering, Tallinn Technical
University, Estonia. 907-909.
Van den Hoven, J. (2001) Information resource management: Foundation for knowledge
management. Information Systems Management 18(2), 80-87.

190
Weldon, J. L. (1996). Data mining and visualization. Database Programming & Design,
9(6), 21-24.
Wyllys, R. E. (2010, October 25). Steps in normalization. Retrieved from
http://www.gslis.utexas.edu/~wyllys/DMPAMaterials/normstep.html#Section%20
10.%20The%204th%20Normal%20Form

191
REPORT DOCUMENTATION PAGE Form Approved OMB No. 074-0188
The public reporting burden for this collection of information is estimated to average 1 hour per response, including the time for reviewing instructions, searching existing data sources, gathering and maintaining the data needed, and completing and reviewing the collection of information. Send comments regarding this burden estimate or any other aspect of the collection of information, including suggestions for reducing this burden to Department of Defense, Washington Headquarters Services, Directorate for Information Operations and Reports (0704-0188), 1215 Jefferson Davis Highway, Suite 1204, Arlington, VA 22202-4302. Respondents should be aware that notwithstanding any other provision of law, no person shall be subject to anypenalty for failing to comply with a collection of information if it does not display a currently valid OMB control number. PLEASE DO NOT RETURN YOUR FORM TO THE ABOVE ADDRESS. 1. REPORT DATE (DD-MM-YYYY)
22-03-2012 2. REPORT TYPE
Master’s Thesis 3. DATES COVERED (From – To)
Mar 2011 - Mar 2012 4. TITLE AND SUBTITLE
Analysis Of The Impact Of Data Normalization On Cyber Event Correlation Query Performance
5a. CONTRACT NUMBER
5b. GRANT NUMBER
5c. PROGRAM ELEMENT NUMBER
6. AUTHOR(S)
Ludovice, Smile T., MSgt, USAF
5d. PROJECT NUMBER
5e. TASK NUMBER
5f. WORK UNIT NUMBER
7. PERFORMING ORGANIZATION NAMES(S) AND ADDRESS(S)
Air Force Institute of Technology Graduate School of Engineering and Management (AFIT/EN) 2950 Hobson Way, Building 640 WPAFB OH 45433-7765
8. PERFORMING ORGANIZATION REPORT NUMBER
AFIT/GIR/ENV/12-M03
9. SPONSORING/MONITORING AGENCY NAME(S) AND ADDRESS(ES)
Intentionally left blank. 10. SPONSOR/MONITOR’S ACRONYM(S)
11. SPONSOR/MONITOR’S REPORT NUMBER(S)
12. DISTRIBUTION/AVAILABILITY STATEMENT APPROVED FOR PUBLIC RELEASE; DISTRIBUTION UNLIMITED
13. SUPPLEMENTARY NOTES
14. ABSTRACT
A critical capability required in the operation of cyberspace is the ability to maintain situational awareness of the status of the infrastructure elements that comprise cyberspace. Event logs from cyber devices can yield significant information, and when properly utilized can provide timely situational awareness about the state of the cyber infrastructure. In addition, proper Information Assurance requires the validation and verification of the integrity of results generated by a commercial log analysis tool. Event log analysis can be performed using relational databases. To enhance database query performance, previous literatures affirm denormalization of databases; yet, database normalization can also increase query performance. Database normalization improved majority of the queries performed using very large data sets of router events; however, performance is also dependent on the type of query executed. Queries performed faster on normalized table if all the necessary data are contained in the normalized tables. Furthermore, database normalization improves table organization and maintains better data consistency than non-normalized. Nonetheless, there are some tradeoffs when normalizing a database such as additional preprocessing time and extra storage requirements though minimal in this experiment. Overall, normalization improved query performance and must be considered as an option when analyzing event logs using relational databases. 15. SUBJECT TERMS
Query Performance, Database, Normalization, Event Logs
16. SECURITY CLASSIFICATION OF: 17. LIMITATION OF ABSTRACT
UU
18. NUMBER OF PAGES
193
19a. NAME OF RESPONSIBLE PERSON
Michael R. Grimaila, PhD, CISSP, CISMa. REPORT
U
b. ABSTRACT
U
c. THIS PAGE
U 19b. TELEPHONE NUMBER (Include area code) (937) 255-3636 X4800, [email protected]
Standard Form 298 (Rev. 8-98) Prescribed by ANSI Std. Z39-18