analysis of the impact of tpp between member states
TRANSCRIPT
1
Analysis of the Impact of TPP
Between Member States
Dae-Jong Kim1
Bryan Hopkins2
Abstract
Analysis of the impact of the United States and Japan in the international industry trade
association analysis of impacts due to the total amount of $ 11.3334 trillion. Looking
specifically to intermediate goods traded between the two countries with a total consumption of
$ 5.437 trillion value added amount of $ 5,8 trillion and $ 30.1 billion international middle
income margin. US-Japanese trade is largely due to the mutual benefits of trade between the
U.S. and Japan that can be reported. In the middle of world trade, the trade between the United
States and Japan is the largest. Due to trade between the United States and Japan, most
significantly affected sectors are as follows. Sector is the largest Renting of M & Eq and Other
Business Activities, Agriculture, Hunting Forestry and Fishing, Electrical and Optical Equipment,
Chemicals and Chemical Products, and Financial Intermediation is. United States, Japan and
South Korea would join the TPP economic effect, all three signatories to the GDP of
approximately 1.7 to 2.1 percent annual increase in the degree.
Key words: TPP, one day FTA, Japan and the United States FTA, industry association analysis,
Economic literature list: F1
1 Sejong university, professor, [email protected]
2 Sejong university, professor, [email protected]

2
Ⅰ. Introduction
2014 The United States in June TPP (Trans-Pacific Partnership) and TTIP (Trans-Atlantic
Trade and Investment Partnership Agreement) at the same time promoting. Both the United
States while promoting global trade negotiations at the same time seeking to standardize.
In 2014, if the TPP is to be concluded under the leadership of the United States, it would
account for 38% of global GDP, trade volume would also account for 26% of the large free-
trade volume is expected to be formed. However, the size of the economy and economic
development of the TPP 12 negotiation phase is very large gap between the participating
countries. In Japan, the TPP FTA with the United States may also be regarded as.
<Table 1> TPP negotiations Parties overview
Division Population
(10,000)
GDP
(Billion dollars)
GDP per capita
(In dollars)
USA 31,194 150,757 48,328
JAPAN 12,790 58,970 46,108
CANADA 3,444 17,811 51,716
Australia 2,248 14,905 66,289
New Zealand 441 1,618 36,688
Chile 1,725 2,509 14,552
Mexico 11,373 11,583 10,184
Peru 3,001 1,785 5,948
Brunei 39 164 41,662
Malaysia 2896 2879 9941
Singapore 531 2656 50000
Vietnam 8932 1227 1374
Note: 1) population, GDP and GDP per capita of 2011
Source: IMF, Ministry of Industry usual, the Bank of Korea (2013)
05/23/2014 – During two days, President Obama visited Japan. This place is out in the TPP
negotiations specifically for the Japanese, but the yield did not expect. Although specific details
are not known 800% of its rice tariffs and agricultural areas in Japan. Japan is that it does not
compromise

3
Similarly, South Korea and Japan are also conscious of the farmers can easily produce a
table of tariffs will not yield. Negotiations, the U.S. and Japan, and the Japan only benefited.
The reason is that the Senkaku Islands to the United States included in the zone, but the
defense of the United States, TPP is because the Japanese did not concede.
U.S. GDP is $ 15 trillion and $ 6 trillion Japan, Korea, is $ 1.2. GDP in South Korea is 15
times larger than the United States. Japan is five times that of the Republic of Korea. Thus, it is
agreed to meet two great economies of TPP negotiations.
South Korea is the world led by the United States to the normal flow of the match to go. On
April 25, 2014 after a visit to Japan the day after President Obama visited Korea. President
Obama on the spot in Korea is more actively involved in TPP and asked for a fast paced TPP
negotiation. Prior to January 10, 2014 President of the United States Park Geun-hye in an
interview with Bloomberg
Korea was determined to join the TPP , to proceed in consultation with the member states ,
he said. Government has already December 3, 2013 to join TPP establish firmly held in Bali,
Indonesia, attended the Ministerial Conference WTO . This is where the government of
Australia , Canada , along with TPP (13 countries , the United States, Japan, Australia, Mexico,
Singapore , Chile, Peru, Vietnam, Malaysia, Canada, Brunei , New Zealand, Korea) agreed to
participate in the pre- adoption progress. After such a full-fledged TPP negotiations late into
South Korea.
Block the world economy as the region from 13 countries , including South Korea, took part in
the TPP . But one day the TPP and FTA , the Korea's position is similar to the character . The
reason is that Korea TPP members are already partners in 12 countries FTA, the exception
New Zealand , Mexico and Japan. Trade between the two countries , except in Japan is less
than 3% of Korea 's total exports is very small. Therefore, when signing the TPP countries are
very much influenced by Japan. For this reason, one day is with the nature of the FTA can be
seen as TPP . However, the position of the United States and Japan in the TPP -FTA is strong.
About 5 times the GDP of Japan and South Korea, the United States is about 15 times that of
South Korea's GDP. According to the official website of the South Korea FTA FTA to promote
the following: a . " Our foreign economy is gross domestic product (GDP) , which accounts for
more than 82% of the points to be considered. In 2009, gross domestic product (GDP) in the
foreign trade (exports + imports ) accounted for 82.2% of this . Korea should join the TPP is
why other countries are major trading partners (Japan) and an FTA would first apply our
4
products in accordance with the high tariff deterioration of price competitiveness gradually
loses market , "he argues.
South Korea is based on the March 2014 Chile, Singapore , EFTA, ASEAN, India , EU, Peru ,
USA, Turkey , Canada and 47 countries signed the FTA with . Join TPP in Korea in 2014 is one
of the biggest issues in the economy .
China and the United States will vie for supremacy in Asia, resulting in territorial conflicts
and trade disputes. Korea-China FTA with South Korea was initially promoted the FTA because
of one day joining TPP was retained . However, the TPP is to be concluded in 2014 that
became known the government has decided to join .Neighboring countries, and South Korea
FTA in this situation is becoming more complex calculations . From a long time ago in Korea,
China and Japan wanted to create a single economic bloc to the official start of FTA
negotiations are not going to be afraid. Containment of China for the U.S. economic reasons
will continue to block requests from Korea. South Korea to join the TPP was thus confirmed .
Trilateral FTA among the three countries in particular apart from the korea-china, one day
as well, such as pushing the bilateral FTA. But one day the comfort women issue, such as the
recent FTA is not easy. In one day, instead of TPP FTA that will look at the progress. In this
paper, Pacific Partnership Agreement (TPP) concept, through promoting economic background
and effective industry association analysis in accordance with the TPP join the United States,
Japan and South Korea to evaluate the impact of such respect.
Based on May 2014, Korea's largest trading partner is China, not the United States. What
about the economic situation in Korea? Korea in December 2013 to $ 50.5 billion Exports May
compared with the same month last year, an increase of 7.3%, as well as for the first time ever,
exports exceeded $ 50 billion was May. December 2013 South Korea's current account surplus
is based on the total exceeded $ 44 billion. Thus, Korea's current account balance continues as
a surplus. TPP is the definition of economic integration in Asia and the Pacific was launched for
the purpose of creating a Pacific Partnership Agreement (TPP: Trans-Pacific Partnership).
Progress in June 2005 to look at New Zealand, Singapore ,Chile and Brunei , launched the
four countries in the multilateral system of free trade agreements . Economy is smaller
negotiating initially was not received little attention. However, President Obama's active
participation in the TPP is actively underway. Korea is one of the reasons why you should join
TPP is a regional supply system will enter. In the Asia Pacific region, if we go into the supply
system and the strong competition in the state of Japan is deprived of a large part of the
5
market. For this reason future economic growth within the region enter the supply chain. The
government has made the right one to join the TPP is . However, in Japan, Korea, the Japanese
electronics and cars imported duty of 8% and 10% of trucks. Until now, such a substantially
higher tariff raises the price of Japanese goods protecting South Korea's automobile industry.
Now, coming to Japan might be pushed into a car by South Korea.
South Korea's economic and corporate growth has greatly contributed to the infant industry
protection. Invitation to the United States Treasury Secretary Alexander Hamilton and the
German Friedrich List of the infant industry protection the country's industry until a certain
competitive advantage will protect the growth . Be able to compete with foreign companies
since the doors should be open. Accept this theory in Germany, Korea, and Japan are currently
able to achieve economic growth. Era of openness is the world's businesses and our
businesses have to survive the era of competition so there needs to be the execution of the
TPP. The Japanese car imports are concerned, but on the contrary the other TPP member
countries to increase exports at the same time because the name of cancer present.
Ⅱ. A Short History of the Literature
Institute for International Economic Policy (KIEP) (2013) in Korea is about 2.5 to 2.6 percent
of joining TPP will increase real GDP and not join reduced to about 0.11 to 0.19% at the time
pointed out that it would.
Petri, zhai, Plummer (2011) when the United States entered into the TPP 2025, the total welfare
level is increased to about 150 to 30,700,000,000 U.S. dollars argued. They used GTAP 8
models were analyzed using the CGE model.
Yeohyeokjong (2013), "U.S. Trade Representative released a report in 2013 by Country Trade
Barriers", the United States Trade Representative (USTR) is April 1, 2013 to "country or other
trade barriers", "sanitary and quarantine" and "technical barriers" for three kind of report was
released. Trade Barriers Report (National Trade Estimate Report on Foreign Trade Barriers) in
1988, the U.S. General Trade Law (The Omnibus Trade and Competitiveness Act of 1988)
based on the USTR end of March each year an annual report to Congress of the United States
as a trading partner 61 information on trade and investment barriers are embedded.
Import policy barriers to trade around the report, dealing with trade barriers such as export
subsidies, and the first United States negotiate a future target station, used as the basis for

6
selection of watch list, in that significant. Backbone of the U.S. foreign trade policy in that
country, particularly high proportion of trade with the United States has received the attention of
Since 2010, SPS (Sanitary and Phytosanitary Measures, animal and plant health and quarantine)
and TBT (Technical Barriers to Trade, Technical Barriers to Trade related issues to the NTE
report has been published separately . Usually related to the United States, reflecting the
interest of China (p. 41 , EU (23 pages ), Japan ( 15). Related content is large, Korea has a
total of 09 pages of related issues that last year was reduced by more than one page. With
regard to the 2012 Korea -US FTA removed trade barriers were removed that have widely
positive reviews but the process of formulation and implementation of regulatory transparency
must be emphasized.
Yiheungbae (2014) Journal of the ordinary in one day, " one day the FTA impact on the
domestic industry of parts " in the parts industry in Korea and Japan were analyzed . He was
part of Korea's industry is $ 35,440,000 during one day of the FTA would result in a trade deficit
analysis. He expanded trade deficit and trade imbalances will intensify, so that measures were
required provision.
Seonghangyeong 2014 Joint Conference in Economics in 2014 announced "TPP and TTIP
( Trans-Atlantic Trade and Investment Partnership Agreement, Trans-Atlantic Trade and
Investment Partnership) in Korea, China, and Japan are economic impact study on the effects
of dynamic " in dynamic GE model was used. He came into effect in this paper when Korea
was involved in TPP is approximately -0.1 % to 4% , China -0.06% -0.1 % - Japan is changing
by as much as 0.5 to 0.6 percent results. South Korea's participation in TPP needs perspective,
as well as the participation of South Korea in Northeast Asia could also have a positive impact .
Hanminjeong (2013) of the "South Korea's participation in TPP Study strategy : focusing on
e-commerce, " Commerce and Information Research Volume 15 , Issue 1 of the four countries
launched a regional trade agreement with Pacific Solidarity Agreement (TPP) in the United
States participation and active involvement of physicians in Japan .
In this paper, a steady stream of requests from the United States and across the Asia Pacific
region have been discussed in view of the size of the TPP thought to be involved. Of the US-
led TPP FTA agreements concluded in information, based on the existing configuration was
expected to be. He is expected to continue to lead the e-commerce sector in which they have
a favorable part of the United States are expected to actively present. If you are involved in,
such as Korea - U.S. FTA agreements in the field of conventional and active part in our favor

7
was presented, leading to Korea's e-commerce market, it is important to work on the direction
of the negotiations, he said.
Move, Hong Yuncheng (2013) of "Should Korea Join the TPP?: An Empirical Analysis of the
Trade Effect" " Korea has joined Pacific Economic Partnership Agreement should you do? "
( Economic Research 2013.3 ) shall empirical analysis of trade effects U.S. Pacific economic
Partnership Agreement (Trans-Pascific Partnership) through economic integration and trade
volumes continued to affect the governance , he said. He joined South Korea is considering
Pacific Partnership Agreement and noted . He said, " China will show strong support for ASEAN
+3 , ASEAN +3 and ASEAN +6 negotiations also underway. South Korea to join the East Asian
economic integration and trade volumes will have a significant impact on "he said. In this
paper, a different trading rights in the Republic of Korea Sign up for the study of trade creation
effect. Using the gravity model and the empirical research from 1990 to 2011 in 22 countries,
trade between Korea and other trade partners was analyzed.
However, the authors of this paper Kimdaejong using association analysis of the industry that is
the difference.
Ⅲ Research Model
U.S., South Korea and Japan joined the TPP talks at the same time as a large number of other
countries, including the three countries which as predicted, created a ripple effect. 2013,
according to data published in the World 2011, the input-output cross-country input-output
analysis (Intercountry Input-Output Table for 2011) in Korea and Japan, from the $ 41.5 billion
brought a ripple effect analysis. Industrial Bank of Korea linkage analysis (2011) and
Kimdaejong (2012) of <Online shopping industry in the domestic economy, the ripple effect
analysis>, choenakgyun 2013's "trade-induced effects of employment and value-added
analysis" (international economics) and yiheungbae (2014) in <FTA, one day is part of the
domestic industry Effects> According to industry association analysis method is as follows.
Industry Input-Output Tables for each industry, other industries are part of the total outturn and
the final distribution in any form, whether for demand. For example, one of the industry total
outturn of the industry 1, 2, and industrial production process of industries. respectively, ..., as
long as each is committed to the distribution. Any remaining committed to the final distribution,
but in order to meet demand, intermediate demand and final demand to satisfy the total outturn
8
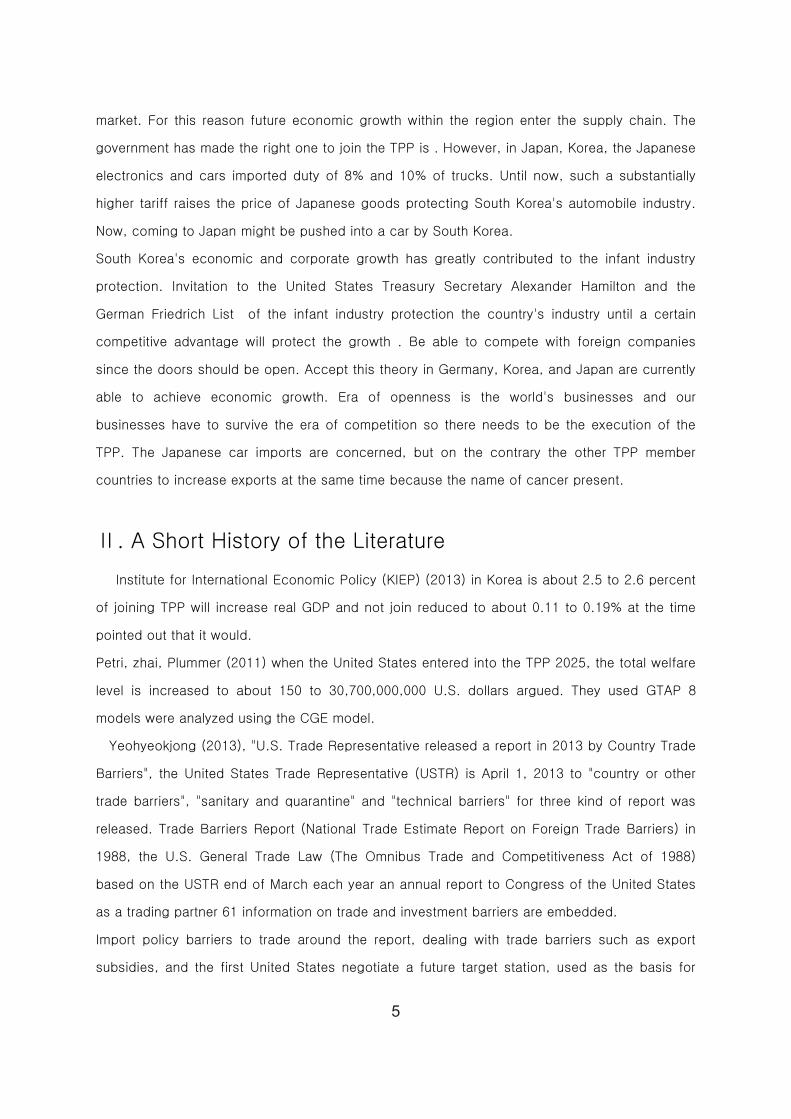
income shall be included in the minutes. In other words, the industry has been established, the
next one on.
(1)
<Table 2> Korea and Japan, the basic structure of the industry association analysis
40 countries, in current
prices 1
industry
2 industry 3 industry 4 industry Total
output
(industry-by-industry) JPN JPN JPN JPN JPN
(millions of US$) Country Industrial
Classification
c1 c2 c3 c4 c5
1 industry KOR c12 3 7 154 2
2 industry KOR c24 102 145 128 6
3 industry KOR c8 229 145 160 22
Tariff KOR 2 1 7 1
Total commitment KOR c20
( Intercountry Input-Output Table for 2011)
(TAX) (2)
South Korea's industrial association analysis in domestic mutual trade between the goods and
services demand and intermediate inputs representing the middle portion of the endogenous
sectors. After recording a portion of the final demand sector is divided into exogenous. After

9
that exogenous changes in sector mutual relationship between the endogenous sectors of
industry as a whole by the ripple effect analysis. However, in this case between the two
countries, Japan and South Korea is the industry association analysis.
Now, the equation of the income from the industry in Japan, Korea and d m of the industry is
divided into the following holds.
(3)
Formula (3) is substituted, the following relational expression of the input demand and supply
balance of the equation system is established.
(4)
If this expression vector is established. It is the inverse of the equation becomes, using the
results to changes in final demand, the impact of each industry and the production can be
calculated.
The increase in the industry which appears as an increase of the ripple effect can be estimated
by industry.
In this study, published in 2013, that is an international industry association analysis input-
output cross-country analysis (2011) are used. As before, the value added by using household
duties and so it has been established between the vector display
(5)
However, where the diagonal elements of the coefficient matrix into a diagonal factor.
International input-output analysis is analysis of both the industry and, unlike Korea's industrial
sector and the sector is divided into a total of 35. Horizontal and vertical, respectively 35 35

10
industry lists the industry. Since the industry has no impact on other countries to share the
entire industry whether analyzed. That tuipaek production is induced after each industry, again
yields a change in the degree of development of a chain of computed. Japan is one obtained
prior to the industrial development of the cost impact of the production of tuipaek
This holds true for the next assignment.
(6)
Expression (6) through the liquid to spread in accordance with other industry tuipaek be
calculated.
Industry production activities in the country in the international economy, the industry has a
ripple effect on other countries to use when measuring other biochemical techniques
(exogenous specification) are used. Impact Analysis of the manufacturing industry is one of the
nation's total production of other countries to analyze the impact.
The industry has achieved GDP growth is estimated that across the let production. Rows and
columns corresponding to the industrial sector, including the exogenous industry in order to
separate the rows and columns associated with the single. That is, the other column and row
arrangement on the want to a variable matrix is moved outwards. Thus, the following two
equations for the endogenous variables system is established.
(7)
Input coefficient matrix of the industry involved in the industry, except the matrix columns and
rows, the vector of input coefficients for the industry, the industry refers to the amount of each,
except for vector. Can be expressed as the equation system. The equation is
Becomes. Through this type of industry, as long as the total production cause fluctuations in
the respective industries, the ripple effect is as follows.
The ripple effect of the two countries can be calculated.

11
(8)
Ⅳ. Data and Statistics
Korea, as shown in the table since 1998, and has since continued trade surplus. However, at
the time of the 2008 financial crisis, leading to a large trade deficit of $ 13.2 billion was
recorded. The reason is that the domestic industrial structure of foreign trade, while 82% rely on
the difficult domestic economic slowdown in developed countries and Korea's export outlets
are blocked it was the main cause.
2004 Korea-Chile FTA since the U.S., EU, Australia, and Canada (2014, FTA, Final
settlement), etc. to join FTA signed the FTA in Asia most countries.
< Table 3 > South Korea trend of total export revenue trade balance
Division Total exports
( $ thousand )
Total Revenue
( $ thousands )
Trade balance
( $ thousands )
1990 65,015,730 69,843,676 -4,827,946
1991 71,870,121 81,524,856 -9,654,735
1992 76,631,515 81,775,257 -5,143,742
1993 82,235,866 83,800,145 -1,564,279
1994 96,013,237 102,348,176 -6,334,939
1995 125,057,987 135,118,932 -10,060,945
1996 129,715,136 150,339,101 -20,623,965
1997 136,164,204 144,616,376 -8,452,172
1998 132,313,143 93,281,755 39,031,388
1999 143,685,459 119,752,283 23,933,176
2000 172,267,511 160,481,015 11,786,496
2001 150,439,144 141,097,821 9,341,323

12
2002 162,470,527 152,126,153 10,344,374
2003 193,817,442 178,826,658 14,990,784
2004 253,844,673 224,462,687 29,381,986
2005 284,418,741 261,238,264 23,180,477
2006 325,464,849 309,382,632 16,082,217
2007 371,489,087 356,845,734 14,643,353
2008 422,007,328 435,274,737 -13,267,409
2009 363,533,560 323,084,522 40,449,038
2010 466,383,761 425,212,160 41,171,601
2011 555,213,655 524,413,090 30,800,565
2012 547,869,792 519,584,473 28,285,319
2013 559,648,708 515,585,515 44,063,193
( Source: Bank of Korea , 2014 )
TPP analysis is one to one similar to the nature of the FTA on trade, focusing on one day was
investigated. Exports to Japan in 2013 by a $ 34.6 billion revenue was $ 60 billion, respectively.
Negative trade balance of $ 25.3 billion to the deficit persists. Fortunately for Japan, South
Korea’s trade deficit of $ 36.1 billion has reduced slightly each year since 2010 Export
performance of SMEs looking to export in 2012 was $ 102.6 billion. Among them, 632 in Asia,
North America and 109 billion billion, $ 12.4 billion Europe, the Middle East accounted for $ 8.5
billion. Japan's exports of $ 11.4 billion for that small. It is 2011 and down 0.5% compared with
a slightly will When South Korea joined the TPP trade between Korea and Japan will be much
higher than the current more.
By the end of 2013, China is the largest exporter to Korea. China exports about $ 83 billion
of $ 145.8 billion and imports. $ 62.8 billion trade surplus in China reaches for. China is South
Korea's largest trade surplus. 2 of the United States exported $ 62 billion and imports of $ 41.5
billion. The United States had a trade surplus of $ 20.5 billion.

13
<Table 4> South Korea's exports by country income trends
(thousand dollars)
2013 2012 2011
Exports Imports Exports Imports Exports Imports
TOTAL 559,648,708 515,560,844 548,075,929 519,581,584 555,213,656 524,413,090 CHINA 145,836,767 83,037,429 134,331,099 80,777,791 134,185,009 86,432,238 USA 62,056,025 41,510,611 58,523,678 43,337,402 56,207,703 44,569,029
JAPAN 34,693,728 60,015,980 38,850,174 64,350,837 39,679,706 68,320,170 HONG KONG 27,761,650 1,929,579 32,609,163 2,058,600 30,968,405 2,315,073 SINGAPORE 22,279,598 10,365,523 22,891,805 9,675,466 20,839,005 8,966,683 VIETNAM 21,087,589 7,170,311 15,954,023 5,718,017 13,464,922 5,084,246 TAIWAN 15,701,955 14,630,837 14,819,337 14,011,115 18,205,965 14,693,589
INDONESIA 11,574,115 13,188,478 13,945,845 15,678,327 13,564,498 17,216,374 INDIA 11,385,053 6,182,544 11,921,074 6,923,868 12,654,078 7,893,573 RUSSIA 11,150,209 11,496,259 11,098,724 11,355,073 10,304,880 10,852,171 MEXICO 9,727,492 2,301,580 9,041,384 2,595,100 9,729,059 2,315,698 BRAZIL 9,688,914 5,572,421 10,287,973 6,084,048 11,821,399 6,342,934
AUSTRALIA 9,563,658 20,767,694 9,268,572 22,978,398 8,163,845 26,316,304 SAUDI ARABIA 8,824,019 37,664,947 9,122,144 39,722,358 6,964,299 36,972,612 PHILIPPINES 8,783,009 3,705,004 8,229,194 3,282,160 7,338,902 3,571,472 MALAYSIA 8,589,828 11,096,723 7,802,551 9,796,003 6,275,131 10,467,817 THAILAND 8,073,603 5,229,504 8,216,964 5,352,025 8,458,966 5,413,360 GERMANY 7,907,891 19,333,437 7,511,299 17,640,703 9,500,927 16,962,579 MARSHALL
ISLANDS 7,436,578 186,878 3,934,176 119,637 7,053,544 58,895
UNITED ARAB
EMIRATES 5,741,036 18,124,004 6,852,113 15,115,895 7,267,754 14,759,366
TURKEY 5,658,180 691,835 4,552,344 672,300 5,070,997 804,624
NETHERLANDS 5,516,309 4,213,495 5,059,022 3,991,280 4,626,981 4,425,509 CANADA 5,204,577 4,716,731 4,828,285 5,246,033 4,927,656 6,611,934 ENGLAND 4,727,192 6,193,573 4,897,276 6,359,668 4,969,095 3,818,089
IRAN 4,480,816 5,558,572 6,262,198 8,531,177 6,068,276 11,358,379 SLOVACIA 4,407,047 186,551 4,625,580 170,067 4,103,422 140,811 POLAND 3,600,992 775,201 3,678,311 535,029 4,100,788 376,178 LIBERIA 3,513,040 6,483 3,803,615 1,180 7,389,345 1,275 FRANCE 3,486,387 6,012,068 2,601,223 4,923,661 5,707,388 6,314,947 Panama 3,484,528 516,357 3,977,883 594,848 3,798,253 393,860 Italy 3,126,872 5,378,214 3,262,364 4,826,414 4,107,495 4,373,924
South AFRICA 2,697,260 1,729,530 2,188,311 2,134,671 2,254,760 3,105,467
Chile 2,461,474 4,657,610 2,469,347 4,677,294 2,381,457 4,857,963
(Source: Bank of Korea , 2014 )

14
< Table 5 > Korea for Japan, Export, Import, Trade balance trend
Total exports
(thousand dollars)
Total revenue
(thousand dollars)
Trade balance
(thousand dollars)
1990 12,637,879 18,573,851 -5,935,972
1991 12,355,839 21,120,217 -8,764,378
1992 11,599,454 19,457,650 -7,858,196
1993 11,564,418 20,015,519 -8,451,101
1994 13,522,860 25,389,988 -11,867,128
1995 17,051,230 32,622,087 -15,570,857
1996 15,766,827 31,448,636 -15,681,809
1997 14,771,155 27,907,108 -13,135,953
1998 12,237,587 16,840,409 -4,602,822
1999 15,862,448 24,141,990 -8,279,542
2000 20,466,016 31,827,943 -11,361,927
2001 16,505,766 26,633,372 -10,127,606
2002 15,143,183 29,856,228 -14,713,045
2003 17,276,138 36,313,091 -19,036,953
2004 21,701,337 46,144,463 -24,443,126
2005 24,027,439 48,403,183 -24,375,744
2006 26,534,016 51,926,292 -25,392,276
2007 26,370,193 56,250,126 -29,879,933
2008 28,252,471 60,956,391 -32,703,920
2009 21,770,839 49,427,515 -27,656,676
2010 28,176,281 64,296,117 -36,119,836
2011 39,679,706 68,320,171 -28,640,465
2012 38,796,057 64,363,080 -25,567,023
2013 34,662,290 60,029,355 -25,367,065
( Source: Bank of Korea , 2014 )
Ⅴ. The empirical results
1) the effects of trade in the United States and Japan
The United States and Japan in the international industry trade association analysis of impacts
due to the total amount of $ 11.3334 trillion, respectively. Looking specifically due to
intermediate goods trade between the two countries is $ 5,4 trillion total consumption, value
added amount of $ 5,8 trillion and $ 30.1 billion international middle income margin,
respectively. Trading in the table above, the U.S. and Japan are largely due to the mutual
benefit that can be reported. Each country in world trade between the U.S. and Japan are
among the most high.

15
Japan's Public Admin and Defence; Compulsory Social Security field has influenced the
amount of intermediate goods from 2,284 billion. The amount of the added value of industry
5115 billion. 7405 is the total amount of one hundred million U.S. dollars , Education is a $ 34.8
billion industry in the intermediate goods . $ 233.3 billion is the amount of value added . Which
totaled $ 268.2 billion , the U.S. and Japan due to the large trade sectors affected are as
follows: Sector is the largest Renting of M & Eq and Other Business Activities, Agriculture,
Hunting Forestry and Fishing, Electrical and Optical Equipment, Chemicals and Chemical
Products, and Financial Intermediation is .
2) Join TPP effect in Korea
If the economies of South Korea to join the TPP based on the current annual increase of about
1.7 % of GDP in 2025 is $ 40.3 billion more than expected to get the effect . $ 3,2 trillion, in
2030 is predicted to reach .
Korea in March 2014 based on the average tariff rate is 12.1% compared to Japan's industrial
almost close to 0% . In Japan, about the current duty-free items is 3640 . Japanese tariff rice
(778 %), dairy products ( 360% ), and sugar (328 %) and is not relevant as a greatly Korea . As
mentioned earlier, the TPP in Korea acceding one-day Korea FTA in nature and very similar to
what is being exported to Japan will not affect much . As before, the reason is that Japan has
almost no industrial tariffs , considered due . Japan's average tariff rate was 5.3 %, but the
majority of farmers . However, items imported from Korea to Japan to impose tariffs of machine
parts, auto parts and precision instruments based on such duties is missing is expected to
increase significantly .

16
< Table 6 > The United States and Japan resulting value of the input-output
analysis
Intercountry Input-OutputTable for 2011
40 countries, in current
prices
Public Admin and
Defence;
Compulsory Social
Security
Education Health and
Social Work
Other
Community,
Social and
Personal Services
Private
Households with
Employed Persons
TOTAL
(millions of
US$)
(industry-by-industry) JPN JPN JPN JPN JPN
(millions of US$) c31 c32 c33 c34 c35 49,337 Renting of M&Eq and Other Business
Activities USA c30 436 68 270 317 0 6,638
Agriculture, Hunting, Forestry and Fishing
USA c1 57 7 50 46 0 6,488 Electrical and Optical Equipment USA c14 215 5 218 58 0 5,927 Chemicals and Chemical Products USA c9 104 2 1,278 86 0 5,183
Financial Intermediation USA c28 82 7 80 169 0 3,470 Transport Equipment USA c15 624 1 3 3 0 3,032 Mining and Quarrying USA c2 4 1 4 2 0 2,694
Air Transport USA c25 110 75 81 225 0 2,603 Basic Metals and Fabricated Metal USA c12 20 0 11 8 0 2,478
Machinery, Nec USA c13 22 0 5 17 0 1,796 Pulp, Paper, Paper , Printing and
Publishing USA c7 62 10 31 127 0 1,676
Coke, Refined Petroleum and Nuclear Fuel
USA c8 91 14 89 56 0 1,580 Wholesale Trade and Commission
Trade, Except of Motor Vehicles and
Motorcycles
RoW c20 5 1 8 3 0 8,077
Retail Trade, Except of Motor Vehicles
and Motorcycles; Repair of Household
Goods
RoW c21 10 6 12 16 0 314
Hotels and Restaurants RoW c22 0 0 0 0 0 15 Inland Transport RoW c23 3 2 3 4 0 7,387 Water Transport RoW c24 0 0 0 0 0 5
Air Transport RoW c25 9 6 7 18 0 212 Other Supporting and Auxiliary
Transport Activities; Activities of Travel
Agencies
RoW c26 1 1 1 2 0 30
Post and Telecommunications RoW c27 11 2 5 9 0 177 Financial Intermediation RoW c28 120 21 47 150 0 3,206 Real Estate Activities RoW c29 3 0 1 3 0 73
Renting of M&Eq and Other Business
Activities RoW c30 135 30 111 125 0 2,513
Public Admin and Defence; Compulsory
Social Security RoW c31 3 1 4 12 0 70
Education RoW c32 0 0 0 0 0 11 Health and Social Work RoW c33 0 0 8 0 0 14
Other Community, Social and Personal
Services RoW c34 73 54 94 147 0 2,523
Private Households with Employed
Persons RoW c35 1 1 1 2 0 36
Total intermediate consumption TOT r60 228,441 34,834 204,762 196,997 0 5,437,197 taxes less subsidies on products
r99 0 0 0 0 0 0 Cif/ fob adjustments on exports
r61 0 0 0 0 0 0 Direct purchases abroad by residents
r62 0 0 0 0 0 0 Purchasesonthedomesticterritorybynon-
residents r63 0 0 0 0 0 0
Value added at basic prices r64 511,571 233,346 326,549 296,988 0 5,866,101
International Transport Margins 520 47 708 274 0 30,114
Output at basic prices r69 740,533 268,226 532,019 494,259 0 11,333,413

17
( Source: Intercountry Input-Output Table for 2011
< Table 7 > South Korea after joining TPP estimates of gross domestic product
Statistical
tables
Annual Index (2005 ,
1970 or later)
Increase in gross
domestic product
(GDP) grew
After joining TPP
Gross domestic
product ,
Assuming a 1.7%
increase
After joining TPP
Gross domestic
product ,
Increase of 2.1%
Gross domestic product
( billion, dollar sign )
Gross Domestic
Product
(billion , dollar sign)
Gross Domestic
Product
(billion, dollarign)
Gross Domestic
Product
(billion, dollar
sign)
2012 11,292.00 145.00
2013 12011.3004 719.30 2014 12776.42024 765.12 2015 13590.2782 813.86 13807.55401 13858.58303 2016 14455.97893 865.70 14687.0952 14741.37477 2017 15376.82478 920.85 15622.66316 15680.40034 2018 16356.32852 979.50 16617.8268 16679.24184 2019 17398.22665 1,041.90 17676.38237 17741.70955 2020 18506.49369 1,108.27 18802.36793 18871.85645 2021 19685.35733 1,178.86 20000.07877 20073.9937 2022 20939.3146 1,253.96 21274.08378 21352.7071 2023 22273.14894 1,333.83 22629.24292 22712.87454 2024 23691.94852 1,418.80 24070.72569 24159.68465 2025 25201.12565 1,509.18 25604.03092 25698.65656 2026 26806.43735 1,605.31 27235.00769 27335.66099 2027 28514.00741 1,707.57 28969.87768 29076.94259 2028 30330.34968 1,816.34 30815.25889 30929.14384 2030 32262.39295 1,932.04 32778.19088 32899.3303 2031 34317.50739 2,055.11 34866.16164 34995.01764 2032 36503.53261 2,186.03 37087.13614 37224.20026 2033 38828.80763 2,325.28 39449.58671 39595.38182
Source : Bank of Korea , and the author Edit
3) Japan's industry impact analysis
Japan 's position in Korea, to analyze the impact of trade from the metal sector to get $ 6.7
billion in the largest spillover effects. Maritime transport sector, followed by the impact of the
$ 5 billion to import a . Electrical and optical equipment 31 billion, 29 billion in the construction
industry, transportation equipment sector bringing an impact of $ 1.8 billion. This means that
the two countries jointly bring an impact of $ 41.5 billion.

18
< Table 10 > Japan’s industry impact analysis
40 countries, in current prices (industry
-by-
industry)
(millions
of US$) Basic Metals
and Fabricated
Metal
Water
Transport Coke,
Refined
Petroleum
and Nuclear
Fuel
Electrical
and Optical
Equipment
Wholesale Trade and
Commission Trade,
Except of Motor
Vehicles and
Motorcycles
KOR KOR KOR KOR KOR
c12 c24 c8 c14 c20 SUM Basic Metals and Fabricated Metal JPN c12 5,459 771 157 139 262 6,788
Water Transport JPN c24 2 4,771 251 1 10 5,035 Electrical and Optical Equipment JPN c14 768 78 59 2,000 203 3,108
Construction JPN c18 1,622 250 527 171 378 2,949 Transport Equipment JPN c15 875 248 73 482 198 1,875
Chemicals and Chemical Products JPN c9 75 179 1,368 9 114 1,744 Machinery, Nec JPN c13 753 66 35 428 143 1,425
Health and Social Work JPN c33 18 30 129 17 201 395 Renting of M&Eq and Other Business
Activities JPN c30 7 63 275 42 80 468
Electricity, Gas and Water Supply JPN c17 8 327 617 6 51 1,010 Food, Beverages and Tobacco JPN c3 154 128 160 7 298 746
Public Admin and Defence; Compulsory
Social Security JPN c31 46 56 447 64 101 714
Rubber and Plastics JPN c10 59 33 24 4 114 234 Wholesale Trade and Commission Trade,
Except of Motor Vehicles and
Motorcycles
JPN c20 35 48 369 26 83 561
Sale, Maintenance and Repair of Motor
Vehicles and Motorcycles; Retail Sale of
Fuel
JPN c19 116 29 20 189 87 442
Inland Transport JPN c23 3 126 535 6 19 690 Other Community, Social and Personal
Services JPN c34 25 50 267 25 77 444
Coke, Refined Petroleum and Nuclear
Fuel JPN c8 1 231 251 0 9 492
Agriculture, Hunting, Forestry and Fishing JPN c1 3 102 229 2 39 375
Hotels and Restaurants JPN c22 15 37 81 9 217 358 Pulp, Paper, Paper , Printing and
Publishing JPN c7 6 69 46 5 96 222
Other Non-Metallic Mineral JPN c11 47 121 121 2 34 326 Financial Intermediation JPN c28 1 25 50 15 21 112
Retail Trade, Except of Motor Vehicles
and Motorcycles; Repair of Household
Goods
JPN c21 8 20 182 8 23 241
Mining and Quarrying JPN c2 7 145 145 1 16 313 Air Transport JPN c25 0 8 172 1 2 183
Manufacturing, Nec; Recycling JPN c16 79 13 26 17 33 169
Wood and Products of Wood and Cork JPN c6 55 38 20 1 33 147
Post and Telecommunications JPN c27 1 12 25 16 9 63 Education JPN c32 0 12 72 3 11 99
Real Estate Activities JPN c29 3 7 40 3 5 58
Textiles and Textile Products JPN c4 2 6 22 1 25 54 Other Supporting and Auxiliary Transport
Activities; Activities of Travel Agencies JPN c26 16 8 10 3 12 48
Leather, Leather and Footwear JPN c5 1 1 2 0 5 9
Private Households with Employed
Persons JPN c35 0 0 0 0 0 0
Intercountry Input-Output Table for 2011

19
Ⅵ. Conclusion
International industry association analysis results due to trade between the United States
and Japan, results in the amount of $ 11.3334 trillion. Looking specifically due to intermediate
goods trade between the two countries is $ 5,4 trillion total consumption, value added amount
of $ 5.8 trillion and $ 30.1 billion international middle income margin, respectively. Trading in
the table above, the U.S. and Japan are largely due to the mutual benefit that can be reported.
In the middle of world trade, the trade between the United States and Japan is the most large.
Due to trade in the United States and Japan, most significantly affected sector is as follows.
Sector is the largest Renting of M & Eq and Other Business Activities, Agriculture, Hunting
Forestry and Fishing, Electrical and Optical Equipment, Chemicals and Chemical Products, and
Financial Intermediation is . If the U.S. and Japan joins the TPP Korea economic impact for the
current year based on each country 's GDP will increase about 1.7 to 2.1 percent . International
industry association analysis in the study after joining TPP Korea's most vulnerable areas of
mechanical, electrical, electronic , chemical , steel, metal , construction, and transportation
equipment , such as sector analysis. The conclusion is clear as much as South Korea, South
Korea’s TPP participation in company with competitive electronics, automotive , chemicals ,
iron and steel sector should be able to export more. In addition, Japan’s position in competition
with industry should be considered vulnerable, Korea's exports to stretch a little income or other
means of grace should foster and protect enterprise . A practical way of government is actively
involved in TPP negotiations and Korea should also join the TPP region as quickly as possible
because we official entry in the participating countries should be confirmed. As for the national
interest must be practical negotiations. TPP is to eliminate all tariffs in future high-intensity area
is block Convention. The results of this paper, the expansion of trade and join the TPP, as well
as South Korea, United States to all countries, including Japan, significant economic growth
(1.5 to 2.1%) showed the effect and impact of the effect. For this reason, the expansion of TPP
trade, including government preferred.

20
References
Kimdaejong (2012) of <Online shopping industry in the domestic economy, the ripple effect
analysis> The e-Business studies Volume 13, Number 3. Sempter
2012.pp30-317
Kim, Kwan - Ho (2007), 'Korea-US FTA negotiations in services, investment evaluation and
significance of the field'
Gwonseunghyeok (2011), "Japan's Pacific Economic Partnership Agreement (TPP) discuss the
situation and future prospects", International Economic-focus, 2011, the Bank
of Korea
Seonghangyeong (2014) "TPP in Korea, China, Japan and TTIP Economic Effects Dynamic
Effects," Proceedings of 2014 Conference of economic co-
Songuiyoung (2007), "Determinants of intra-industry trade: specialization is the difference
between the center and the element of endowment"
<International Economic Studies> first house No. 12,189-228
Songuiyoung, jeongim Bo (2008) "Trade and economic changes in the structure of the
synchronism" International Economic Studies Volume 14, Issue 2, 2008.
Yeohyeokjong (2013), "U.S. Trade Representative released a report in 2013 by Country Trade
Barriers"
Information and Communications Policy Studies No. 25 No. 9 No. 554 XIV 1598-4583
Ohsegyeong (2013), "Japan's participation in TPP declared Implications and
Prospects" KIEP 2013.4.11
Move, Hong Yuncheng (2013) of "Should Korea Join the TPP?: An Empirical Analysis of the
Trade Effect"
Yiheungbae (2014), "one day the FTA impact on the domestic parts industry in" one day,
Gyeongsang Institute .Proceedings of Joint Conference of Economics
Choenakgyun (2013) <trade-induced effects of employment and value-added analysis>
International Economic Studies, 2013.
Choenamseok (2013), "The future of manufacturing in Asia (Future of Factory in Asia)
Hanminjeong (2013) of the "South Korea's participation in TPP Study strategy: focusing on
electronic commerce"

21
Ann Capling (2012) “The TPP: Multilateralizing Regionalism or the Securitization of Trade
Policy?”, The Trans- Pacific Partnership, p.293.
Chinn, Menzi and Hiro (2006) "What Matters for Financial Development?" Capital Controls,
Institution, and Interactions", Jonurnal of Development Economics, 81,163-
192
Congressional research service(2013) “the trans pacific partnership negotiations and issues for
congress”
______________________, “japan’s possible entry into the trans- pacific and its
implations”2012.8
OECD(2011), OECD Economic Outlook.
Petri, zhai, Plummer(2011) Trans-Pacific Partnership And Pacific Integration
Wall Street Journal 2012,02,17 "TPP hiatus Pacific Economic Partnership Agreement", 1,6
surface
Intercountry Input-Output Table for 2011