analysis of the maintenance and depreciation costs and
TRANSCRIPT

For comments, suggestions or further inquiries please contact:
Philippine Institute for Development StudiesSurian sa mga Pag-aaral Pangkaunlaran ng Pilipinas
The PIDS Discussion Paper Seriesconstitutes studies that are preliminary andsubject to further revisions. They are be-ing circulated in a limited number of cop-ies only for purposes of soliciting com-ments and suggestions for further refine-ments. The studies under the Series areunedited and unreviewed.
The views and opinions expressedare those of the author(s) and do not neces-sarily reflect those of the Institute.
Not for quotation without permissionfrom the author(s) and the Institute.
The Research Information Staff, Philippine Institute for Development Studies5th Floor, NEDA sa Makati Building, 106 Amorsolo Street, Legaspi Village, Makati City, PhilippinesTel Nos: (63-2) 8942584 and 8935705; Fax No: (63-2) 8939589; E-mail: [email protected]
Or visit our website at http://www.pids.gov.ph
DISCUSSION PAPER SERIES NO. 2014-50
Analysis of the Maintenance andDepreciation Costs and other Requirements
of Selected Government Hospitals
Eduardo P. Banzon et al.
December 2014

1
ANALYSIS OF THE MAINTENANCE AND DEPRECIATION COSTS AND OTHER
REQUIREMENTS OF SELECTED GOVERNMENT HOSPITALS
Eduardo Banzon
(Principal Investigator)
Ma. Gerry Lyn Alcantara, Maria Alyana Diez, and Lorra Angelia Sayson
(Co-investigators)
2
Table of Contents
EXECUTIVE SUMMARY ................................................................................................................................. 3
INTRODUCTION, BACKGROUND AND OBJECTIVES ....................................................................................... 5
SUPPLY SIDE GAPS AND HEALTH SYSTEM RESPONSES ................................................................................. 6
BUDGETING PRACTICES ................................................................................................................................ 9
MAINTENANCE AND DEPRECIATION COSTS ............................................................................................... 17
DISCUSSION ................................................................................................................................................. 24
POLICY RECOMMENDATIONS ..................................................................................................................... 25
REFERENCES ................................................................................................................................................ 25
ANNEX 1: STANDARD BUDGET CYCLE ......................................................................................................... 29
ANNEX 2 BUDGET REFORMS ....................................................................................................................... 33
ANNEX 3: METHODS FOR CAPITAL BUDGETING AND CALCULATION OF MAINTENANCE AND
DEPRECIATION COSTS ................................................................................................................................ 34
Annex 4: SUMMARY RESULTS OF FOCUS GROUP DISCUSSION……….………………………………………………………42
Annex 5: INDIVIDUAL FINANCIAL REPORTS.............................……….……………………………………………………… 57

3
SECTION 0: Abstract
1. To a large extent, planning and budgeting are still carried out in an unsystematic, non-
strategic manner that goes against the thrust of current reforms. Historic budgeting proves
to be inadequate in responding to the real needs of hospitals, especially in terms of
maintaining its capital assets. The lack of clear guidelines and protocols on prioritization
and budget decisions render the process vulnerable to subjective influences.
2. DOH-managed and LGU hospitals lack the appropriate infrastructure that would support
effectiveness and efficiency in budgeting. Data and information are the lifeblood of an
effective planning and budgeting process. Poor data management – as manifested in
incomplete/outdated records and inventories, fragmented systems across offices, paper-
based forms that cannot be utilized, among others – is a distinct barrier to the
implementation of desired reforms. Budgeting for the maintenance of capital assets is
part and parcel of the entire budget process, and is inevitably affected by this gap in
infrastructure.
3. Majority of hospitals’ budgets is still allocated to personnel services, thus “crowding out”
spending or limiting the resources available for maintaining capital assets that are critical
for service delivery. The income retention policy addresses this concern, since it enables
hospitals to pool and mobilize resources more freely for the upkeep of supply. This
offsetting mechanism, however, is unavailable to LGU hospitals; this leads to more
constraints.
4. Hospitals did not report any method used in determining the budget allocation for the
maintenance cost of their buildings, equipment and other assets. A lump sum budget is
apportioned for the account, Maintenance and Other Operating Expenses (MOOE), where
the projected costs for repairs and maintenance are lodged, along with other expenses.
The reported expenditures for repairs and expenditures account to only 0.17% to 2.58%
of the MOOE. Comparing the reported figures to the calculated ideal estimates for
maintenance costs, they were far from the standard cost of maintenance.
5. All hospitals reported following the NGAS for the computation of the depreciation costs
using the straight-line method of calculation. It was noted that not all of the hospitals
reflected depreciation on their financial reports as it appears that the computations of
depreciation costs are for mere compliance to the COA rules and guidelines on
accounting. The failure to report the depreciation of capital assets poses difficulty in
capturing the accurate costing of hospital services.
6. All hospitals do not have guidelines on proper condemnation of capital assets. Though
the hospitals are well-aware of the protocol for handling of fully dilapidated assets, the

Hospital Maintenance and Depreciation Study Banzon E, Alcantara MGL, Diez MA, and Sayson LA. 2013
4
scarcity of resources compel them to continue utilizing these assets until the equipment
has reached its operational limit and/or a replacement arrives. Additional costs for its
maintenance are reflected in terms of servicing the damage of the asset beyond its useful
years and the replacement of the spare parts of the asset.
7. Beyond formulating the proper guidelines and protocols for budgeting and the
maintenance of capital assets which would include the adoption of a standard
maintenance cost of 5% of original value for hospital buildings and equipment and the
vigorous implementation of the New Government Accounting System (NGAS) straight
line depreciation method in calculating the costs of depreciation of property, plant, and
equipment; the following can be considered, a: the setting up of a Capital Investment
Fund; designing PPP arrangements for Hospital Equipment; shifting to an Output-based
payment of DOH and other government hospitals; and improving and enhancing Data
Management and Utilization.
KEYWORDS: Government Hospitals, DOH-managed hospitals, LGU-managed hospitals,
Depreciation costs, Maintenance and other Operating expenses, Capital assets, straight line depreciation,
capital investment fund, output-based payments

Hospital Maintenance and Depreciation Study Banzon E, Alcantara MGL, Diez MA, and Sayson LA. 2013
5
SECTION 1: Introduction, Background and Objectives
The Aquino Administration seeks to achieve Universal Health Care (UHC) or Kalusugan
Pangkalahatan (KP) for all Filipinos through the Aquino Health Agenda (AHA). This aims to
ensure that each and every Filipino shall receive affordable and quality health care by providing
adequate resources, such as health human resources, health facilities, and health financing. The
AHA envisions achieving KP through three strategic thrusts: financial risk protection,
enhancement of health facilities and services, and attainment of MDG-related goals. 1
Significant progress has been made in the area of financial risk protection. The coverage of
Filipinos under the National Health Insurance Program (NHIP) has been increasing over the
years, with the Philippine Health Insurance Corporation (PHIC) claiming coverage for
approximately 80-85% of the population in 2013. Moreover, the national government now fully
subsidizes the population that are classified as poor by the DSWD’s National Targeting
Household Survey (NHTS).
With the enrolment of the poor to the NHIP, much effort is needed to appropriately respond to
the increasing demand for health services. It is well recognized that in order to achieve UHC,
there must be an empowered demand side or an empowered pre-paid population demanding
health care services. Accordingly, the supply side or health care providers must have the
capability and capacity to deliver health care services deemed necessary by the demand side. A
balance must exist between supply and demand.
This paper attempts to support supply side interventions by providing information on the
appropriate capital management and investments in maintaining and upgrading equipment and
capital plant by analyzing the budgeting practices, maintenance and depreciation costs and
requirements of public hospitals. Specifically, the study shall:
1. Describe the budgeting practices in public hospitals,
2. Calculate the maintenance and depreciation costs of a sample of retained DOH and LGU-
owned hospitals,
3. Estimate the reasonable level of maintenance and depreciation budget of a sample of
retained DOH and LGU-owned hospitals, and
4. Provide evidence-based policy recommendations to the DOH.
1 Department of Health (2010), The Aquino Health Agenda: Achieving Universal Health Care for All Filipinos, Administrative Order No. 2010-0036. http://www.doh.gov.ph/sites/default/files/Aquino%20Health%20Agenda%20-%20Universal%20Health%20Care.pdf (accessed June 16, 2013).

Hospital Maintenance and Depreciation Study Banzon E, Alcantara MGL, Diez MA, and Sayson LA. 2013
6
The paper will first describe the context of existing supply side constraints and the responses
launched to address the said constraints (Section 2). The budgeting practices of both DOH-
managed and LGU hospitals are then presented qualitatively (Section 3). Quantitative results on
the maintenance and depreciation costs are presented in Section 4. Section 5 provides a summary
on the findings from Section 3 and 4. Drawing from these findings, policy recommendations are
provided in Section 6.

Hospital Maintenance and Depreciation Study Banzon E, Alcantara MGL, Diez MA, and Sayson LA. 2013
7
SECTION 2: Supply Side Gaps and Health System Responses
In 2013, the Department of Health (DOH) is one of the top 10 departments with the biggest
portions of the National Budget, with Php 54.18 billion.2 In the 2014 budget, the biggest
allocation increase approved by Pres. Aquino went to the DOH. It will receive an expected Php
87.1 billion, a 45.5% increase.3 This will mainly cover PHIC health insurance premiums for
indigent and poor families and augment resources for its Health Facilities Enhancement Program
(HFEP). In addition, the increased budget will mostly be allocated for “the preventive and
promotive” health aspect, while only a “small proportion will be for the curative.”4
Despite the additional resources at hand, the DOH has encountered difficulties in implementing
the HFEP.5 There have been significant delays in project completion, along with issues in the
equity and efficiency of fund allocation. The enhancement of health care facilities and services,
then, continues to lag behind.
According to the study of health sector reforms by Hererra and Roman6, though enrolment may
be considered a success, access to quality health care remains a challenge. Service delivery is
impaired by the lack of health care facilities and trained health care personnel. Geographic
disparity is observed with more inadequate access in rural areas due to the poor availability of
rural health units and other facilities. Over-all, there are only about 17,000 health centers, and
not even half of the country’s 42,000 barangays have health centers. With an ADB report7 noting
an outstanding shift in utilization from private to public hospitals; the increasing influx of
patients, especially of those belonging to the lowest quintiles of the population, had intensified
the need to improve the quality of health care in public facilities.
Public facilities and government hospitals that are expected to deliver necessary services,
especially to the poor, remain underfunded, incapable, and incapacitated to augment dilapidated
equipment and facilities. In addition to the lack of diagnostic tools and equipment, the supply of
2 Department of Budget and Management, “Budget ng Bayan,” http://www.budgetngbayan.com/, 2013, (accessed June 16, 2013). 3 M.L. Ubac, “Health, social welfare, public works get biggest budget hike,” Philippine Daily Inquirer, 2013, http://newsinfo.inquirer.net/444003/health-social-welfare-public-works-get-biggest-budget-hike, 13 July 2013, (accessed 8 September 2013). 4 “PHL spends less health care amid economic boom”, GMA News, 4 September 2013, (accessed 8 September 2013). 5 R. Lavado et al., Improvement of the Implementation Procedures and Management Systems for the Health Facilities Enhancement Grant of the DOH, PIDS Discussion Paper Series No. 2012-24, 2012. 6 M.E. Herrera and F. Roman, “Overview of Health Sector Reform in the Philippines and Possible Opportunities For Public-Private Partnerships”, Asian Institute of Management Working Paper No. 10-002, 2010. 7 Asian Development Bank, “Philippines: Critical development constraint (Country diagnostic studies), Manila, Philippines, 2007, cited in M.E. Herrera and F. Roman, “Overview of Health Sector Reform in the Philippines and Possible Opportunities For Public-Private Partnerships,” Asian Institute of Management Working Paper No. 10-002, 2010.

Hospital Maintenance and Depreciation Study Banzon E, Alcantara MGL, Diez MA, and Sayson LA. 2013
8
drugs and medicines is most often inadequate; thus, drugs and medicines account for the largest
percentage of patients’ out-of-pocket expenditures. These issues of persistent underfunding and
inadequate supply of public facilities and government hospitals have been frequently cited in
literature.8 Lavado et al9 attributes the perceived undersupply to the overburdening of tertiary and
specialty hospitals brought about by the failure of gatekeeping mechanisms to filter simple cases
that ought to be treated in primary or secondary facilities. In terms of the management of DOH-
managed hospitals, much improvement is needed in planning, budgeting, and the systematic
allocation of funds for hospitals.
The largest component of hospital budgets goes to the remuneration and compensation of
hospital personnel. In 2008, personnel services accounted for an average of three-fifths of the
budget. There has been a steady decline in the share of Maintenance and Other Operating
Expenditures (MOOE) in the hospital budget. From 2000 to 2008, MOOE declined by as much
as 52 percent in real terms. Capital Outlay (CO) had been zero from 2001 to 2006, partly due to
the fiscal crisis and the austerity measures imposed during this time. CO was only distributed to
all hospitals in 2007 but such distribution was scaled back in 2008 with only 13 hospitals
receiving CO appropriations.10
To achieve the goal of improving health care facilities, assets, and equipment, changes in this
current resource allocation scheme are indeed necessary.
Initiatives Responding To Supply Side Gaps
The Aquino administration has responded to supply side gaps primarily by increasing the budget
allocated for the enhancement of health care facilities and robustly encouraging public-private
partnerships (PPP).
The Health Facility Enhancement Program (HFEP), managed by the DOH-National Center
for Health Facility Development (NCHFD), aims to provide resources for the construction,
upgrading, and enhancement of rural/city health units, barangay health centers and hospitals. It
also provides training to health professionals to improve the access of people to quality health
care.
The HFEP was allotted Php10 million for CO in 2007 with the budget increasing to Php7 billion
in 2011. Budget for MOOE remained constant at Php27.5 million. In 2013, HFEP proposals for
8 M.E. Herrera and F. Roman, “Overview of Health Sector Reform in the Philippines and Possible Opportunities For Public-Private Partnerships”, Asian Institute of Management Working Paper No. 10-002, 2010; R. Lavado et al., Improvement of the Implementation Procedures and Management Systems for the Health Facilities Enhancement Grant of the DOH, PIDS Discussion Paper Series No. 2012-24, 2012. 9 R. Lavado et al., How are Government Hospitals Performing? A Study of Resource Management in Government-Retained Hospitals, PIDS Discussion Paper Series No. 2010-02, 2010. 10 Ibid.

Hospital Maintenance and Depreciation Study Banzon E, Alcantara MGL, Diez MA, and Sayson LA. 2013
9
infrastructure projects amount to Php10.9 billion, while total proposals for equipment is at
Php10.2 billion. DOH would like to prioritize projects which directly contribute to the following:
1. attainment of MDGs, 2. Construction and enhancement of health facilities affected by
disasters, and 3. Implementation of government anti-poverty programs. In addition, PPP is highly
encouraged as a strategy to improve health facilities and medical/laboratory equipment.
The Public-Private Partnership (PPP) Program is one of the key strategies identified by the
Aquino administration to achieve inclusive growth through infrastructure and development
projects. PPPs are innovative, long-term contractual arrangements introducing private sector
funds and expertise in areas that are normally the responsibility of the government. PPPs, if
executed appropriately and efficiently, can help the government overcome the challenges they
are currently facing in the health sector. This is especially relevant in the enhancement and
modernization of facilities that is needed to ensure that services are of the highest quality and at
par with global standards.
In 2012, Philippine Health Insurance Corporation launched the Global Budget Payment
Program (GBPP) and opened its call for application from hospitals. The GBPP aims to aid
hospitals to be fully equipped in delivering quality health care to PhilHealth members by giving
the hospital management the autonomy to leverage and allocate PhilHealth revenues to areas that
need the most funding, such as pharmaceutical demands of patients, upgrading of equipment and
diagnostic tools, and renovation of infrastructure.
Despite these efforts, difficulties in the implementation of these reforms continue to challenge
their supposed impact in enhancing and upgrading the capacity and capability of the supply side.
For one, the HFEP-funded central procurement of certain equipment is faced by an unfortunate
mismatch between the equipment delivered and the capability of the facility to operate, sustain,
and maximize the downloaded equipment. The GBPP of PhilHealth, which may be used to fund
capital outlay, is in moratorium. PPPs studies and researches are outdated and may not fully
guide the design of PPP models that can fully address the current needs of the public sector. The
absence of a specific fund allocation for capital outlay despite the continuous increase of
budgetary resources further poses difficulties.
SECTION 3: Budgeting Practices
3.1. General Fund Management and Budgeting in Public Hospitals
Budgeting, specifically in terms of healthcare, involves allocating a fixed amount of funds for
services such as medical and hospital services with corresponding unit costs for a period that is
agreed upon.11
11 J. Fritze, “Is Healthcare Budgeting Ethically Justifiable?” The European Journal of Health Economics 1(2): 26-30,
2010.

Hospital Maintenance and Depreciation Study Banzon E, Alcantara MGL, Diez MA, and Sayson LA. 2013
10
In the Philippines, public hospitals are classified as DOH-managed and LGU-managed hospitals
based on their structure of sourcing funds and management as a function of the decentralization
of health services to local government units (LGUs). The Department of Health (DOH) currently
funds and manages DOH-managed hospitals across the country. Based on the General
Appropriations Act (GAA), appropriations are released directly to DOH-managed hospitals, and
are augmented by sub-allotments from the DOH Central Office, hospital revenues or net income
from PhilHealth reimbursements and user fees, releases from the Priority Development
Assistance Fund (PDAF) and other special purpose funds.12
On the other hand, LGU-managed hospitals are funded and managed at the provincial and
city/municipal levels by their respective local chief executives, as mandated by the Local
Government Code of 1991.13 Funds for LGU-managed hospitals are sourced from the internal
revenue allotment (IRA) and from the provinces’ and municipalities’ funds and net income. They
also receive transfers from the DOH and PhilHealth in forms of cash, hospital reimbursements
and capitation funds.14
The income retention policy is deemed critical for the upkeep of hospital infrastructure and
equipment. Since 2003, DOH-managed hospitals have been allowed to retain their income – at
least 25 percent of which should be allocated to the purchase and upgrade of hospital equipment
used directly in service delivery, while 75 percent may be used to augment MOOE and capital
outlay for other infrastructure and equipment. No such policy for income retention, however,
holds for LGU-managed hospitals. While some LGUs have created special funds/trust funds that
allowed their hospitals to retain income, most still pool hospitals’ revenues in a general fund
without any guarantee that the money will be plowed back into the contributing hospitals.15,16
3.2. The Budget Process and Reforms
Budgeting in DOH-managed hospitals follows a bottom-up approach and begins with budget
preparation. Lavado et al17 lays out the process of budget planning as follows:
The planning cycle usually starts with the DBM budget call in May where DBM sets the
ceiling for MOOE of each hospital. The Executive Committee of each hospital will
12 R. Lavado et al., How are Government Hospitals Performing? A Study of Resource Management in Government-
Retained Hospitals, PIDS Discussion Paper Series No. 2010-02, 2010. 13 Herrera and Roman, 2010. 14 R. Lavado et al. “Local Health Accounts: Understanding the Sources and Uses of Funds in Delivering Local Health
Services in a Devolved Setting” http://www.nscb.gov.ph/ncs/11thNCS/papers/invited%20papers/ips-10/03_Local%20Health%20Accounts%20Understanding%20the%20Sources%20and%20Uses%20of%20Funds%20in%20Delivering%20Local%20Health%20Services%20in%20a%20Devolved%20Setting.pdf. Accessed 15 June 2013.
15Herrera and Roman, 2010. 16 [13] 17 [13], p.25.

Hospital Maintenance and Depreciation Study Banzon E, Alcantara MGL, Diez MA, and Sayson LA. 2013
11
conduct a budget preparation workshop where each department will present an outline
of all their needs. Based on the budget ceiling and projected income, the Executive
Committee will allocate the budget based on the priorities of the department. Planning
for each line item is usually based on historical data.
As in other government agencies, this process follows the budget cycle laid out by the
Department of Budget and Management (DBM) (see Annex 1). This cycle commences with the
budget preparation phase, wherein most of the planning and technical review takes place prior to
deliberation in Congress and Senate during the budget legislation phase. Upon release, budgets
are then executed and audited.
With the stronger and deeper commitment to the Aquino Social Contract and the rising efforts
towards speeding up the completion of priority PPAs indicated in their Key Results Area (KRA);
different government agencies have committed to ensure that the National Budget is enacted on
time, reflective of the needs of the society including grassroots communities, and utilized
transparently and efficiently by accountable agencies. Many reforms18 (see Annex 2) in terms of
practices and approaches have been espoused towards greater budget effectiveness and
efficiency.
Existing Budgeting Practices of LGU-Managed and DOH-managed Hospitals
Despite ongoing reforms, much effort is still needed to ensure that budgeting reforms are
institutionalized and properly executed in all agencies. It is seemingly evident that these reforms
are not yet being well implemented at the level of LGU and DOH-managed hospitals. Contrary
to new approaches, old practices persist owing to scarcities in data and capacity, and political
realities that serve as barriers toward shifting to recommended approaches. This section
documents existing budget practices of LGU and DOH-managed hospitals in terms of
general/hospital-specific processes, influences, and handling of resources for capital assets.
LGU-Managed Hospitals
LGU Hospitals 1, 2 and 3
General Process
Hospitals 1, 2 and 3 are located in a single province and receive their budget from the
provincial pool of resources. The local chief executive (LCE) issues a budget call which
requires all departments under the LGU, including the hospitals, to submit their budget
proposals. The hospitals use their previously approved budgets and annual procurement
18 Department of Budget and Management, National Budget Memorandum No. 115, 2012, pp 3 – 5.

Hospital Maintenance and Depreciation Study Banzon E, Alcantara MGL, Diez MA, and Sayson LA. 2013
12
plan as primary bases for their proposals. This is consistent with the usual practice of LGU-
managed hospitals to use historic budgeting practices wherein data inputs are based on the
current performance and functions of the hospitals.
After the submission of the budget proposals, a budget hearing is conducted to determine
priorities and general limitations of the province. The budget proposals are then
consolidated to become the Local Expenditure Program. The Budget of Expenditure and
Sources of Funding document is then prepared, which identifies the sources of funding for
the priority programs, projects and activities (PPAs). At this stage, it is subject to the
approval of the Governor and then submitted to the Sangguniang Panlalawigan for further
review. When the executive budget of the province is approved by the Sangguniang
Panlalawigan, it is submitted to the Commission of Audit for another review. After
approval from COA and the subsequent release of funds, the budget is now ready for
execution.
The province is guided by the Budget Operations Manual of 2008 and other DBM and COA
issuances. The provincial budget office (PBO) asserted that they have been following the
standards except for the prescribed ‘Participation of Civil Society Organizations’ where
they deliberately miss out inviting CSOs in the course of their budget preparation and
planning.
The budgeting of the province is ISO-certified; therefore, it follows a streamlined process.
Records on hospital equipment and facilities are managed at the provincial level, the
General Services Office- another ISO-certified office.
Influences on the Budget
The province have a local finance committee (LFC) composed of the following: 1) Provincial
Budget Officer, 2) Provincial Planning and Development Officer, 3) Provincial Treasurer,
4) Provincial Accountant, and the 5) Provincial Administrator. The LFC determines the
budget based on the estimated income of the LGU. The proposed budget in the Annual
Investment Plan may nonetheless be higher than this estimated income, as supplemental
budgets are an alternative source of funds.
Performance-based budgeting is also used among these LGU-managed hospitals and
departments for the determination of the budget allocation. The achievements across PPAs
are continuously reviewed. If budget inadequacy is seen to be a constraint that hampers
performance, more resources may be channeled to the priority PPAs.
Salaries and wages of the personnel and other automatic appropriations are always tagged
as priority for budget allocation. The remaining budget is apportioned to the recurring
expenses and other operating costs.

Hospital Maintenance and Depreciation Study Banzon E, Alcantara MGL, Diez MA, and Sayson LA. 2013
13
Resource allocation is also largely based on the identified priority PPAs of the province.
This is another indicator that illustrates how developments in health and other aspects are
largely driven or arrested by the existing political will of LCEs.
These LGU-managed hospitals may also derive their funding from the Development Fund.
The development fund is 20% of the Internal Revenue Allotment for the LGU, where a
joint DILG-DBM circular indicates the prescribed fund utilization. This, however, does not
flow directly to the local health sector. Again, the decision whether to use this to supplement
funds for health depends on the LCE. To augment their funds, the LGU also gets sub-
allotments from other agencies in the form of trust funds for specific purposes.
The hospitals have autonomy over the use of the approved budget; however, all income
must be remitted to the provincial government. There is difficulty in asking for an increase
in the budget since target collection, determined by the LFC, is usually unmet.
On Budgeting for Capital Assets
Since budgeting and procurement for these LGU-managed hospitals are done centrally at
the level of the LGU, the deprecation costs of the equipment and facilities are computed at
the provincial accounting office. A lump sum budget is given to the hospitals for repair and
maintenance costs. Arbitrary data are used to determine the amount of budget to be
allocated for repair and maintenance. If a needed equipment or facility must be repaired
and the lump sum budget has been depleted, the hospitals will write a justification letter
addressed to the governor, asking for supplemental budget. There is no specific budget or
percentage allocated for capital outlay. Capital outlay and infrastructure are funded as the
need arises. The approach is largely reactive.
Since hospitals employ historic budgeting approach and a budget ceiling is imposed, actual
and prospective needs are not being met. Hospital administration perceives bottlenecks in
requesting for supplemental budget, equipment and other necessary materials because
budgeting and procurement are centralized at the provincial level and not at the hospital
level.
LGU hospital 4
General Process
LGU Hospital 4 is the first corporatized LGU hospital that is said to be the most modern
provincial hospital in the North. As a corporate hospital, its Medical Chief serves as the
Chief Executive Officer and is guided by a Board of Trustees (BOT) headed by the
governor himself.

Hospital Maintenance and Depreciation Study Banzon E, Alcantara MGL, Diez MA, and Sayson LA. 2013
14
Being an LGU hospital, the budget approval and procurement are centralized at the LGU.
Though the hospital utilizes historic budgeting, budget proposals are guided by routinely
collected data. Generally, all cost centers are asked to support their proposed budget
allocation by their rate of utilization and projected income. Specific for drugs and
medicines, to capture a more precise estimate, a therapeutic committee gathers and
evaluates data on the usage of drugs and medicines, including administering surveys on the
most prescribed drugs and medicines.
When a budget call is issued at the level of the LGU, divisions prepare their Program
Procurement Management Plan (PPMP). With the Administrative Officer as lead, the
PPMPs are collated into an Annual Procurement Plan (APP). Adjustments are made in the
APP based on the perceived priorities of the hospital. The APP serving as the budget
proposal is submitted to the LGU. The Medical Chief and CEO attends the technical
hearing along with the other offices/cost centers of the province.
Influences and Budgeting for Capital Assets
Hospitals always work under their budget ceilings.
The hospital asserted that the LGU is quick to respond to the urgent needs of the hospital,
including the requests for supplemental budget and additional equipment. This is attributed
to the governor being accountable to the quality of health services rendered to the
constituents of the province as he also serves as the head of the BOT of the hospital. Having
the governor as the head of the BOT of the hospital is said to stabilize any shift in priority
that may be caused by changes in political leadership.
DOH-managed Hospitals
Sources of Funds
The two selected DOH-managed hospitals acquire funds from multiple sources, such as the
General Appropriations Act (GAA), hospital income, and other sources. The hospitals have
autonomy over their earned income, which largely comprises the hospital’s budget. Unlike
hospitals in the LGU, wherein revenues are remitted back to the local treasury, the DOH-
managed hospitals can retain their income and utilize it to augment their budget for
operations, infrastructure, equipment, and capital outlay (CO). A provision in the GAA
states that 25% from the income retention should be allotted to the equipment and the
remaining income shall be used for other purposes.
General Process
The Department of Budget and Management (DBM) issues a budget call where all
departments, including the hospitals, are required to submit their budget proposals.

Hospital Maintenance and Depreciation Study Banzon E, Alcantara MGL, Diez MA, and Sayson LA. 2013
15
The hospitals submit their Annual Operational Plan (AOP) from the consolidated
Operational Budget Plan (OBP) of each hospital department. These plans contain the
individual needs and priorities, which are summarized by the hospital budget officer. The
new budget proposal is based on historical budgeting and plays around the same amount as
the previous budget, which depends on the budget ceiling set by the DBM.
Two types of proposals are prepared – within the budget ceiling and above the budget
ceiling. Above the ceiling proposals are deliberated in the executive committee level then to
the finance section. After which, it will be further deliberated in the Health Policy
Development Program (HPDP) and lastly, to the DBM. From the DBM, the same
procedure/cycle is followed along with other agencies.
Influences on the Budget
Hospitals always work under their budget ceilings.
Examples of factors that lead to the inconsistencies in budgeting are sudden disease
outbreaks and unanticipated damages to capital assets, which prove to be a weakness when
employing historical budgeting. Such occurrences necessitate budget realignment.
Realignment is only possible across the same type of expenses (e.g. MOOE to MOOE).
Inputs for budgeting include the Work and Financial Plan for the budget preparation and
the Operational Plan for the budget utilization. Most hospitals have a Five-Year
Development Plan. The scope of this plan covers the purchasing, maintenance, and
depreciation of equipment, though some equipment included in the list are not purchased
due to scarce resources. The prioritization is based on the immediate need of the equipment.
The budget proposals are collected and are brought to the Planning Office of the
Department of Health (DOH). These proposals are then presented to the DBM. Based on
the financial parameter, DBM sets a budget ceiling. The AOP is prepared based on the
Five-Year Development Plan.
The DOH-managed hospitals, along with other agencies, already follow a performance-
informed budgeting to determine the allocation of budget based from the circular, DBM
National Budget Memorandum No. 117.
Bulk of the budget goes to the mandatory obligations of the hospitals such as the
compensation of the employees and workers.
On Budgeting for Capital Assets
The Health Facilities Enhancement Program (HFEP) provides assistance to both LGU and
DOH-managed hospitals. Since the GAA budget alone is inadequate to meet the needs of
hospitals, their strategy in maximizing available resources is to allot most of their GAA
budget for MOOE and tap the HFEP fund for capital outlay. It should be noted that the

Hospital Maintenance and Depreciation Study Banzon E, Alcantara MGL, Diez MA, and Sayson LA. 2013
16
HFEP benefits are more tangible to LGU-managed hospitals given that they cannot retain
their income, and are therefore in need of more funds.
The computation of maintenance and depreciation costs is done at the hospital level. The
accounting office handles the computation of the depreciation cost, which is reflected in the
financial statement prepared by the accountant. Some equipment that are fully depreciated
are still utilized and maintained. This often results to higher maintenance costs for already
dilapidated equipment.
As mentioned above, allotment for capital outlay should be at least 25% of the budget. This
is not strictly followed as resources are limited and funds are allotted to more immediate
needs such as the MOOE. On the other hand, the computation of the maintenance cost is
handled by a number of departments including the maintenance department or other
related department up to the budget office. Financial reports are used to determine the
amount of budget for the repair and maintenance of capital assets.
Records on hospital equipment and facilities are managed in the supplies office or related
office, as it is different for each hospital. Overall, the system of the DOH-managed hospitals
is more organized and systematic since they are monitored by the DOH.
Hospital-Specific Findings
DOH-managed hospital 1 follows the required budgetary requirements and timeline
prescribed by the DBM with minor deviations in terms of the presentation of the budget
proposal, wherein they add items that are not listed in the DBM prototype form. The Work
and Financial Plan and Operational Plan serve as supporting inputs in formulating the
PPMP. In terms of data management, the inventory of assets and equipment maintained
and updated by the supply office often does not match the list of assets and equipment of the
accounting office. A difficulty perceived by the hospital lies in their personnel services (i.e.
limited number of employees and job mismatch).
In DOH-managed hospital 2, the Bids and Awards Committee (BAC) consolidates the
submitted plans, with the Budget Office acting as the oversight body. The two bodies review
and edit the proposed department budget based on the General Appropriation Act (GAA)
and the hospital income. The collated PPMPs from the departments form the Annual
Operational Plan (AOP) of the hospital which is further subjected to revisions depending on
the budget ceiling allocated by the general appropriation. From the GAA, the fund for the
personnel services has the largest appropriation while a smaller percentage is allotted to the
Maintenance and Other Operating Expenses (MOOE). For this matter, hospitals are
considered self-sustaining.
The billing system in the DOH-managed hospital 2 is socialized and increases the subsidy to
patients. For example, the bill of patients classified as charity patients can still be further
reduced depending on the reduction imposed by the government counterparts. DOH-
managed hospital 2 takes initiative in enrolling these patients for PhilHealth benefits. DOH-

Hospital Maintenance and Depreciation Study Banzon E, Alcantara MGL, Diez MA, and Sayson LA. 2013
17
managed hospital 2 receives a substantial allotment from the Priority Development
Assistance Fund (PDAF), thus increasing support for indigent patients.
Though it is a DOH-managed hospital, it does not use the DOH standard form or template
in preparing hospital statistical reports.
All the selected government hospitals reported the use of historic budgeting where budget ceiling
persisted to be largely influential to budget preparation and planning. At the level of the
hospitals, budget preparation and planning are the most critical stages of the budget cycle that are
highly steered and influenced by the hospital administration. However, due to poor data
management and data utilization, arbitrary data are used to guide these important stages. In
budgeting, expenses for salaries and wages of the personnel services (PS) are given the utmost
priority. Based on the budget ceiling, the remaining amount is allocated for other operational
expenses (MOOE) of the hospitals. Due to the income retention policy, DOH-managed hospitals
are given the flexibility to use a fourth of their income to fund capital investment. However, it is
claimed that the GAA is not sufficient for the PS and MOOE, so the allowed 25% of income is
almost never spent for capital outlay. In both types of hospitals, capital outlay is not a permanent
line item in the budget plan of hospitals and is funded on a “need-basis” criterion where no
system is in place to objectively determine the authenticity and urgency of the needed capital
asset. This subjects the funding for capital outlay to political whims as in the case of most LGU-
managed hospitals.
The selected government hospitals reported their compliance on the standards set by the
oversight agencies in relation to budgeting practices, such as the budget cycle and schedule,
documentary requirements and prescribed methods. These provisions were successful in
standardizing the administrative aspect of budgeting, but sorely failed to address the technical
facets necessary to ensure effective and efficient budget planning and execution. For LGU-
managed hospitals the prescribed budget allocation are almost never met in terms of percentage
of the IRA allotted for health.
SECTION 4: Maintenance and Depreciation Costs
Maintenance and Depreciation Costs
Based on the categorization of capital assets by COA, maintenance and depreciation costs were
divided into three types: 1) Building and Physical Plant (includes Office Building, Hospital and
Health Center, Other Structures), 2) Equipment and Instruments (includes specific equipment
under Office, Equipment, Furniture and Fixtures; Machineries and Equipment; and
Transportation Equipment), and 3) Other Property, Plant and Equipment. The cost categories
were determined through the budget allocation, budget utilization, and cost estimate of capital
assets.

Hospital Maintenance and Depreciation Study Banzon E, Alcantara MGL, Diez MA, and Sayson LA. 2013
18
Maintenance Cost
The selected hospitals did not report any method used in determining the budget allocation for
the maintenance cost of their buildings, equipment and other assets. A lump sum budget is
apportioned for the account, Maintenance and Other Operating Expenses (MOOE), where the
projected costs for repairs and maintenance are lodged, along with the following: travelling
expenses, supplies and materials expenses, utility expenses, communication expenses, among
others. As the main budgeting method of the hospitals is historic budgeting, the projection of the
MOOE budget is based on the previous budgets.
The Commission on Audit (COA) does not have a prescribed method on the calculation of
maintenance cost, and neither do the Department of Budget and Management (DBM) and most
accounting books. This paper made use of the definition of maintenance cost in the text,
“Costing of Health Care Services in Developing Countries: A Prerequisite for Affordability
Sustainability and Efficiency” written by Flessa (2009) which prescribed a standard maintenance
cost of 5% of original value for hospital buildings and equipment. This is used as a benchmark to
compute for the ideal maintenance cost and is represented as cost estimate.
Computation:
Budget Allocation= Total amount allotted for the repair and maintenance of the assets
as reported by the hospital**
Cost Estimate= ∑ (acquisition cost of asset1 + acquisition cost of asset2 +……. +
acquisition cost of assetn) x 0.05
Budget Utilization= Total expenses incurred in repairing and maintaining the assets
as reported by the hospital**
**Data collected through the hospital survey.

Hospital Maintenance and Depreciation Study Banzon E, Alcantara MGL, Diez MA, and Sayson LA. 2013
19
Table 1. Estimation of the Maintenance Cost
Trend: Hospitals are spending less than the ideal maintenance cost and their allocated budget for repairs and maintenance.
a. LGU hospital 5
This LGU hospital received a total of PhP 28,462,598.00 from the Internal Revenue
Allotment (IRA) of FY 2012. Ninety-percent of which (PhP 25,600,000) was allocated to
Maintenance and Operating Expenses (MOOE), while the remaining 10% (PhP
2,862,598.00) went to Personnel Services (PS). However, no budget was allocated to the
specific line items on the repair and maintenance of hospital building, equipment and other
instruments. Using the cost estimates as benchmark for what must have been allocated and
spent for maintenance, equipment and instruments must have been allotted with PhP
130,282.50. Cost estimate for the maintenance of the building and infrastructure was not
able to be computed as the needed data on their floor areas and costs were unavailable.
Based on the reported annual financial report, the percent distribution of MOOE and PS in
terms of actual expenditures was the same with the allocated budget, 90% for MOOE (Php
5 2 3 6 4 1 1 2
Cost Estimate NDA NDA NDA NDA NDA NDA NDA NDA
Total Utilized
Budget
0 7,000.00 5.600.00 960,000.00 104,599.64 1,940,555.00 491,526.60 1,029,238.40
Percent
Utilized in
Budget
Allocation
0% 29% NDA NDA NDA NDA NDA 40.94%
Percent
Utilized in
MOOE
0% 0.52% NDA 2.58% 0.17% 1.57%% 1.41% 1.00%
0
Other Repair And Maintenance
Budget
Allocation
0 0 0 0Budget
Utilization
0 0 NDA
0 0 5600 NDA NDA
Budget
Allocation
Budget
Utilization
Budget
Allocation
Budget
Utilization
Cost Estimate
NDA NDA 0
310,060.20 535,965.90
130,282.50 13,190.55 33,741.08 5,124,488.45 NDA 1,840,112.04 NDA 14,506,085.45
NDA 7,000.00 NDA 630,000.00 104,599.64 427,425.50
0 24,000.00 0 NDA NDA NDA
0 0 NDA 150,000.00 0 1,513,129.50
NDA NDA NDA
NDA 1,619,931.35
894,266.80
181,466.35
NDA
Building and Physical Plant
Equipment and Instruments
493,272.50
Cost Category LGU-Managed Hospitals DOH-Retained
0 0 0

Hospital Maintenance and Depreciation Study Banzon E, Alcantara MGL, Diez MA, and Sayson LA. 2013
20
24,209,589.51) and 10% for PS (Php 2,706,327.4). Their budget utilized in 2012 was only
94% of the total allocation (Php 26,915,917). Aside from IRA, no other sources of revenue
were reported in the Annual Financial Report.
b. LGU hospital 2
In this LGU hospital, a total of Php 9,270,782.00 was budgeted from the IRA for PS and
MOOE. Based on data collected, a higher budget was allocated to PS (73%, Php
6,741,692.00) than to MOOE (27%, Php 2,529,100.00). However, there were noted
variations between the budget allocation and actual expenditures. Overall, 82% of the
allocated budget was consumed, with only 53% MOOE budget utilization. Aside from the
IRA, LGU HOSPITAL 2 gained PhP 997,262.93 from PhilHealth Reimbursements and PhP
1,741,545.65 from hospital business income. The allocated and disbursed budget for the
specific line items on repair and maintenance is a far cry from the estimated ideal cost. No
budget was allocated and spent for the maintenance of buildings and infrastructure. No cost
estimate was computed for the maintenance of the building and infrastructure as no data on
the acquisition costs and floor areas were retrieved.
c. LGU hospital 3
This LGU hospital only reported their budget allocation for FY 2012 and failed to indicate
their actual expenditures. According to the retrieved data, Php 13,150,312.24 was allocated
to PS and MOOE, where IRA was the primary source of budget. Of this allocated budget,
81% was for PS and 19% was for MOOE. No allocation was made for specific line items on
the repairs and maintenance of buildings, infrastructure, equipment and instruments. A
meager 0.23% of the total MOOE was allotted for the unspecified other repairs and
maintenance. Cost estimate for the maintenance of equipment and instruments remains
incredibly higher than the allocated resources. No cost estimate was computed for the
maintenance of the building and infrastructure as no data on the acquisition costs and
purchase years were retrieved. LGU Hospital 3 reported an amount of PhP 2,449,344.70 as
hospital income from hospital fees.
d. LGU hospital 6
Only the actual expenditures of this LGU hospital were reflected in their financial report for
FY 2012. A total of PhP 113,107,201.57 was utilized for the hospital operations, where 67%
and 33% of the cost were spent for PS and MOOE respectively. Repairs and maintenance
costs for the buildings and infrastructure were at 0.4% of the MOOE, while repairs and
maintenance of the equipment and instruments were 1.69% of the MOOE. The actual
amount spent for the repairs and maintenance of the equipment and instruments was barely
12% of the estimated ideal maintenance cost. No cost estimate was computed for the
maintenance of the building and infrastructure as no data on the acquisition costs, floor
areas and purchase years were retrieved.

Hospital Maintenance and Depreciation Study Banzon E, Alcantara MGL, Diez MA, and Sayson LA. 2013
21
e. LGU hospital 4
This LGU hospital did not report its budget allocation. Cost estimate for the maintenance of
equipment and instrument is nine times higher than the actual reported budget utilization.
f. LGU hospital 1
This LGU hospital did not report their budget allocation for FY 2012 but provided its actual
expenditures amounting to PhP 275,408,613.23. Cost estimate for the maintenance of
building and infrastructure was not calculated due to the unavailability of data hence, budget
utilization on the repairs and maintenance of the buildings and infrastructure was not
benchmarked. Budget utilization on the repairs and maintenance for the equipment and
instruments was just around 23% of the calculated ideal maintenance cost. Only 1.57% of
the total MOOE was allotted for repairs and maintenance.
g. DOH-managed hospital 1
No cost estimates can be made for the maintenance of building and physical plant and the
equipment and instruments of the hospital because the data is not available and/or outdated
and fragmented.
h. DOH-managed hospital 2
DOH-managed hospital 2 budgeted for the maintenance and repair of its assets; however,
the budget allocated was not fully utilized. This is despite the fact that both the allocated and
reported utilized budget were in no way near the projected cost estimate for the maintenance
of equipment and instruments.
As shown in Table 1, generally, hospitals have a very low budget utilization or actual
expenditure for repairs and maintenance, in which some hospitals even reported to have not
spent anything at all for their maintenance. As a component of MOOE, the reported expenditures
account to barely anything of the MOOE having only 0.17% to 2.58% of the budget utilized for
repairs and maintenance. Comparing the reported figures to the calculated cost estimates, they
were in no way near the standard cost of maintenance. In fact, the smallest difference between
the actual and the estimate is seen in the case of the maintenance cost of the equipment and
instruments of LGU hospital 5, where actual expenditure is around 50% of the standard cost.
Budget allocation and actual expenditures on repair and maintenance are found unequal, where
allocation is usually higher than the budget utilized. If in case, budget was allocated for
maintenance, it remains not fully utilized by the hospitals. To further the point, some of the
hospitals with data available, used less than 50% of their allotted budget for repair and
maintenance.

Hospital Maintenance and Depreciation Study Banzon E, Alcantara MGL, Diez MA, and Sayson LA. 2013
22
Seeing the actual figures of hospital expenditures on repair and maintenance, it can be construed
that the selected hospitals do not have maintenance programs specific to their assets, especially
the heavy equipment. This is supported by the results of the FGDs conducted with the hospitals.
Preventive and corrective maintenance are included in the procurement of new equipment.
Problem lies after the warranty period where the supplier is no longer accountable to the
maintenance of the equipment.
Depreciation Cost
Adopting the New Government Accounting System (NGAS) implemented by the Commission
on Audit (COA) for national government agencies and local government units, the straight line
depreciation method was used in calculating the costs of depreciation of property, plant, and
equipment (see Annex 3 for other methods). Annual depreciation was calculated as follows:
𝐴𝑛𝑛𝑢𝑎𝑙 𝐷𝑒𝑝𝑟𝑒𝑐𝑖𝑎𝑡𝑖𝑜𝑛 = 𝐴𝑠𝑠𝑒𝑡 𝐶𝑜𝑠𝑡 − 𝑆𝑎𝑙𝑣𝑎𝑔𝑒 𝑉𝑎𝑙𝑢𝑒
𝐸𝑠𝑡𝑖𝑚𝑎𝑡𝑒𝑑 𝑈𝑠𝑒𝑓𝑢𝑙 𝐿𝑖𝑓𝑒
Where:
1. Asset cost is the purchase or acquired value of the asset;
2. Salvage value (or residual value) is 10% of the asset cost; and
3. Estimated useful life is the estimated number of years the asset shall be
used as determined by COA.
Depreciation Cost= Reported actual non-cash out expense reflected in the financial report
of FY2012
Cost Estimate= Computation of the depreciation cost based on the available data using the
straight-line method

Hospital Maintenance and Depreciation Study Banzon E, Alcantara MGL, Diez MA, and Sayson LA. 2013
23
Table 2. Calculation of Depreciation Cost
Depreciation costs for the depreciable assets of LGU-managed hospitals are computed at the
accounting office of the LGUs, except for LGU Hospital 4 where a book on depreciation costs is
produced monthly by the hospital. DOH-managed hospitals compute for their own depreciation
costs. All hospitals reported following the NGAS for the computation of the depreciation costs
using the straight-line method of calculation. It was noted that not all of the hospitals reflected
depreciation on their financial reports (See Annex 5). It appears that the computations of
depreciation costs are for mere compliance to the COA rules and guidelines on accounting. The
failure to report the depreciation of capital assets results to an overestimation of the net income.
This poses difficulty in capturing the accurate costing of hospital services.
There is a lagging transition of the list of depreciable assets from the supply office to be carried
over to the accounting office for the depreciation computation. As shown in Table 2, cost
estimates for depreciation in two hospitals were relatively lower than the reported actual non-
cash out expense. Furthermore, the hospital and municipal accountants expressed difficulties in
determining the classification of the capital assets with respect to the corresponding useful life
years; such an erroneous classification results to miscalculation of depreciation cost. All of these
may have contributed to the disparate values of the reported non-cash out expense from the
calculated cost estimate despite the use of the same method.
5 2 3 6 4 1 1 2
Reported
Depreciation
Cost as a
Percentage
of MOOE 0% 0% 0% 0% 18.45% 40.44% 0% 0%
5,539,547.33
NDA NDA
Cost
EstimateNDA NDA NDA NDA NDA NDA NDA
Cost
Category
LGU-Managed Hospitals DOH-Retained
Depreciation
Cost 0 0 NDA 0 1,479,571.42 19,564,652.10
3,885,100.01 9,141,999.26 18,187,131.65
0 0 NDA 0 9,682,352.79 22,325,624.60
8,239,470.60 NDA NDA
0 0
253,521.00 33,075.09 76,178.84 9,254,139.21 2,423,336.75
NDA NDA NDA 34,730.64 NDA
0 0 0 0 64,164.36
Equipment and Instrument
Building and Physical Plant
NDA NDA
Depreciation
Cost
Cost
Estimate
Depreciation
CostCost
Estimate
Other Property, Plant, and Equipment
NDA

Hospital Maintenance and Depreciation Study Banzon E, Alcantara MGL, Diez MA, and Sayson LA. 2013
24
All of the selected hospitals reported using certain capital assets even after they have become
fully depreciated. Though the hospitals are well-aware of the protocol for handling fully
dilapidated assets as stipulated by COA, the scarcity of resources compel them to continue
utilizing these assets until the equipment has reached its operational limit and/or a replacement
arrives. Additional costs for its maintenance are reflected in terms of servicing the damage of the
asset beyond its useful years and the replacement of the spare parts of the asset. Spare parts of
out-dated models are more expensive since there is difficulty in tracking these items nowadays.
Quality healthcare is compromised by the obsolescence of the fully depreciated equipment.
The results of Table 2 validates the results of the focus group discussion with officials of the
National Center for Health Facilities Development (NCHFD), an oversight agency ensuring
proper capital management, and two representatives from DOH-managed hospitals that
depreciation costs are not being utilized as inputs to guide hospitals in capital management. For
LGU-managed hospitals, there is no incentive to track accurately the depreciation costs as they
do not have control over the budget for capital expenditures.
For DOH-managed hospitals, funding for replacement and/upgrading is manifestly given least
priority despite the DOH-managed hospitals required to submit their five-year development plan
for the hospitals that includes the prospective needs of the hospitals in terms of CO or capital
expenditure for the next five years.
SECTION 5: Discussion
Procuring and/or upgrading a capital asset must be greatly driven by its profitability,
underpinned by the demand for it in the long run. Intelligent investment decisions must be highly
driven by numerical data from costing studies dependent on the accuracy of financial reports.
This process is called capital budgeting, a decision-making process specific to determine which
capital assets to procure that will ensure the highest profitability. There are different methods
used in capital budgeting (see Annex 3) but ultimately these methods would require relatively the
same set of data requirements- acquisition cost and cash inflow from an investment, its operating
expenses, refurbishments, repairs and maintenance costs. Such is not the case for government
hospitals where the decision to fund CO lies outside the hospital administration. For LGU-
managed hospitals, it is the decision of the local chief executive; for DOH-managed hospitals,
their GAA is under the approval of the Congress and the Senate.
The DOH-managed hospitals propose annual budgets consisting of a CO based from a five-year
development plan and operational expenses based on historical data. The budget ceiling poses
constraints on whether the proposed budget and the may be approved and enacted. It is almost
always the case that not all proposed capital assets from the development plan are procured.

Hospital Maintenance and Depreciation Study Banzon E, Alcantara MGL, Diez MA, and Sayson LA. 2013
25
Prioritization of which equipment to buy or upgrade depends on the direction of the hospital
whether it decides to go into specialization. Even if the budget proposal is tediously crafted and
is within the ceiling, and need for capital outlay duly justified, deliberations in the Congress and
the Senate may cause changes in the proposed budget or even render its disapproval. These
conditions where hospitals do not have control over their budget and CO dis-incentivize them to
do thorough budget planning and, effective and efficient budget utilization. This is more
appalling in the case of LGU-managed hospitals where personalities in politics change very often
and is worsened by their inability to retain their income.
Manifestations of the lack of incentives include poor data management and data utilization at the
level of the hospitals. This is vastly observed in the quality of data retrieved through the hospital
survey tool where hospitals lacked a systematic way of capturing and managing data on capital
assets. The data required for capital budgeting are either unavailable, outdated or are in forms
that are not readily usable. Accuracy and precision remain at the backseat as most hospitals do
not have a digitized inventory of capital assets. Tendencies for errors and underestimation tend to
increase due to the lack of electronic databases of hospitals for their equipment and building
inventory.
Another manifestation on how the budgetary system deters performance of government hospitals
is how the budget is being used and what it pays for. The budget allocated for hospitals is
primarily an input-based payment where money flows to the physical resources of hospital
operations− CO, PS and MOOE where PS merits highest priority. In this condition, oversight
agencies cannot oblige hospitals to perform because ultimately hospitals will argue that the
budget allotted for their operations is barely sufficient. Merely sustaining hospital operations,
instead of delivering the “promised” quality care, will remain an accepted intent of government
hospitals. Budgeting for repairs and maintenance is a reflection of this mantra where no decent
maintenance program is funded to preserve capital assets. Fully depreciated assets are vastly
utilized not withstanding obsolescence. The lack of clear guidelines in calculating maintenance
costs for equipment and their inclusion in the budget; and the reporting of depreciation costs
further compounds the problem.
SECTION 6: Policy Recommendations
Beyond formulating the proper guidelines and protocols for budgeting and the maintenance of
capital assets which would include the adoption of a standard maintenance cost of 5% of original
value for hospital buildings and equipment and the vigorous implementation of the New
Government Accounting System (NGAS) straight line depreciation method in calculating the
costs of depreciation of property, plant, and equipment; the following actions and policies are
recommended:
Capital Investment Fund
Hospital Maintenance and Depreciation Study Banzon E, Alcantara MGL, Diez MA, and Sayson LA. 2013
26
Hospitals become highly reliant to HFEP to fund their CO as they utilize their income to
augment their budget for MOOE. It is recommendation that DOH convert the HFEP into a long
term capital investment fund where access to the fund would require the submission of long term
capital investment plans with corresponding maintenance programs. There shall be a regular
reporting system that would monitor and evaluate the effectiveness of the CO investment which
would include both financial, clinical care and quality of care measures.
PPP arrangements for Hospital Equipment
An alternative approach is to expand existing hospital-specific outsourcing approaches in
hospital diagnostics into a PPP scheme wherein a private partner will be brought in to invest in
the hospital equipment of all DOH-managed hospitals for a defined period of time. The same
PPP scheme can also be adopted by an LGU for all the hospitals managed by the said LGU. The
private sector partner would be responsible in ensuring new needed equipment are procured and
installed while ensuring preventive, corrective, and restorative maintenance of said equipment.
Replacement/upgrading of obsolete equipment as well as ‘safety net’ provisions on downtime
will be part of the arrangement.
Output-based payment of DOH and other government hospitals
A parallel action would be to shift the budget allocation for DOH-managed and other
government hospitals from line item budgets into an output-based global budget. In order to
demand quality healthcare delivery from hospitals, necessary incentives must be in place.
Linking money to performance by shifting payment from input to output is considered an
effective incentive. Through an output-based payment, funds become tied with predefined
measures. The outputs would not be limited to quantity outputs bit would include quality-based
outputs such as improved recovery time of patients and responsiveness to patient needs.
Similarly, the payment of PHIC would be changed into an output-based payment with the
implementation of the global budget payment program (GBPP). However, PHIC needs to
review this to ensure that the GBPP payment rates are able to cover the operational expenses and
fund part of the needed capital investments of hospitals.
Improved Data Management and Utilization
Investments have to be channeled towards building the necessary IT infrastructure that would
provide the needed information to support critical hospital operations, including budgeting and
financial management. There is a need to digitize financial processes/workflows and data capture
to make information readily accessible to decision-makers. The improved data management
systems would hopefully improve hospital management decisions, particularly financial
management, and future research studies.
Hospital Maintenance and Depreciation Study Banzon E, Alcantara MGL, Diez MA, and Sayson LA. 2013
27
REFERENCES Department of Budget and Management, National Budget Memorandum No. 115, 2012, Manila, Philippines, pp. 3-
5. Flessa, S. [2009] Costing of Health Care Services in Developing Countries: A Prerequisite for Affordability
Sustainability and Efficiency. Peter Lang Pub Inc. Flessa, S. and M. Moeller and T. Ensor and K. Hornetz [2011] “Basing care reforms on evidence: The Kenya health
sector costing model” BMC Health Services Research 11: 128. Fritze, J. [2001] “Is Healthcare Budgeting Ethically Justifiable?” The European Journal of Health Economics 1(2): 26-
30 Herrera, M. E. and F. Roman [2010] “Overview of Health Sector Reform in the Philippines and Possible
Opportunities For Public-Private Partnerships” Asian Institute of Management Working Paper No. 10-002 Horngren, C.T. and W.T. Harrison and and M.S. Oliver [2012] Financial & Managerial Accounting. Third Edition.
Prentice Hall. Kaufman, F. [2009]. A Primer on Hospital Accounting and Finance for Trustees and Other Healthcare
Professionals.Fourth Edition. Illinois: Kaufman, Hall & Associates, Inc. Lavado, R. and A. B. Sanglay-Dunleavy and J. Jimenez and Y. Matsuda [2010a] “How Are Government Hospitals
Performing? A Study of Resource Management in DOH-retained Hospitals” Philippine Institute of Development Studies Discussion Paper Series No. 2010-02, January
Lavado, R. and L. Lagrada and R.D. Sabeñano [2010b] “Local Health Accounts: Understanding the Sources and Uses
of Funds in Delivering Local Health Services in a Devolved Setting” http://www.nscb.gov.ph/ncs/11thNCS/papers/invited%20papers/ips-10/03_Local%20Health%20Accounts%20Understanding%20the%20Sources%20and%20Uses%20of%20Funds%20in%20Delivering%20Local%20Health%20Services%20in%20a%20Devolved%20Setting.pdf. Accessed 15 June 2013.
Lavado, R., Pantig, I., Rosales, K., Ulep, V. [2012] “Improvement of the Implementation Procedures and
Management Systems for the Health Facilities Enhancement Grant of the Department of Health, PIDS Discussion Paper Series No. 2012-24.
McLean, R.A. [2003] Financial Management in Health Care Organization.Second Edition. Canada: Thomson
Learning Inc. Mihn, H.V. and K.B. Giang and D.L. Huong and L.T. Huong and N.T. Huong and P.N. Giang and L.N. Hoat and P.
Wright [2009] “Costing of Clinical Services in Rural District Hospitals in Northern Vietnam” International Journal of Health Planning and Management. 25(1): 63-73

Hospital Maintenance and Depreciation Study Banzon E, Alcantara MGL, Diez MA, and Sayson LA. 2013
28
National Economic and Development Authority (NEDA) and Canadian International Development Agency (CIDA) and United Nations Development Programme (UNDP) [2006].Advanced Manual on Project Evaluation.Philippines: National Economic and Development Authority.
“PHL spends less health care amid economic boom,” GMA News, 4 September 2013, (accessed 8 September 2013). Tsilaajav, T. [2009] “Costing study for selected hospitals in the
Philippines”,http://www.DOH.gov.ph/sites/default/files/Costing%20 Study%20for%20Selected%20Hospitals%20in%20the%20Philippines.pdf. Accessed 12 June 2013.
Ubac, M.L., “Health, social welfare, public works get biggest budget hike,” Philippine Daily Inquirer, 2013,
http://newsinfo.inquirer.net/444003/health-social-welfare-public-works-get-biggest-budget-hike, 13 July 2013, (accessed 8 September 2013).
Von Both, C. and A. Jahn and S. Flessa [2008] “Costing Maternal Health Services in South Tanzania: A Case Study
from Mtwara Urban District” The European Journal of Health Economics 9(2): 103-115, May.

Hospital Maintenance and Depreciation Study Banzon E, Alcantara MGL, Diez MA, and Sayson LA. 2013
29
ANNEX 1. STANDARD BUDGET CYCLE 1. Budget Preparation
1.1 Budget Call The Department Budget Coordination Committee (DBCC) sets budget parameters used to guide and steer the budget cycle. These budget parameters include macreconomic and fiscal targets, expenditure levels or budget ceilings and budget framework or the working list of budget items. The Department of Budget and Management (DBM) issues a National Budget Call for all government agencies including state universities and a Corporate Budget Call for GOCCs and GFIs. Budget parameters, technical guidelines and procedures with timetable of budget preparation are included in the issued budget call. 1.2 Stakeholder Engagement This is to ensure that opportunities are created to maximize citizen participation. Engagement of the stakeholders in the budget preparation is deemed to ascertain transparency. This is also particularly important for the bottom up budgeting process, where proposals from CSOs and citizen-stakeholders will be taken into account. With its pilot in 2012, with 9 participating national government agencies, it is now being expanded and institutionalized requiring another 10 agencies to partner with civil service organizations and citizen-stakeholders. This is highly recommended for the remaining agencies and departments.
ORIGINAL SET (Piloted in 2012) NEW SET (Starting 2013) Department of Health Department of Education Department of Social Welfare and Development Department of Public Works and Highways Department of Agriculture Department of Agrarian Reform National Food Authority National Housing Authority National Home Mortgage and Finance Corp.
Department of Tourism Department of Transportation and Communication Department of Interior and Local Government Department of Justice Department of Labor and Employment Department of Environment and Natural Resources Light Rail Transit Authority National Electrification Administration National Irrigation Administration
1.3 Technical Budget Hearing All agencies need to defend their proposed budgets before a Technical Panel justifying the elements in their budgets. DBM reviews the budget proposals and prepares recommendations based on the performance indicators, output targets and absorptive capacity of the agencies.

Hospital Maintenance and Depreciation Study Banzon E, Alcantara MGL, Diez MA, and Sayson LA. 2013
30
1.4 Executive Review The Technical Panel submits its assessment and recommendations based on the technical budget hearings to the Executive Review Board (ERB) composed of the DBM Secretary and senior officials. ERB does further review and deliberations that entail careful prioritization of programs with corresponding support, in line with the priority agenda of the national government. This serves as avenue to discuss issues on implementations and possible solutions. 1.5 Consolidation, Validation and Confirmation National Expenditure Program (NEP) and Budget of Expenditures and Sources of Financing (BESF) reflect the consolidated recommended agency budgets and recommendations. Included in the consolidating process, where heads of agency are invited, are the deliberations of DBCC determining the total expenditure ceilings of agencies in line with the budget parameters. 1.6 Presentation to the President and Cabinet DBM and DBCC present the NEP plan to the President and Cabinet for refinements and reprioritization. Budget documents are then prepared and submitted to Congress. 1.7 President’s Budget Budget preparation ends with final and approved budget called President’s Budget containing the following:
President’s Budget Message
BESF
NEP
Details of Selected Programs and Projects
Staffing Summary
2. Budget Legislation 2.1 House Deliberations The House Appropriations Committee with its sub-committees conducts budget hearings to examine and analyze the programs and projects of the agencies. Succeeding this is the crafting of the General Appropriations Bill (GAB) which is sponsored by the Appropriations Committee and sub-committees during plenary sessions. This is approved on the second or third hearing before it goes to the Senate, consistent with other laws. 2.2 Senate Deliberations The Senate Finance Committee and Sub-Committees that in the course of expediting the process usually begin budget hearings even before Congress submits its approval of GAB conduct deliberations and hearings on GAB.

Hospital Maintenance and Depreciation Study Banzon E, Alcantara MGL, Diez MA, and Sayson LA. 2013
31
2.3 Bicameral Deliberations Bicameral Conference Committee, composed of representatives from the Senate and Congress, discusses to resolve conflicting provisions in their own versions of the GAB resulting to a Harmonized Version/ “Bicam” Version. 2.4 Ratification and Enrolment The “Bicam” version is submitted to both Houses to be voted and ratified. The final GAB submitted to the president is considered enrolled.
2.5 President’s Enactment and Veto After reviewing the GAB, the President and DBM jointly prepares a Veto Message specifying which items are for direct veto or conditional implementation. The GAB is now referred to as the General Appropriations Act. On the circumstance that the GAA is not enacted before the start of the fiscal year, the GAA of the previous year is automatically reenacted where budgets for all agencies and their programs, projects and activities (PPAs) remain the same. For terminated PPAs, their budgets are realigned to cover other expenses.
3. Budget Execution 3.1 Release Guidelines and Program Implementation and funding of the PPAs of the agencies start right after the enactment of the GAA. Release and utilization of funds are guided by DBM through its issuances. 3.2 Budget Execution Documents Agencies need to submit Budget Execution Documents (BED)—physical and financial plan, monthly cash program, estimate of monthly income, obligations, detailing agency’s plan, performance and targets for the year. 3.3 Allotment and Cash Release Programming Based on the BED, DBM prepares an Allotment Release Program (ARP) setting limits to the allocated funds for each agency in accordance to the approved budgets in the GAA, including Automatic Appropriations. A Cash Release Program (CRP) is also prepared to measure the amount of cash released monthly and yearly. 3.4 Allotment Release (ABM and SARO) The DBM issues an Agency Budget Matrix (ABM) that identifies expenditure categories that do not need clearance because they have already been itemized in the GAA. DBM may also issue Special Allotment Release Orders (SAROs) which include those that need clearance and the approval of the DBM or the President in a scenario that an agency submits a Special Budget Request (SBR) for cases of lump sum, confidential, or intelligence funds to name a few.

Hospital Maintenance and Depreciation Study Banzon E, Alcantara MGL, Diez MA, and Sayson LA. 2013
32
3.5 Incurring Obligations The implementation of PPAs legally incurs obligations on behalf of the governments. 3.6 Allocation For agencies to be able to pay for obligations, the DBM issues a disbursement authority usually in the form of a Notice of Cash Allocation (NCA) while in special cases, Non-cash Availment Authority (NCAA) for non-cash disbursements and Cash Disbursement Ceiling (CDC) for agencies/departments with operations overseas. 3.7 Disbursement The last and final step of the budget execution is spending the funds through the Modified Disbursements Scheme where expenditures are charged to the Treasury and settled to the government servicing banks.
4. Budget Accountability
4.1 Performance Targets and Outcomes The approved budgets for execution also need to be accounted to ensure ethical use of public funds and fund utilization will attain performance targets and outcomes. The measurement of performance and outcomes are prepared together with the National Budget and are prescribed in the OPIF book of output. These performance targets are also included in the BEDs during the Budget Execution phase. 4.2 Budget Accountability Reports In order to monitor the usage of funds and physical accomplishments of the NGAs they would need to submit monthly and quarterly Budget Accountability Reports (BARs) (financial reports of operations, quarterly income reports, a monthly statement of allotments, obligations and balances, and monthly report of disbursements) 4.3 Quarterly Agency Performance Review The agencies will then have to be reviewed by the DBM for their financial and physical performance. The BARs submitted by the agencies are assessed against their targets indicated in the OPIF and in their BEDs. The DBM uses an Agency Performance Review (APR) to assess the quarterly and semestral performance of the agencies. 4.4 Year-End Budget Performance Assessment Review Budget Performance Assessment Review (BPAR) is used to assess their yearly performance. 4.5 Audit Outside the role of DBM, the Commission on Audit (COA) will have to audit the agencies to make them accountable for the use of public funds. The reports created by COA can then be used by the DBM to assess an agency’s performance and to fix issues involving fund utilization. 4.6 Performance-Based Incentive System

Hospital Maintenance and Depreciation Study Banzon E, Alcantara MGL, Diez MA, and Sayson LA. 2013
33
Performance-based incentive system aims to recognize and reward good performance among government agencies and their employees in relation to fund utilization. This is being established by DBM in order to promote efficiency in budget utilization and resource management.
ANNEX 2. BUDGET REFORMS 1) Performance-Based Budgeting A performance-based budget gives an indication of how the money allocated is expected to turn into results. It does not only inform the resource allocation decisions that go into the development of a traditional type of budget. It also presented how each program area allocates the budget in day-to-day tasks and activities, how these activities are expected to generate certain outputs, and what outcomes should then be the result. Performance-based budgeting differs from line item budgeting in such a way that the former shows what the budget will accomplish, such as in a measurable achieved result or in the way of an activity performed. 2) Medium-Term Expenditure Framework (MTEF) The MTEF facilitates the systematic determination of available uncommitted funds available for allocation among the key programs, taking into account the future cost of approved and ongoing programs as well as valid commitments under the Forward Estimates (FE) process and the fiscal consolidation strategy of the National Government. 3) Organizational Performance Indicator Framework (OPIF) The OPIF is a key reform of the DBM that seeks to implement effective agency spending to produce concrete and measurable outcomes in line with the Administration’s priority development agenda. It aims to improve allocative efficiency and operational efficiency. Under this reform, the expected outputs are strategically designed to reduce poverty and induce inclusive growth, thus meeting the MDG. The OPIF shall be based on the ongoing refinement of the Major Final Outputs, and Performance Indicators and the restructuring of programs/activities/projects. 4) Zero-Based Budgeting (ZBB) The Zero-Based Budgeting (ZBB) is a decision-making approach that reverses the working process of the traditional historic budgeting. ZBB approach has been launched in line with the government’s goal of being transparent, especially in financial processes. It aims to establish improved transparency, accountability, and openness in budget preparations. It has been used to scale down funding for activities, which are not aligned with the priority programs, or which are otherwise inefficient and ineffective, and fraught with leakages. The approach requires each agency or department to justify its entire budget every year, building from a base of zero. In

Hospital Maintenance and Depreciation Study Banzon E, Alcantara MGL, Diez MA, and Sayson LA. 2013
34
most cases, detailed justification includes unit costs and quantities. This way, for various programs and projects, increase, reduction, or discontinuation of resources will be determined. ZBB approach poses many advantages, such as helping reallocate spending between departments. It moves away from incremental budgeting. In addition, it rationalizes budget cuts. Since items are itemizes with unit costs and quantities, across-the-board cuts are avoided. The trade-offs between inputs and outputs are more transparent. The same level of service may be given for less money. It also engages managers, and not just decision makers, in budget discussions. This can lead to efficiency gains. However, there are still a few flaws in this approach. For one, there is no structured means for considering different service levels. It also does not have a separate planning process; therefore, efficiency gains may not be systematic. 5) Bottom-Up Budgeting (BuB) The Bottom-Up Budget approach aims to ensure that budget preparation and allocation will target areas where poverty reduction is urgent and necessary. This is in line with the government’s goal to achieve the MDG by 2015. It is guided by the principles: convergence, participation, and empowerment. In the BUB approach, the budgeting process would focus on the poorest municipalities identified by the Cabinet’s Human Development and Poverty Reduction cluster. This will ensure that the needs of the poor municipalities will be adequately funded. The process will also strengthen relations between the local government and civil society for a better planning and budgeting methodology. The result of all the local planning and budgeting is the convergence of plans and priorities as projects are harmonized at the national level by national government agencies in their programs and budget for implementation. The efficacy of the BuB approach relies on adequate monitoring, evaluation, and feedback system. Furthermore, for it to effectively respond to the needs of the basic sectors, a thorough assessment of its implementation should be done. This is to ensure that it addresses constraints properly.
ANNEX 3. METHODS FOR CAPITAL BUDGETING AND CALCULATION OF MAINTENANCE AND
DEPRECIATION COSTS
1. Capital Budgeting
Capital budgeting is the process of deciding on capital investments that in the long term will provide a company with the highest profitability. Investments that would require capital budgeting are usually large and can be utilized for more than the year that it is acquired. Examples of this are investments in facilities such as buildings or building improvements and equipment/instruments (e.g. x-ray, beds, and furnishings). These investments will incur

Hospital Maintenance and Depreciation Study Banzon E, Alcantara MGL, Diez MA, and Sayson LA. 2013
35
depreciation costs and ongoing costs like labor, maintenance, and supplies during its estimated useful life (Horngren et al., 2012; Kaufman 2009).
Methods of Capital Budgeting
The four commonly used methods in capital budgeting are the Payback Period, Rate of Return (ROR), Net Present Value (NPV) and Internal Rate of Return (IRR). Payment Period and ROR are ideally used on investments with a particularly short life span of 3 – 5 years, while the NPV and IRR method regards the time value of money as a key component and can be useful for investments that will take a longer time period. Companies decide on their possible investments using combinations of these different methodologies (Horngren et al., 2012).
The Payback Period method is a useful tool in calculating the time period in which the investment expenditure will be reclaimed. It is calculated by the following formula:
𝑷𝒂𝒚𝒃𝒂𝒄𝒌 𝑷𝒆𝒓𝒊𝒐𝒅 = 𝐴𝑚𝑜𝑢𝑛𝑡 𝐼𝑛𝑣𝑒𝑠𝑡𝑒𝑑
𝐴𝑛𝑛𝑢𝑎𝑙 𝐶𝑎𝑠ℎ 𝐼𝑛𝑓𝑙𝑜𝑤
The result will be the number of years and a lower value means it will take a shorter time to recoup the investment made. Compared to other capital budgeting methods, this is the simplest to compute using only two required variables which can compute the time rather than the profitability of an investment. The deciding factor for this method is that investments expenditure reclaimed at a shorter period is desirable, all else being equal. Unlike the ROR, it does not take into account the cash inflows that will occur after the payback period has ended or the possible salvage value after an investment’s life has ended. Both the Payback Period and the ROR differ from NPV and IRR which takes into account the time value of money (Horngren et al., 2012).
The Rate of Return (ROR) is used to measure profitability. The ROR is computed using the following:
𝑹𝒂𝒕𝒆 𝒐𝒇 𝑹𝒆𝒕𝒖𝒓𝒏 = 𝐴𝑣𝑒𝑟𝑎𝑔𝑒 𝑎𝑛𝑛𝑢𝑎𝑙 𝑜𝑝𝑒𝑟𝑎𝑡𝑖𝑛𝑔 𝑖𝑛𝑐𝑜𝑚𝑒 𝑓𝑟𝑜𝑚 𝑎𝑛 𝑎𝑠𝑠𝑒𝑡
𝐴𝑣𝑒𝑟𝑎𝑔𝑒 𝑎𝑚𝑜𝑢𝑛𝑡 𝑖𝑛𝑣𝑒𝑠𝑡𝑒𝑑 𝑖𝑛 𝑎𝑛 𝑎𝑠𝑠𝑒𝑡
The average annual operating income from an asset is computed by:
𝑨𝒗𝒆𝒓𝒂𝒈𝒆 𝒂𝒏𝒏𝒖𝒂𝒍 𝒐𝒑𝒆𝒓𝒂𝒕𝒊𝒏𝒈 𝒊𝒏𝒄𝒐𝒎𝒆 𝒇𝒓𝒐𝒎 𝒂𝒏 𝒂𝒔𝒔𝒆𝒕
= ((𝑛𝑒𝑡 𝑐𝑎𝑠ℎ 𝑖𝑛𝑓𝑙𝑜𝑤𝑠) 𝑥 (𝑎𝑠𝑠𝑒𝑡’𝑠 𝑙𝑖𝑓𝑒𝑠𝑝𝑎𝑛)) – (𝑎𝑠𝑠𝑒𝑡 𝑐𝑜𝑠𝑡 – 𝑠𝑎𝑙𝑣𝑎𝑔𝑒 𝑣𝑎𝑙𝑢𝑒)
𝐴𝑠𝑠𝑒𝑡’𝑠 𝑜𝑝𝑒𝑟𝑎𝑡𝑖𝑛𝑔 𝑙𝑖𝑓𝑒 𝑖𝑛 𝑦𝑒𝑎𝑟𝑠
The average amount invested in an asset is:
𝑨𝒗𝒆𝒓𝒂𝒈𝒆 𝒂𝒎𝒐𝒖𝒏𝒕 𝒊𝒏𝒗𝒆𝒔𝒕𝒆𝒅 𝒊𝒏 𝒂𝒏 𝒂𝒔𝒔𝒆𝒕

Hospital Maintenance and Depreciation Study Banzon E, Alcantara MGL, Diez MA, and Sayson LA. 2013
36
= (𝑎𝑠𝑠𝑒𝑡 𝑐𝑜𝑠𝑡 + 𝑟𝑒𝑠𝑖𝑑𝑢𝑎𝑙 𝑜𝑟 𝑠𝑎𝑙𝑣𝑎𝑔𝑒 𝑣𝑎𝑙𝑢𝑒)
2
Companies often set a minimum required rate of return and this method can be used to easily decide whether to invest on something or not. This is the only method that includes depreciation as one of its required variables and can show how an investment will affect the accrual accounting income. Using this method in deciding whether to invest in capital assets or not should know if the expected ROR exceeds the required ROR, which is the right time to make an investment. In contrast, one should not invest if the expected ROR is less than the required ROR. Like the Payback Period, this method will still be inaccurate for investments with long life spans since it does not take into account the time value of money (Horngren et al., 2012).
The Net Present Value (NPV) is a Discounted Cash Flow model and takes into account the time value of money. It is computed using:
𝑵𝒆𝒕 𝑷𝒓𝒆𝒔𝒆𝒏𝒕 𝑽𝒂𝒍𝒖𝒆 = 𝑃𝑟𝑒𝑠𝑒𝑛𝑡 𝑉𝑎𝑙𝑢𝑒 𝑜𝑓 𝑎𝑛 𝑖𝑛𝑣𝑒𝑠𝑡𝑚𝑒𝑛𝑡 − 𝑐𝑜𝑠𝑡
The Present Value is calculated by:
𝑷𝒓𝒆𝒔𝒆𝒏𝒕 𝑽𝒂𝒍𝒖𝒆 = (𝑁𝑒𝑡 𝑐𝑎𝑠ℎ 𝑖𝑛𝑓𝑙𝑜𝑤) 𝑥 (𝐴𝑛𝑛𝑢𝑖𝑡𝑦 𝑃𝑉 𝑓𝑎𝑐𝑡𝑜𝑟)
The Annuity PV factor’s formula is:
𝑨𝒏𝒏𝒖𝒊𝒕𝒚 𝑷𝑽 𝒇𝒂𝒄𝒕𝒐𝒓 = 1−(1+(𝑖𝑛𝑡𝑒𝑟𝑒𝑠𝑡 𝑟𝑎𝑡𝑒))𝑦𝑒𝑎𝑟𝑠
𝑖𝑛𝑡𝑒𝑟𝑒𝑠𝑡 𝑟𝑎𝑡𝑒
The Annuity PV factor is found in the annuity table which takes into account the interest rate. The decision rule in deciding whether to invest in capital assets is determining if the NPV is positive or negative. A positive NPV indicates that an asset is earning more than the required rate of return. This is inversely so when the NPV is negative. A different computation is used when there is unequal net cash inflow, which is the summation of the Net Cash Inflow multiplied by the PV Factor for each year subtracted by the investment cost (Horngren et al., 2012).
Intuitively, for a hospital to get a positive NPV for their capital investments, the net cash inflow should be positive (cash inflows should be greater than cash outflows) and the present value calculated should be larger than the initial cost of an investment. For example, consider a hospital that acquires a new x-ray machine with an expected useful life of five years for 100,000 pesos at a discount/interest rate of 6%. Given that, the PV factor of a discount rate of 6% in 5 years is 4.2124. Using the formula:

Hospital Maintenance and Depreciation Study Banzon E, Alcantara MGL, Diez MA, and Sayson LA. 2013
37
𝐀𝐧𝐧𝐮𝐚𝐥 𝐍𝐞𝐭 𝐂𝐚𝐬𝐡 𝐈𝐧𝐟𝐥𝐨𝐰 = 100,000 (initial cost)
4.2124 (pvf)
The least amount of Net Cash Inflow needed to have a 0 NPV can be determined. The x-ray machine procured by the hospital needs to have a minimum Net Cash Inflow of 23,739.44 pesos per year for the next 5 years of its lifetime in order for the hospital to breakeven.
McLean (2010) argued though that the use of interest rates in NPV is one of its pitfalls, as the decision of what interest rates to use is more of a political one. To protect the career of a manager proposing a project, most American firms inflate the value of the interest rates they use which result in underestimating capital budgeting, ensuring profitability but only for a few safe investments. This results in a bottleneck for innovation, efficiency, and competitiveness.
The Internal Rate of Return (IRR) is another Discounted Cash Flow model. It is computed by finding the interest rate that corresponds to the Annuity PV Factor computed from dividing the investment cost with the expected annual net cash inflow. Computing for the IRR of unequal annual cash flow would require trial and error or dedicated software. The decision rule for the IRR method is that IRR should exceed the Required Rate of Return in order for an investment to be profitable (Horngren et al., 2012).
Among the four methods, the NPV and the IRR are better methods than the Payback Period and the ROR since they take into account the time value of money. Between the NPV and the IRR, the NPV is more reliable. The Advanced Manual on Project Evaluation (NEDA 2006) has cited five inherent problems with the IRR method namely: (1) multiple possible IRRs, (2) projects of different scale are ordered wrongly, (3) they are not additive, (4) it generally favors projects with a shorter life span, and (5) it is independent of the timing of a project whereas the NPV is sensitive to timing.
Data Requirements of Capital Budgeting
All four of these methods would require an estimate of the Net Cash Inflow that an investment produces. The Net Cash Inflow is the cash inflow from an investment minus its operating expenses, refurbishments, repairs and maintenance costs. The amount of a particular investment will also be important to collect for calculation (Horngren et al., 2012).
These data can only be acquired through a hospital survey which will thoroughly retrieve data on purchasing price, cash inflows which in the case of government hospitals generally come from LGU budgets (internal revenue allocation) and national GAA (for DOH-retained hospitals), and outflows on each specific capital investment.
2. Costing

Hospital Maintenance and Depreciation Study Banzon E, Alcantara MGL, Diez MA, and Sayson LA. 2013
38
In order to get a good estimate of cash outflows which is part of the calculation of net cash inflows one of the main variables for capital budgeting, costs must be measured. Cost accounting systems are used in order to know how much cost is needed for producing each unit of service. The information regarding the cost per unit of service is helpful for an easier planning and managing of resource needed (Horngren et al., 2012).
Costing Methods and Data Requirements There are two known costing methods for cost measurement: top-down and bottom-up. The methodology that is commonly used in costing hospitals is the top-down or step-down allocation and was done in at least four costing studies done by Von Both et al., (2008), Mihn et al., (2009), Tsilaajav (2009), and Flessa et al., (2011). A study done by Flessa et al., (2011) broke down the step-down allocation into three steps. Initially, the step-down allocation model allocates direct cost straight to their respective cost centers. Secondly, indirect costs are then allocated step by step from ancillary cost centers to final cost centers. And thirdly, the unit cost for each final cost center can then be calculated by dividing the total cost with their respective total output. The data requirements of this methodology are intensive, it is important to capture all costs incurred by a hospital through a survey in order to come up with a complete and accurate result. A study conducted by Tsilaajav (2009) on Philippine hospitals has captured costs such as capital costs, cost of personnel services, drugs/medicines and medical supplies costs, and other recurring costs. The data was gathered from the hospital’s financial statements and administrative records. The study done by von Both et al., (2008) in South Tanzania and Flessa et al., (2011) in Kenya used the same methodology and has captured mostly the same data. Another approach is the bottom-up or resource costing which calculates the direct and indirect cost based on the services that a patient receives. Unlike the top-down approach which averages the total unit costs per patient, the bottom-up approach is useful in getting the costs for a particular disease. This approach requires additional data since it identifies the average amount of services received by patients of a specific disease. To retrieve this data, Tsilaajav (2009) has used a patient survey to assess the services received by patients in the top five common disease categories.
a. Top-down versus bottom-up
Both costing approaches has its advantages and disadvantages. The top-down approach involves less cost and less time and generates accurate results while the bottom-up approach proves to be tedious and costly as this approach focuses on gathering detailed information regarding the cost which produces more accurate results; therefore the latter approach is known to be time and resource-consuming (Tsilaajav 2009).

Hospital Maintenance and Depreciation Study Banzon E, Alcantara MGL, Diez MA, and Sayson LA. 2013
39
The Bottom-Up Budget approach aims to ensure that budget preparation and allocation will target areas where poverty reduction is urgent and necessary. This is in line with the government’s goal to achieve the MDG by 2015. In the BUB approach, the budgeting process would focus on the poorest municipalities identified by the Cabinet’s Human Development and Poverty Reduction cluster. This will ensure that the needs of the poor municipalities will be adequately funded.
b. Historic Budgeting Historic-based budgeting takes into account the actual performance of the current period and uses it as the basis from which to predict the performance in the next budget period. This method produces a reasonable and practical indication of the level of future performance of the hospital. However, it has a number of deficiencies. It doesn’t account for the possible changes in significant factors. It assumes that all present functions should be continued in the future, therefore carries on current weaknesses and strengths. It also assumes that the current period is a reasonable basis for predicting the future performance, regardless of positive or negative factors, which may have affected the current performance.
c. Zero-Based Budgeting The Zero-Based Budgeting (ZBB) is a decision-making approach that reverses the working process of the traditional historic budgeting. ZBB approach has been launched in line with the government’s goal of being transparent, especially in financial processes. It aims to establish improved transparency, accountability, and openness in budget preparations. It has been used to scale down funding for activities, which are not aligned with the priority programs, or which are otherwise inefficient and ineffective, and fraught with leakages. The approach requires each agency or department to justify its entire budget every year, building from a base of zero.
3. Depreciation and Maintenance
Depreciation is getting back the cost that was used in a capital investment by dividing it over its useful life. It is computed based on three factors: the Capitalized Cost which includes all investments that was used on a particular asset, the Estimated Useful Life which is an estimate of how long an asset would be useful for a company, and the Estimated Residual/Salvage Value which is the value you expect to receive when an asset’s useful life has been consumed by selling or scraping it (Horngren et al., 2012).
Common Methods of Calculating Depreciation
The first common method of calculating depreciation is the straight-line method which divides the amount of depreciation equally for each year of an asset’s useful life (Horngren et al., 2012). The formula for the straight-line method is as follows:

Hospital Maintenance and Depreciation Study Banzon E, Alcantara MGL, Diez MA, and Sayson LA. 2013
40
𝑺𝒕𝒓𝒂𝒊𝒈𝒉𝒕 − 𝒍𝒊𝒏𝒆 𝑫𝒆𝒑𝒓𝒆𝒄𝒊𝒂𝒕𝒊𝒐𝒏 = 𝐶𝑜𝑠𝑡 − 𝑅𝑒𝑠𝑖𝑑𝑢𝑎𝑙 𝑉𝑎𝑙𝑢𝑒
𝑙𝑖𝑓𝑒
The straight-line is also the method used by the New Government Account System (NGAS) of the Philippine government’s Commission on Audit (COA). Standards have been set by COA for the depreciation to begin at the second month after purchasing the asset; the residual value set at 10% from the purchasing cost of the asset, and the estimated life. The estimated useful lives provided by COA in a tabular form assigned 15 years on hospital equipment, 50 years on concrete structures and 30 years for mixed concrete structures. Another approach which was discussed in “Costing of Health Care Services in Developing Countries: A Prerequisite for Affordability Sustainability and Efficiency” written by Fleßa (2009) does not take into account the residual value of the assets and the estimated life of small, medium or large hospital buildings are assigned at 25 years while hospital equipment are depreciated in an 8 year period. Note that the shorter amount of years will show up as larger annual depreciation costs.
Units-of-Production method is another way of calculating depreciation. This method is basically the same as the straight-line method; however, it differs on how the useful life is utilized in the formula. The former uses life in years while the latter method uses life in units. It is represented by the following formula:
𝑼𝒏𝒊𝒕𝒔 − 𝒐𝒇 − 𝑷𝒓𝒐𝒅𝒖𝒄𝒕𝒊𝒐𝒏 𝑫𝒆𝒑𝒓𝒆𝒄𝒊𝒂𝒕𝒊𝒐𝒏 = 𝐶𝑜𝑠𝑡 − 𝑅𝑒𝑠𝑖𝑑𝑢𝑎𝑙 𝑉𝑎𝑙𝑢𝑒
𝑙𝑖𝑓𝑒 𝑖𝑛 𝑢𝑛𝑖𝑡𝑠
This method is helpful in calculating the depreciation cost of an asset for each unit of output. For example, a motor vehicle asset is much better represented with a depreciation cost per mile instead of years since vehicle usage is not constant for a given year or day (Horngren et al., 2012).
Declining-Balance method is a third way of calculating depreciation. This method is used to accelerate the amount of depreciation particularly at the beginning of an asset’s life. Also, this method is mostly used by companies for the preparation of their income tax returns. Early action of companies reducing a significant amount of their investment costs from their revenue saves them from tax payments right away. The formula for the declining-balance method is as follows:
𝑫𝒆𝒑𝒓𝒆𝒄𝒊𝒂𝒕𝒊𝒐𝒏 = 𝐶𝑜𝑠𝑡 − 𝐴𝑐𝑐𝑢𝑚𝑢𝑙𝑎𝑡𝑒𝑑 𝐷𝑒𝑝𝑟𝑒𝑐𝑖𝑎𝑡𝑖𝑜𝑛
𝑙𝑖𝑓𝑒 × 𝐴𝑐𝑐𝑒𝑙𝑒𝑟𝑎𝑡𝑒𝑑 𝑅𝑎𝑡𝑒
The Accumulated Depreciation is the summation of all computed depreciation cost from the first year of an asset’s life. The most commonly used declining-balance method is the Double Declining-Balance Depreciation which uses an accelerated rate of 2 (Horngren et al., 2012).

Hospital Maintenance and Depreciation Study Banzon E, Alcantara MGL, Diez MA, and Sayson LA. 2013
41
Depreciation Methods Used in Costing Studies
The costing studies in Tanzania and Kenya used the straight-line method to compute depreciation cost. The study that was recently done in the Philippines by Tsilaajav (2009) has used the NGAS method which also uses the straight-line formula.
Maintenance
There are no generally used formula in calculating maintenance cost in accounting books but the “Costing of Health Care Services in Developing Countries: A Prerequisite for Affordability Sustainability and Efficiency” text written by Flessa (2009) has prescribed a standard maintenance cost of 5% of original value for hospital buildings and equipment. The study “Costing Maternal Health Services in South Tanzania: A Case Study from Mtwara Urban District” conducted by von Both et al., (2008) has used a 1% of original value for buildings and 5% of original value for equipment.
Standard Costs
In order to arrive at a standard costing system, there must be a price standard and a quantity standard. A price standard is captured by getting the base purchase cost of an asset. Price quotes from suppliers around the world could also be used to set a price standard. Quantity standards can be retrieved from “best practices” or benchmarks which may be studied internally or externally (Horngren et al., 2012).
Von Both et al., (2009) has calculated a standard cost for personnel, building, and equipment costs in order to identify where inputs should be increased or reduced. They have used Guidelines from the District Heath Plan for Hospitals and Guideline Standards for Health Facilities from the Tanzanian Ministry of health for dispensaries in order to identify their quantity standards while using international recommendations for the calculation of maintenance costs.
While according to Lavado et al., (2010b), most provincial public hospitals in the Philippines have low occupancy rates, with only 30% of the hospitals being utilized more than its capacity, Von Both et al., (2009) recommended that the calculation of standard cost be adjusted to 85% occupancy rate which is said to be necessary to achieve economic sustainability.
Standard Cost Data Requirements
In order to capture the standard or ideal cost, a price standard may be retrieved from the actual market prices of a hospital building and its equipment. For the quantity standard, an external benchmark (i.e. standard facilities required by DOH for each hospital level) may be used.

Hospital Maintenance and Depreciation Study Banzon E, Alcantara MGL, Diez MA, and Sayson LA. 2013
42
Annex 4: Summary Results of the Focus Group Discussion FGD Question LGU-Managed Hospitals DOH-Retained Hospitals
LGU Hospital 5 LGU Hospital 2 LGU Hospital 3 LGU Hospital 6 LGU Hospital 4 LGU Hospital 1 DOH Hospital 1 DOH Hospital 2
Hospital Budgeting
LGU Hospital 5 follows the budget cycle and the prescribed forms from DBM. Historic budgeting is used.
LGU Hospital 2 follows the budget cycle and the prescribed forms from DBM. Salaries and wages (PS) are the first items to be budgeted. Budget porposal is based on the pervious budgetts and are almost always the budget ceilings. If there is justification on the urgent needs of the hospital, at the end of the quarter, there is a supplemental or realignmentof
LGU Hospital 3 follows the budget cycle and the prescribed forms from DBM. Historic budgeting is used.
LGU Hospital 6 follows the budget cycle and the prescribed forms from DBM. Historic budgeting is used. • The divisions submit their budget proposal to the division heads. • The division heads then check or match the proposal based on the previous budget. Meeting among division heads takes place to discuss priorities of each division. • The Medical Director along
• Being an LGU hospital, the budget approval and procurement are centralized at the LGU. Though the hospital utilizes historic budgeting, budget proposals are guided by routinely collected data.
LGU Hospital 3 follows the budget cycle and the prescribed forms from DBM. Historic budgeting is used. • The divisions submit their budget proposal to the division heads. • The division heads then check or match the proposal based on the previous budget. Meeting among division heads takes place to discuss priorities of
DOH Hospital 1 follows the required budgetary requirements and timeline prescribed by the DBM with minor deviations in terms of the presentation of the budget proposal, wherein they add items that are not listed in the DBM prototype form. The Work and Financial Plan and Operational Plan serve as supporting inputs in formulating the PPMP.
At the beginning of the budget call, each department submits their Project Procurement Management Plan (PPMP) containing their specific needs and priorities. In this hospital, the Bids and Awards Committee (BAC) consolidates the submitted plans with the budget office as the oversight body. The two bodies review and edit the proposed department budget based
How is budgeting done in the hospital? What approach system and standards are used in budgeting?

Hospital Maintenance and Depreciation Study Banzon E, Alcantara MGL, Diez MA, and Sayson LA. 2013
43
the budge to be approved by the LCEt. Other expenses are centralized at the Office of the Provincial Government (OPG).
with the Hospital Administrator deliberates the budget proposal. • Budget hearings happen in the hospital level. The Medical Director along with the Hospital Administrator decides if the budget proposal will be granted to the divisions or if it will be reduced.
each division. • The Public Health Office deliberates the budget proposal. • Budget hearings happen in the provincial level. The proposal may sometimes go back to the PHO to reflect the actual needs of the division.The Provincial Office decides if the budget proposal will be granted to the divisions or if it will be reduced.
on the General Appropriation Act (GAA) and the hospital income. Like other hospitals, DOH Hospital 2 also follows a historic budgeting process wherein the proposed budget in the current PPMP is based on the previous budget and is adjusted based on perceived priorities.
Data used in budgeting and planning
No data is being collected to guide the
Arbitrary data is used as guide to
Arbitrary data is used as guide to
Generally, all cost centers are asked to
No specific data is collected to
No specific data is collected to
PPMP from hospital departments

Hospital Maintenance and Depreciation Study Banzon E, Alcantara MGL, Diez MA, and Sayson LA. 2013
44
Which data are collected routinely as inputs for budgeting? Are data readily available? How are these collected? What instruments or tools are used in collecting data?
budget planning of the hospital.
budget planning. Hospital is currently requesting from the OPG for the MOOE based on the actual expenses from the previous years. The increment is based on the number of patients.
budget planning. Hospital is currently requesting from the OPG for the MOOE based on the actual expenses from the previous years. The increment is based on the number of patients.
support their proposed budget allocation by their rate of utilization and projected income. Specific for drugs and medicines, to capture a more precise estimate, a therapeutic committee gathers and evaluates data on the usage of drugs and medicines, including administering surveys on the most prescribed drugs and medicines.
guide the budget planning.
guide the budget planning. In terms of data management, the inventory of assets and equipment maintained and updated by the supply office often does not match the list of assets and equipment of the accounting office.
are used as guide to budget planning.
Influences in the budgeting cycle
The Department
The Department
The Department
The Medical Director, along
When a budget call is
The Department

Hospital Maintenance and Depreciation Study Banzon E, Alcantara MGL, Diez MA, and Sayson LA. 2013
45
Who are the people involved in each step of the budgeting cycle?
Heads- responsible for their Budget officer of LGU- communicates the schedule of the budget call. PPMPs. Administrative officer-preparess the budget proposal. Chief of hospital- approve the budget proposal. PHO-represents the hospitals in the budget hearings. Sangguniang Pnalalawigan-approves the porposal. LGU- determine whether IRA could finance the budget proposal.
Heads- responsible for their Budget officer of LGU- communicates the schedule of the budget call. PPMPs. Administrative officer-preparess the budget proposal. Chief of hospital- approve the budget proposal. PHO-represents the hospitals in the budget hearings. Sangguniang Pnalalawigan-approves the porposal. LGU- determine whether IRA could finance the budget proposal.
Heads- responsible for their Budget officer of LGU- communicates the schedule of the budget call. PPMPs. Administrative officer-preparess the budget proposal. Chief of hospital- approve the budget proposal. PHO-represents the hospitals in the budget hearings. Sangguniang Pnalalawigan-approves the porposal. LGU- determine whether IRA could finance the budget proposal.
with the Hospital Administrator, prepares the Annual Procurement Plan from the departmental needs of the hospital. The hospital recognizes the challenges of the historical budgeting practice as inflation rate is not taken into account, therefore is deemed inaccurate. Furthermore, the inadequacy of the GAA appropriation further limits their allotment for the hospital’s departmental needs. Prioritization of the equipment purchase is based on the
issued at the level of the LGU, divisions prepare their Program Procurement Management Plan (PPMP). With the Administrative Officer as lead, the PPMPs are collated into an Annual Procurement Plan (APP). Adjustments are made in the APP based on the perceived priorities of the hospital. The APP serving as the budget proposal is submitted to the LGU. The Medical Chief and CEO attends the technical hearing along with the other offices/cost centers of the province.
Heads - responsible for their departmental needs Hospital Budget officer- communicates the schedule of the budget call and prepares the budget proposal. Chief of hospital- approve the budget proposal.
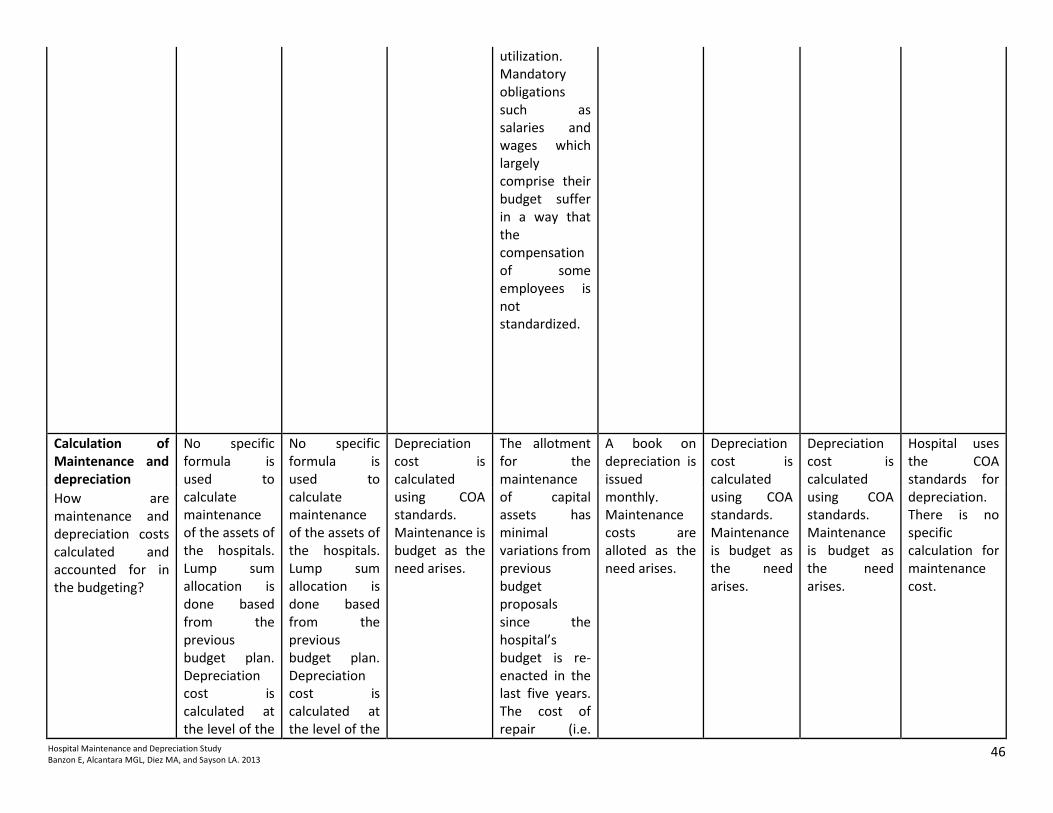
Hospital Maintenance and Depreciation Study Banzon E, Alcantara MGL, Diez MA, and Sayson LA. 2013
46
utilization. Mandatory obligations such as salaries and wages which largely comprise their budget suffer in a way that the compensation of some employees is not standardized.
Calculation of Maintenance and depreciation
No specific formula is used to calculate maintenance of the assets of the hospitals. Lump sum allocation is done based from the previous budget plan. Depreciation cost is calculated at the level of the
No specific formula is used to calculate maintenance of the assets of the hospitals. Lump sum allocation is done based from the previous budget plan. Depreciation cost is calculated at the level of the
Depreciation cost is calculated using COA standards. Maintenance is budget as the need arises.
The allotment for the maintenance of capital assets has minimal variations from previous budget proposals since the hospital’s budget is re-enacted in the last five years. The cost of repair (i.e.
A book on depreciation is issued monthly. Maintenance costs are alloted as the need arises.
Depreciation cost is calculated using COA standards. Maintenance is budget as the need arises.
Depreciation cost is calculated using COA standards. Maintenance is budget as the need arises.
Hospital uses the COA standards for depreciation. There is no specific calculation for maintenance cost.
How are maintenance and depreciation costs calculated and accounted for in the budgeting?

Hospital Maintenance and Depreciation Study Banzon E, Alcantara MGL, Diez MA, and Sayson LA. 2013
47
LGU using the COA stata on depreciation is not being used to guide the hospital on any decision on capital investment.
LGU using the COA stata on depreciation is not being used to guide the hospital on any decision on capital investment. Fully depreciated assets are still being used. Unserviceable equipment are not collected by the GSO, and thus are cluttered around the hospital.
labor and equipment spare parts) is separate from the cost of preventive maintenance. The current hospital administration faced challenges from the poor management of the previous administration in terms of the maintenance and depreciation of capital assets. Missing records on capital assets inhibited the current administration to gauge its utilization. There was an instance that the allotment for repair and maintenance was almost zero. The hospital’s remedy was a

Hospital Maintenance and Depreciation Study Banzon E, Alcantara MGL, Diez MA, and Sayson LA. 2013
48
small bulk of equipment purchase in the following year. They requested quotations (i.e. cost of the equipment, its maintenance, inspection) from the company that exclusively supplied the equipment. Allotting for preventive maintenance is a recent practice, thus the hospital implemented quarterly inspections which brought down the maintenance cost. Assessment of the maintenance cost of newly purchased equipment comes in the second year from its
Hospital Maintenance and Depreciation Study Banzon E, Alcantara MGL, Diez MA, and Sayson LA. 2013
49
acquisition since the first year is under warranty. The wear and tear of the equipment (parts of the equipment that needs to be replaced from time to time) comes in the third year from its acquisition. After that, it becomes an annual basis. Almost annually, the hospital changes the preventive maintenance cost of the equipment. The brand of the equipment (specifications in terms of sturdiness) is also a factor that affects the maintenance cost. In effect, these factors take a toll on

Hospital Maintenance and Depreciation Study Banzon E, Alcantara MGL, Diez MA, and Sayson LA. 2013
50
the budgeting practice of the hospital. The hospital does not compute for the depreciation of their capital assets as this is leveraged at the accounting office of the LGU. If the depreciation of the hospital’s equipment exceeds 10%, the LGU advises them to ask assistance from COA in condemning the equipment. The equipment of the hospital right now are already depreciated and should not be running anymore based on the prescribed COA standard.

Hospital Maintenance and Depreciation Study Banzon E, Alcantara MGL, Diez MA, and Sayson LA. 2013
51
The hospital continues to allot for its maintenance since they cannot readily replace them.
MOOE and Capital Outlay
There are no maintenance programs for the equipment, funding for repair is on a need-basis criterion. Funding for capital outlay comes from the LGU, and is provided if there is a great need of a certain equipment (need-basis criterion).
There are no maintenance programs for the equipment, funding for repair is on a need-basis criterion. Funding for capital outlay comes from the LGU, and is provided if there is a great need of a certain equipment (need-basis criterion).
No capital outlay. No maintenance program.
The allotment for the maintenance of capital assets has minimal variations from previous budget proposals since the hospital’s budget is re-enacted in the last five years. The cost of repair (i.e. labor and equipment spare parts) is separate from the cost of preventive maintenance. The current hospital administration
There is budget alloted for mainrenance but is not fully utilized. No specific line item for Capital Outlay. All CO are subject to the approval of the Board of Trustees and LCE.
No capital outlay.
No capital outlay.
Unlike the LGU hospitals where their full income is remitted back to the local treasury, the DOH-retained hospitals can retain their income and utilize it to augment their budget for operations, infrastructure, equipment, and capital outlays (CO). From the GAA, the fund for the personnel services has the largest appropriation while a percentage is
How does the hospital ensure that the capital assets are well maintained? Is there budget for MOOE and Capital Outlay?

Hospital Maintenance and Depreciation Study Banzon E, Alcantara MGL, Diez MA, and Sayson LA. 2013
52
faced challenges from the poor management of the previous administration in terms of the maintenance and depreciation of capital assets. Missing records on capital assets inhibited the current administration to gauge its utilization. There was an instance that the allotment for repair and maintenance was almost zero. The hospital’s remedy was a small bulk of equipment purchase in the following year. They requested quotations (i.e. cost of the equipment, its maintenance,
allotted to the Maintenance and Other Operating Expenses (MOOE).

Hospital Maintenance and Depreciation Study Banzon E, Alcantara MGL, Diez MA, and Sayson LA. 2013
53
inspection) from the company that exclusively supplied the equipment. Allotting for preventive maintenance is a recent practice, thus the hospital implemented quarterly inspections which brought down the maintenance cost. Assessment of the maintenance cost of newly purchased equipment comes in the second year from its acquisition since the first year is under warranty. The wear and tear of the equipment (parts of the equipment that needs to

Hospital Maintenance and Depreciation Study Banzon E, Alcantara MGL, Diez MA, and Sayson LA. 2013
54
be replaced from time to time) comes in the third year from its acquisition. After that, it becomes an annual basis. Almost annually, the hospital changes the preventive maintenance cost of the equipment. The brand of the equipment (specifications in terms of sturdiness) is also a factor that affects the maintenance cost. In effect, these factors take a toll on the budgeting practice of the hospital. The hospital does not compute for the depreciation of their capital

Hospital Maintenance and Depreciation Study Banzon E, Alcantara MGL, Diez MA, and Sayson LA. 2013
55
assets as this is leveraged at the accounting office of the LGU. If the depreciation of the hospital’s equipment exceeds 10%, the LGU advises them to ask assistance from COA in condemning the equipment. The equipment of the hospital right now are already depreciated and should not be running anymore based on the prescribed COA standard. The hospital continues to allot for its maintenance since they cannot readily replace them.
Compliance to standards and prescribed
Yes. Yes, especially on budgeting for PS. One
Yes. Yes. Yes. Yes. Yes. Yes.

Hospital Maintenance and Depreciation Study Banzon E, Alcantara MGL, Diez MA, and Sayson LA. 2013
56
processes difficulty encountered in complying with the standards is on repair and maintenance where diagnosis is needed to justify funding for repair. Diagnosis and procurement usually take time, and may debilitate the functions of hospitals if the broken equipment takes major role in the operations of the hospital.
Does the hospital comply with the recommended budgeting and accounting standards prescribed by DBM and COA? If not, what are reasons for non-compliance? What modifications were done to the prescribed approach system? Are there existing difficulties in complying with the approach/system? Please describe.
Recommendations There should be a proper utilization of the budget approved to us. There is also a need to increase the budget.
There should be a proper utilization of the budget approved to us. There is also a need to increase the budget.
There should be a proper utilization of the budget approved to us. There is also a need to increase the budget.

Financial Report LGU Hospital 5
Hospital Maintenance and Depreciation Study Banzon E, Alcantara MGL, Diez MA, and Sayson LA. 2013
57
Annex 5. Individual Financial Reports
LGU Hospital 5
Hospital Costing Form: Total expenses and income-- Financial year 2012
Date:
6a.1 6a.2 6a.3 6a.4 6a.5
Expenses
Revenue Allotment (RA)/
Internal Revenue
Allotment (IRA) (peso)
Special Fund Income (peso)
Annual cost (peso) (reported in the official financial
statement/record)
Additional costs funded by other
income, sources, funds
Total annual cost (peso)
Personal Services
Salaries and Wages-Regular Pay 1,744,032.00 1,671,364.00
Salaries and Wages-Part Time Pay
Salaries and Wages-Casual
Personnel Economic Relief 192,000.00 192,000.00
Allowance (PERA)
Additional Compensation (ADCOM)
Representation Allowance (RA) 59,400.00 59,400.00
Transportation Allowance (TA) 59,400.00 59,400.00
Clothing Allowance 32,000.00 32,000.00
Honoraria
Hazard Pay 90,000.00 68,500.00
Overtime and Night Pay
Holiday Pay
Christmas Bonus
Cash Gift 40,000.00 40,000.00
Productivity Incentive Benefits 96,000.00 94,000.00
Other Bonuses and Allowances
Life and Retirement Insurance Contributions 209,284.00 191,843.52
PAG-IBIG Contributions 9,600.00 8,800.00
PHILHEALTH Contributions 18,150.00 16,637.50
ECC Contributions 8,996.00 8,246.37
Pension and Retirement Benefits
Terminal Leave Benefits

Financial Report LGU Hospital 5
Hospital Maintenance and Depreciation Study Banzon E, Alcantara MGL, Diez MA, and Sayson LA. 2013
58
Health Workers’ Benefits
Subsistence and Quarters’ Allowances 158,400.00 118,800.00
Longevity Pay
Other Personnel Benefits
Year-End Bonus 145,336.00 145,336.00
Subtotal 2,862,598.00 2,706,327.39
Maintenance and Operating Expenses
Traveling Expenses-Local
Traveling Expenses-Foreign
Training and Seminar Expenses 50,000.00 20,400.00
Telephone/Telegraph and Internet 50,000.00 17,005.18
Telephone-Landline
Postage and Deliveries
Subscription Expenses
Advertising Expenses
Insurance Expense
Fidelity Bond Premium
Printing and Binding Expenses
Office Supplies Expenses 100,000.00
Accountable forms expenses
Food supplies expenses
Drugs and medicines expenses 23,000,000.00 22,944,620.00
Medical, Dental and Laboratory supplies expenses
1,000,000.00 553,600.00
Gasoline, Oil and Lubricants Expenses
Other supplies expenses 500,000.00 44,400.00
Water expenses 300,000.00 138,542.73
Electricity expenses 600,000.00 478,621.60
Cooking gas expenses
Membership dues and contributions to organizations
Transportation and Delivery expenses
Enironment.Sanitary expenses
General services
Janitorial services
Security services

Financial Report LGU Hospital 5
Hospital Maintenance and Depreciation Study Banzon E, Alcantara MGL, Diez MA, and Sayson LA. 2013
59
Other professional services
Repairs and Maintenance-Building
Repairs and Maintenance-Office equipment
Repairs and Maintenance-Furniture and Fixtures
Repairs and Maintenance-IT equipment and software
Repairs and Maintenance-Communication equipment
Repairs and Maintenance-Medical, dental and Laboratory equipment
Repairs and Maintenance-Other mashineries and equipment
Repairs and Maintenance-Motor vehicles
Taxes, duties and licenses
Other Repairs and Maintenance
Awards and Indemnities
Rewards and Other Claims
Grants and Donations
Representation Expense
Extraordinary and Miscellaneous Expenses
Confidential and Intelligence Expenses
Anti-insurgency/Contingency Expenses
Depreciation- Office equipment
Depreciation- Furniture and fixtures
Depreciation- IT equipment
Depreciation- Communication equpment
Depreciation- Hospital equipment
Depreciation- Medical, dental and Laboratory equipment
Depreciation- Other machineries and equipment
Depreciation- Motor vehicles
Other MOOE 150,000.00 12,400.00
Subtotal 25,750,000.00 24,209,589.51
TOTAL 28,612,598.00 26,915,916.90
0.9477

Financial Report LGU Hospital 5
Hospital Maintenance and Depreciation Study Banzon E, Alcantara MGL, Diez MA, and Sayson LA. 2013
60
Sources of Revenue for the year
6b.1
Source of income income
1.0 DOH/LGU subsidy income
2.0 Philhealth reimbursement
3.0 Hospital business income:
3.1. Fees/charges:
Clearance and certification fees
Medical, Dental, and Laboratory fees
Other service income
Hospital fees
3.2. Rent income
3.3. Other business income
4.0 Income from grant and donations
3.4. Sales revenue
3.5. Cost of goods sold
3.6. Fines and penalties
3.7. Sale of disposed assets
5.0 Other (Specify):
Affiliation fee
Total Revenue

Financial Report LGU Hospital 3
Hospital Maintenance and Depreciation Study Banzon E, Alcantara MGL, Diez MA, and Sayson LA. 2013
61
LGU Hospital 2
Hospital Costing Form: Total expenses and income-- Financial year 2012
Date:
6a.1 6a.2 6a.3 6a.4 6a.5
Expenses
Revenue Allotment (RA)/
Internal Revenue
Allotment (IRA) (peso)
Special Fund Income (peso)
Annual cost (peso) (reported in the official financial
statement/record)
Additional costs funded by other
income, sources, funds
Total annual cost (peso)
Personal Services
Salaries and Wages-Regular Pay 3,066,240.00 2,936,111.67
Salaries and Wages-Part Time Pay
Salaries and Wages-Casual 1,118,628.00 941,538.00
`
Personnel Economic Relief
Allowance (PERA) 552,000.00 534,181.81
Additional Compensation (ADCOM)
Representation Allowance (RA) 115,000.00
Transportation Allowance (TA) 240,381.81
Clothing Allowance 115,000.00 32,073.86
Honoraria 34,500.00
Hazard Pay 448,876.00
Overtime and Night Pay
Holiday Pay
Christmas Bonus
Cash Gift 115,000.00 402,168.24
Productivity Incentive Benefits 46,000.00
Other Bonuses and Allowances 348,739.00
25,725.04
Life and Retirement Insurance Contributions 502,185.00

Financial Report LGU Hospital 3
Hospital Maintenance and Depreciation Study Banzon E, Alcantara MGL, Diez MA, and Sayson LA. 2013
62
335,503.88
PAG-IBIG Contributions 66,203.00 467,764.68
PHILHEALTH Contributions 52,311.00 26,800.00
ECC Contributions 27,600.00 45,400.50
Pension and Retirement Benefits
Terminal Leave Benefits
Health Workers’ Benefits
Subsistence and Quarters’ Allowances 248,400.00 40,000.00
Longevity Pay
Other Personnel Benefits (Year End Bonus) 113,750.00
Subtotal 6,741,682.00 6,256,399.49
Maintenance and Operating Expenses
Traveling Expenses-Local 200,000.00 85,621.00
Traveling Expenses-Foreign 170,000.00
Training and Seminar Expenses 31,405.00
Telephone/Telegraph and Internet 38,400.00
Telephone-Landline 32,977.33
Postage and Deliveries
Subscription Expenses 9,000.00 720.00
Advertising Expenses
Insurance Expense 13,500.00
Fidelity Bond Premium 1,125.00
Printing and Binding Expenses 10,000.00 9,000.00
Office Supplies Expenses 112,000.00 107,936.00
Accountable forms expenses
Food supplies expenses 270,000.00 180,000.00

Financial Report LGU Hospital 3
Hospital Maintenance and Depreciation Study Banzon E, Alcantara MGL, Diez MA, and Sayson LA. 2013
63
Drugs and medicines expenses 600,000.00
Medical, Dental and Laboratory supplies expenses 400,000.00
209,000.00
Gasoline, Oil and Lubricants Expenses 60,000.00
Other supplies expenses 15,000.00 8,850.00
Water expenses
Electricity expenses 360,000.00 409,901.75
0.1386
Cooking gas expenses 19,200.00 12,200.00
0.3073
Membership dues and cont. to organizations 5,000.00 1,460.00
Transportation and Delivery expenses
Enironment.Sanitary expenses 60,000.00
General services 60,000.00
Janitorial services
Security services
Other professional services 144,000.00 167,727.27
Repairs and Maintenance-Building
Repairs and Maintenance-Office equipment 10,000.00
Repairs and Maintenance-Furniture and Fixtures
Repairs and Maintenance-IT equipment and software
Repairs and Maintenance-Communication equipment
Repairs and Maintenance-Medical, dental and Laboratory equipment 7,000.00
Repairs and Maintenance-Other mashineries and equipment
7,000.00
Repairs and Maintenance-Motor vehicles
Taxes, duties and licenses 7,000.00 6,300.00
Other Repairs and Maintenance
Awards and Indemnities
Rewards and Other Claims

Financial Report LGU Hospital 3
Hospital Maintenance and Depreciation Study Banzon E, Alcantara MGL, Diez MA, and Sayson LA. 2013
64
Grants and Donations
Representation Expense
Extraordinary and Miscellaneous Expenses
Confidential and Intelligence Expenses
Anti-insurgency/Contingency Expenses
Depreciation- Office equipment
Depreciation- Furniture and fixtures
Depreciation- IT equipment
Depreciation- Communication equpment
Depreciation- Hospital equipment
Depreciation- Medical, dental and Laboratory equipment
Depreciation- Other machineries and equipment
Depreciation- Motor vehicles
Other MOOE 12,000.00 2,600.00
Repairs and Maintenance-Firefighting Equips & Acc.
7,000.00
2,529,100.00
1,333,823.35
TOTAL 9,270,782.00 7,590,222.84
0.2728 0.2372 0.1813
Sources of Revenue for the year
6b.1
Source of income income
1.0 DOH/LGU subsidy income 9,270,782.00
2.0 Philhealth reimbursement 997,262.93
3.0 Hospital business income: 1,741,545.65
3.1. Fees/charges:
Clearance and certification fees
Medical, Dental, and Laboratory fees
Other service income
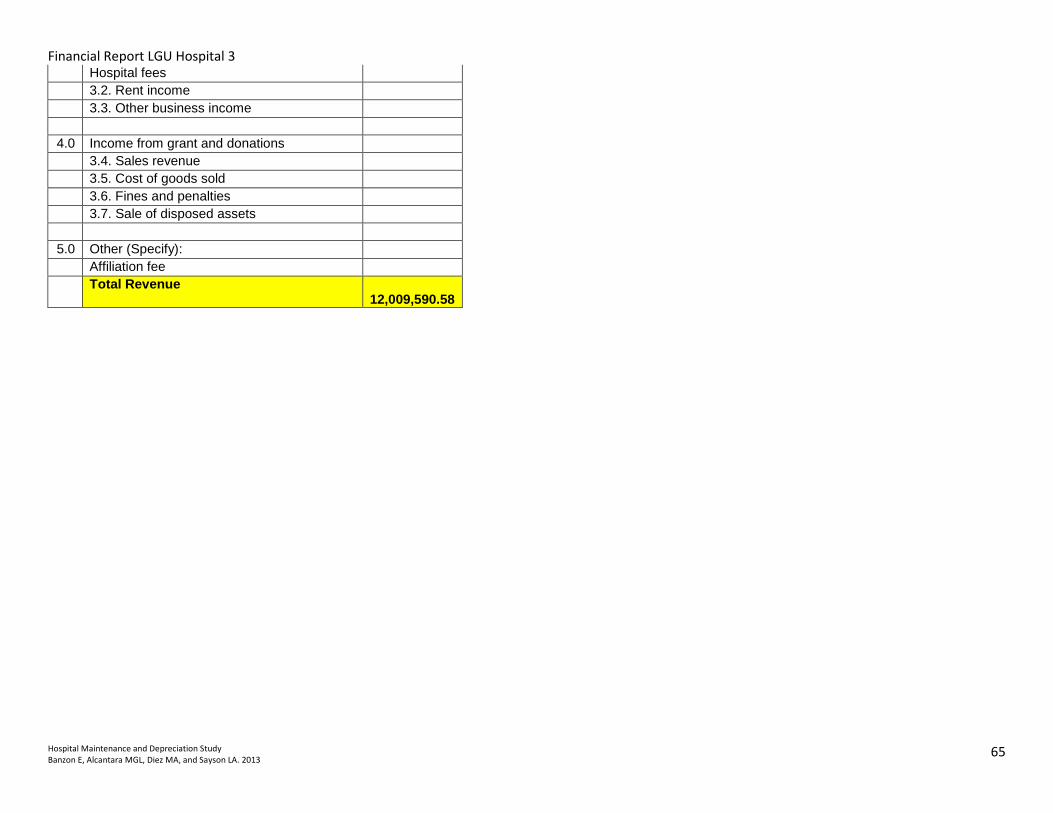
Financial Report LGU Hospital 3
Hospital Maintenance and Depreciation Study Banzon E, Alcantara MGL, Diez MA, and Sayson LA. 2013
65
Hospital fees
3.2. Rent income
3.3. Other business income
4.0 Income from grant and donations
3.4. Sales revenue
3.5. Cost of goods sold
3.6. Fines and penalties
3.7. Sale of disposed assets
5.0 Other (Specify):
Affiliation fee
Total Revenue 12,009,590.58

Financial Report LGU Hospital 6
Hospital Maintenance and Depreciation Study Banzon E, Alcantara MGL, Diez MA, and Sayson LA. 2013
66
LGU Hospital 6
Hospital Costing Form: Total expenses and income-- Financial year 2012
Date:
6a.1 6a.2 6a.3 6a.4 6a.5
Expenses RA/IRA, in
pesos
Special Fund Income, in
pesos
Annual cost, peso (reported in the official financial
statement/record)
Additional costs funded by other
income, sources, funds
Total annual cost, in pesos
Personal Services
Salaries and Wages-Regular Pay 14,154,810.50
Salaries and Wages-Part Time Pay
Salaries and Wages-Casual 37,406,560.25
`
Personnel Economic Relief 6,743,468.85
Allowance (PERA)
Additional Compensation (ADCOM)
Representation Allowance (RA) 210,000.00
Transportation Allowance (TA) 210,000.00
Clothing Allowance 1,362,500.00
Honoraria
Hazard Pay
Overtime and Night Pay
Holiday Pay
Christmas Bonus 2,849,336.00
Cash Gift 1,379,000.00
Productivity Incentive Benefits 96,000.00
Other Bonuses and Allowances
Life and Retirement Insurance 6,077,889.28

Financial Report LGU Hospital 6
Hospital Maintenance and Depreciation Study Banzon E, Alcantara MGL, Diez MA, and Sayson LA. 2013
67
Contributions
PAG-IBIG Contributions 359,500.00
PHILHEALTH Contributions 589,625.00
ECC Contributions 340,165.23
Pension and Retirement Benefits
Terminal Leave Benefits
Health Workers’ Benefits
Subsistence and Quarters’ Allowances
Longevity Pay
Other Personnel Benefits 4,165,864.87
Maintenance and Operating Expenses
Traveling Expenses-Local
Traveling Expenses-Foreign
Training and Seminar Expenses 57,200.00
Telephone/Telegraph and Internet 11,976.00
Telephone-Landline 229,171.72
Postage and Deliveries
Subscription Expenses
Advertising Expenses
Insurance Expense
Fidelity Bond Premium
Printing and Binding Expenses 27,624.00
Office Supplies Expenses 651,095.55
Accountable forms expenses
Food supplies expenses 2,430,417.00
Drugs and medicines expenses
Medical, Dental and Laboratory supplies expenses 16,239,755.55
Gasoline, Oil and Lubricants Expenses 94,542.62
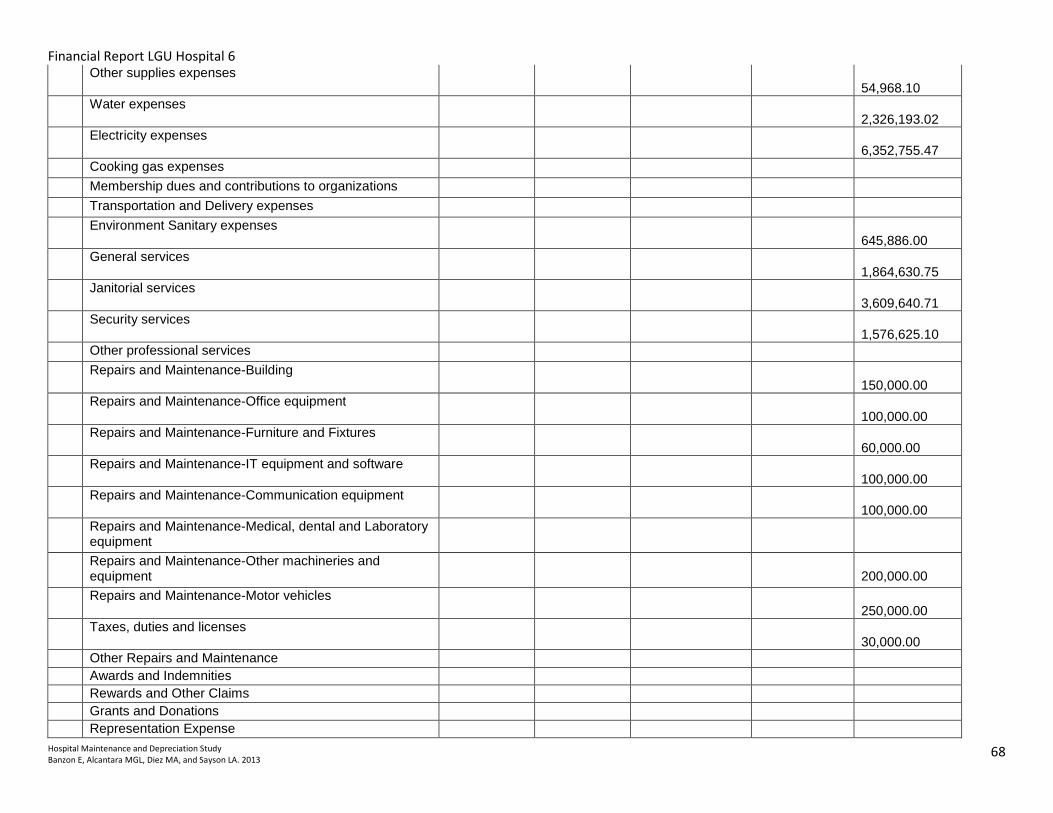
Financial Report LGU Hospital 6
Hospital Maintenance and Depreciation Study Banzon E, Alcantara MGL, Diez MA, and Sayson LA. 2013
68
Other supplies expenses 54,968.10
Water expenses 2,326,193.02
Electricity expenses 6,352,755.47
Cooking gas expenses
Membership dues and contributions to organizations
Transportation and Delivery expenses
Environment Sanitary expenses 645,886.00
General services 1,864,630.75
Janitorial services 3,609,640.71
Security services 1,576,625.10
Other professional services
Repairs and Maintenance-Building 150,000.00
Repairs and Maintenance-Office equipment 100,000.00
Repairs and Maintenance-Furniture and Fixtures 60,000.00
Repairs and Maintenance-IT equipment and software 100,000.00
Repairs and Maintenance-Communication equipment 100,000.00
Repairs and Maintenance-Medical, dental and Laboratory equipment
Repairs and Maintenance-Other machineries and equipment
200,000.00
Repairs and Maintenance-Motor vehicles 250,000.00
Taxes, duties and licenses 30,000.00
Other Repairs and Maintenance
Awards and Indemnities
Rewards and Other Claims
Grants and Donations
Representation Expense

Financial Report LGU Hospital 6
Hospital Maintenance and Depreciation Study Banzon E, Alcantara MGL, Diez MA, and Sayson LA. 2013
69
Extraordinary and Miscellaneous Expenses
Confidential and Intelligence Expenses
Anti-insurgency/Contingency Expenses
Depreciation- Office equipment
Depreciation- Furniture and fixtures
Depreciation- IT equipment
Depreciation- Communication equipment
Depreciation- Hospital equipment
Depreciation- Medical, dental and Laboratory equipment
Depreciation- Other machineries and equipment
Depreciation- Motor vehicles
Other MOOE
TOTAL
Sources of Revenue for the year 6b.1
Source of income income
1.0 DOH/LGU subsidy income
2.0 Philhealth reimbursement
3.0 Hospital business income:
3.1. Fees/charges:
Clearance and certification fees
Medical, Dental, and Laboratory fees
Other service income
Hospital fees
3.2. Rent income
3.3. Other business income
4.0 Income from grant and donations
3.4. Sales revenue
3.5. Cost of goods sold
3.6. Fines and penalties
3.7. Sale of disposed assets

Financial Report LGU Hospital 6
Hospital Maintenance and Depreciation Study Banzon E, Alcantara MGL, Diez MA, and Sayson LA. 2013
70
5.0 Other (Specify):
Affiliation fee
Total Revenue

Financial Report LGU Hospital 3
Hospital Maintenance and Depreciation Study Banzon E, Alcantara MGL, Diez MA, and Sayson LA. 2013
71
LGU Hospital 3
Hospital Costing Form: Total expenses and income-- Financial year 2012
Date:
6a.1 6a.2 6a.3 6a.4 6a.5
Expenses
Revenue Allotment (RA)/
Internal Revenue
Allotment (IRA) (peso)
Special Fund Income (peso)
Annual cost (peso) (reported in the official financial
statement/record)
Additional costs funded by other
income, sources, funds
Total annual cost (peso)
Personal Services
Salaries and Wages-Regular Pay 4,475,217.6
Salaries and Wages-Part Time Pay
Salaries and Wages-Casual 2,244,085.0
Personnel Economic Relief
Allowance (PERA) 888,000.0
Additional Compensation (ADCOM)
Representation Allowance (RA)
Transportation Allowance (TA)
Clothing Allowance 170,000.0
Honoraria
Hazard Pay 676,529.4
Overtime and Night Pay
Holiday Pay
Christmas Bonus 570,966.0
Cash Gift 190,000.0
Productivity Incentive Benefits 68,000.0
Other Bonuses and Allowances
Life and Retirement Insurance
Contributions 799,247.2
PAG-IBIG Contributions 44,400.0
PHILHEALTH Contributions 78,037.5
ECC Contributions 43,061.1
Pension and Retirement Benefits
Terminal Leave Benefits
Health Workers’ Benefits

Financial Report LGU Hospital 3
Hospital Maintenance and Depreciation Study Banzon E, Alcantara MGL, Diez MA, and Sayson LA. 2013
72
Subsistence and Quarters’ Allowances 399,600.0
Longevity Pay
Other Personnel Benefits 55,000.0
Subtotal 10,702,143.9
Maintenance and Operating Expenses
Traveling Expenses-Local 32,300.0
Traveling Expenses-Foreign
Training and Seminar Expenses 28,100.0
Telephone/Telegraph and Internet
Telephone-Landline 3,788.0
Postage and Deliveries
Subscription Expenses
Advertising Expenses
Insurance Expense
Fidelity Bond Premium 5,962.5
Printing and Binding Expenses 9,336.0
Office Supplies Expenses 153,549.2
Accountable forms expenses
Food supplies expenses 480,000.0
Drugs and medicines expenses
Medical, Dental and Laboratory supplies expenses
192,000.0
Gasoline, Oil and Lubricants Expenses
Other supplies expenses
Water expenses
Electricity expenses 645,088.8
Cooking gas expenses 6,208.0
Membership dues and contributions to organizations
2,600.0
Transportation and Delivery expenses
Environment .Sanitary expenses
General services
Janitorial services
Security services
Other professional services 883,636.0
Repairs and Maintenance-Building
Repairs and Maintenance-Office equipment

Financial Report LGU Hospital 3
Hospital Maintenance and Depreciation Study Banzon E, Alcantara MGL, Diez MA, and Sayson LA. 2013
73
Repairs and Maintenance-Furniture and Fixtures
Repairs and Maintenance-IT equipment and software
Repairs and Maintenance-Communication equipment
Repairs and Maintenance-Medical, dental and Laboratory equipment
Repairs and Maintenance-Other mashineries and equipment
Repairs and Maintenance-Motor vehicles
Taxes, duties and licenses
Other Repairs and Maintenance 5,600.0
Awards and Indemnities
Rewards and Other Claims
Grants and Donations
Representation Expense
Extraordinary and Miscellaneous Expenses
Confidential and Intelligence Expenses
Anti-insurgency/Contingency Expenses
Depreciation- Office equipment
Depreciation- Furniture and fixtures
Depreciation- IT equipment
Depreciation- Communication equipment
Depreciation- Hospital equipment
Depreciation- Medical, dental and Laboratory equipment
Depreciation- Other machineries and equipment
Depreciation- Motor vehicles
Other MOOE
Subtotal 2,448,168.4
TOTAL 13,150,312.24
Sources of Revenue for the year
6b.1
Source of income income

Financial Report LGU Hospital 3
Hospital Maintenance and Depreciation Study Banzon E, Alcantara MGL, Diez MA, and Sayson LA. 2013
74
1.0 DOH/LGU subsidy income 13,150,312.24
2.0 Philhealth reimbursement
3.0 Hospital business income:
3.1. Fees/charges:
Clearance and certification fees
Medical, Dental, and Laboratory fees
Other service income
Hospital fees 2,449,344.70
3.2. Rent income
3.3. Other business income
4.0 Income from grant and donations
3.4. Sales revenue
3.5. Cost of goods sold
3.6. Fines and penalties
3.7. Sale of disposed assets
5.0 Other (Specify):
Affiliation fee
Total Revenue 15,599,656.94

Financial Report LGU Hospital 1
Hospital Maintenance and Depreciation Study Banzon E, Alcantara MGL, Diez MA, and Sayson LA. 2013
75
LGU Hospital 4 Cover Page
Hospital Costing Form: Total expenses and income-- Financial year 2012
Date:
6a.1 6a.2 6a.3 6a.4 6a.5
Expenses RA/IRA, in pesos Special Fund Income, in
pesos
Annual cost, peso (reported in the official financial
statement/record)
Additional costs funded by other
income, sources, funds
Total annual cost, in pesos
Personal Services
Salaries and Wages-Regular Pay 35,752,696.24
Salaries and Wages-Part Time Pay 6,553,787.72
Salaries and Wages-Casual 1,958,800.23
`
Personnel Economic Relief 4,013,281.61
Allowance (PERA) 0.00
Additional Compensation (ADCOM)
Representation Allowance (RA) 77,600.00
Transportation Allowance (TA) 0.00
Clothing Allowance 827,500.00
Honoraria 0.00
Hazard Pay 3,115,007.06
Overtime and Night Pay
Holiday Pay
Christmas Bonus 3,108,175.00
Cash Gift 835,750.00
Productivity Incentive Benefits 331,000.00
Other Bonuses and Allowances 1,880,000.00
Life and Retirement Insurance
Contributions 4,415,679.11
PAG-IBIG Contributions 200,400.00
PHILHEALTH Contributions 413,852.61
ECC Contributions 192,721.38
Pension and Retirement Benefits
Terminal Leave Benefits 1,031,786.45
Health Workers’ Benefits 0.00

Financial Report LGU Hospital 1
Hospital Maintenance and Depreciation Study Banzon E, Alcantara MGL, Diez MA, and Sayson LA. 2013
76
Subsistence and Quarters’ Allowances 2,104,399.08
Longevity Pay 0.00
Other Personnel Benefits 1,525,410.66
Subtotal 68,337,847.15
Maintenance and Operating Expenses
Traveling Expenses-Local 134,926.76
Traveling Expenses-Foreign
Training and Seminar Expenses 131,750.00
Telephone/Telegraph and Internet 28,820.36
Telephone-Landline 244,016.91
Postage and Deliveries 12,509.00
Subscription Expenses
Advertising Expenses 1,500.00
Insurance Expense 588,473.62
Fidelity Bond Premium 20,250.00
Printing and Binding Expenses
Office Supplies Expenses 1,827,628.30
Accountable forms expenses 334,890.60
Food supplies expenses 4,479,793.86
Drugs and medicines expenses 8,801,204.28
Medical, Dental and Laboratory supplies expenses 17,408,058.71
Gasoline, Oil and Lubricants Expenses 1,805,712.98
Other supplies expenses 1,218,884.63
Water expenses 903,000.00
Electricity expenses 8,494,841.39
Cooking gas expenses 247,447.25
Membership dues and contributions to organizations
Transportation and Delivery expenses
Enironment.Sanitary expenses
General services
Legal Services 72,000.00
Janitorial services 40,611.90
Security services 1,017,370.55
Other professional services 213,974.75
Repairs and Maintenance-Building

Financial Report LGU Hospital 1
Hospital Maintenance and Depreciation Study Banzon E, Alcantara MGL, Diez MA, and Sayson LA. 2013
77
Repairs and Maintenance-Office equipment
Repairs and Maintenance-Furniture and Fixtures
Repairs and Maintenance-IT equipment and software
Repairs and Maintenance-Communication equipment
Repairs and Maintenance-Hospital equipment 17,905.00
Repairs and Maintenance-Medical, dental and Laboratory equipment
Repairs and Maintenance-Other mashineries and equipment
Repairs and Maintenance-Motor vehicles 86,694.64
Taxes, duties and licenses 129,530.58
Other Repairs and Maintenance
Awards and Indemnities
Rewards and Other Claims
Grants and Donations
Representation Expense
Extraordinary and Miscellaneous Expenses
Confidential and Intelligence Expenses
Anti-insurgency/Contingency Expenses
Depreciation - Office Buildings 1,363,370.40
depreciation - Other Structures 116,201.02
Depreciation- Office equipment 64,250.56
Depreciation- Furniture and fixtures 941,570.01
Depreciation- IT equipment 225,410.63
Depreciation - Library Books 405.12
Depreciation- Communication equpment 2,961.00
Depreciation- Hospital equipment 8,225,011.23
Depreciation- Medical, dental and Laboratory equipment
Depreciation- Other machineries and equipment 29,433.72
Depreciation- Motor vehicles 222,744.24
Depreciation- Other Property, Plant and Equipment 34,730.64
Other MOOE 1,352,205.65
Subtotal 60,840,090.29
TOTAL 0.00 0.00 129,177,937.44 0.00
Sources of Revenue for the year 6b.1
Source of income income

Financial Report LGU Hospital 1
Hospital Maintenance and Depreciation Study Banzon E, Alcantara MGL, Diez MA, and Sayson LA. 2013
78
1.0 DOH/LGU subsidy income 41,078,788.26
2.0 Philhealth reimbursement
3.0 Hospital business income:
3.1. Fees/charges:
Clearance and certification fees
Medical, Dental, and Laboratory fees 60,346,880.82
Other service income 11,984.03
Hospital fees 33,273,925.79
3.2. Rent income 136,395.10
3.3. Other business income
4.0 Income from grant and donations 11,967,583.00
3.4. Sales revenue
3.5. Cost of goods sold
3.6. Fines and penalties
3.7. Sale of disposed assets (3,490.32)
5.0 Other (Specify):
Affiliation fee
Interest Income 170,278.24
Total Revenue 146,982,344.92

Financial Report LGU Hospital 1
Hospital Maintenance and Depreciation Study Banzon E, Alcantara MGL, Diez MA, and Sayson LA. 2013
79
LGU Hospital 1 Cover Page
Hospital Costing Form: Total expenses and income-- Financial year 2012
Date:
6a.1 6a.2 6a.3 6a.4 6a.5
Expenses RA/IRA, in pesos Special Fund Income, in
pesos
Annual cost, peso (reported in the official financial
statement/record)
Additional costs funded by other
income, sources, funds
Total annual cost, in pesos
Personal Services
Salaries and Wages-Regular Pay 72,365,437.20
Salaries and Wages-Part Time Pay
Salaries and Wages-Casual 13,636,022.30
Personnel Economic Relief Allowance (PERA) 10,141,267.40
Additional Compensation (ADCOM)
Representation Allowance (RA) 133,500.00
Transportation Allowance (TA)
Clothing Allowance 2,161,000.00
Honoraria
Hazard Pay 9,445,369.60
Overtime and Night Pay 255,313.70
Holiday Pay
Christmas Bonus 7,304,234.50
Cash Gift 2,156,875.00
Productivity Incentive Benefits 816,444.40
Other Bonuses and Allowances
Life and Retirement Insurance Contributions 10,458,792.10
PAG-IBIG Contributions

Financial Report LGU Hospital 1
Hospital Maintenance and Depreciation Study Banzon E, Alcantara MGL, Diez MA, and Sayson LA. 2013
80
539,187.50
PHILHEALTH Contributions 982,565.00
ECC Contributions 501,716.20
Pension and Retirement Benefits
Terminal Leave Benefits 1,651,209.80
Health Workers’ Benefits
Subsistence and Quarters’ Allowances 5,192,828.60
Longevity Pay 1,762,500.00
Other Personnel Benefits 11,916,184.50
Subtotal 151,420,447.80
Maintenance and Operating Expenses
Traveling Expenses-Local 652,914.10
Traveling Expenses-Foreign 13,417.80
Training and Seminar Expenses 648,944.00
Telephone/Telegraph and Internet 28,752.00
Telephone-Landline 393,469.00
Postage and Deliveries
Subscription Expenses 5,750.00
Advertising Expenses
Insurance Expense 136,552.70
Fidelity Bond Premium 12,000.00
Printing and Binding Expenses 330,037.30
Office Supplies Expenses 2,042,537.00
Accountable forms expenses
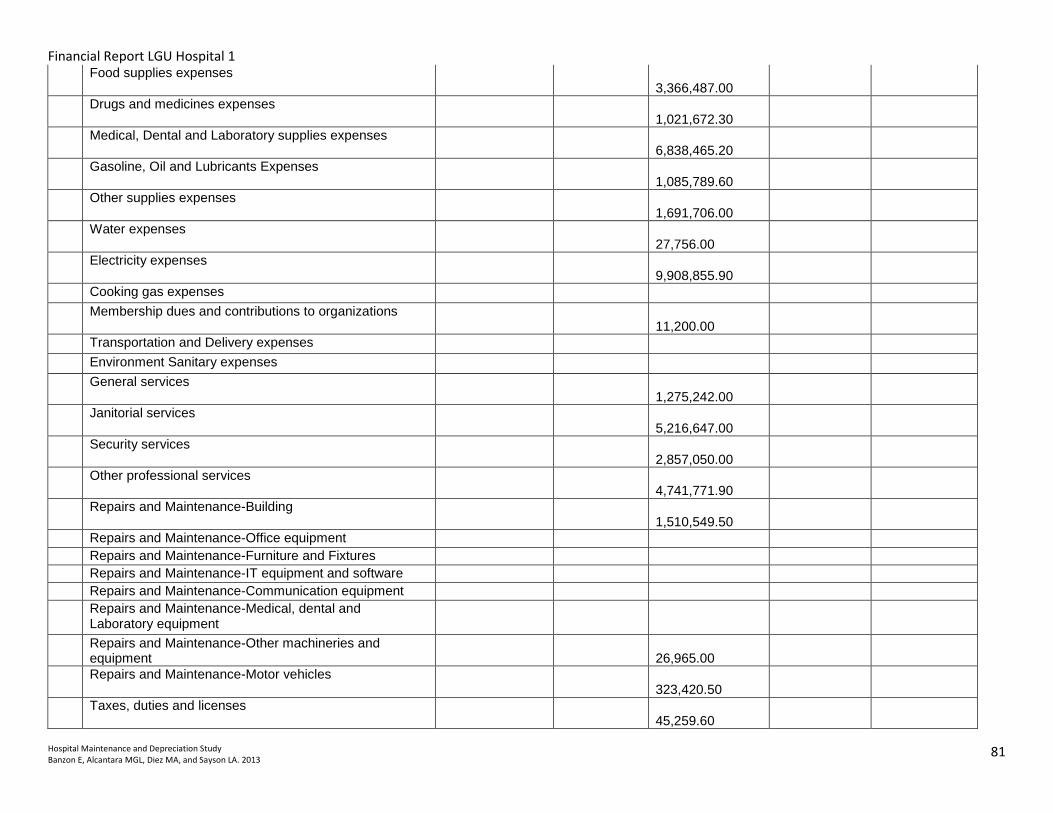
Financial Report LGU Hospital 1
Hospital Maintenance and Depreciation Study Banzon E, Alcantara MGL, Diez MA, and Sayson LA. 2013
81
Food supplies expenses 3,366,487.00
Drugs and medicines expenses 1,021,672.30
Medical, Dental and Laboratory supplies expenses 6,838,465.20
Gasoline, Oil and Lubricants Expenses 1,085,789.60
Other supplies expenses 1,691,706.00
Water expenses 27,756.00
Electricity expenses 9,908,855.90
Cooking gas expenses
Membership dues and contributions to organizations 11,200.00
Transportation and Delivery expenses
Environment Sanitary expenses
General services 1,275,242.00
Janitorial services 5,216,647.00
Security services 2,857,050.00
Other professional services 4,741,771.90
Repairs and Maintenance-Building 1,510,549.50
Repairs and Maintenance-Office equipment
Repairs and Maintenance-Furniture and Fixtures
Repairs and Maintenance-IT equipment and software
Repairs and Maintenance-Communication equipment
Repairs and Maintenance-Medical, dental and Laboratory equipment
Repairs and Maintenance-Other machineries and equipment
26,965.00
Repairs and Maintenance-Motor vehicles 323,420.50
Taxes, duties and licenses 45,259.60

Financial Report LGU Hospital 1
Hospital Maintenance and Depreciation Study Banzon E, Alcantara MGL, Diez MA, and Sayson LA. 2013
82
Other Repairs and Maintenance
Awards and Indemnities
Rewards and Other Claims
Grants and Donations
Representation Expense 9,480.00
Extraordinary and Miscellaneous Expenses
Confidential and Intelligence Expenses
Anti-insurgency/Contingency Expenses
Depreciation- Office equipment 4,638,946.72
Depreciation- Furniture and fixtures 1,530,138.30
Depreciation- IT equipment 3,831,756.28
Depreciation- Communication equipment 208,158.07
Depreciation- Hospital equipment 2,528,371.88
Depreciation- Medical, dental and Laboratory equipment 9,588,253.32
Depreciation- Other machineries and equipment 3,021,531.46
Depreciation- Motor vehicles 4,898,174.78
Other MOOE 29,074,556.20
Scholarship Expenses 118,872.00
Telephone-Mobile 55,150.70
Rent Expenses 89,900.00
Legal Services 1,200.00
Consultancy Services 200,000.00
Repairs and Maintenance-Hospital equipment
2,580.00
Repairs and Maintenance-Firefighting equipment and accessories
77,040.00
Depreciation-Land Improvement

Financial Report LGU Hospital 1
Hospital Maintenance and Depreciation Study Banzon E, Alcantara MGL, Diez MA, and Sayson LA. 2013
83
1,752,077.50
Depreciation-Hospital & health Center 17,628,611.12
Depreciation-Other Structures 183,963.51
Depreciation-Other Property, Plant & Equipment
319,764.39
Subtotal 123,971,737.63
TOTAL 1,816,431,762.00 426,812,633.23
Sources of Revenue for the year 6b.1
Source of income income
1.0 DOH/LGU subsidy income 3,192,116.5
2.0 Philhealth reimbursement
3.0 Hospital business income:
3.1. Fees/charges: 6,117,929.0
Clearance and certification fees
Medical, Dental, and Laboratory fees 22,593,785.3
Other service income
Hospital fees
3.2. Rent income 84,000.0
3.3. Other business income
4.0 Income from grant and donations
3.4. Sales revenue
3.5. Cost of goods sold
3.6. Fines and penalties
3.7. Sale of disposed assets
5.0 Other (Specify):
Laboratory (sent out) 1,563,417.7
Medical Services of America- (MSA) outsource 8,067,551.2
Blood Bank 6,292,582.1
OPD Patient's Card 342,535.5
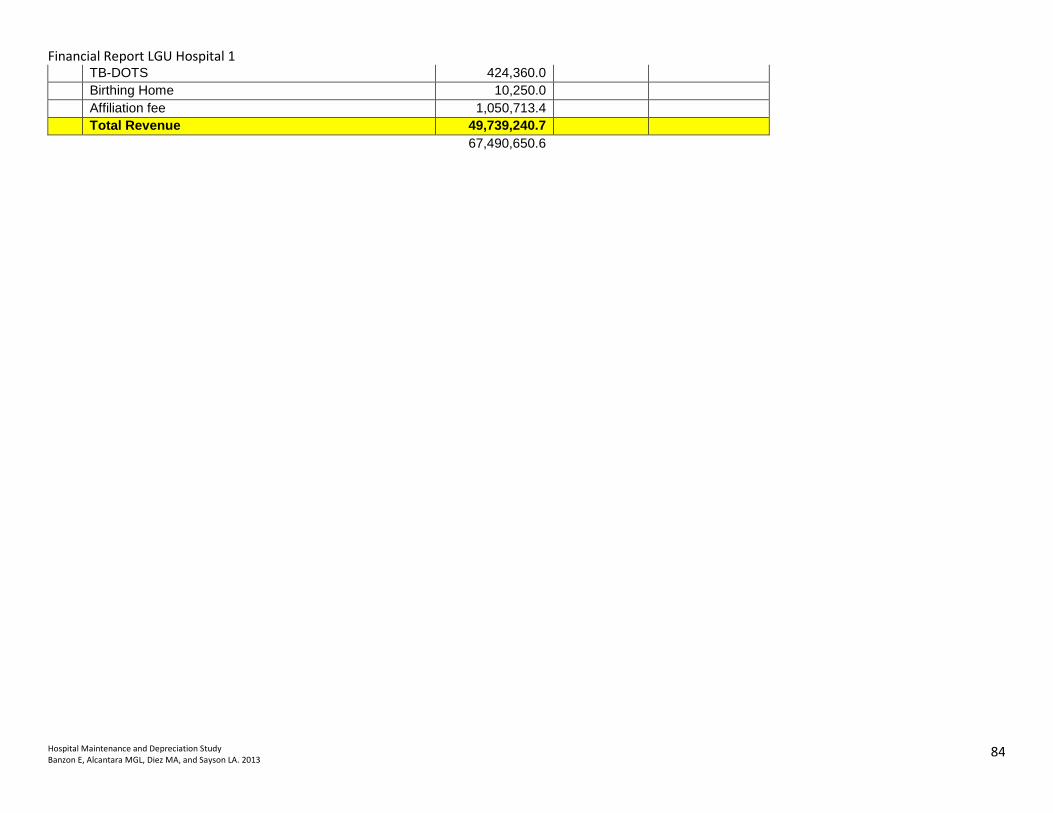
Financial Report LGU Hospital 1
Hospital Maintenance and Depreciation Study Banzon E, Alcantara MGL, Diez MA, and Sayson LA. 2013
84
TB-DOTS 424,360.0
Birthing Home 10,250.0
Affiliation fee 1,050,713.4
Total Revenue 49,739,240.7
67,490,650.6

Financial Report DOH Hospital 2
Hospital Maintenance and Depreciation Study Banzon E, Alcantara MGL, Diez MA, and Sayson LA. 2013
85
DOH Hospital 1
Hospital Costing Form: Total expenses and income-- Financial year 2012
Date:
6a.1 6a.2 6a.3 6a.4 6a.5
Expenses RA/IRA, in pesos Special Fund Income, in
pesos
Annual cost, peso (reported in the official financial
statement/record)
Additional costs funded by other
income, sources, funds
Total annual cost, in pesos
Personal Services
Salaries and Wages-Regular Pay
70,419,878.79
Salaries and Wages-Part Time Pay
Salaries and Wages-Casual
Personnel Economic Relief Allowance (PERA) 7,374,363.86
Additional Compensation (ADCOM)
Representation Allowance (RA) 126,185.71
Transportation Allowance (TA) 84,567.83
Clothing Allowance 1,579,500.00
Honoraria
Hazard Pay 6,020.00
Overtime and Night Pay (227,751.94)
Holiday Pay
Christmas Bonus
Cash Gift 1,511,437.50
Productivity Incentive Benefits 566,000.00
Other Bonuses and Allowances
Life and Retirement Insurance Contributions 8,695,669.23
PAG-IBIG Contributions 403,500.00
PHILHEALTH Contributions 793,250.00
ECC Contributions 432,716.86

Financial Report DOH Hospital 2
Hospital Maintenance and Depreciation Study Banzon E, Alcantara MGL, Diez MA, and Sayson LA. 2013
86
Pension and Retirement Benefits
Terminal Leave Benefits 25,258.74
Health Workers’ Benefits
Subsistence and Quarters’ Allowances 4,376,945.00
Longevity Pay 219,231.82
Other Personnel Benefits Year-End Bonus 6,192,238.66
Sub-total 101,568,580.00
102,579,012.06
Maintenance and Operating Expenses
Traveling Expenses-Local 232,336.01
Traveling Expenses-Foreign
Training and Seminar Expenses 313,440.99
Telephone/Telegraph and Internet 31,870.00
Telephone-Landline 108,891.89
Postage and Deliveries
Subscription Expenses
Advertising Expenses 44,520.00
Insurance Expense 33,420.82
Fidelity Bond Premium 540,498.75
Printing and Binding Expenses
Office Supplies Expenses 487,186.07
Accountable forms expenses 953,270.00
Food supplies expenses 3,091,293.83
Drugs and medicines expenses 605,921.62
Medical, Dental and Laboratory supplies expenses 1,815,039.64

Financial Report DOH Hospital 2
Hospital Maintenance and Depreciation Study Banzon E, Alcantara MGL, Diez MA, and Sayson LA. 2013
87
Gasoline, Oil and Lubricants Expenses 629,475.39
Other supplies expenses 940,266.92
Water expenses 5,357,171.19
Electricity expenses 6,166,203.73
Cooking gas expenses 709,200.00
Membership dues and contributions to organizations 4,149.77
Transportation and Delivery expenses
Enironment.Sanitary expenses
General services
Janitorial services 470,441.67
Security services 2,577,206.10
Other professional services - 200 beds implementation 785,224.84
Other professional services - admin support 1,447,783.66
Repairs and Maintenance-Building Hospital Health Center 181,466.35
Repairs and Maintenance-Office equipment 36,000.00
Repairs and Maintenance-Furniture and Fixtures
Repairs and Maintenance-IT equipment and software
Repairs and Maintenance-Communication equipment
Repairs and Maintenance-Medical, dental and Laboratory equipment
Repairs and Maintenance-Other mashineries and equipment
Repairs and Maintenance-Motor vehicles 274,060.21
Taxes, duties and licenses
Other Repairs and Maintenance
Awards and Indemnities
Rewards and Other Claims
Grants and Donations
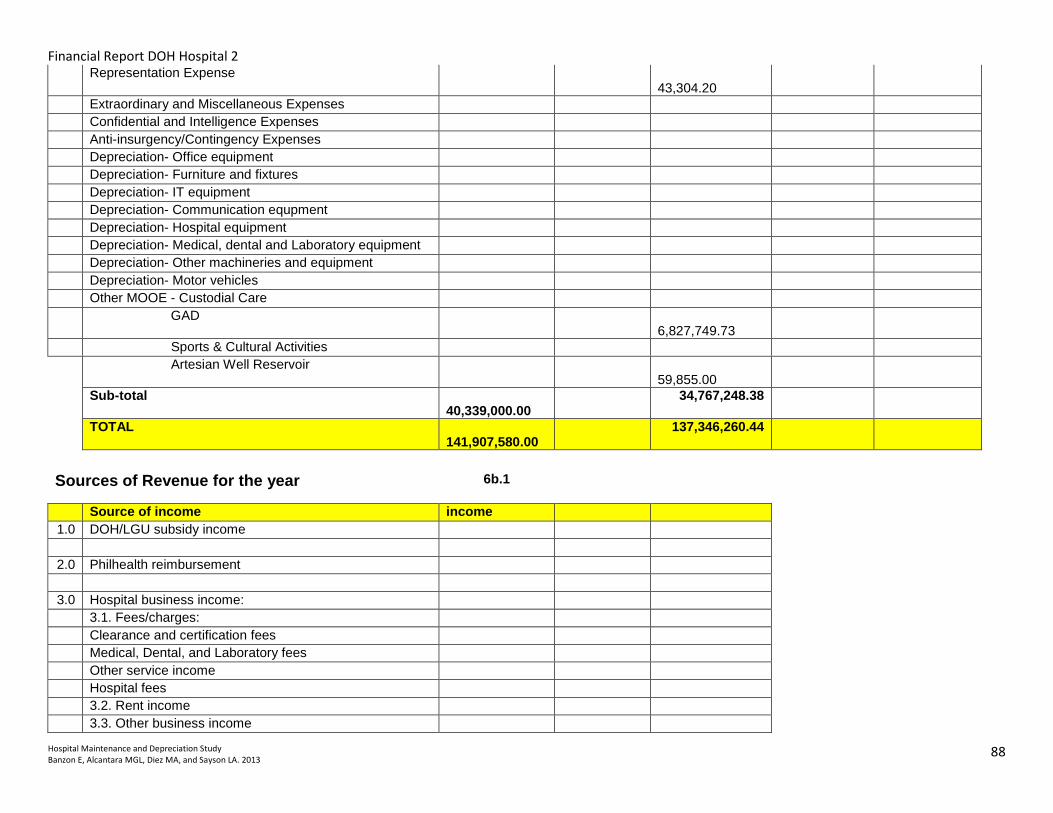
Financial Report DOH Hospital 2
Hospital Maintenance and Depreciation Study Banzon E, Alcantara MGL, Diez MA, and Sayson LA. 2013
88
Representation Expense 43,304.20
Extraordinary and Miscellaneous Expenses
Confidential and Intelligence Expenses
Anti-insurgency/Contingency Expenses
Depreciation- Office equipment
Depreciation- Furniture and fixtures
Depreciation- IT equipment
Depreciation- Communication equpment
Depreciation- Hospital equipment
Depreciation- Medical, dental and Laboratory equipment
Depreciation- Other machineries and equipment
Depreciation- Motor vehicles
Other MOOE - Custodial Care
GAD 6,827,749.73
Sports & Cultural Activities
Artesian Well Reservoir 59,855.00
Sub-total 40,339,000.00
34,767,248.38
TOTAL 141,907,580.00
137,346,260.44
Sources of Revenue for the year 6b.1
Source of income income
1.0 DOH/LGU subsidy income
2.0 Philhealth reimbursement
3.0 Hospital business income:
3.1. Fees/charges:
Clearance and certification fees
Medical, Dental, and Laboratory fees
Other service income
Hospital fees
3.2. Rent income
3.3. Other business income

Financial Report DOH Hospital 2
Hospital Maintenance and Depreciation Study Banzon E, Alcantara MGL, Diez MA, and Sayson LA. 2013
89
4.0 Income from grant and donations
3.4. Sales revenue
3.5. Cost of goods sold
3.6. Fines and penalties
3.7. Sale of disposed assets
5.0 Other (Specify):
Affiliation fee
Total Revenue

Financial Report DOH Hospital 2
Hospital Maintenance and Depreciation Study Banzon E, Alcantara MGL, Diez MA, and Sayson LA. 2013
90
DOH Hospital 2
Hospital Costing Form: Total expenses and income-- Financial year 2012
Date:
6a.1 6a.2 6a.3 6a.4 6a.5
Expenses RA/IRA, in pesos Special Fund
Income, in pesos
Annual cost, peso (reported in the official
financial statement/record)
Additional costs funded by other
income, sources, funds
Total annual cost, in pesos
Personal Services
Salaries and Wages-Regular Pay 73,089,733.08
73,089,733.08
Salaries and Wages-Part Time Pay -
Salaries and Wages-Casual 212,496.00
212,496.00
` -
Personnel Economic Relief 7,066,043.09
7,066,043.09
Allowance (PERA) -
Additional Compensation (ADCOM) -
Representation Allowance (RA) 131,000.00
131,000.00
Transportation Allowance (TA) 131,000.00
131,000.00
Clothing Allowance 1,491,559.14
1,491,559.14
Honoraria - -
Hazard Pay 902,514.80
902,514.80
Overtime and Night Pay - -
Holiday Pay - -
Christmas Bonus 6,033,672.00
6,033,672.00
Cash Gift 1,508,937.50
1,508,937.50
Productivity Incentive Benefits 601,600.00
601,600.00
Other Bonuses and Allowances - -
Life and Retirement Insurance -

Financial Report DOH Hospital 2
Hospital Maintenance and Depreciation Study Banzon E, Alcantara MGL, Diez MA, and Sayson LA. 2013
91
Contributions 10,309,906.38
10,309,906.38
PAG-IBIG Contributions 376,200.00
376,200.00
PHILHEALTH Contributions 629,412.50
629,412.50
ECC Contributions 373,727.46
373,727.46
Pension and Retirement Benefits - -
Terminal Leave Benefits 222,117.75
222,117.75
Health Workers’ Benefits -
Subsistence and Quarters’ Allowances 5,006,174.95
5,006,174.95
Longevity Pay -
Other Personnel Benefits 268,286.65
268,286.65
Sub-total 108,354,381.30
108,354,381.30
-
Maintenance and Operating Expenses -
Traveling Expenses-Local 611,524.56
175,571.56
175,571.56
Traveling Expenses-Foreign -
Training and Seminar Expenses 148,000.00
65,400.00
65,400.00
Telephone/Telegraph and Internet -
Telephone-Landline 205,268.66
138,885.54
138,885.54
Telephone-Mobile 213,800.00
213,800.00
Postage and Deliveries - -
Subscription Expenses 64,512.00
64,512.00
Advertising Expenses 67,032.00
- -
Auditing Services 18,998.00
-
Insurance Expense 820,208.44
105,617.31
105,617.31
Fidelity Bond Premium 17,625.00
145,518.75
145,518.75

Financial Report DOH Hospital 2
Hospital Maintenance and Depreciation Study Banzon E, Alcantara MGL, Diez MA, and Sayson LA. 2013
92
Printing and Binding Expenses - -
Office Supplies Expenses 4,752,430.68
916,699.86
916,699.86
Accountable forms expenses 534,000.00
-
Food supplies expenses 8,524,034.00
1,631,601.75
1,631,601.75
Drugs and medicines expenses 1,189,231.00
2,142,518.68
46,363,670.26
48,506,188.94
Medical, Dental and Laboratory supplies expenses 39,352,468.70
1,759,506.74
1,759,506.74
Gasoline, Oil and Lubricants Expenses 430,295.40
236,997.50
236,997.50
Other supplies expenses 3,239,784.84
300,569.40
300,569.40
Water expenses - -
Electricity expenses 13,514,174.41
497,444.31
497,444.31
Cooking gas expenses 536,673.25
289,144.75
289,144.75
Membership dues and contributions to organizations 23,300.00
49,000.00
49,000.00
Transportation and Delivery expenses - -
Enironment.Sanitary expenses - -
General services - -
Janitorial services - -
Security services 1,199,685.00
720,000.00
720,000.00
Other professional services 11,497,795.60
- -
Repairs and Maintenance-Building 894,266.80
493,272.50
493,272.50
Repairs and Maintenance-Office equipment 21,028.00
21,028.00
Repairs and Maintenance-Furniture and Fixtures - -
Repairs and Maintenance-IT equipment and software - -
Repairs and Maintenance-Communication equipment - -
Repairs and Maintenance-Medical, dental and Laboratory equipment
1,324,125.00
319,704.83
319,704.83
Repairs and Maintenance-Other mashineries and equipment
295,806.35
182,649.60
182,649.60

Financial Report DOH Hospital 2
Hospital Maintenance and Depreciation Study Banzon E, Alcantara MGL, Diez MA, and Sayson LA. 2013
93
Repairs and Maintenance-Motor vehicles 12,583.49
12,583.49
Taxes, duties and licenses -
Other Repairs and Maintenance -
Awards and Indemnities -
Rewards and Other Claims -
Grants and Donations -
Representation Expense -
Extraordinary and Miscellaneous Expenses -
Confidential and Intelligence Expenses -
Anti-insurgency/Contingency Expenses -
Depreciation- Office equipment -
Depreciation- Furniture and fixtures -
Depreciation- IT equipment -
Depreciation- Communication equpment -
Depreciation- Hospital equipment -
Depreciation- Medical, dental and Laboratory equipment -
Depreciation- Other machineries and equipment -
Depreciation- Motor vehicles -
Other MOOE 12,135,766.25
15,390,492.76
30,773,235.75
46,163,728.51
Sub-total 101,332,493.94
25,872,519.33
77,136,906.01
103,009,425.34
TOTAL 101,332,493.94
134,226,900.63
77,136,906.01
211,363,806.64
Sources of Revenue for the year 6b.1
Source of income income
1.0 DOH/LGU subsidy income 2,557,869.88
2.0 Philhealth reimbursement 138,517,801.80
3.0 Hospital business income:
3.1. Fees/charges:
Clearance and certification fees 28,685.00

Financial Report DOH Hospital 2
Hospital Maintenance and Depreciation Study Banzon E, Alcantara MGL, Diez MA, and Sayson LA. 2013
94
Medical, Dental, and Laboratory fees 28,722,254.39
Other service income -
Hospital fees 31,913,266.88
3.2. Rent income 377,097.80
3.3. Other business income 283,376.46
4.0 Income from grant and donations
3.4. Sales revenue (net of COGS) 20,318,942.43
3.5. Cost of goods sold
3.6. Fines and penalties 47,200.00
3.7. Sale of disposed assets
5.0 Other (Specify):
Affiliation fee 392,967.00
Total Revenue 223,159,461.64