analysis of the national infrastructure and construction pipeline … · analysis of the national...
TRANSCRIPT

Analysis of the National Infrastructure and Construction Pipeline
6 December 2017
Reporting to Cabinet Office and HM Treasury
Analysis of the National Infrastructure and Construction Pipeline
6 December 2017
This report is also available on the IPA website: www.gov.uk/IPA

© Crown copyright 2017 Produced by the Infrastructure and Projects Authority
You may re-use this information (excluding logos) free of charge in any format or medium, under the terms of the Open Government Licence. To view this licence, visit http://www.nationalarchives.gov.uk/doc/open-government-licence/ or email: [email protected]
Where we have identified any third party copyright material you will need to obtain permission from the copyright holders concerned.
Alternative format versions of this report are available on request from [email protected]
Contents 3
Contents
Ministerial Foreword 5
Chief Executive Foreword 6
Summary 8
Analysis of the 2017 pipeline 11
Projected investment over the next 10 years 16
Regional analysis of investment in the pipeline from 2017/18 to 2020/21 18
Sector overview 21
Transport 22
Energy 26
Utilities 29
Digital Infrastructure 32
Flood and Coastal Erosion 34
Science and Research 36
Social Infrastructure 38
Annex A: Methodology and assumptions used for 10 year projection of investment 42
Annex B: Methodology used for regional analysis of investment to 2020/21 43
Annex C: Devolved infrastructure investment 47
Annex D: Priority projects progress report 48
Table A – Current priority investments in the National Infrastructure Delivery Plan 2016 – 2021 49
Table B – Current priorities still in development 53
Table C – Historic priorities listed in pre-2016 National Infrastructure Plans 54

4 Analysis of the National Infrastructure and Construction Pipeline
Ordsall Chord, Greater Manchester

Ministerial Foreword 5
Infrastructure has the power to increase our living standards, drive economic growth and boost productivity. This government is building an economy that is fit for the future by investing for the long-term. We have put infrastructure at the heart of our economic plan and it is a central pillar of the Industrial Strategy. The UK is at the forefront of infrastructure delivery around the world.
We are investing at record levels. The Institute for Fiscal Studies has suggested that public sector capital investment is to increase to levels not sustained in 40 years.
The 2017 update to the National Infrastructure and Construction Pipeline sets out details of over £460 billion of planned infrastructure investment across the public and private sectors. Looking across the next ten years, we project total public and private investment in infrastructure to be around £600 billion.
For our investment to be realised we need delivery of complex infrastructure projects on time and on budget. This requires long-term decision making, significant capital investment and a renewed focus on our priorities. We have already taken steps to improve our delivery framework. The creation of the National Infrastructure Commission and the Infrastructure and Projects Authority (IPA) were significant steps towards ensuring we make the right long-term investment decisions and then deliver those investments as effectively as possible.
We are already seeing results in our strong delivery record, which we should be proud of. More than 4,500 infrastructure projects have been delivered since 2010 and 98% of our 158 long-term national priority projects are complete or on track to deliver.
This government will continue to take steps to deliver our pipeline more efficiently. Alongside this report the IPA has launched a new, long-term change programme, Transforming Infrastructure Performance, to improve the delivery and performance of UK infrastructure.
We are doing more, spending more and we are better organised than ever before. That means we have greater expectations from our investment, including more efficient methods of delivery, to speed up the pace of delivery and generate better outcomes for taxpayers. I ask that businesses and investors skill up and scale up in order to meet this rising demand. Doing so will mean we will have the confidence to deliver our future pipeline and see investment continue to flow for the next 10 years and beyond.
Andrew Jones MP Exchequer Secretary to the Treasury
Ministerial Foreword

6 Analysis of the National Infrastructure and Construction Pipeline
Since 2011, the government has published a regularly updated pipeline of infrastructure projects. This year, the pipeline not only sets out more than £460 billion of committed spend but also takes into account government plans to sustain investment long-term, as demonstrated by the decision to give the National Infrastructure Commission a fiscal remit of 1 to 1.2% of GDP.
This means that overall we estimate the next decade will see around £600 billion of public and private investment in infrastructure. This should give industry, and all parts of the supply chain, the confidence they need to support government and businesses with the delivery of future projects.
If we want to make the most of this investment over the long-term, we have to make sure we deliver these projects on time and on budget. Our excellent track record of delivery shows that we can do this. Since the first National Infrastructure Plan was published, government has identified 158 priority projects, 98% of which have been completed or are on track to deliver. Only three priority projects were stopped following reassessment. These are just a subset of over 4,500 infrastructure projects successfully delivered since 2010.
However, there is always room to improve. The IPA has a unique role to play. We are an organisation made up in large part of industry and commercial experts that sits at the centre of government. We can look across the infrastructure landscape and take steps to maximise performance.
Publishing a regularly updated pipeline and monitoring our national priority projects are part of a suite of initiatives from the IPA to do just that. We are also kick-starting a long-term change programme, Transforming Infrastructure Performance, which will begin to tackle the £15 billion productivity gap we see in construction every year and ensure we are making the most out of this increased investment.
The programme will include establishing a new benchmarking unit to help us select the right projects and challenge high costs; we are also adopting a new presumption in favour of offsite construction by 2019 so, as the sector’s biggest client, we can set the industry on a path of greater modernisation.
Our ambition is to significantly change the way we plan, procure and deliver infrastructure so we can deliver the outcomes for society that we all know infrastructure can provide. Above all else, I believe the pipeline and our analysis demonstrates that this investment is real – not a wish list – and translates into real projects on the ground, with tangible benefits for the public.
Tony MeggsChief Executive, Infrastructure and Projects Authority
Chief Executive Foreword

Chief Executive Foreword 7
More than
4,500private and public infrastructure projects successfully delivered since 2010
98% of the long-term national priority infrastructure projects since 2010 have been completed, or are on track to deliver
Around
£600billion
of projected public and private investment over the next 10 years
£460billion
of planned projects in the pipeline, including over £240 billion to be invested by 2020/21
projects, programmes and other investments in the pipeline
Nearly
700
8 Analysis of the National Infrastructure and Construction Pipeline
1.1 The government has prioritised public and private infrastructure investment through significant spending commitments and putting in place the right policy framework to give investors and the supply chain confidence to commit to long-term projects. The 2017 update to the National Infrastructure and Construction Pipeline sets out details of infrastructure and construction investment across the public and private sectors. This has been regularly updated since the first pipeline was published in 2011. This report is published alongside the pipeline data to provide an overview of investment trends in the pipeline.1
1.2 The IPA committed to provide regular updates on the progress of national priority projects identified in the National Infrastructure Delivery Plan (NIDP) 2016-2021. This report provides an update on these priorities and sets out the country’s record of infrastructure delivery since 2010.
Future Investment1.3 As in previous years, we are publishing a pipeline of investment in announced projects, programmes and spending commitments. The 2017 pipeline sets out over £460 billion of planned investment, of which over £240 billion will occur in the next four years.2
1.4 This pipeline of planned investment alone is not a comprehensive picture of likely investment over the longer-term, because government capital budgets and future price control periods for the regulated utilities have not yet been set for the period beyond 2020/21. For this reason, we also provide a 10 year projection of around £600 billion of public and private investment, covering the period 2017/18 to 2026/27.
1.5 The 10 year projection is based on planned investment from the 2017 pipeline and uses this to estimate likely future investment. This view is supplemented by the fiscal remit given to the National Infrastructure Commission for public investment in economic infrastructure. The full methodology for the projection is set out in Annex A.
1.6 The combination of the 2017 pipeline and the 10 year projection supports industry to plan its short and medium term investment, by providing detailed information for planned projects alongside a more comprehensive view of infrastructure investment over ten years.
Delivery record1.7 To support the delivery of its objectives, the government has set out its list of top priority infrastructure projects and programmes. This enables the government to focus on the delivery of those investments, which are the most critical elements of its infrastructure plans for the country. The strong delivery record on these public and private projects and programmes since 2010 demonstrates the benefits of this focus.
1.8 There have been 158 projects and programmes designated as national priorities for the government since 2010. The government has updated this list as new priorities have emerged, or projects have been completed. All of the priority projects and programmes are
1 https://www.gov.uk/government/publications/national-infrastructure-and-construction-pipeline-20172 All pipeline figures and analyses have been completed in 2016/17 prices.
Summary

Summary 9
on track to deliver, except three that are not proceeding following reassessment.3 Over 30% of the 158 priorities are now complete; 40% are under construction or part of a programme4 being delivered now; and the remainder are in the earlier stages of development. The full list of priority projects and programmes is set out in the final section of this report.
1.9 Many more projects have been delivered since 2010. Over 4,500 infrastructure projects across the UK have been completed successfully.5 These range from major, nationally significant projects such as Birmingham New Street Station and extending access to superfast broadband across the UK, to smaller local schemes that have made a huge impact on the communities they serve, such as the Nottingham Trent left bank flood alleviation scheme. The sector pages of this document include progress updates on the priority projects and programmes set out in the NIDP 2016-2021, and also set out the UK’s strong track record of delivering infrastructure since 2010.
3 These were two carbon capture and storage projects and the Leeds New Generation Transportation project.4 This refers to programmes which are a series of linked projects in different stages of delivery, typically with
some in planning, some under construction, and some nearing completion or complete. Earlier stages of development include scoping, planning, and seeking the necessary legal and stakeholder consents.
5 This figure includes projects listed in updates provided to the IPA, and its predecessor bodies, by Government Departments as part of IPA’s work tracking infrastructure delivery. This is not an exhaustive list of all infrastructure projects delivered in the UK, across all sectors, since 2010.

10 Analysis of the National Infrastructure and Construction Pipeline
Projects and programmes delivered since 2010This map sets out a selection of projects and programmes undertaken across English regions since 2010. This includes a number of priority projects.
SOUTH EAST AND LONDON:SOUTH WEST:
MIDLANDS ENGINE:
EAST OF ENGLAND:
NORTHERN POWERHOUSE:● Ordsall Chord Rail Link● Hartree Centre for High
Performance Computing● Mersey Gateway Bridge
● M1 Junction 10-13 improvements
● The first subsidy free solar farm located in Clay Hill
● New north rail terminal at the Port of Felixstowe
● Improved access to Torbay and South Devon via the A380 Kingskerswell Bypass Devon
● Says Court Farm Solar Park● Reinstating the Dawlish Rail line
● Lee Tunnel preventing sewage overflow into the Thames
● The Francis Crick Institute for biomedical research
● M3 J2-4A Smart Motorway scheme
● Refurbishment of Birmingham New Street station
● M5 junctions 4A-6 Smart Motorway scheme
● Nottingham Trent left bank flood alleviation scheme

Analysis of the 2017 pipeline 11
2.1 The total value of public and private investment in the pipeline, across economic and social infrastructure, is over £460 billion.6 This covers 294 individual projects; 335 programmes; and 65 other investments, which have been committed but not yet allocated to specific projects or programmes.
Investment in the pipeline from 2017/18 to 2020/212.2 Over £240 billion of planned investment in the pipeline will be delivered by 2020/21, which is the last year in the government’s 2015 Spending Review and the end of some of the current regulatory periods for the utilities sector. The pipeline includes infrastructure investments made at Autumn Budget 2017, including through the National Productivity Investment Fund (NPIF). The NPIF, launched in Autumn Statement 2016, targets funding at three areas critical to improving productivity: economic infrastructure, housing and research and development.
2.3 For some sectors the pipeline will be an underestimate of actual investment. This is particularly the case for the year 2020/21, when, for example, the regulatory control period for water will have come to an end in the preceding year. Future control periods are in development and have not yet been announced, so are not reflected in the pipeline. The profile of investment in all sectors, up to 2020/21, is set out in the graph below and this reflects the likely underestimate in the year 2020/21. Detailed investment profiles are set out in the sector pages.
6 In this report economic infrastructure includes Transport, Energy, Utilities, Digital Communications, Science and Research, Flood and Coastal Erosion. This is different to the definition of economic infrastructure in the National Infrastructure Commission’s fiscal remit, which only includes public investment in Transport, Flood and Coastal Erosion, Digital Communications and Waste. The definition used in the NIC’s fiscal remit is followed in this report in the 10 year projection of investment, as set out in Annex A. In this report, social infrastructure includes Defence, Justice and Security, Education, Healthcare, and Housing and regeneration.
Analysis of the 2017 pipeline

12 Analysis of the National Infrastructure and Construction Pipeline
Chart 1: Investment in the pipeline 2017/18 – 2020/21 by sector (£bn)
£0
£10
£20
£30
£40
£50
£60
£70
£80
2017/18 2018/19 2019/20 2020/21
£62.5 £63.4 £63.4
£55.4
TransportEnergyUtilitiesSocial Infrastructure
Digital infrastructureScience and researchFlood and coastal erosion
2.4 The following table shows the value of investment in each sector in the pipeline between 2017/18 and 2020/21. The full breakdown can be found in the pipeline workbook.7
Table 1: Annual profile of pipeline investment by sector
Sector (£bn) 2017/18 2018/19 2019/20 2020/21 Total 2017/18 to 2020/21
Transport £18.7 £19.3 £19.7 £20.7 £78.5
Energy £14.1 £14.0 £15.1 £13.9 £57.1
Utilities £13.0 £13.5 £12.8 £8.4 £47.7
Social Infrastructure £10.9 £11.7 £10.7 £9.9 £43.1
Digital infrastructure £4.1 £3.1 £3.0 £0.7 £10.8
Science and research £1.3 £1.2 £1.4 £1.2 £5.1
Flood and coastal erosion £0.5 £0.6 £0.5 £0.6 £2.3
Total £62.5 £63.4 £63.4 £55.4 £244.7
Investment in the pipeline beyond 2020/212.5 Around £220 billion of planned investment in the pipeline will be delivered after 2020/21. This includes, for example, long-term programmes, such as High Speed 2, and Manchester Airport’s £1 billion transformation programme. After 2020/21 the pipeline also includes around £110 billion of electricity generation investment; part of this spend is on known projects – such as Hinkley Point C and Triton Knoll offshore windfarm – and part is based on the National Grid’s Future Energy Scenarios (FES).8
7 https://www.gov.uk/government/publications/national-infrastructure-and-construction-pipeline-20178 ‘Future Energy Scenarios’, National Grid, 2017.

Projects and programmes delivered since 2010 13
Chart 2: Investment in the pipeline beyond 2020/21 by sector (£bn)
£134.1
£1.0 Science and research£1.4 Flood and coastal erosion
£20.0
£56.8
Energy
£4.5 Social infrastructure
Utilities
Transport
Changes to the pipeline since December 20162.6 In this update, investment from 2016/17 of £55.5 billion has been removed from the pipeline. Investment in projects that have completed in the year 2017/18 to date has also been removed. Examples of projects already delivered this year include Ordsall Chord linking Manchester Victoria and Piccadilly stations, and the £800 million Burbo Bank Extension wind farm. New investment, including new projects and programmes, has been added.
Funding mix of the pipeline from 2017/18 to 2020/212.7 The UK has developed a mixed model to fund and finance its infrastructure, using both public and private investment to deliver infrastructure as efficiently as possible.9 The government continues to support private investment, including by broadening the scope of the £40 billion UK Guarantees Scheme, which has offered construction guarantees since June 2017.10
9 ‘National Infrastructure Delivery Plan Funding and Finance Supplement’, Infrastructure and Projects Authority, 2016.
10 https://www.gov.uk/guidance/uk-guarantees-scheme

14 Analysis of the National Infrastructure and Construction Pipeline
Chart 3: Funding mix of the pipeline 2017/18 to 2020/21 by sector (£bn)
£0 £10 £20 £30 £40 £50 £60 £70 £80 £90
Utilities
Transport
SocialInfrastructure
Science and Research
Flood andcoastal erosion
Energy
Digital infrastructure
Central Government Local Government
Mixed funding sourcePrivate
2.8 Over 45% of the pipeline to 2020/21 is funded and delivered by the private sector, of which 40% is in the regulated sectors. Chart 3 sets out the funding split of each sector of the pipeline to 2020/21.
2.9 Around half of the pipeline to 2020/21 is made up of public funding. Of this, around 90% is funded by central government.
2.10 Around 5% of the pipeline to 2020/21 is funded by a combination of public and private money. For example, the Digital Infrastructure Investment Fund is based on a partnership funding model, which encourages private investment. Chart 4 shows the funding split by year.
Chart 4: Funding mix of the pipeline 2017/18 to 2020/21 by year (£bn)11
2017/18 2018/19 2019/20 2020/21
£62.5 £63.4 £63.4
£55.4
0
10
20
30
40
50
60
70
Central Government Local Government
Mixed funding sourcePrivate
11 Mixed funding is classified as any combination of funding sources: Private and Local Government, Private and Central Government, Local and Central Government, or Private, Local and Central Government funding.

Projects and programmes in the pipeline 15
Projects and programmes in the pipelineThe map below sets out some of the infrastructure investments in the pipeline.
SOUTH EAST AND LONDON:
SCOTLAND, WALES AND NORTHERN IRELAND:
SOUTH WEST:
MIDLANDS ENGINE:
EAST OF ENGLAND:
NORTHERN POWERHOUSE:● The ongoing Northern Hub
improvements programme, increasing rail capacity across the north of England with faster and more frequent services connecting key towns and cities.
● New rolling stock for the Tyne and Wear metro, replacing old stock with modern energy-efficient trains.
● £243m of the new Transforming Cities Fund has been allocated to Greater Manchester, £134m to Liverpool and £59m for Tees Valley.
● The new town of Northstowe in Cambridgeshire will provide 10,000 new homes alongside a town centre.
● This year work began to upgrade the A14 between Ellington to the Milton junction on the Cambridge Northern Bypass, providing additional capacity to the region.
● £74 million of the new Transforming Cities Fund has been allocated to Cambridgeshire and Peterborough.
● The first major concrete was poured at Hinkley Point C in March 2017. Hinkley Point C will provide enough electricity to power nearly six million homes.
● Government will help to improve access to the A391 near St Austell by providing £79 million towards a new A30 link road, supporting housing development in the area.
● £80m from the new Transforming Cities Fund has been allocated to the West of England.
● Northern line extension to Battersea will help regenerate the Vauxhall, Nine Elms and Battersea areas.● Thames Estuary Flood protection programme, protecting 1.3m people.● Brighton and Sussex University Hospital trust investing to improve the patient experience and providing state of the
art facilities.
● The majority of infrastructure investment is devolved to each administration, but the pipeline includes a range of investments in non-devolved sectors (see Annex C for further information).
● The Wolverhampton Canalside and City Interchange project creating a modern railway station handling more than 4.7 million passengers a year.
● Upgrading the M1 junctions 13 to 19 to a Smart Motorway to relieve congestion and reduce journey times.
● £250 million of the new Transforming Cities Fundhas been allocated to the West Midlands
16 Analysis of the National Infrastructure and Construction Pipeline
Projected investment over the next 10 years3.1 This report sets out, for the first time, a projection of public and private infrastructure investment levels over the next 10 years. According to these projections, the IPA estimates total infrastructure investment over the next 10 years will be around £600 billion. This projection of total investment is provided because the planned investment included in the pipeline is not a complete picture of investment for the period after 2020/21, for two reasons.
3.2 Firstly, profiles have not been announced for many long-term programmes beyond 2020/21, even if the total capital budget has been agreed (for example, HS2).
3.3 Secondly, future price control periods for the regulated utilities and public long-term capital budgets have not yet been set. For example, the government will announce details of the second Roads Investment Strategy (RIS 2) in due course. Until its budget is confirmed, RIS 2 will not be added to the pipeline.
3.4 The 10 year projection is made up of three parts:
1. Over £240 billion of planned investment in the pipeline from 2017/18 to 2020/21.
2. Planned investment in the pipeline in the non-regulated utilities sector from 2021/22 to 2026/27.
3. Projections of investment across all sectors from 2021/22 to 2026/27, based on the National Infrastructure Commission’s fiscal remit for public investment in economic infrastructure;12 investment in electricity generation included in the pipeline; regulated utilities investment forecast by the industry regulator; and average planned investment in other sectors.
3.5 These projections indicate there will be around £350 billion of investment between 2020/21 and 2026/27. A full explanation of the methodology used to calculate the 10 year projection is in Annex A.
12 ‘Letter from the Chancellor to the National Infrastructure Commission’, HM Treasury, 2016.

Projected investment over the next 10 years 17
Chart 5: Around £600bn investment from 2017/18 to 2026/27 by sector
Economic infrastructure UtilitiesPrivate Social infrastructure
Economic infrastructure
Utilities
Private
Social infrastructure
£104bn
£216bn
£117bn
£160bn

18 Analysis of the National Infrastructure and Construction Pipeline
Regional analysis of investment in the pipeline from 2017/18 to 2020/214.1 This report provides an analysis of the distribution of infrastructure investment in the pipeline from 2017/18 to 2020/21 in each region of England. The analysis is as complete as possible based on the information available, but it is not exhaustive. A more detailed explanation of the methodology is in Annex B and an explanation of devolved responsibilities for infrastructure in Scotland, Wales and Northern Ireland is in Annex C.
Methodology4.2 Projects in the pipeline are primarily allocated to individual regions based on the location of the built asset, where the asset falls within one region. Many projects, however, cover multiple regions or are national programmes. For this reason, only a small portion of the pipeline in previous years could be allocated to regions.
4.3 The IPA has worked with other government departments and regulators to allocate a greater proportion of the pipeline to individual regions. Where it is not possible to allocate investment to specific regions based on the location of an asset, the IPA has applied methodology that allows investment in national and multi-region programmes to be divided appropriately between regions. Altogether this approach accounts for around 80% of the total value of investment in the pipeline from 2017/18 to 2020/21. A full explanation of the IPA’s methodology is given in Annex B.
Infrastructure investment across the regions4.4 Table 2 and Chart 6 below show the level of investment in infrastructure per person in each region in England between 2017/18 and 2020/21, based on the investment in the pipeline that it was possible to allocate to regions. The average level of infrastructure investment across each region is £3,393 per person. All regions are within 20% of this average. Further regional analysis of transport investment is set out in Annex B.

Regional analysis of investment in the pipeline from 2017/18 to 2020/21 19
Table 2: Per Capita Regional Investment by funding source 2017/18 to 2020/2113
Funding source
Region Central and local government Private Total
East of England £1,578 £1,635 £3,213
East Midlands £1,445 £1,782 £3,227
London £2,520 £1,513 £4,033
North East £1,347 £1,847 £3,194
North West £2,283 £1,403 £3,686
South East £1,815 £1,536 £3,351
South West £1,498 £2,274 £3,772
West Midlands £1,777 £1,320 £3,097
Yorkshire and the Humber £1,266 £1,695 £2,962
Chart 6: Per Capita Regional Investment by Funding Source (2017/18 to 2020/21)
Central Government
Transport for London (Equivalent local authority infrastructure investment for other regions is not included; therefore, it is difficult to make a meaningful comparison between London and other ONS regions.)
Private
£0
£500
£1,000
£1,500
£2,000
£2,500
£3,000
£3,500
£4,000
£4,500
£ pe
r cap
ita in
201
6/17
pric
es
London SouthWest
NorthWest
SouthEast
EastMidlands
East ofEngland
NorthEast
WestMidlands
Yorkshire andthe Humber
Limitations of the methodology4.5 This analysis provides a more complete picture of regional infrastructure investment than in previous pipelines. However it does not provide an exhaustive view. It only includes investment that is currently captured in the pipeline; for example, the pipeline does not currently include all local authority infrastructure investment outside of London or investment in rolling stock by train operating companies. There is also approximately 20% of the pipeline for which either we have not developed a regional allocation methodology yet, or the investment is in the devolved administrations or overseas.
13 Local authority investment, outside of London, on transport is only included in the pipeline where funding came from Central Government grants. Total investment in London includes investment by Transport for London, which, from 2017-18 onwards, received no direct central government funding.

20 Analysis of the National Infrastructure and Construction Pipeline
4.6 Measuring investment in each region based on the location of the asset does not always show where the benefits of infrastructure are felt across the whole country. In large part, this regional analysis does not capture the wider benefits of investment. For example, more than 60% of suppliers for Crossrail are based outside of London.

Sector overview 21
Sector overviewThe chart below shows more than £240 billion total investment in the pipeline from 2017/18 to 2020/21, split by sector. The following pages give further detail by sector of the planned and projected investment. They also include examples of the UK’s delivery record in infrastructure since 2010.
Chart 7: Investment in the Pipeline from 2017/18 to 2020/21 by sector (£bn)
Transport
£78.5bn
£57.1bn
£47.7bn
£43.1bn
Energy
Utilities
Social infrastructure
£10.8bn Digital infrastructure
£5.1bn Science and research
£2.3bn Flood and coastal erosion

22 Analysis of the National Infrastructure and Construction Pipeline
Transport
Over
1,100 transport projects have been completed since 2010
13 priority rail projects have been completed or are under construction, including High Speed 2
29 priority road projects have been completed or are under construction, including Mersey Gateway Bridge and the Smart Motorway schemes
Over
£135billion
of transport investment in the pipeline
Over
240planned transport projects and programmes in the pipeline

Regional analysis of investment in the pipeline from 2017/18 to 2020/21 23
Transport overview5.1 Modern transport infrastructure is essential to ensuring that the UK remains a competitive and strong economy. As well as improving capacity and relieving congestion, good transport infrastructure unlocks opportunities for regeneration and new housing development. This is why the government committed to a 50% increase in transport investment from 2015 to 2020, enabling the largest rail modernisation since the Victorian times and the biggest road investment programme since the 1970s.
Investment in the pipeline5.2 The pipeline contains over 240 transport projects, programmes and other investments with a total value of £135 billion, including £78 billion by 2021.
Table 3: Transport pipeline investment
Sub-sector Number of
ProjectsProgrammes and Other Investment
17/18 to 20/21 (£bn)
Beyond 20/21 (£bn)
Total Pipeline (£bn)
High Speed Rail 1 0 £13.4 £37.8 £51.2
Rail 12 19 £27.1 £11.2 £38.3
LA majors 22 72 £14.0 £3.0 £17.0
London 4 19 £7.7 £3.9 £11.6
Roads 67 11 £10.8 £0.2 £11.1
Airports 0 13 £4.9 £0.6 £5.5
Ports 1 1 £0.6 £0.0 £0.6
Total 107 135 £78.5 £56.8 £135.3
Chart 8: Transport investment from 2017/18 to 2020/21 split by sub-sector (£bn)
£0.0
£5.0
£10.0
£15.0
£20.0
£25.0
2017/18 2018/19 2019/20 2020/21
Rail High Speed Rail LA Majors Roads AirportsLondon Ports
£18.7 £19.3 £19.7£20.7
24 Analysis of the National Infrastructure and Construction Pipeline
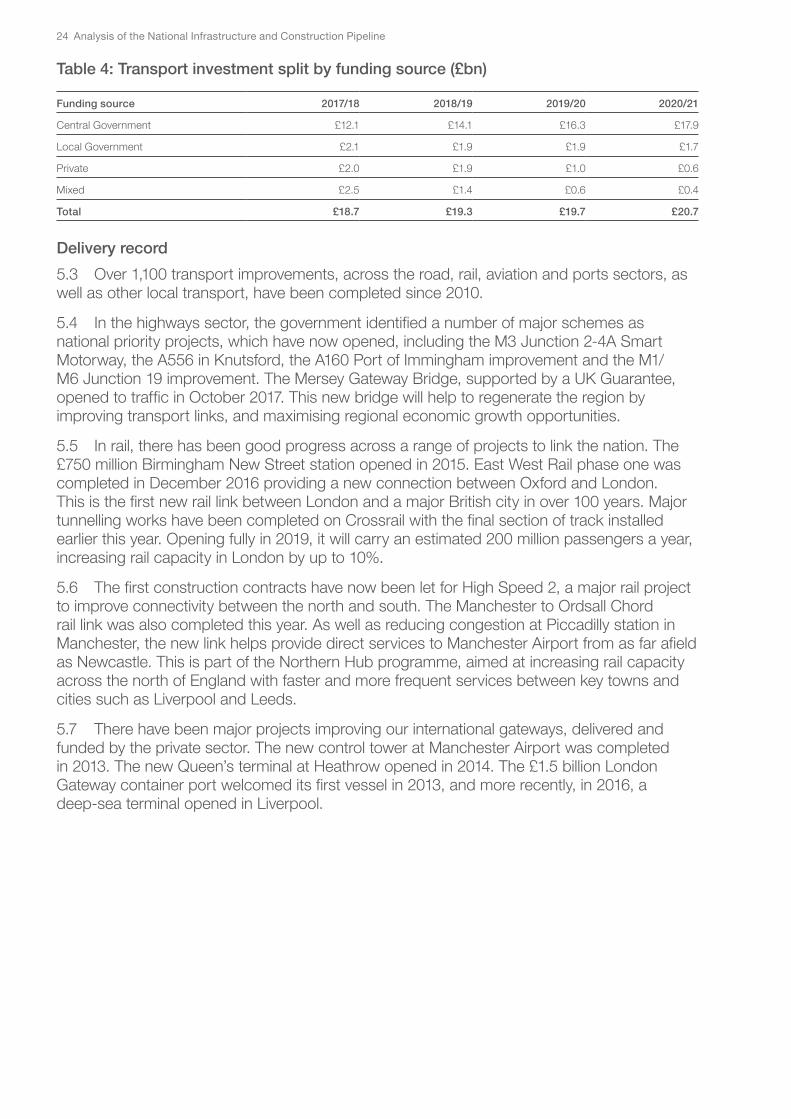
Table 4: Transport investment split by funding source (£bn)
Funding source 2017/18 2018/19 2019/20 2020/21
Central Government £12.1 £14.1 £16.3 £17.9
Local Government £2.1 £1.9 £1.9 £1.7
Private £2.0 £1.9 £1.0 £0.6
Mixed £2.5 £1.4 £0.6 £0.4
Total £18.7 £19.3 £19.7 £20.7
Delivery record5.3 Over 1,100 transport improvements, across the road, rail, aviation and ports sectors, as well as other local transport, have been completed since 2010.
5.4 In the highways sector, the government identified a number of major schemes as national priority projects, which have now opened, including the M3 Junction 2-4A Smart Motorway, the A556 in Knutsford, the A160 Port of Immingham improvement and the M1/M6 Junction 19 improvement. The Mersey Gateway Bridge, supported by a UK Guarantee, opened to traffic in October 2017. This new bridge will help to regenerate the region by improving transport links, and maximising regional economic growth opportunities.
5.5 In rail, there has been good progress across a range of projects to link the nation. The £750 million Birmingham New Street station opened in 2015. East West Rail phase one was completed in December 2016 providing a new connection between Oxford and London. This is the first new rail link between London and a major British city in over 100 years. Major tunnelling works have been completed on Crossrail with the final section of track installed earlier this year. Opening fully in 2019, it will carry an estimated 200 million passengers a year, increasing rail capacity in London by up to 10%.
5.6 The first construction contracts have now been let for High Speed 2, a major rail project to improve connectivity between the north and south. The Manchester to Ordsall Chord rail link was also completed this year. As well as reducing congestion at Piccadilly station in Manchester, the new link helps provide direct services to Manchester Airport from as far afield as Newcastle. This is part of the Northern Hub programme, aimed at increasing rail capacity across the north of England with faster and more frequent services between key towns and cities such as Liverpool and Leeds.
5.7 There have been major projects improving our international gateways, delivered and funded by the private sector. The new control tower at Manchester Airport was completed in 2013. The new Queen’s terminal at Heathrow opened in 2014. The £1.5 billion London Gateway container port welcomed its first vessel in 2013, and more recently, in 2016, a deep-sea terminal opened in Liverpool.

Regional analysis of investment in the pipeline from 2017/18 to 2020/21 25
Case Study: Birmingham New Street Station
Birmingham New Street Station
The success of our railways also brings challenges of growth. Birmingham New Street station was no longer fit for purpose, with more than twice the number of passengers it was designed for travelling through the station each year. Opened in 2015, the new station concourse is five times the size of the original station, topped with a striking triple height atrium. Grand Central, built above the station, is Birmingham’s newest shopping destination, with more than 60 new stores.
This project involved the use of 3D Building Information Modelling and lean construction techniques to test and streamline construction and installation sequences. The station now has an annual capacity of 55 million passengers.

26 Analysis of the National Infrastructure and Construction Pipeline
Over
1,900
Over
100
Over£57billion
Energy
energy projects have been completed since 2010
Construction of the first new nuclear project in a generation is now underway at Hinkley Point C
Since 2010, over 30GW of new capacity has been added to the electricity grid, around 75% from renewable sources14
renewable projects are currently under construction across the UK, which will provide 5.6GW of new capacity
of energy investment in the pipeline between 2017/18 and 2020/21
14 ‘Digest of UK Energy Statistics’, Department for Business, Energy and Industrial Strategy, 2017.
Regional analysis of investment in the pipeline from 2017/18 to 2020/21 27
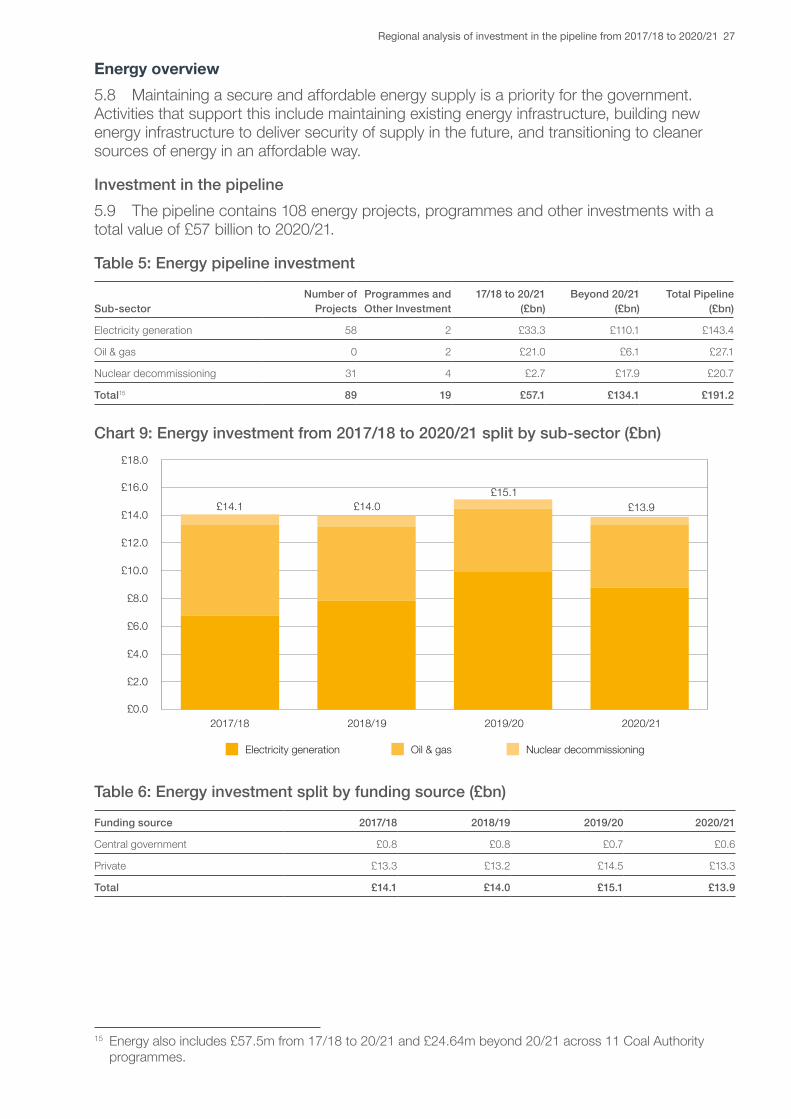
Energy overview5.8 Maintaining a secure and affordable energy supply is a priority for the government. Activities that support this include maintaining existing energy infrastructure, building new energy infrastructure to deliver security of supply in the future, and transitioning to cleaner sources of energy in an affordable way.
Investment in the pipeline5.9 The pipeline contains 108 energy projects, programmes and other investments with a total value of £57 billion to 2020/21.
Table 5: Energy pipeline investment15
Sub-sectorNumber of
ProjectsProgrammes and Other Investment
17/18 to 20/21 (£bn)
Beyond 20/21 (£bn)
Total Pipeline (£bn)
Electricity generation 58 2 £33.3 £110.1 £143.4
Oil & gas 0 2 £21.0 £6.1 £27.1
Nuclear decommissioning 31 4 £2.7 £17.9 £20.7
Total15 89 19 £57.1 £134.1 £191.2
Chart 9: Energy investment from 2017/18 to 2020/21 split by sub-sector (£bn)
£0.0
£2.0
£4.0
£6.0
£8.0
£10.0
£12.0
£14.0
£16.0
£18.0
2017/18 2018/19 2019/20 2020/21
Electricity generation Oil & gas Nuclear decommissioning
£14.1 £14.0£15.1
£13.9
Table 6: Energy investment split by funding source (£bn)
Funding source 2017/18 2018/19 2019/20 2020/21
Central government £0.8 £0.8 £0.7 £0.6
Private £13.3 £13.2 £14.5 £13.3
Total £14.1 £14.0 £15.1 £13.9
15 Energy also includes £57.5m from 17/18 to 20/21 and £24.64m beyond 20/21 across 11 Coal Authority programmes.

28 Analysis of the National Infrastructure and Construction Pipeline
Delivery record5.10 This summer, more than half of the UK’s electricity came from low carbon sources, making 2017 the “greenest” summer ever recorded by the National Grid, helping the government to meet its long-term climate change commitments.16 The UK generates more electricity from offshore wind than any other country.17 Construction of the Beatrice offshore wind farm has begun and when complete in 2019, it will add 588 megawatts (MW) of capacity to the grid and power 450,000 homes.
5.11 In September last year, the gas-fired Carrington Power Station became operational. The plant provides 880MW of capacity and powers over one million businesses and homes in Greater Manchester.
5.12 In 2016, the government signed contracts with EDF and Chinese General Nuclear to support the construction of Hinkley Point C power station. Since then, good progress has been made on construction, with the first major concrete pour – a significant early milestone – taking place in March 2017. When completed, Hinkley will be the first nuclear power station built in the UK in a generation and provide 7% of the UK’s electricity needs.
Case Study: Offshore wind
As part of government reforms to the energy market, the Contracts for Difference (CfD) scheme was introduced in 2015, which provides a guaranteed price (‘strike price’) for electricity produced from new low-carbon energy projects. Through the introduction of competition to how CfDs are awarded, the strike price required to support offshore wind projects has more than halved in just two years, to £57.50 per megawatt hour. This is an example of how the government’s plan is successfully driving down the cost of low carbon energy.
Recent examples of success in the offshore wind industry include Orsted (formally DONG Energy) completing their work on their Burbo Bank Extension project, where the world’s largest wind turbines were installed in Liverpool Bay.
16 National Grid.17 Crown Estate, Offshore wind energy as at November 2017.

Regional analysis of investment in the pipeline from 2017/18 to 2020/21 29
Utilities
Over
250 utilities projects have been completed since 2010
Work has begun on Thames Tideway Tunnel, to upgrade London’s Victorian sewers
Beauly-Denny Overhead Transmission Line was completed in 2015, transmitting renewable energy from Scotland across the UK
Eleclink, an interconnector that will provide electricity transmission between the UK and France, is currently being installed through the Channel Tunnel
Over
£47billion
of utilities investment in the pipeline between 2017/18 and 2020/21

30 Analysis of the National Infrastructure and Construction Pipeline
Utilities overview5.13 The distribution and transmission of electricity, gas, and water are regulated industries operated by the private sector. The government is committed to ensuring a fair price for consumers and industry through increasing competition and consumer choice.
Investment in the pipeline5.14 The pipeline contains 104 projects, programmes and other investments with a total value of £47 billion to 2020/21.18 Chart 10 shows a decrease in 2020/21 as the current regulatory period for the water sector ends in 2020. As new regulatory periods are agreed over time there will be revisions to the profile of investment.
Table 7: Utilities pipeline investment19
Sub-sectorNumber of
ProjectsProgrammes and Other Investment
17/18 to 20/21 (£bn)
Beyond 20/21 (£bn)
Total Pipeline (£bn)
Electricity transmission 21 19 £14.6 £9.6 £24.1
Water and sewerage 1 27 £16.0 £0.2 £16.2
Electricity distribution 0 14 £9.6 £4.5 £14.1
Smart meters19 0 1 £1.8 £4.4 £6.2
Gas distribution 0 8 £4.4 £0.0 £4.4
Gas transmission 0 6 £1.0 £1.4 £2.3
Waste to energy projects 7 0 £0.3 £0.0 £0.3
Total 29 75 £47.7 £20.0 £67.8
Chart 10: Utilities investment from 2017/18 to 2020/21 split by sub-sector (£bn)
18 Utilities figures include Waste from energy projects (EfW).19 All smart meter activity is classed under the Smart Meter roll-out programme.
£0.0
£2.0
£4.0
£6.0
£8.0
£10.0
£12.0
£14.0
£16.0
£18.0
2017/18 2018/19 2019/20 2020/21
£13.0£13.5
£12.8
£8.4
Water and sewerage Electricity transmissionElectricity distribution Gas distributionSmart meters Gas transmissionWaste to energy projects
Regional analysis of investment in the pipeline from 2017/18 to 2020/21 31
Table 8: Utilities investment split by funding source (£bn)
Funding source 2017/18 2018/19 2019/20 2020/21
Central government £0.2 £0.1 £0.0 £0.0
Private £12.8 £13.4 £12.8 £8.4
Total £13.0 £13.5 £12.8 £8.4
Delivery record5.15 The government has made significant progress in helping people to monitor their energy usage more accurately. Energy companies had installed 7.36 million smart meters by June 2017.
5.16 Interconnectors allow electricity to be transmitted across borders to allow trade in electricity. When the NIDP 2016-2021 was published the UK had 4 gigawatts (GW) of capacity via interconnectors. Seven projects were in early planning stages to increase capacity – construction of Eleclink has since begun. Work is also continuing to build London Power Tunnels – an electricity superhighway below London. This project is due to be completed in 2018.
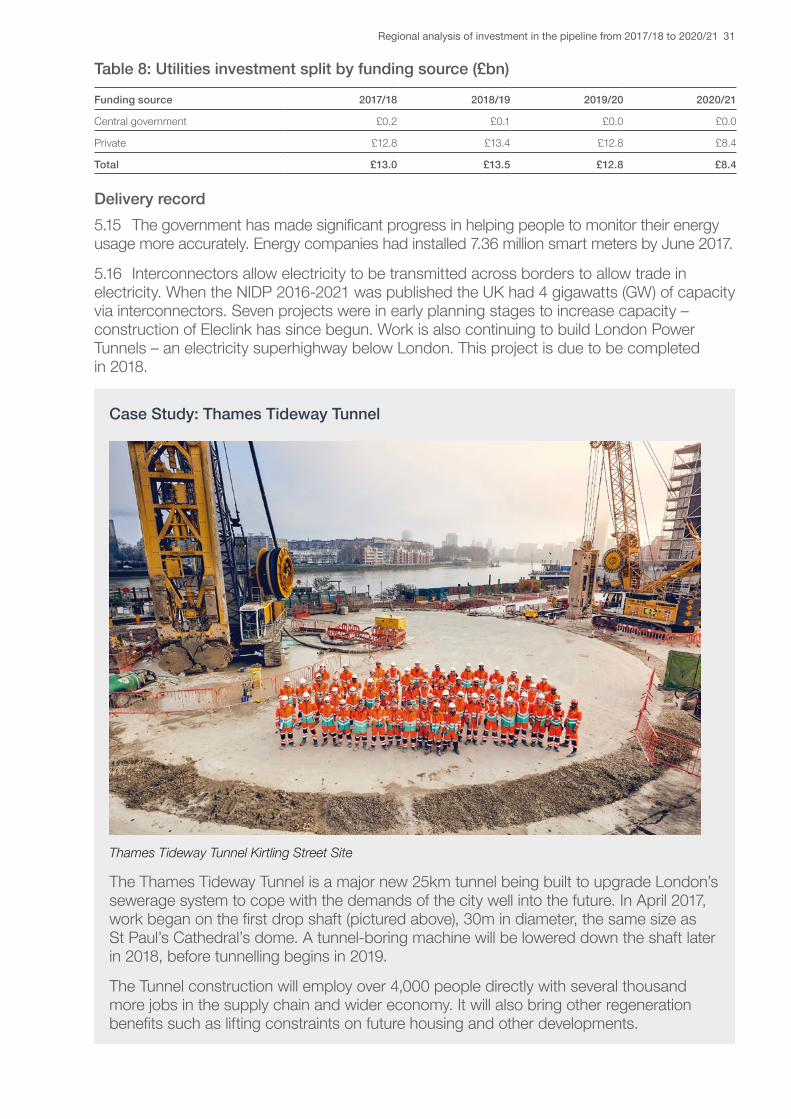
Case Study: Thames Tideway Tunnel
Thames Tideway Tunnel Kirtling Street Site
The Thames Tideway Tunnel is a major new 25km tunnel being built to upgrade London’s sewerage system to cope with the demands of the city well into the future. In April 2017, work began on the first drop shaft (pictured above), 30m in diameter, the same size as St Paul’s Cathedral’s dome. A tunnel-boring machine will be lowered down the shaft later in 2018, before tunnelling begins in 2019.
The Tunnel construction will employ over 4,000 people directly with several thousand more jobs in the supply chain and wider economy. It will also bring other regeneration benefits such as lifting constraints on future housing and other developments.

32 Analysis of the National Infrastructure and Construction Pipeline
Digital Infrastructure5.17 Digital technology has become an integral part of the way we do business and communicate with each other. As the amount of data being carried over networks grows, we need to ensure that industry are incentivised to invest in the UK’s digital infrastructure, to provide the right capacity, quality and reliability of digital connections to support demand. Autumn Budget 2017 sets out the next steps that the government is taking to make the UK a leader in the development and deployment of digital technologies through the 5G Testbeds and Trials programme and Local Full Fibre Networks programme, with funding from the National Productivity Investment Fund.
Investment in the pipeline5.18 The pipeline contains 7 digital infrastructure projects, programmes and other investments with a total value of £11 billion to 2020/21. Chart 11 shows a decrease in 2020/21 as current projects and programmes for improving digital infrastructure are due to reach completion. As new funding for new initiatives is agreed over time there will be revisions to the profile of investment. The Budget also supports faster rollout of full-fibre networks through a new £190 million Challenge Fund.
Table 9: Digital infrastructure pipeline investment
Sub-sectorNumber of
ProjectsProgrammes and Other Investment
17/18 to 20/21 (£bn)
Beyond 20/21 (£bn)
Total Pipeline (£bn)
Digital economy 1 6 £10.8 £0.0 £10.8
Total 1 6 £10.8 £0.0 £10.8
Chart 11: Digital infrastructure investment from 2017/18 to 2020/21 (£bn)
£0.0
£1.0
£2.0
£3.0
£4.0
£5.0
£6.0
2017/18 2018/19 2019/20 2020/21
Digital economy
£4.1
£3.1 £3.0
£0.7
Table 10: Digital communication split by funding source (£bn)
Funding source 2017/18 2018/19 2019/20 2020/21
Central government £0.1 £0.2 £0.1 £0.1
Private £2.6 £2.6 £2.5 £0.5
Mixed £1.4 £0.3 £0.3 £0.1
Total £4.1 £3.1 £3.0 £0.7

Regional analysis of investment in the pipeline from 2017/18 to 2020/21 33
Delivery record5.19 Superfast broadband coverage has more than doubled since 2010, with over 4.5 million additional premises receiving access. Industry is on-track to meet the government’s target to increase access to 95% of premises by the end of 2017.
5.20 Industry is working to provide mobile voice coverage across 90% of the UK geographic area by the end of 2017, following an agreement between government and mobile operators, which secured £5 billion of industry investment to extend coverage. 4G services will also be available indoors to 98% of premises.
5.21 For the UK to stay competitive globally we must be at the cutting edge of new technology as it develops. In 2016, the government announced over £1 billion of investment to support the development of next-generation full-fibre broadband and 5G mobile networks. This included £400 million of government funding for the Digital Infrastructure Investment Fund. Launched this year, the Fund is helping alternative network providers obtain access to finance, so that full-fibre networks are deployed quicker and more extensively across the UK.
Case Study: Superfast broadband access to 95% of UK premises
This programme will provide access to superfast broadband to 95% of the UK by the end of 2017. Superfast broadband is capable of at least 24 Mbps download speeds. The government-led programme has provided £1.7 billion of funding to incentivise the roll-out of superfast broadband into areas that the private sector would not otherwise reach. This programme will ensure that even those in the most remote parts of the UK will have access to a fast broadband connection.

34 Analysis of the National Infrastructure and Construction Pipeline
Flood and Coastal Erosion5.22 Across England, many homes and businesses have experienced the damaging effects of flooding and coastal erosion. We are putting more preventative measures in place to protect against flood risk. As the Autumn Budget 2017 set out, £40 million of the assigned flood and coastal erosion defence funding will be focussed on communities at high flood risk, boosting local regeneration.
Investment in the pipeline5.23 The pipeline contains 29 flood and coastal erosion protection projects, programmes and other investments with a total value of £2.3 billion to 2020/21.
Table 11: Flood and coastal erosion pipeline investment
Sub-sectorNumber of
ProjectsProgrammes and Other Investment
17/18 to 20/21 (£bn)
Beyond 20/21 (£bn)
Total Pipeline (£bn)
Flood 7 22 £2.3 £1.4 £3.8
Total 7 22 £2.3 £1.4 £3.8
Chart 12: Flood and coastal erosion investment from 2017/18 to 2020/21 (£bn)
£0.0
£0.1
£0.2
£0.3
£0.4
£0.5
£0.6
£0.7
£0.8
£0.9
£1.0
2017/18 2018/19 2019/20 2020/21
Flood
£0.5
£0.6
£0.5
£0.6
Table 12: Flood and coastal erosion investment split by funding source (£bn)
Funding source 2017/18 2018/19 2019/20 2020/21
Mixed £0.5 £0.6 £0.5 £0.6
Total £0.5 £0.6 £0.5 £0.6

Regional analysis of investment in the pipeline from 2017/18 to 2020/21 35
Delivery record5.24 Since 2010 more than 600 new flood and coastal protection schemes have been completed, protecting almost 350,000 homes. For example at Rossall and Anchorsholme, the Environment Agency is working with local authorities to replace and improve 3 kilometres of existing seawalls and promenade to reduce the risk of sea flooding to over 12,000 properties. Construction began in February 2014, with work now complete at Anchorsholme, and Rossall due by May 2018.
Phase 1 Leeds Flood Alleviation scheme
Leeds Flood Alleviation Scheme
Delivered in partnership between Leeds City Council and the Environment Agency, phase 1 began construction in January 2015 and was opened in October 2017. There are three main elements to the scheme: state-of-the-art moveable weirs; merging of the river and canal; and 4.5km of linear defences. This is the first use of moveable weirs in the UK for flood management purposes. The merging of the river and canal was achieved by removing 180,000 tonnes of material, which was reused to achieve savings in the region of £6 million.
The scheme provides more than 3,000 homes and 500 businesses in the city centre and Holbeck with better protection against floods. In March 2016, the government allocated £35 million for the second phase up to 2021, which will offer protection against the level of flooding experienced on Boxing Day 2015.

36 Analysis of the National Infrastructure and Construction Pipeline
Science and Research 5.25 Innovations in science and research help improve our quality of life. They support growth and productivity and make the UK an attractive place to do business. Since 2010 the government has been committed to supporting the sector through increased investment and policy support. At Autumn Budget 2017, the government announced further NPIF funding to take total direct Research and Development spending to £12.5 billion per annum by 2021-22.
Investment in the pipeline5.26 The pipeline contains 21 science and research projects, programmes and other investments with a total value of £5 billion to 2020/21.
Table 13: Science and research pipeline investment20
Sub-sectorNumber of
ProjectsProgrammes and Other Investment
17/18 to 20/21 (£bn)
Beyond 20/21 (£bn)
Total Pipeline (£bn)
Research 14 6 £5.1 £1.0 £6.1
Total20 14 7 £5.1 £1.0 £6.1
Chart 13: Science and research investment from 2017/18 to 2020/21 split by sub-sector (£bn)
£0.0
£0.2
£0.4
£0.6
£0.8
£1.0
£1.2
£1.4
£1.6
2017/18 2018/19 2019/20 2020/21
Research UK Shared Business Services
£1.3£1.2
£1.4
£1.2
Table 14: Science and research investment split by funding source (£bn)
Funding source 2017/18 2018/19 2019/20 2020/21
Central government £1.0 £0.9 £1.0 £0.8
Mixed £0.3 £0.3 £0.4 £0.4
Total £1.3 £1.2 £1.4 £1.2
20 Science and research also includes £20.5m from 17/18 to 20/21 against one UK Shared Business Services programme.
Regional analysis of investment in the pipeline from 2017/18 to 2020/21 37
Delivery record5.27 Since 2010, the government has provided £8.5 billion of capital investment in cutting-edge science and research infrastructure, such as the Francis Crick Institute – a world leading medical research facility pioneering new cancer treatments, and cementing the UK’s place at the frontier of global science and innovation. The priorities identified in the NIDP 2016-21 have also progressed, with construction beginning on the Sir Henry Royce Institute for Advanced Materials, and the RRS Sir David Attenborough polar research ship.
5.28 The third phase of the Diamond Light Source project is well underway in Oxfordshire. These lasers produce intense beams of light used by scientists to study a vast range of subject matter from new medical treatments to innovative engineering. Nine of the ten new experimental diamond light source stations (known as ‘beamlines’) are operational and ready for research use. The final Phase III beamline is under construction and will undergo testing before it is put into operation in March 2018.
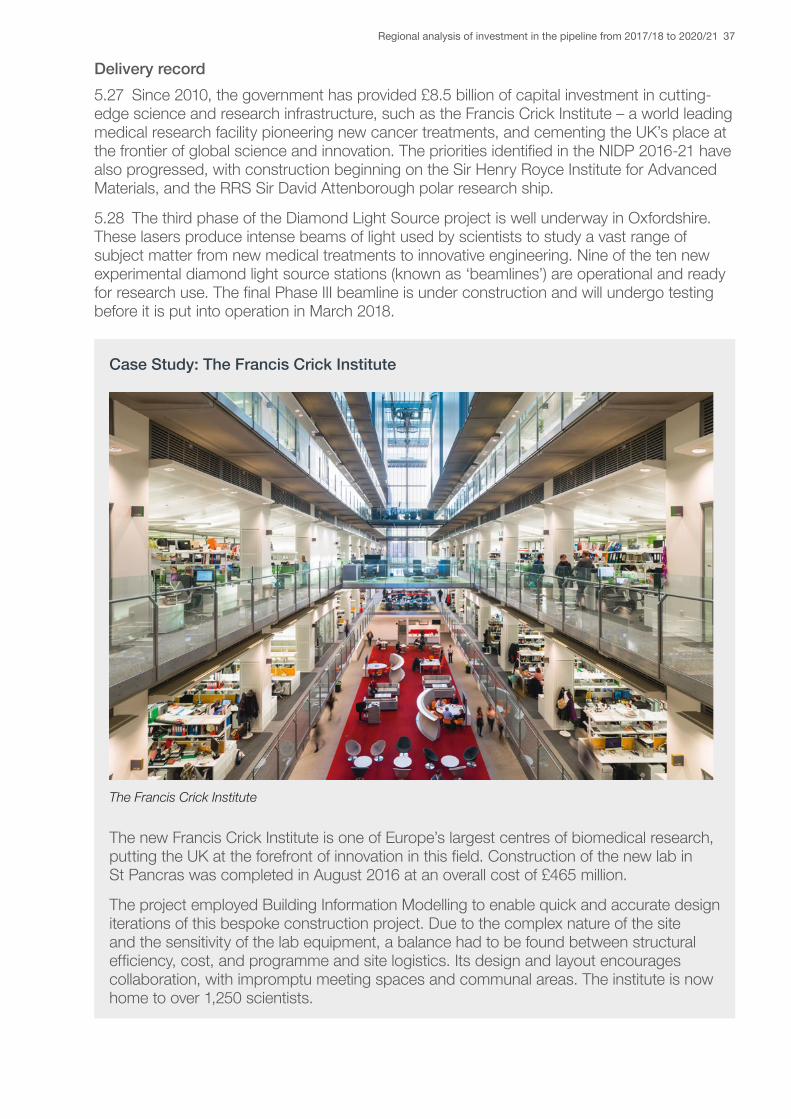
Case Study: The Francis Crick Institute
The Francis Crick Institute
The new Francis Crick Institute is one of Europe’s largest centres of biomedical research, putting the UK at the forefront of innovation in this field. Construction of the new lab in St Pancras was completed in August 2016 at an overall cost of £465 million.
The project employed Building Information Modelling to enable quick and accurate design iterations of this bespoke construction project. Due to the complex nature of the site and the sensitivity of the lab equipment, a balance had to be found between structural efficiency, cost, and programme and site logistics. Its design and layout encourages collaboration, with impromptu meeting spaces and communal areas. The institute is now home to over 1,250 scientists.

38 Analysis of the National Infrastructure and Construction Pipeline
Social Infrastructure
Over
370social infrastructure projects have been completed since 2010
More than 735,000 additional pupil places created since 2010
Over 1.1 million homes have been delivered since 2010
New Proton Beam Therapy Centres under construction in Manchester and London
Over
£43billion
of social infrastructure investment in the pipeline between 2017/18 and 2020/21

Regional analysis of investment in the pipeline from 2017/18 to 2020/21 39
Social infrastructure overview5.29 Social infrastructure was brought into the National Infrastructure Delivery Plan for the first time in 2016, providing a more comprehensive view of infrastructure investment. Building and maintaining modern and effective social infrastructure is a key part of delivering the government’s aims and objectives in housing and regeneration, health, education, and criminal justice. Government projects are driving innovation in the construction sector and the examples below show a range of award-winning designs in social infrastructure. Autumn Budget 2017 also announced that this would continue, with the Ministry of Justice, Department of Health, Department for Education and Ministry of Defence all adopting a presumption in favour of offsite construction by 2019 across suitable capital programmes, where it represents best value for money.21
Investment in the pipeline5.30 The pipeline contains 184 social infrastructure projects, programmes and other investments with a total value of £43 billion to 2020/21.
Table 15: Social infrastructure pipeline investment
Sub-sectorNumber of
ProjectsProgrammes and Other Investment
17/18 to 20/21 (£bn)
Beyond 20/21 (£bn)
Total Pipeline (£bn)
Education 1 21 £19.2 £0.0 £19.2
Housing and regeneration 4 12 £8.8 £0.0 £8.8
Health 5 19 £8.5 £3.0 £11.5
Defence 24 20 £3.8 £1.5 £5.3
Justice and security 3 75 £2.8 £0.0 £2.9
Total 37 147 £43.1 £4.5 £47.6
Chart 14: Social infrastructure investment from 2017/18 to 2020/21 split by sub-sector (£bn)
£0.0
£2.0
£4.0
£6.0
£8.0
£10.0
£12.0
£14.0
2017/18 2018/19 2019/20 2020/21
Education Housing and Regeneration Health Defence Justice and security
£10.9£11.7
£10.7£9.9
21 Building on progress made to date, the Department for Transport, the Department of Health, the Department for Education, the Ministry of Justice, and the Ministry of Defence will adopt a presumption in favour of offsite construction by 2019 across suitable capital programmes, where it represents best value for money.

40 Analysis of the National Infrastructure and Construction Pipeline
Table 16: Social Infrastructure investment split by funding source (£bn)
Funding source 2017/18 2018/19 2019/20 2020/21
Central government £9.6 £10.3 £9.3 £8.2
Mixed £1.3 £1.4 £1.4 £1.6
Total £10.9 £11.7 £10.7 £9.9
Delivery record
Education5.31 In the education sector, the government’s funding and programmes have helped deliver over 735,000 additional pupil places since May 2010, with many more in the pipeline. The government has further allocated £4.2 billion since 2015 to schools, local authorities and academy trusts to help them maintain and improve school facilities; and the £4.4 billion Priority School Building Programme is rebuilding and refurbishing 537 schools in the worst condition. An example of a project, which rebuilt an existing facility, is Burntwood School, in South London, winner of the 2015 RIBA Stirling Prize for Architecture.
Housing5.32 A well-functioning housing market is inextricably linked to the wider health of the economy. The government is supporting housing delivery and regeneration by ensuring that national programmes of investment in infrastructure, including road and rail investments, support local plans and local need. Housing supply has not kept pace with the increases in demand resulting from a growing population. This government is committed to increasing the housing supply. The government has made strong progress: housing supply has increased by over 1.1 million since 2010, including over 300,000 affordable homes. Work has begun on many new developments including the Aylesbury Garden Town, which will see an additional 15,000 new homes by 2033. Over 2,000 homes have already been completed, alongside a major new community school. Autumn Budget 2017 announced a comprehensive package of new reforms to increase housing supply. The package includes over £15 billion of additional financial support for house building over the next five years, and planning reforms to ensure more land is available for housing.
Justice5.33 To deliver a world-class justice system, modern, sustainable infrastructure is required. HMP & YOI Berwyn, the second largest prison in Europe, finished construction and opened on 27 February 2017. The Metropolitan Police have also moved to a modernised site, which will lead to savings of £6 million per year through reduced running costs. The redeveloped New Scotland Yard won the 2017 Prime Minister’s Better Public Building Award. It demonstrated government and private sector collaboration in delivering an innovative and efficient construction project, completed on time and on budget, utilising offsite manufacturing.
Defence5.34 The Defence Infrastructure Organisation (DIO) plays a vital role in supporting the UK Armed Forces by building, maintaining and servicing the infrastructure to support defence, allowing service personnel to live, work, train and deploy on operations. The Defence Estate Optimisation (DEO) Programme is an estate rationalisation strategy, part of which was published in ‘A Better Defence Estate’ in November 2016. This set out how we intend to deliver a more modern and capability-focused Defence estate. The MOD is investing £4 billion over the next 10 years to create a smaller Defence estate, which supports capability and is

Regional analysis of investment in the pipeline from 2017/18 to 2020/21 41
resilient, effective and efficient. The DEO programme’s strategic objectives are to contribute towards: reducing the built estate by 30% by 2040; releasing land suitable for 55,000 new homes in England by 202022 and realising £1 billion in disposals receipts by 2021.
Health5.35 The NHS estate needs to be fit for the future and suitable for modern methods of care. This means making best use of the existing estate, as many small scale projects up and down the country have been doing. However, where needed or where it represents better value for money there will also be wholly new facilities. Last year the Alder Hey Children’s Hospital in Liverpool won the 2016 Prime Minister’s Better Building Award. The building was designed to make sure that the hospital environment helped to enhance patient recovery. Work also began last year in Brighton to replace the oldest inpatient ward block in England. Construction continues on new hospitals in Birmingham and Cambridge, with the new Papworth Hospital site due to open in Spring 2018.
Case Study: The Lee Valley VeloPark
The Lee Valley VeloPark
The Lee Valley VeloPark was built as a 6000-seat venue for track cycling events in the 2012 Olympic Games, and has won 21 awards. In contrast to most other Olympic venues, the VeloPark was designed as a permanent structure, supporting the overall regeneration of this major East London site. 29% of the building’s content was recycled and it included features such as the utilisation of rainwater and a largely natural ventilation system. It was completed ahead of programme, and on budget, in January 2011.
The Olympic site in East London was once an industrial wasteland and it was transformed by the Olympic park. 10,000 new homes and five new neighbourhoods are planned to be built in the next 20 years, completely regenerating the area beyond recognition. What once was derelict land is already bustling with new green open spaces, business and schools.
22 Date currently being reviewed by DCLG and Cabinet Office.

42 Analysis of the National Infrastructure and Construction Pipeline
Annex A: Methodology and assumptions used for 10 year projection of investmentThe 10 year projection is based on three approaches.
First, it projects public investment in economic infrastructure, assuming investment growth will continue along the current pipeline growth rate trend (from 2016/17 to 2020/21) until it reaches 1.2% of GDP. Under this assumption, investment will reach the highest point of the National Infrastructure Commission’s (NIC) fiscal remit of 1.2% of GDP by 2025/26. (HM Treasury’s remit letter to the NIC instructs them to make recommendations on the country’s long term infrastructure needs on the basis that the government invests between 1 and 1.2% of GDP in economic infrastructure.23 Final decisions regarding levels of government investment within the 1-1.2% fiscal remit will be made by the government when it responds to the NIC’s report.)
Second, the calculation projects public investment in social infrastructure, including social housing and defence infrastructure. This projection is based on the average level of investment in the pipeline, between 2016/17 and 2020/21, which has been projected to 2026/27 in real terms (allowing for inflation).
Finally, the calculation projects private investment in regulated utilities and other sectors (digital communications, transport, and water and waste). This projection is based on the following methodologies:
• Projected investment in regulated utilities is based on the average level of annual investment based on current control periods, assuming efficiency targets of 10%. This projection does not represent the level of future price control periods, which are not yet determined. For planned investment in the non-regulated utilities identified in the pipeline post 2020/21, such as Thames Tideway Tunnel, this investment has been included in the ten year projection, but no further future forecast has been made.
• Investment in electricity generation is based on National Grid’s Future Energy Scenarios and IPA modelling.
• Projected investment in the oil and gas sector has been forecast to 2022/23 by the industry regulator, the Oil and Gas Authority (OGA). The IPA projection extends the forecasted investment in 2022/23 to 2026/27 in real terms.
• Projected investment in all other sectors is based on the average level of investment in the pipeline, between 2016/17 and 2020/21, which has been projected to 2026/27 in real terms.
23 https://www.gov.uk/government/publications/remit-letter-to-the-national-infrastructure-commission

Annex B: Methodology used for regional analysis of investment to 2020/21 43
Annex B: Methodology used for regional analysis of investment to 2020/21Regional allocation where the asset location is known Projects in the National Infrastructure and Construction pipeline are allocated to individual regions (as defined by the ONS), based on the location of the built asset, when the asset is located within one region.
The allocation of assets to a region, where possible, helps users to filter the data by region to find specific local schemes, or to search for national programmes. It also helps inform maps such as the one included in this document.
Using this basic methodology, around 40% of the pipeline is allocated to a specific region. Many projects cannot be allocated in this way, because they are national, cross regions or are broader investment programmes.
This basic allocation of projects and programmes to specific regions is not based on analysis of the benefits that assets will deliver. For example, the pipeline does not currently reflect benefits to the supply chain of the construction and maintenance of an asset. More than 60% of suppliers for Crossrail are based outside London, whereas the entirety of investment in Crossrail in the pipeline is allocated to London.
This allocation also does not address benefits to users of infrastructure assets once in use. In some, but not all cases, the location of the asset will be the same as where benefits are felt. For example, investment in public services infrastructure, such as schools and hospitals, largely benefit the communities in which the constructed asset is based.
Additional regional allocation The IPA has worked with other government departments and regulators to allocate a greater proportion of the pipeline to individual regions, where this cannot be done based simply on the location of an asset. The IPA has applied methodology that allows investment in national and multi-regional programmes to be allocated appropriately between regions.
Using this approach, this report provides analysis that altogether allocates almost 80% of the value of the pipeline between 2017/18 and 2020/21 to specific regions. A detailed explanation of how this is done is provided below.
Methodology applied for the IPA’s regional analysisWhere possible, the total investment for the asset continues to be allocated to the region in which an asset is located. For example, investment in the Henry Royce Institute is allocated to the North West and Hinkley Point C is allocated to the South West.

44 Analysis of the National Infrastructure and Construction Pipeline
Methodology applied to sectors other than transport Investment in programmes that include projects in more than one region, or are spread across the entire country (e.g. the rollout of superfast broadband), is divided between these regions according to the population or number of households in each region. The methodology is broken down by sector in the table below.
Allocated per household • Communications (Broadband) • Energy (Electricity generation, oil and gas) • Utilities (Electricity transmission, Gas distribution, smart meters)
Allocated per person • Communications (Digital economy, mobile connectivity) • Education (Balance of spend identified in investing in Britain’s Future, Grammar Schools expansion,
Multi-academy Trust (MAT) allocations, College Capital Investment Fund (CCIF), National Colleges Capital Investment Fund and further education)
• Energy (Nuclear Decommissioning Authority) • Science and Research
Methodology applied to the transport sectorTransport investment supports the movement of people and goods, with journeys routinely crossing regional (and national) boundaries. Many of our biggest transport projects cross regional boundaries, particularly on the strategic rail and road networks. The regional allocation of spending and the task of apportioning benefits of projects is therefore not straightforward. Issues include:
• Investments physically located in one geographic region often benefit those who live in other regions. For example, investments in London’s transport network will benefit not only London residents but also the, almost 1 million people, who work in London but live elsewhere, as well business and leisure visitors to the city.
• Key parts of our transport network serve as international travel ‘hubs’ for the whole of the country. For various geographic reasons, many of these are concentrated in London, the South East and the East of England. Transport spending that supports travel to and from these ‘hubs’ benefits the whole country through the international travel and trade that it helps facilitate.
• As large transport investments often involve substantial spending over a long construction period and long-term impacts, the regional distribution of spending at a particular point in time will not necessarily match the regional distribution of benefits in that period or the benefits over the lifetime of the investment.

Annex B: Methodology used for regional analysis of investment to 2020/21 45
Where possible, transport investment has been allocated to the region where the asset is located. For cross-regional and unallocated investment, it has been allocated using the methods set out in the table below.2425
Rail The analysis uses Network Rail capital investment in renewals and enhancements. Investment is allocated to the region in which an asset is located. For projects that are cross-regional, investment is apportioned according to track length (kilometres) within the appropriate regions.
HS2 The analysis includes the capital investment in HS2 for 2017/18 to 2020/21 that was agreed at Spending Review 2015. This has been allocated to regions based on analysis of where the benefits of the scheme are expected to fall, as provided in past HS2 economic cases.23 This apportionment of HS2 capital investment to regions was used in HM Treasury’s Country and Regional Analysis 2016.24
Strategic Roads The analysis includes capital investment in the Roads Investment Strategy. Where possible investment is allocated to the region in which an asset is located. For investment in maintenance and other unallocated spend, investment is apportioned according to the distribution of road traffic journeys across regions on the Strategic Road Network.
Local Transport For the integrated transport block, local authority majors, local spend on buses, and walking and cycling, where funding has been allocated to a region, the analysis assumes the benefits of spend are where the local authority or local economic partnerships are based.Where later years are unallocated and future funding is still expected we have assumed a flat profile of spend and have allocated spending across regions on a per capita basis.
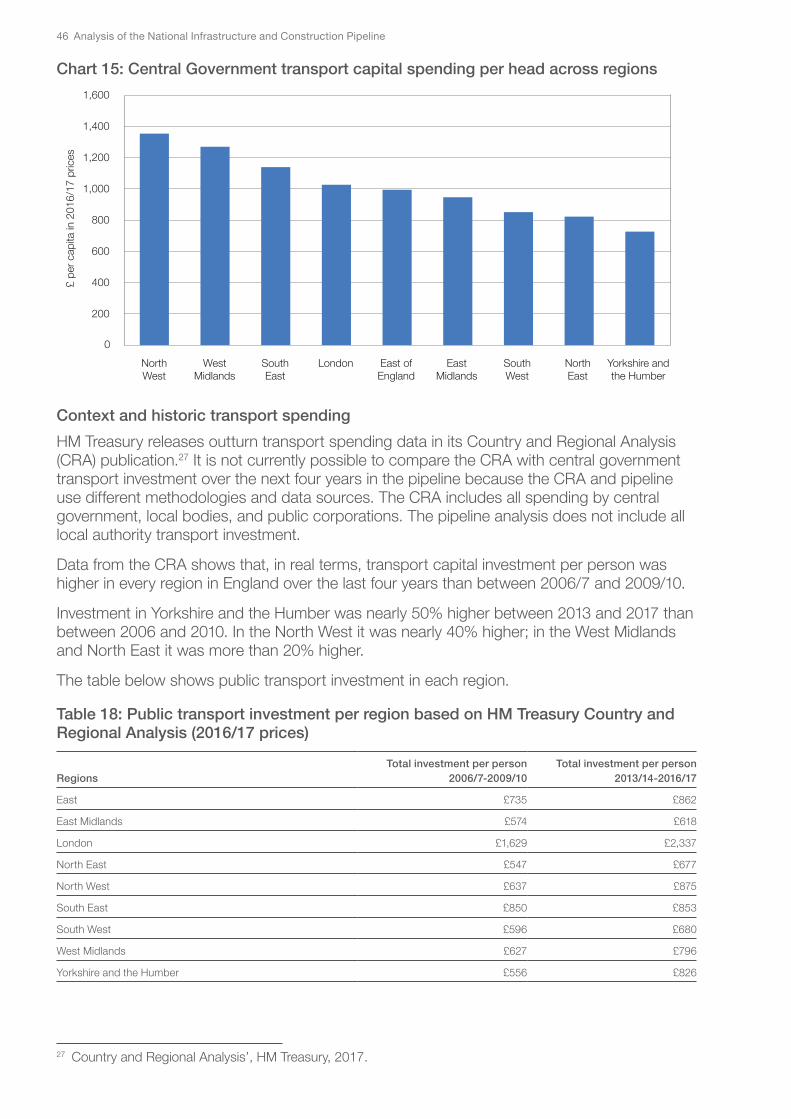
Based on this methodology, Table 17 sets out the allocation of central government transport capital spending in the pipeline between 2017/18 and 2020/21, per head and across regions.
Table 17: Central Government transport capital spending per head across regions26
RegionInvestment per person
(£, 2016/17 prices)
East Midlands £946
East of England £994
London £1,026
North East £822
North West £1,353
South East £1,139
South West £851
West Midlands £1,269
Yorkshire and the Humber £726
24 ‘The economic case for HS2, Department for Transport, 2013’; ‘HS2 Phase Two West Midlands to Crewe: Economic Case’, Department for Transport, 2016.
25 ‘Country and Regional Analysis’, HM Treasury, 2017.26 As this table only looks at transport capital spending funded by central government, TfL expenditure is
excluded. TfL’s capital programme is funded by a mixture of locally-retained business rates and fare receipts from TfL-operated services, and from 2017/18 onwards it receives no direct central government funding. However, DfT does directly fund major transport projects across London, such as Crossrail, and Thameslink.
46 Analysis of the National Infrastructure and Construction Pipeline
Chart 15: Central Government transport capital spending per head across regions
0
200
400
600
800
1,000
1,200
1,400
1,600
£ pe
r cap
ita in
201
6/17
pric
es
London SouthWest
NorthWest
SouthEast
EastMidlands
East ofEngland
NorthEast
WestMidlands
Yorkshire andthe Humber
Context and historic transport spendingHM Treasury releases outturn transport spending data in its Country and Regional Analysis (CRA) publication.27 It is not currently possible to compare the CRA with central government transport investment over the next four years in the pipeline because the CRA and pipeline use different methodologies and data sources. The CRA includes all spending by central government, local bodies, and public corporations. The pipeline analysis does not include all local authority transport investment.
Data from the CRA shows that, in real terms, transport capital investment per person was higher in every region in England over the last four years than between 2006/7 and 2009/10.
Investment in Yorkshire and the Humber was nearly 50% higher between 2013 and 2017 than between 2006 and 2010. In the North West it was nearly 40% higher; in the West Midlands and North East it was more than 20% higher.
The table below shows public transport investment in each region.
Table 18: Public transport investment per region based on HM Treasury Country and Regional Analysis (2016/17 prices)
RegionsTotal investment per person
2006/7-2009/10Total investment per person
2013/14-2016/17
East £735 £862
East Midlands £574 £618
London £1,629 £2,337
North East £547 £677
North West £637 £875
South East £850 £853
South West £596 £680
West Midlands £627 £796
Yorkshire and the Humber £556 £826
27 Country and Regional Analysis’, HM Treasury, 2017.

Annex C: Devolved infrastructure investment 47
Annex C: Devolved infrastructure investmentThe pipeline contains projects and programmes distributed across the UK but the majority of the value of the pipeline (around 90%) relates to spending in England. This is because most infrastructure spending in Scotland, Wales and Northern Ireland is the responsibility of each devolved administration, and therefore is not included in this pipeline.
The split between the responsibility of the UK government and each of the devolved administrations for infrastructure policy and funding varies according to the distinct devolution settlement in place, as set out below. Each devolved administration produces its own infrastructure plan setting out spending in economic infrastructure:
• The Northern Ireland Executive published an Investment Delivery Plan for Roads and Regional Strategic Transport Network Plan in July 2015.28
• The Scottish government published an Infrastructure Investment Plan with a Project Pipeline in 2015 (an updated Programme Pipeline was published in September 2017).29
• The Welsh government published an Infrastructure Investment Plan in 2012 with an updated Project Pipeline published in February 2016.30
Sector Devolved administration
Scotland Northern Ireland Wales
Road Devolved responsibility Devolved responsibility Devolved responsibility
Rail The Scottish government is responsible for internal services. The UK government is responsible for cross-border daytime services
Devolved responsibility Not devolved
Airports Devolved responsibility. The regulation of air services is a reserved matter
Devolved responsibility Devolved responsibility
Ports Devolved responsibility, with some minor exceptions
Devolved responsibility Devolved responsibility, with some minor exceptions
Energy Not devolved Not devolved Not devolved
Communications Not devolved Not devolved Not devolved
Water Devolved responsibility Devolved responsibility Devolved responsibility
Flood Defence Devolved responsibility Devolved responsibility Devolved responsibility
Waste Devolved responsibility Devolved responsibility Devolved responsibility
Housing Devolved responsibility Devolved responsibility Devolved responsibility
28 https://www.infrastructure-ni.gov.uk/publications/investment-delivery-plan-idp-roads29 http://www.gov.scot/Topics/Government/Finance/18232/IIP30 http://gov.wales/funding/wales-infrastructure-investment-plan/?lang=en
48 Analysis of the National Infrastructure and Construction Pipeline
Annex D: Priority projects progress reportThe government published a vision for its major economic infrastructure investment in the National Infrastructure Plan 2010 and has updated it at regular intervals since then. The 2011 update to the National Infrastructure Plan identified a group of priority infrastructure projects and programmes for the first time. These priorities were based on three main criteria: they are nationally significant, they have the potential to drive economic growth, and/or they make a significant contribution to the government’s strategic objectives, including through unlocking significant private investment.
The government’s priority projects were updated in the National Infrastructure Delivery Plan 2016-2021 (NIDP 2016-2021). The majority of the priorities remained consistent. Past priority projects were removed if they had been successfully completed, were no longer priorities but still continuing, did not have significant delivery milestones within the coming five years, or no longer reflected government policy. Additional projects were added to the list to reflect new priorities. The NIDP 2016-2021 also brought economic and social infrastructure together for the first time.
The IPA tracks and supports the government’s priority projects and programmes and the tables on the following pages provide an update on their current status.
Table A provides an update on progress of the 90 priority projects and programmes published in the NIDP 2016-2021. Of these, 9 have already been completed and 53 are under construction or part of programmes being delivered now. The majority of the remaining projects are on track to deliver. Completion dates for 13 projects have been revised to reflect latest updates on progress. One project has been stopped following reassessment.
Table B provides an update on 10 major projects in development highlighted in the NIDP 2016-2021. Work on these projects continues, ahead of final decisions. Where projects have been sufficiently progressed, they have been added to the pipeline.
Table C provides an update on progress of the 67 projects and programmes that appeared in previous priority lists but were not carried forward in the NIDP 2016-2021. Of these, 44 have been delivered, 9 are under construction or part of complex programmes being delivered now, and 12 are in earlier stages of development. Two have been stopped following reassessment.

Annex D: Priority projects progress report 49
Table A – Current priority investments in the National Infrastructure Delivery Plan 2016 – 2021
Priority Investment
Scheme Name Delivery Body Current Status (2017/18)
By End of 2020-21
RoadsSmart Motorways M1 Junctions 13 – 19 Highways England Scoping In construction
M27 Junctions 4 – 11 Highways England Planning and consents Complete (2020-21)
M4 Junctions 3 – 12 Highways England In construction In construction
M6 Junctions 13 – 15 Highways England Planning and consents In construction
Manchester Smart Motorways Highways England In construction Complete (2017-18)
M3 Junctions 2 – 4A Highways England Complete Complete (2017-18)
Road Period 1 Major Schemes
A2 Bean and Ebbsfleet Highways England Scoping Scoping
A5-M1 Link Road Highways England Complete Complete (2017-18)
A556 Knutsford to Bowdon Highways England Complete Complete (2016-17)
M1/M6 Junction 19 Improvement Highways England Complete Complete (2016-17)
A14 A14 Cambridge to Huntingdon Highways England In construction Complete (2020-21)
A1 (North) A1 Morpeth to Ellingham Highways England Planning and consents In construction
A1 North of Ellingham Highways England Planning and consents In construction
A1 Leeming to Barton Highways England In construction Complete (2017-18)
A1 Birtley to Coal House widening Highways England Scoping In construction
A1 Scotswood to North Brunton Highways England Scoping In construction
A303/A30/A358 Corridor
A303 Amesbury to Berwick Down Dualling
Highways England Scoping In construction
A303 Sparkford to Ilchester dualling Highways England Scoping In construction
A358 Taunton to Southfields dualling
Highways England Scoping TBC – Subject to scoping
RailHS2 HS2 High Speed 2 Ltd Planning and consents In construction
Crossrail Crossrail Ltd In construction Complete (2019-20)
Network Rail Enhancement Programme
East Coast Main Line Network Rail In construction Complete (2019-20)
East West Rail (Phase 1) Network Rail Complete Complete (2016-17)
East West Rail (Phase 2) Network Rail In construction In construction
Great Western Network Rail In construction In construction
Midland Main Line Network Rail In construction In construction
North of England Network Rail In construction In construction
South West Capacity Network Rail In construction In construction
European Rail Traffic Management System (Digital Rail)
Network Rail Active programme Active programme
Thameslink Network Rail/ Siemens/ GTR
In construction Complete (2018-19)
Intercity Express Programme
Network Rail/ Agility/ Hitachi
Active programme Active programme
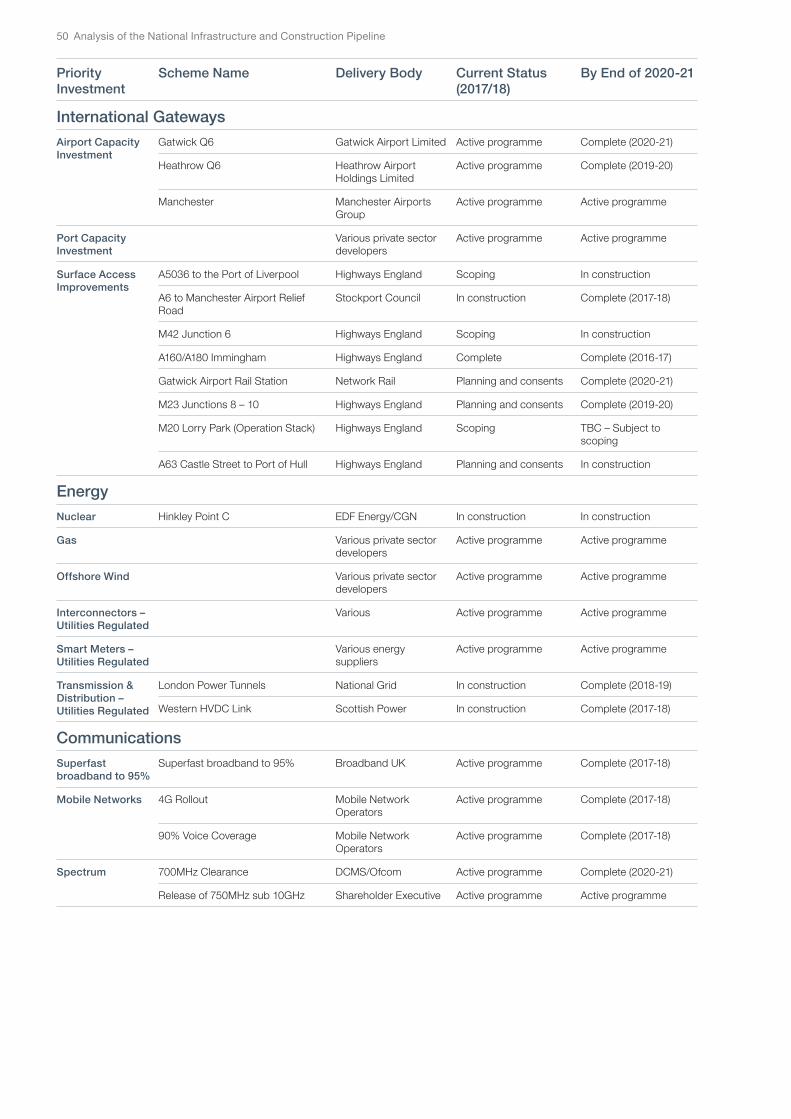
50 Analysis of the National Infrastructure and Construction Pipeline
Priority Investment
Scheme Name Delivery Body Current Status (2017/18)
By End of 2020-21
International GatewaysAirport Capacity Investment
Gatwick Q6 Gatwick Airport Limited Active programme Complete (2020-21)
Heathrow Q6 Heathrow Airport Holdings Limited
Active programme Complete (2019-20)
Manchester Manchester Airports Group
Active programme Active programme
Port Capacity Investment
Various private sector developers
Active programme Active programme
Surface Access Improvements
A5036 to the Port of Liverpool Highways England Scoping In construction
A6 to Manchester Airport Relief Road
Stockport Council In construction Complete (2017-18)
M42 Junction 6 Highways England Scoping In construction
A160/A180 Immingham Highways England Complete Complete (2016-17)
Gatwick Airport Rail Station Network Rail Planning and consents Complete (2020-21)
M23 Junctions 8 – 10 Highways England Planning and consents Complete (2019-20)
M20 Lorry Park (Operation Stack) Highways England Scoping TBC – Subject to scoping
A63 Castle Street to Port of Hull Highways England Planning and consents In construction
EnergyNuclear Hinkley Point C EDF Energy/CGN In construction In construction
Gas Various private sector developers
Active programme Active programme
Offshore Wind Various private sector developers
Active programme Active programme
Interconnectors – Utilities Regulated
Various Active programme Active programme
Smart Meters – Utilities Regulated
Various energy suppliers
Active programme Active programme
Transmission & Distribution – Utilities Regulated
London Power Tunnels National Grid In construction Complete (2018-19)
Western HVDC Link Scottish Power In construction Complete (2017-18)
CommunicationsSuperfast broadband to 95%
Superfast broadband to 95% Broadband UK Active programme Complete (2017-18)
Mobile Networks 4G Rollout Mobile Network Operators
Active programme Complete (2017-18)
90% Voice Coverage Mobile Network Operators
Active programme Complete (2017-18)
Spectrum 700MHz Clearance DCMS/Ofcom Active programme Complete (2020-21)
Release of 750MHz sub 10GHz Shareholder Executive Active programme Active programme

Annex D: Priority projects progress report 51
Priority Investment
Scheme Name Delivery Body Current Status (2017/18)
By End of 2020-21
Flood DefenceFlood and Coastal Erosion Risk Management Programme
Boston Barrier Environment Agency Planning and consents Complete (2019-20)
Lincshore Environment Agency In construction Complete (2020-21)
Oxford Flood Alleviation Environment Agency Scoping In construction
River Thames (Datchet to Teddington)
Environment Agency Scoping In construction
Rossall and Anchorsholme Environment Agency In construction Complete (2017-18)
Southsea Flood Alleviation (Portsea Island Flood Defence)
Environment Agency Active programme Active programme
Thames Estuary Asset Management Environment Agency Active programme Active programme
Leeds Flood Alleviation Scheme Environment Agency/Leeds City Council
In construction In construction
WaterThames Tideway Tunnel
Thames Tideway Tunnel Tideway Ltd In construction In construction
Science & ResearchScience Majors Diamond Light Source Phase III Science and
Technology Facilities Council
In construction Complete (2018-19)
Francis Crick Institute Medical Research Council
Complete Complete (2016-17)
Pirbright Development Phase II Biotechnology and Biological Sciences Research Council
In construction Complete (2019-20)
Polar Research Ship (RRS Sir David Attenborough)
NERC/Antarctic Logistics and Infrastructure Partition
Active programme Complete (2019-20)
UKCRIC Engineering and Physical Sciences Research Council
Active programme Active programme
Sir Henry Royce Institute for Advanced Materials
Engineering and Physical Sciences Research Council
In construction In construction
Catapults Innovate UK Active programme Active programme
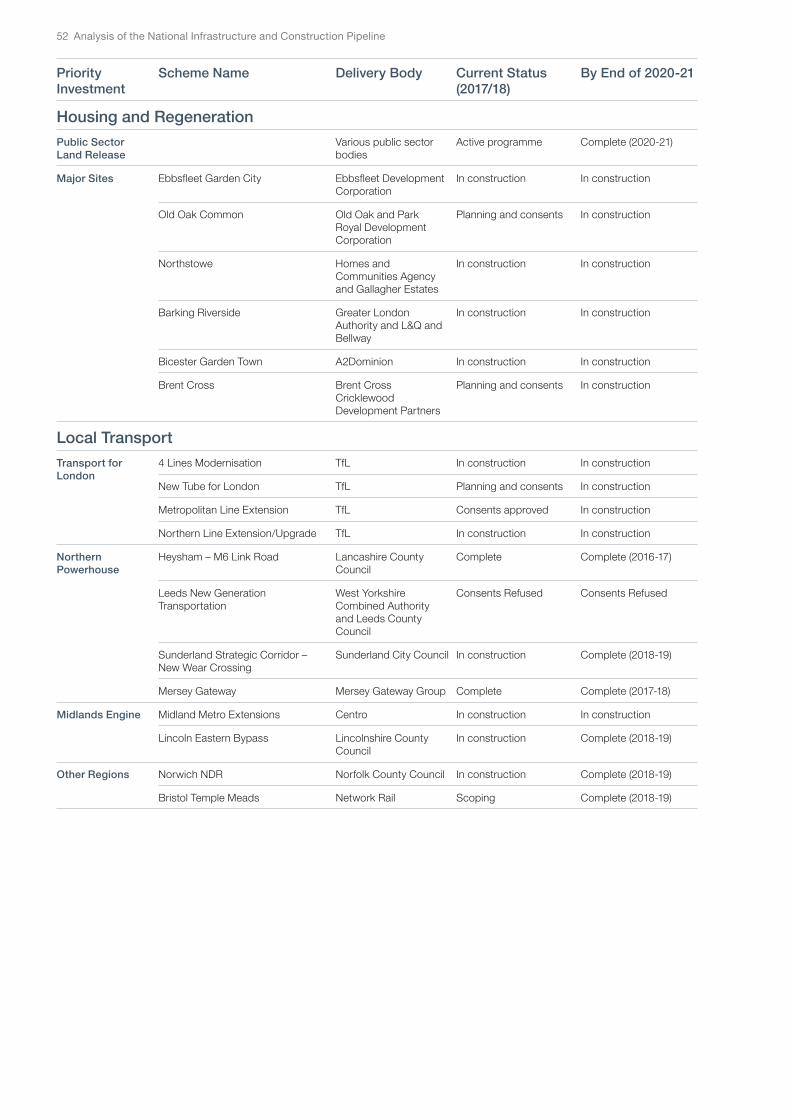
52 Analysis of the National Infrastructure and Construction Pipeline
Priority Investment
Scheme Name Delivery Body Current Status (2017/18)
By End of 2020-21
Housing and RegenerationPublic Sector Land Release
Various public sector bodies
Active programme Complete (2020-21)
Major Sites Ebbsfleet Garden City Ebbsfleet Development Corporation
In construction In construction
Old Oak Common Old Oak and Park Royal Development Corporation
Planning and consents In construction
Northstowe Homes and Communities Agency and Gallagher Estates
In construction In construction
Barking Riverside Greater London Authority and L&Q and Bellway
In construction In construction
Bicester Garden Town A2Dominion In construction In construction
Brent Cross Brent Cross Cricklewood Development Partners
Planning and consents In construction
Local TransportTransport for London
4 Lines Modernisation TfL In construction In construction
New Tube for London TfL Planning and consents In construction
Metropolitan Line Extension TfL Consents approved In construction
Northern Line Extension/Upgrade TfL In construction In construction
Northern Powerhouse
Heysham – M6 Link Road Lancashire County Council
Complete Complete (2016-17)
Leeds New Generation Transportation
West Yorkshire Combined Authority and Leeds County Council
Consents Refused Consents Refused
Sunderland Strategic Corridor – New Wear Crossing
Sunderland City Council In construction Complete (2018-19)
Mersey Gateway Mersey Gateway Group Complete Complete (2017-18)
Midlands Engine Midland Metro Extensions Centro In construction In construction
Lincoln Eastern Bypass Lincolnshire County Council
In construction Complete (2018-19)
Other Regions Norwich NDR Norfolk County Council In construction Complete (2018-19)
Bristol Temple Meads Network Rail Scoping Complete (2018-19)
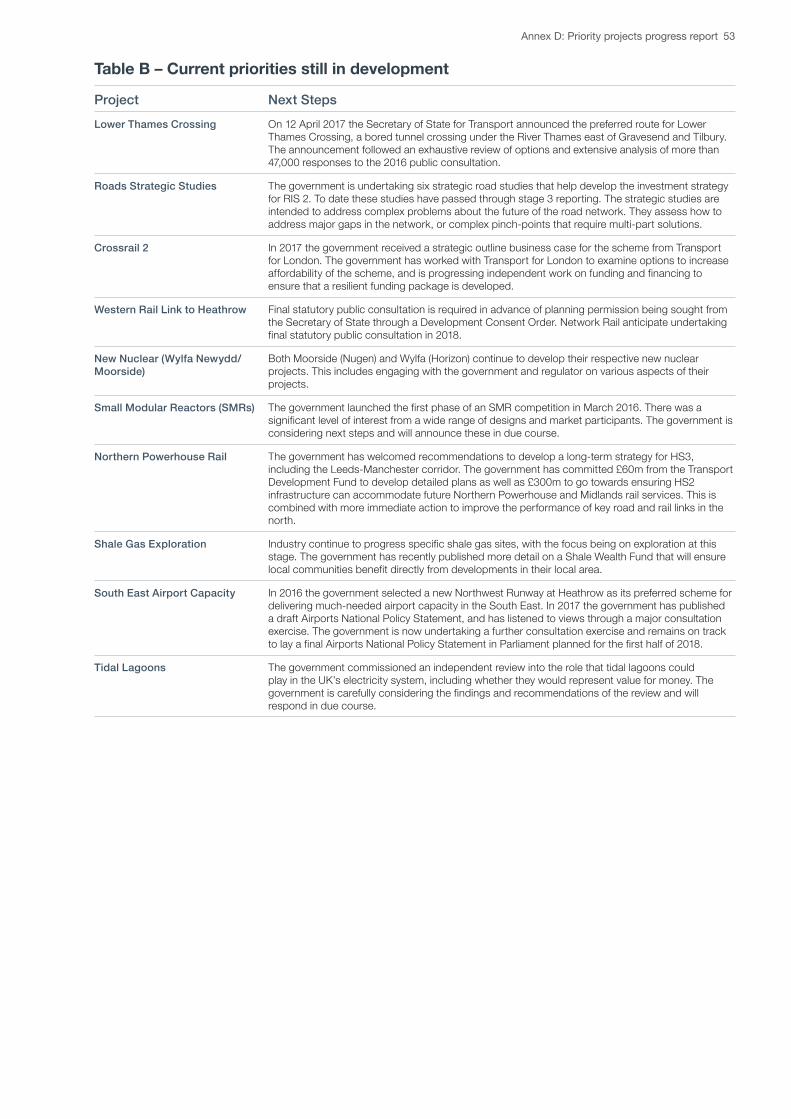
Annex D: Priority projects progress report 53
Table B – Current priorities still in development
Project Next StepsLower Thames Crossing On 12 April 2017 the Secretary of State for Transport announced the preferred route for Lower
Thames Crossing, a bored tunnel crossing under the River Thames east of Gravesend and Tilbury. The announcement followed an exhaustive review of options and extensive analysis of more than 47,000 responses to the 2016 public consultation.
Roads Strategic Studies The government is undertaking six strategic road studies that help develop the investment strategy for RIS 2. To date these studies have passed through stage 3 reporting. The strategic studies are intended to address complex problems about the future of the road network. They assess how to address major gaps in the network, or complex pinch-points that require multi-part solutions.
Crossrail 2 In 2017 the government received a strategic outline business case for the scheme from Transport for London. The government has worked with Transport for London to examine options to increase affordability of the scheme, and is progressing independent work on funding and financing to ensure that a resilient funding package is developed.
Western Rail Link to Heathrow Final statutory public consultation is required in advance of planning permission being sought from the Secretary of State through a Development Consent Order. Network Rail anticipate undertaking final statutory public consultation in 2018.
New Nuclear (Wylfa Newydd/Moorside)
Both Moorside (Nugen) and Wylfa (Horizon) continue to develop their respective new nuclear projects. This includes engaging with the government and regulator on various aspects of their projects.
Small Modular Reactors (SMRs) The government launched the first phase of an SMR competition in March 2016. There was a significant level of interest from a wide range of designs and market participants. The government is considering next steps and will announce these in due course.
Northern Powerhouse Rail The government has welcomed recommendations to develop a long-term strategy for HS3, including the Leeds-Manchester corridor. The government has committed £60m from the Transport Development Fund to develop detailed plans as well as £300m to go towards ensuring HS2 infrastructure can accommodate future Northern Powerhouse and Midlands rail services. This is combined with more immediate action to improve the performance of key road and rail links in the north.
Shale Gas Exploration Industry continue to progress specific shale gas sites, with the focus being on exploration at this stage. The government has recently published more detail on a Shale Wealth Fund that will ensure local communities benefit directly from developments in their local area.
South East Airport Capacity In 2016 the government selected a new Northwest Runway at Heathrow as its preferred scheme for delivering much-needed airport capacity in the South East. In 2017 the government has published a draft Airports National Policy Statement, and has listened to views through a major consultation exercise. The government is now undertaking a further consultation exercise and remains on track to lay a final Airports National Policy Statement in Parliament planned for the first half of 2018.
Tidal Lagoons The government commissioned an independent review into the role that tidal lagoons could play in the UK’s electricity system, including whether they would represent value for money. The government is carefully considering the findings and recommendations of the review and will respond in due course.

54 Analysis of the National Infrastructure and Construction Pipeline
Table C – Historic priorities listed in pre-2016 National Infrastructure Plans
Priority Investment
Previous Investment Name Scheme Name First Reported
Current Status (2017/18)
RoadsHistoric Priorities Highways Agency New Capacity A19/A1058 Coast Road NIP 2013 In construction
Highways Agency New Capacity A21 (Tonbridge to Pembury) NIP 2013 Complete
Highways Agency New Capacity A38 (Derby Junctions) NIP 2013 Planning and Consents
Highways Agency New Capacity A19 (Testos) NIP 2013 Scoping
Managed Motorways M6 Junctions 16 – 19 NIP 2013 In construction
Managed Motorways M1 Junctions 23a – 25 NIP 2013 In construction
Managed Motorways M60 Junctions 24 – 27 & Junctions 1 – 4
NIP 2013 Planning and Consents
Managed Motorways M62 Junctions 10 – 12 NIP 2013 Planning and Consents
Managed Motorways M3 Junctions 9 – 14 NIP 2013 Planning and Consents
Managed Motorways M20 Junctions 3 – 5 NIP 2013 Planning and Consents
Managed Motorways M6 Junctions 13 – 15 NIP 2013 Planning and Consents
Managed Motorways M6 Junctions 21a – 26 NIP 2013 Planning and Consents
Managed Motorways M56 Junctions 6 – 8 NIP 2013 Planning and Consents
Managed Motorways M6 Junctions 2 – 4 NIP 2013 Planning and Consents
Completed – Historic Priorities
Highways Agency – Autumn Statement 2011 Package
A453 Widening Scheme NIP 2012 Complete
Highways Agency – Autumn Statement 2011 Package
M1 Junction 19/M6 Improvement Scheme
NIP 2012 Complete
Highways Agency – Autumn Statement 2011 Package
A14 Kettering Bypass Widening Scheme
NIP 2012 Complete
Highways Agency – Autumn Statement 2011 Package
A45/A46 Tollbar End Improvement Scheme
NIP 2012 Complete
Trunk Road Improvements Programme A23 Handcross to Warninglid NIP 2012 Complete
Trunk Road Improvements Programme A11 Fiveways to Thetford NIP 2012 Complete
Accelerated Roads Construction Pilots M6 Junctions 10a – 13 NIP 2013 Complete
Managed Motorways M5 Junctions 4a – 6 NIP 2013 Complete
Managed Motorways M62 Junctions 25 – 30 NIP 2012 Complete
Managed Motorways M4 Junctions 19 – 20 NIP 2012 Complete
Managed Motorways M5 Junctions 15 – 17 NIP 2012 Complete
Managed Motorways M1 Junctions 32 – 35a NIP 2012 Complete
Managed Motorways M1 Junctions 28 – 31 NIP 2012 Complete
Managed Motorways M25 Junctions 5 – 6/7 NIP 2012 Complete
Managed Motorways M25 Junctions 23 – 27 NIP 2012 Complete
Managed Motorways M1 Junctions 39 – 42 NIP 2012 Complete
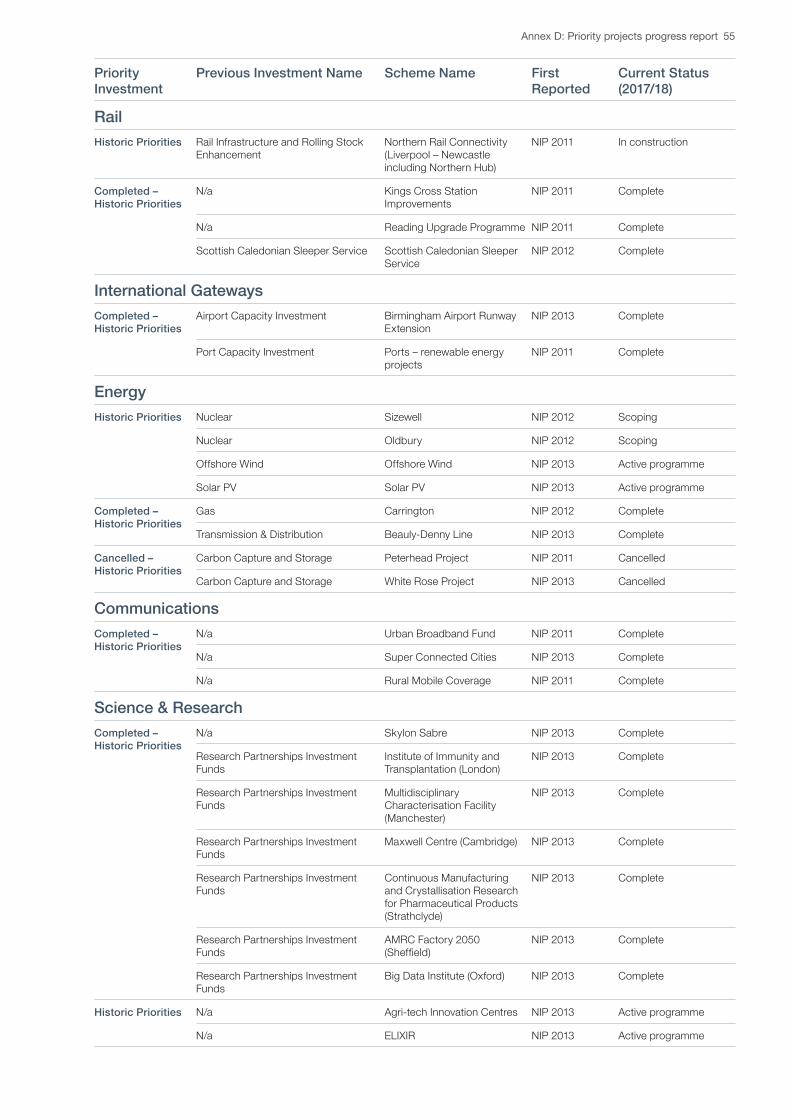
Annex D: Priority projects progress report 55
Priority Investment
Previous Investment Name Scheme Name First Reported
Current Status (2017/18)
RailHistoric Priorities Rail Infrastructure and Rolling Stock
EnhancementNorthern Rail Connectivity (Liverpool – Newcastle including Northern Hub)
NIP 2011 In construction
Completed – Historic Priorities
N/a Kings Cross Station Improvements
NIP 2011 Complete
N/a Reading Upgrade Programme NIP 2011 Complete
Scottish Caledonian Sleeper Service Scottish Caledonian Sleeper Service
NIP 2012 Complete
International GatewaysCompleted – Historic Priorities
Airport Capacity Investment Birmingham Airport Runway Extension
NIP 2013 Complete
Port Capacity Investment Ports – renewable energy projects
NIP 2011 Complete
EnergyHistoric Priorities Nuclear Sizewell NIP 2012 Scoping
Nuclear Oldbury NIP 2012 Scoping
Offshore Wind Offshore Wind NIP 2013 Active programme
Solar PV Solar PV NIP 2013 Active programme
Completed – Historic Priorities
Gas Carrington NIP 2012 Complete
Transmission & Distribution Beauly-Denny Line NIP 2013 Complete
Cancelled – Historic Priorities
Carbon Capture and Storage Peterhead Project NIP 2011 Cancelled
Carbon Capture and Storage White Rose Project NIP 2013 Cancelled
CommunicationsCompleted – Historic Priorities
N/a Urban Broadband Fund NIP 2011 Complete
N/a Super Connected Cities NIP 2013 Complete
N/a Rural Mobile Coverage NIP 2011 Complete
Science & ResearchCompleted – Historic Priorities
N/a Skylon Sabre NIP 2013 Complete
Research Partnerships Investment Funds
Institute of Immunity and Transplantation (London)
NIP 2013 Complete
Research Partnerships Investment Funds
Multidisciplinary Characterisation Facility (Manchester)
NIP 2013 Complete
Research Partnerships Investment Funds
Maxwell Centre (Cambridge) NIP 2013 Complete
Research Partnerships Investment Funds
Continuous Manufacturing and Crystallisation Research for Pharmaceutical Products (Strathclyde)
NIP 2013 Complete
Research Partnerships Investment Funds
AMRC Factory 2050 (Sheffield)
NIP 2013 Complete
Research Partnerships Investment Funds
Big Data Institute (Oxford) NIP 2013 Complete
Historic Priorities N/a Agri-tech Innovation Centres NIP 2013 Active programme
N/a ELIXIR NIP 2013 Active programme

56 Analysis of the National Infrastructure and Construction Pipeline
Priority Investment
Previous Investment Name Scheme Name First Reported
Current Status (2017/18)
Local TransportHistoric Priorities Midlands Engine Selly Oak New Road NIP 2012 Complete
Completed – Historic Priorities
Midlands Engine Birmingham New Street NIP 2013 Complete
Midlands Engine Wolverhampton Interchange NIP 2012 In construction
Other Regions Sittingbourne Northern Relief Road
NIP 2012 Complete
Other Regions Evesham Abbey Bridge and Viaduct Scheme
NIP 2012 Complete
Other Regions A13/A130 Sadlers Farm Junction
NIP 2012 Complete
Other Regions Manchester Metrolinks Extensions
NIP 2013 Complete
Midlands Engine Nottingham NET2 NIP 2013 Complete
Other Regions A380 South Devon Link Road NIP 2013 Complete
Other Regions Croxley Rail Link NIP 2013 Complete
Local Infrastructure Funding ProgrammesCompleted – Historic Priorities
Local Infrastructure Funding Programmes
Growing Places Fund NIP 2011 Complete
Historic Priorities Local Infrastructure Funding Programmes
Regional Growth Fund NIP 2011 Active programme

Image GlossaryOrdsall Chord, Greater Manchester, Network Rail, page 4Birmingham New Street Station, Mace, page 25Thames Tideway Tunnel Kirtling Street Site, Tideway, page 31Leeds Flood Alleviation Scheme, Arup, page 35The Francis Crick Institute, Paul Grundy, page 37The Lee Valley VeloPark, page 41

Contact IPA
Web: www.gov.uk/ipa Email: [email protected]
Cabinet Office Correspondence team 70 Whitehall London SW1A 2AS Email: [email protected] General enquiries: 020 7276 1234 Twitter: @cabinetofficeuk
HM Treasury Correspondence team 1 Horse Guards Road London SW1A 2HQ Email: [email protected] General enquiries: 020 7270 5000 Twitter: @hmtreasury