analysis of the offshore wind energy industry · analysis of the offshore wind energy industry...
TRANSCRIPT
Analysis of the Offshore Wind Energy Industry
CREATING THE CLEAN ENERGY ECONOMY

CCrreeaattiinngg tthhee CClleeaann EEnneerrggyy
EEccoonnoommyy
Analysis of the Offshore Wind Energy
Industry
Primary Authors
Jennifer Todd is an Economic Development Associate at IEDC. Jess Chen is a Research Fellow and
a PhD candidate at American University. Frankie Clogston is an IEDC Consultant and a PhD
candidate at Johns Hopkins University.
Primary Editors
Liz Thorstensen, Vice President of Knowledge Management & Economic Development Practice, Tye
Libby, Associate, Knowledge Management and Development
Acknowledgements
IEDC is grateful to the Rockefeller Brothers Fund for its generous support of this research project.
Special thanks Lauren Avioli, Emily Brown, and Patrick McHugh for research support, and Mishka
Parkins, who provided technical assistance for the creative design of the report.
© Copyright 2013 International Economic Development Council
This report was made possible by a grant from the Rockefeller Brothers Fund.
Paul Krutko, FM
President and Chief Executive Officer,
Ann Arbor SPARK
Chairman of the IEDC Board
Jay C. Moon, CEcD, FM
President and CEO,
Mississippi Manufacturers Association
Immediate Past Chairman of the IEDC Board
Jeffrey A. Finkle, CEcD
President & CEO
International Economic Development Council
International Economic Development Council
734 15th Street NW / Suite 900
Washington, DC 20005
www.iedconline.org | Phone: (202) 223-7800 | Fax: (202) 223-4745
International Economic Development Council
IEDC is the world's largest membership organization serving the economic development
profession, with over 4,500 members, and a network of over 25,000 economic development
professionals and allies. From public to private, rural to urban, and local to international, our
members represent the entire range of economic development experience. IEDC is dedicated to
helping economic developers do their job more effectively and raising the profile of the
profession. When we succeed, our members create more high-quality jobs, develop more vibrant
communities, and generally improve the quality of life in their regions.
The issue of sustainability has been designated a strategic priority by the IEDC Board of
Directors. Further, sustainability and policy responses to climate change are growing issues for our
members. Through a range of services, including: conferences, training courses, webinars,
publications, research and technical assistance efforts, we are striving to be on the cutting edge
of understanding the opportunities and challenges stemming from sustainability, climate change
and economic transformation. For more information about IEDC visit www.iedconline.org

INTERNATIONAL ECONOMIC DEVELOPMENT COUNCIL 3
TTAABBLLEE OOFF CCOONNTTEENNTTSS
Introduction to Offshore Wind Energy ....................................................................................................... 4
Job Creation Potential of Offshore Wind Energy ............................................................................... 7
The State of the U.S. Offshore Wind Market .................................................................................... 15
Hurdles and Solutions: Offshore Wind Energy Market ........................................................................ 55
Supply Side Issues – How to Overcome High Costs .......................................................................... 56
Demand Side Issues – Finding or “Making” the Market ................................................................... 71
The Regulatory and Policy Environment .............................................................................................. 74
Political Hurdles ........................................................................................................................................ 78
Hydroelectricity: Parallels to the Offshore Wind Industry ............................................................... 83
Appendix ......................................................................................................................................................... 91
INTERNATIONAL ECONOMIC DEVELOPMENT COUNCIL 4
IINNTTRROODDUUCCTTIIOONN TTOO OOFFFFSSHHOORREE
WWIINNDD EENNEERRGGYY
Offshore wind power offers an inexhaustible energy source and, in the U.S., is located close to
major population centers where demand for energy is highest. To date, this market has been
insufficiently tapped. The U.S. has yet to produce a single megawatt (MW) of energy from an
offshore wind source. The success of the domestic onshore wind industry foreshadows some of the
potential of offshore wind.
This chapter hopes to spur action that will unlock this potential. The first section discusses the
benefits of offshore wind energy in detail as well as hurdles to market development. The final
section proposes tactics that can help overcome these hurdles.
TThhee IImmppoorrttaannccee ooff OOffffsshhoorree WWiinndd EEnneerrggyy ttoo EEccoonnoommiicc DDeevveellooppmmeenntt
There is evidence that offshore wind energy will create new jobs and economic investment.
Offshore wind generates more jobs per megawatt than onshore wind and other fossil fuels due to
the labor associated with manufacturing, operating, and servicing the wind farms. As the
European Wind Energy Association (EWEA) states, the offshore wind industry has an “additional
employment effect” due to the higher cost of installing, operating, and maintaining offshore wind
turbines than land-based ones.1
It is also likely that offshore wind job creation will come at a time and to those places where it is
particularly needed. As the U.S. Department of Energy (DOE) indicates, many of the jobs for the
new offshore industry will potentially be located in economically depressed ports and shipyards.
These locations will serve as fabrication and staging areas for manufacture, installation, and
1 European Wind Energy Association. (2009, January). Wind at Work: Wind energy and job creation in the EU, p. 22. Retrieved from: http://www.ewea.org/fileadmin/ewea_documents/documents/publications/Wind_at_work_FINAL.pdf
INTERNATIONAL ECONOMIC DEVELOPMENT COUNCIL 5
maintenance of offshore wind turbines.2 These areas can particularly stand to gain jobs in a new
offshore wind industry, since they have experienced a double blow from the downturn in
manufacturing and the recent recession.
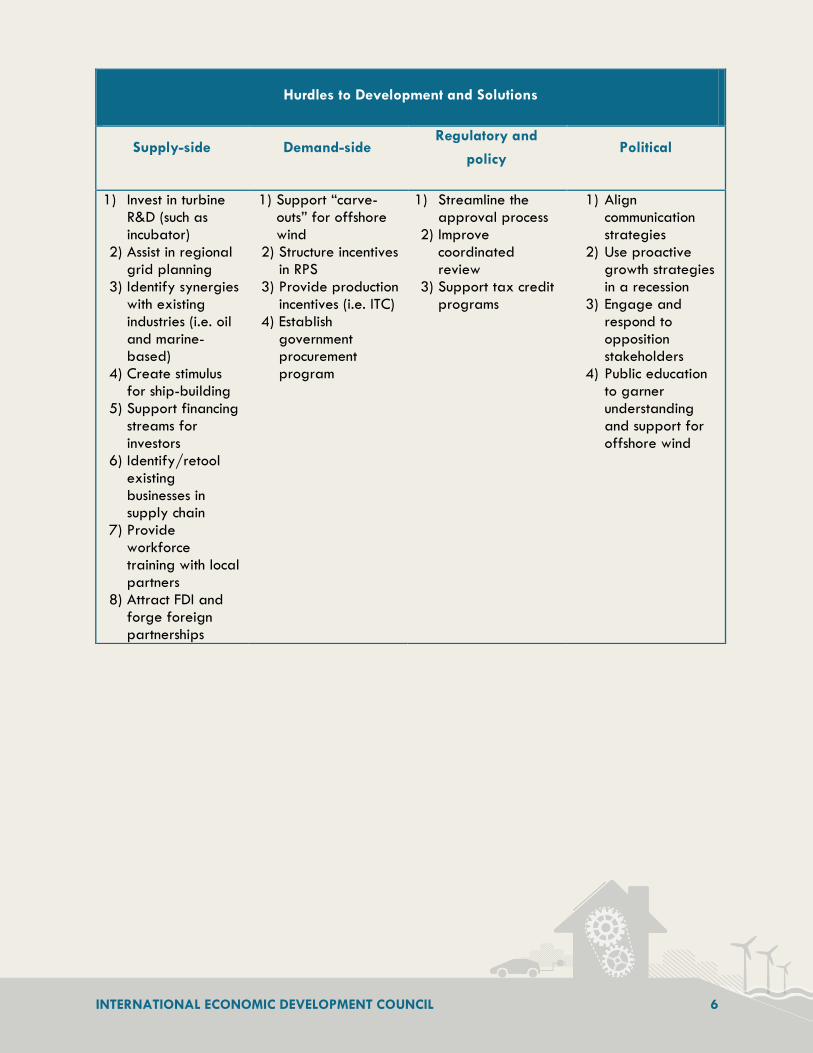
SSuummmmaarryy ooff HHuurrddlleess aanndd SSoolluuttiioonnss
The development of offshore wind energy is not without significant hurdles. Hurdles can be
grouped under four categories. Supply-side hurdles are related to the high capital, operating,
and financing costs of offshore wind projects. This creates a demand-side hurdle in which high
costs are passed on to the purchaser of the offshore wind energy, thereby reducing demand. In
addition, there are regulatory and policy hurdles due to the lengthy and complicated permitting
process for offshore wind projects. Larger political hurdles surround the future of energy policy
and government subsidies in the midst of economic recovery.
Yet, these hurdles can be tackled over time through a coordinated strategy and action by multiple
stakeholders. Section 3 of this report discusses in detail the strategies that economic developers
can pursue to engage these stakeholders and kick start the offshore wind energy market. The
table below presents a brief summary of the primary hurdles to offshore wind energy and their
potential solutions.
2 U.S. Department of Energy. (2011, February). A National Offshore Wind Strategy: Creating an Offshore Wind Energy Industry in the United States, Retrieved from http://www1.eere.energy.gov/windandhydro/pdfs/national_offshore_wind_strategy.pdf.
INTERNATIONAL ECONOMIC DEVELOPMENT COUNCIL 6
Hurdles to Development and Solutions
Supply-side Demand-side Regulatory and
policy Political
1) Invest in turbine R&D (such as incubator)
2) Assist in regional grid planning
3) Identify synergies with existing industries (i.e. oil and marine-based)
4) Create stimulus for ship-building
5) Support financing streams for investors
6) Identify/retool existing businesses in supply chain
7) Provide workforce training with local partners
8) Attract FDI and forge foreign partnerships
1) Support “carve-outs” for offshore wind
2) Structure incentives in RPS
3) Provide production incentives (i.e. ITC)
4) Establish government procurement program
1) Streamline the approval process
2) Improve coordinated review
3) Support tax credit programs
1) Align communication strategies
2) Use proactive growth strategies in a recession
3) Engage and respond to opposition stakeholders
4) Public education to garner understanding and support for offshore wind

INTERNATIONAL ECONOMIC DEVELOPMENT COUNCIL 7
JJOOBB CCRREEAATTIIOONN PPOOTTEENNTTIIAALL OOFF OOFFFFSSHHOORREE WWIINNDD
EENNEERRGGYY
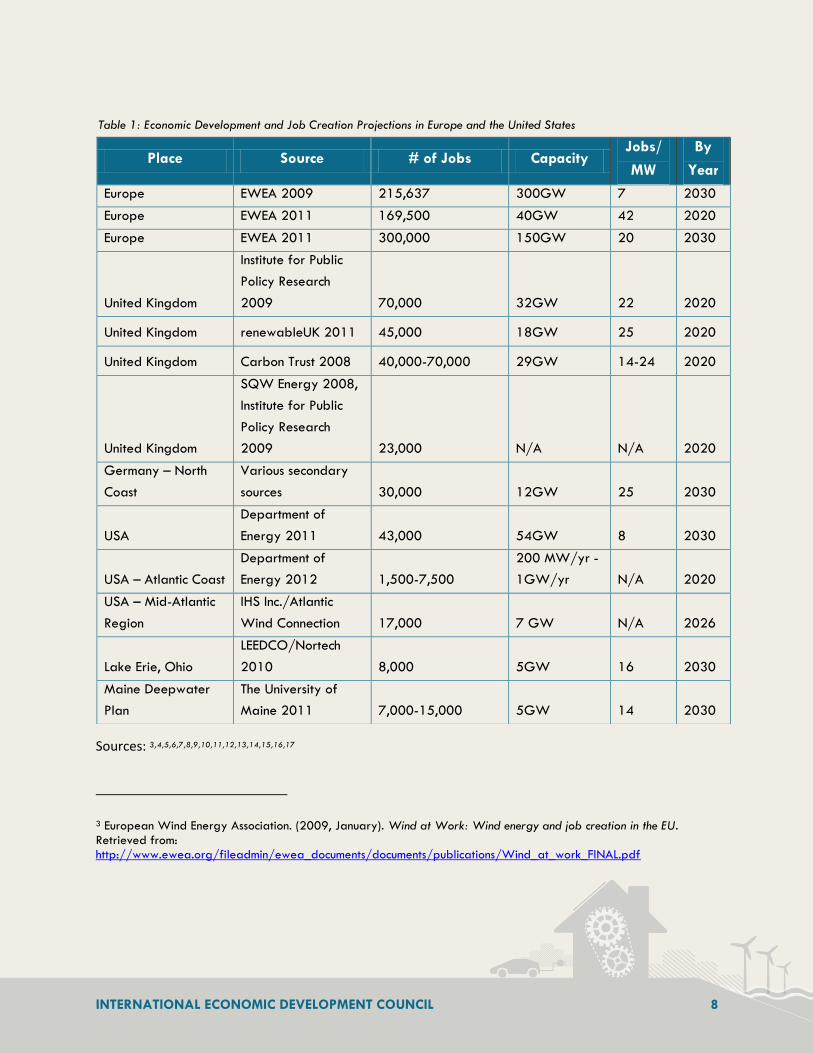
Table 1 summarizes some of the most widely referenced projections for job growth in the offshore
wind industry in Europe and the United States through 2020 and/or through 2030. No doubt, job
projection numbers vary and are always being updated. Therefore a primary purpose of Table 1
is to show the range of projections by industry expert, thereby establishing a barometer for the
employment potential of the industry and a benchmark for analysis.
INTERNATIONAL ECONOMIC DEVELOPMENT COUNCIL 8
Sources: 3,4,5,6,7,8,9,10,11,12,13,14,15,16,17
3 European Wind Energy Association. (2009, January). Wind at Work: Wind energy and job creation in the EU. Retrieved from: http://www.ewea.org/fileadmin/ewea_documents/documents/publications/Wind_at_work_FINAL.pdf
Table 1: Economic Development and Job Creation Projections in Europe and the United States
Place Source # of Jobs Capacity Jobs/
MW
By
Year
Europe EWEA 2009 215,637 300GW 7 2030
Europe EWEA 2011 169,500 40GW 42 2020
Europe EWEA 2011 300,000 150GW 20 2030
United Kingdom
Institute for Public
Policy Research
2009 70,000 32GW 22 2020
United Kingdom renewableUK 2011 45,000 18GW 25 2020
United Kingdom Carbon Trust 2008 40,000-70,000 29GW 14-24 2020
United Kingdom
SQW Energy 2008,
Institute for Public
Policy Research
2009 23,000 N/A N/A 2020
Germany – North
Coast
Various secondary
sources 30,000 12GW 25 2030
USA
Department of
Energy 2011 43,000 54GW 8 2030
USA – Atlantic Coast
Department of
Energy 2012 1,500-7,500
200 MW/yr -
1GW/yr N/A 2020
USA – Mid-Atlantic
Region
IHS Inc./Atlantic
Wind Connection 17,000 7 GW N/A 2026
Lake Erie, Ohio
LEEDCO/Nortech
2010 8,000 5GW 16 2030
Maine Deepwater
Plan
The University of
Maine 2011 7,000-15,000 5GW 14 2030

INTERNATIONAL ECONOMIC DEVELOPMENT COUNCIL 9
JJoobb PPrroojjeeccttiioonnss bbyy CCllaassssiiffiiccaattiioonn
Job creation studies utilize different methods of measurement for jobs and disaggregate jobs into
different categories and classifications. The most common measurements and classifications that
will be discussed below are as follows:
● Direct/indirect,
● Permanent/temporary,
● Jobs/job-years, and
● Sector/occupation.
4 European Wind Energy Association (2011). Wind in our Sails. Retrieved from European Wind Energy Association website: http://www.ewea.org/fileadmin/ewea_documents/documents/publications/reports/23420_Offshore_report_web.pdf 5 Ibid. 6 Bird, Jenny. (2009) Green Jobs: Prospects for Creating Jobs From Offshore Wind in the UK. Institute for Public Policy Research. Retrieved from: http://www.ippr.org/images/media/files/publication/2011/05/green_jobs_1686.pdf 7 Willow, Christopher & Valpy, Bruce. (2011 June). Offshore Wind: Forecasts of future costs and benefits, p. 8. Retrieved from RenewableUK website: http://www.bwea.com/pdf/publications/Offshore_report.pdf 8 Carbon Trust (2008). Offshore wind power: big challenge, big opportunity. London: Carbon Trust. 9 SQW Energy (2008). Today’s investment-tomorrows asset: skills and employment in the Wind, Wave and Tidal Sectors. Report to the British Wind Energy Association. Retrieved from: http://www.bwea.com/pdf/publications/BWEA%20Skills%20Report%20FINAL%2016oct.pdf 10 German Delegate . (2011, January). Ocean Energy: Germany. Ocean Energy Systems: An IEA Technology Initiative. Retrieved from: http://www.ocean-energy-systems.org/country-info/germany/ 11 “Germany OKs Huge Offshore Wind Farms.” (2009, September 21). Bloomberg Businessweek. Retrieved from: http://www.businessweek.com/globalbiz/content/sep2009/gb20090921_980817.htm 12 AFP. (2009, September 16). “Germany paves way to offshore wind farms.” Retrieved from: http://www.google.com/hostednews/afp/article/ALeqM5hq9p69qXzm9itIHk81grGxnV_Kfw 13 .S. Department of Energy, National Renewable Energy Laboratory. Musial, Walter, NREL and Bonnie Ram, Energetics. (2010, September). Large-Scale Offshore Wind Power in the United States: Assessment of Opportunities and Barriers. ( NREL/TP-500-40745). Retrieved from: www.nrel.gov/wind/pdfs/40745.pdf. 14 Hamilton, B., Lantz, E. & Paidipati, J. (2012). Offshore Wind Jobs and Economic Development Potential. National Renewable Energy Laboratory. Retrieved from http://usoffshorewind.org/wp-content/uploads/2012/05/USOWC-Offshore-JEDI-Webinar.pdf 15 IHS Inc. (2012, February). Assessment of the Economic Benefits of Offshore Wind in the Mid-Atlantic [Powerpoint]. Atlantic Grid Development. Retrieved from http://www.atlanticwindconnection.com/ferc/Oct2012/IHS_Study_AWC_EI_Review_MidAtlantic.pdf 16 Elston, Susan et al. (2011, February 23). Offshore Wind Feasibility Study, p. I-3-I-5. University of Maine and James
W. Sewall Company. Retrieved from: http://www.deepcwind.org/offshorewindreport 17 Kleinmhenz, Jack and Smith, Russ. (2010, July). The Potential Economic Impacts in Ohio Associated with the Emergence of a Lake Erie Offshore Wind Industry. Retrieved from Nortech website: http://www.nortech.org/images/stories/_pdf/LEEDCo_Economic_Impact_Study_FINAL.pdf.
INTERNATIONAL ECONOMIC DEVELOPMENT COUNCIL 10
DDiirreecctt aanndd IInnddiirreecctt JJoobbss
It is not always clear if projections of jobs include direct and indirect jobs and how indirect jobs
are measured. The most widely referenced job study (and the one on which U.S. projections are
based) is the 2009 EWEA job projection, which includes direct and indirect jobs.18 In that report,
151,000 jobs are projected for the offshore wind industry in Europe by 2020 and 215,000 by
2030.
However, the 2009 EWEA report only gives a breakdown for the share of indirect and direct
jobs for the wind industry at-large, inclusive of offshore and onshore both in 2007. Of the
151,300 wind industry jobs in 2007, 108,600 jobs (72%) are direct and 42,700 jobs (28%) are
indirect. If it is assumed that the direct-indirect jobs breakdown is similar for offshore wind as for
the entire wind industry, applying the 28% share to the 215,000 jobs projected for Europe by
2030 yields 154,000 direct jobs and 61,000 indirect jobs in offshore wind. The indirect jobs all
come from manufacturing and installation in the EWEA study referenced above and not from
installation, O&M, or other areas.
One could also apply this percentage to job projections in the U.S. However, this extrapolation is
subject to differences between offshore and land-based job demands as well as between Europe
and the U.S. Still, the bottom line is that the U.S. job projection figures, being based on the
European projection from EWEA, may very well include a share of indirect jobs (though this is not
discussed explicitly in the study)
PPeerrmmaanneenntt aanndd TTeemmppoorraarryy JJoobbss
The job projections in Table 1 are assumed to be permanent jobs. For example, the 43,000 jobs
projected for the U.S. offshore wind industry by 2030 is explicitly defined as a measure of
permanent jobs. This job projection was based on the EWEA 2009 study, so it is assumed that
likewise the figures for Europe are for permanent jobs.
In the cases where projections are for permanent jobs, there might be an undercount of
employment effects. There could be additional temporary job creation for construction and other
18 European Wind Energy Association. (2009, January). Wind at Work: Wind energy and job creation in the EU. Retrieved from: http://www.ewea.org/fileadmin/ewea_documents/documents/publications/Wind_at_work_FINAL.pdf
INTERNATIONAL ECONOMIC DEVELOPMENT COUNCIL 11
short-term jobs. In fact, the ratio of temporary construction jobs to permanent jobs may be high.
For example, the economic impact study for Cape Wind projects 1,000 jobs during construction
and permanent employment of about 50 people at the Cape Cod-based headquarters to
operate and maintain the wind farm. However, it does not say what the build-out period is for
construction. The study conducted for the Lake Erie project north of Cleveland Ohio projects job
creation over the whole time period from 2012 through 2030, and it shows a peak at 2027. The
maximum jobs throughout the duration of the time period are in construction, however, indicating
that construction jobs extend well beyond initial installation.
JJoobbss aanndd JJoobb YYeeaarrss
It is also important to note whether or not the figures being quoted refer to jobs or “job years.”
The unit of “job year” refers to one year in one job, so the estimate of 10 job years could mean
10 one-year positions, 5 two-year positions, or 1 ten-year job position. The metric of “job-year”
is becoming more and more widely used when analyzing job projections for future projects. It was
used by the White House in preparing projections for employment that would result from the
2009 ARRA stimulus bill. The effect can be to give the impression of a larger number of
permanent jobs being created than is the actual case. For Table 1, it is assumed that all the job
projections are for jobs and not job-years.19 However, there are some projections for job-years as
well. For example, the U.S. Department of Energy projects 43,000 permanent jobs, or more than
1.1 million job-years, associated with meeting its goal of 54 GW of offshore wind production.20
JJoobbss bbyy SSeeccttoorr aanndd SSkkiillll
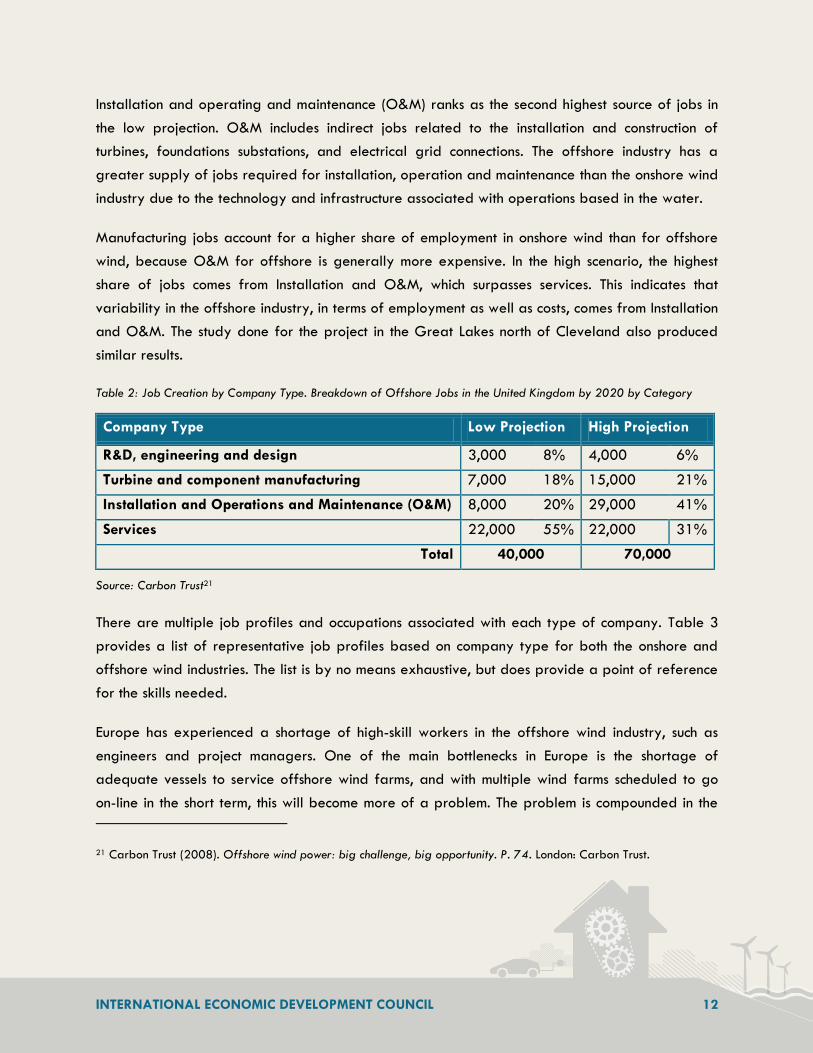
Table 2 shows the findings of a study by Carbon Trust for offshore wind job creation in the United
Kingdom. This includes a breakdown of jobs by company type, where employment is listed in
number of jobs and in percentage of total jobs. The high projection of 70,000 jobs for the UK by
2020 is the figure most commonly cited by supporters of the offshore industry. This figure assumes
a “proactive manufacturing strategy” that retains or attracts a large share of turbine and turbine-
component manufacturing in the UK and also transfers a large share of jobs from the oil and gas
industry.
19 http://www.whitehouse.gov/administration/eop/cea/Estimate-of-Job-Creation/ 20 Ibid, p. 7.
INTERNATIONAL ECONOMIC DEVELOPMENT COUNCIL 12
Installation and operating and maintenance (O&M) ranks as the second highest source of jobs in
the low projection. O&M includes indirect jobs related to the installation and construction of
turbines, foundations substations, and electrical grid connections. The offshore industry has a
greater supply of jobs required for installation, operation and maintenance than the onshore wind
industry due to the technology and infrastructure associated with operations based in the water.
Manufacturing jobs account for a higher share of employment in onshore wind than for offshore
wind, because O&M for offshore is generally more expensive. In the high scenario, the highest
share of jobs comes from Installation and O&M, which surpasses services. This indicates that
variability in the offshore industry, in terms of employment as well as costs, comes from Installation
and O&M. The study done for the project in the Great Lakes north of Cleveland also produced
similar results.
Table 2: Job Creation by Company Type. Breakdown of Offshore Jobs in the United Kingdom by 2020 by Category
Company Type Low Projection High Projection
R&D, engineering and design 3,000 8% 4,000 6%
Turbine and component manufacturing 7,000 18% 15,000 21%
Installation and Operations and Maintenance (O&M) 8,000 20% 29,000 41%
Services 22,000 55% 22,000 31%
Total 40,000 70,000
Source: Carbon Trust21
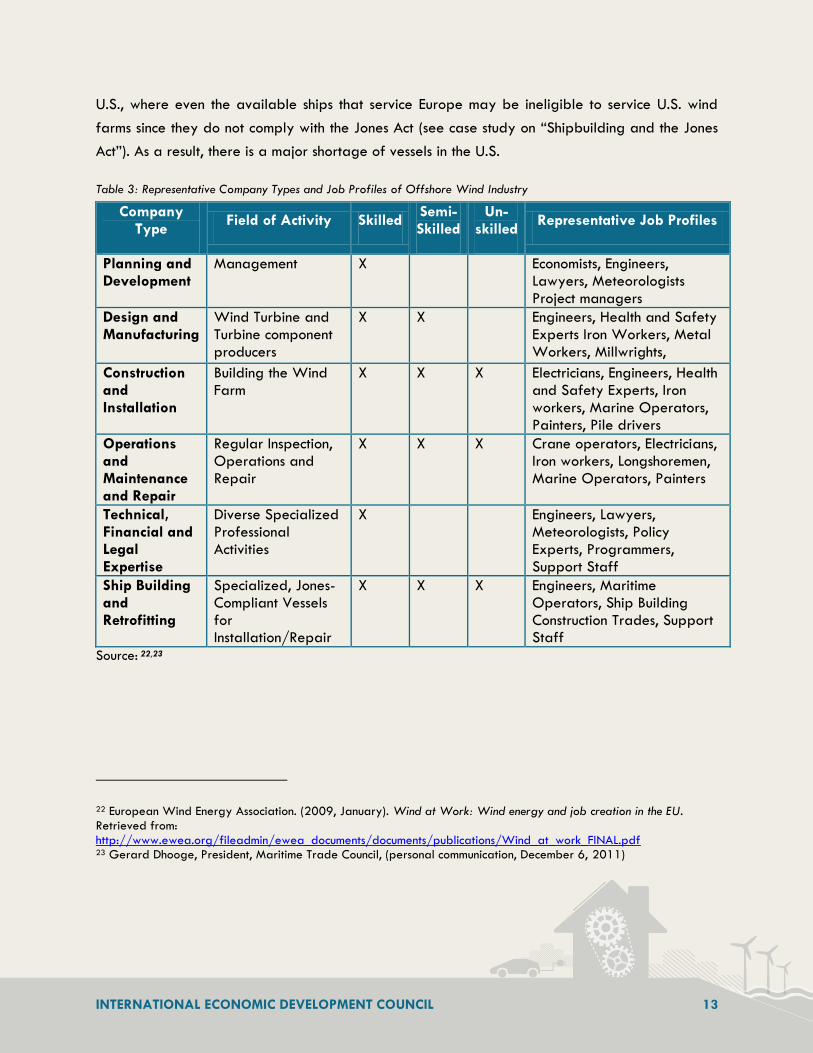
There are multiple job profiles and occupations associated with each type of company. Table 3
provides a list of representative job profiles based on company type for both the onshore and
offshore wind industries. The list is by no means exhaustive, but does provide a point of reference
for the skills needed.
Europe has experienced a shortage of high-skill workers in the offshore wind industry, such as
engineers and project managers. One of the main bottlenecks in Europe is the shortage of
adequate vessels to service offshore wind farms, and with multiple wind farms scheduled to go
on-line in the short term, this will become more of a problem. The problem is compounded in the
21 Carbon Trust (2008). Offshore wind power: big challenge, big opportunity. P. 74. London: Carbon Trust.
INTERNATIONAL ECONOMIC DEVELOPMENT COUNCIL 13
U.S., where even the available ships that service Europe may be ineligible to service U.S. wind
farms since they do not comply with the Jones Act (see case study on “Shipbuilding and the Jones
Act”). As a result, there is a major shortage of vessels in the U.S.
Table 3: Representative Company Types and Job Profiles of Offshore Wind Industry
Company Type
Field of Activity Skilled Semi-Skilled
Un-skilled
Representative Job Profiles
Planning and Development
Management X Economists, Engineers, Lawyers, Meteorologists Project managers
Design and Manufacturing
Wind Turbine and Turbine component producers
X X Engineers, Health and Safety Experts Iron Workers, Metal Workers, Millwrights,
Construction and Installation
Building the Wind Farm
X X X Electricians, Engineers, Health and Safety Experts, Iron workers, Marine Operators, Painters, Pile drivers
Operations and Maintenance and Repair
Regular Inspection, Operations and Repair
X X X Crane operators, Electricians, Iron workers, Longshoremen, Marine Operators, Painters
Technical, Financial and Legal Expertise
Diverse Specialized Professional Activities
X Engineers, Lawyers, Meteorologists, Policy Experts, Programmers, Support Staff
Ship Building and Retrofitting
Specialized, Jones-Compliant Vessels for Installation/Repair
X X X Engineers, Maritime Operators, Ship Building Construction Trades, Support Staff
Source: 22,23
22 European Wind Energy Association. (2009, January). Wind at Work: Wind energy and job creation in the EU. Retrieved from: http://www.ewea.org/fileadmin/ewea_documents/documents/publications/Wind_at_work_FINAL.pdf 23 Gerard Dhooge, President, Maritime Trade Council, (personal communication, December 6, 2011)
INTERNATIONAL ECONOMIC DEVELOPMENT COUNCIL 14
UU..SS.. PPrroojjeeccttiioonnss iinn DDeettaaiill
The U.S. Department of Energy estimates that in addition to the 43,000 permanent O&M jobs, the
target 54 GW of offshore wind production would require more than 1.1 million job-years to
manufacture and install the turbines.24 Reaching the target is also expected to generate an
estimated $200 billion in new economic activity.25 This calculation is based on a factor of more
than 20 jobs for each MW of new offshore wind, as extrapolated from a EWEA 2009 report.26
However, it should be noted that EWEA has revised its projection for MW, total jobs and jobs per
MW by 2030 in its more recent 2011 publication, which could affect U.S. estimates updated in
the future.
Some individual projects in the U.S. have conducted studies providing job projections. Lake Erie
Energy Development Corporation (LEEDCo) is undertaking the development of a 5,000 MW wind
farm in the waters north of Cleveland, Ohio. The stakeholders believe it could be a strong
generator of jobs, partially due to the existing port infrastructure and supply chain capacities
from the area’s onshore wind industry. By the time the wind farm is online, they project that 8,000
jobs will have been created. In Maine, the Deepwater Offshore Wind Plan is projected to
generate 7,000 to 15,000 jobs.
24 Ibid, p. 7. 25 U.S. Department of Energy. (2011, February). A National Offshore Wind Strategy: Creating an Offshore Wind Energy Industry in the United States, p. 7. Retrieved from http://www1.eere.energy.gov/windandhydro/pdfs/national_offshore_wind_strategy.pdf on July 20, 2011. 26 Ibid
INTERNATIONAL ECONOMIC DEVELOPMENT COUNCIL 15
TTHHEE SSTTAATTEE OOFF TTHHEE UU..SS.. OOFFFFSSHHOORREE WWIINNDD MMAARRKKEETT
CCuurrrreenntt MMaarrkkeett DDeevveellooppmmeenntt:: DDeellaayyeedd TTaakkeeooffff
The offshore wind industry in the United States is in the developmental stages. Projects are not yet
“in the water” (under construction) nor are they “on-line” (producing energy output). Some date
the emergence of the U.S. industry to November 15, 2001, when Cape Wind Associates filed its
first permit application for an offshore wind project off the coast of Cape Cod, Massachusetts. In
October 2010, Cape Wind received its lease from the federal government—another important
milestone in the development of the industry. As of mid 2013, Cape Wind is currently in the
project financing phase, with construction slated to begin at the end of the year.
But the process of development has continued to be frustrating for wind-farm developers,
economic developers, clean energy advocates, and a host of stakeholders in the industry. While
offshore wind generates energy in Europe and China, it has yet to be generated off U.S. coastal
waters, despite a growing demand for clean energy, a strong supply of wind resources, and a
line of projects in the pipeline. Development has been hampered by high capital costs, permitting,
financing, policy, and the inability to find buyers for the energy, which is priced high above fossil
fuels and other clean energies. Perhaps the most urgent hurdle is procurement, as there is a noted
disconnect between the lease-sale process and the market process. Still, stakeholders remain
vested in various attempts to create and stabilize conditions for takeoff. If the domestic land-
based industry is any example, the U.S. has the potential to lead the world in offshore wind as
well.
Based on examples from Europe and assessments of opportunity in the U.S., the offshore wind
industry has the potential to bring in substantial jobs and investment. 27, 28, 29, 30 It is projected to
27 U.S. Department of Energy, National Renewable Energy Laboratory. Musial, Walter, NREL and Bonnie Ram, Energetics. (2010, September). Large-Scale Offshore Wind Power in the United States: Assessment of Opportunities and Barriers. ( NREL/TP-500-40745). Retrieved from www.nrel.gov/wind/pdfs/40745.pdf on July 20, 2011 28 Pollin, Robert, Heintz, James and Heidi Garrett-Peltier. (2009, June). The Economic Benefits of Investing in Clean
Energy: How the Economic stimulus program and new legislation can boost U.S. economic growth and investment. Retrieved from Political Economy Research Institute website: http://www.peri.umass.edu/fileadmin/pdf/other_publication_types/green_economics/economic_benefits/economic_benefits.PDF
INTERNATIONAL ECONOMIC DEVELOPMENT COUNCIL 16
create more jobs than onshore wind per unit of energy production, due to the higher costs of
manufacturing and maintaining a wind farm in a marine environment. Further, in the long term,
offshore wind represents an even more productive and constant clean energy source. Winds from
off the coast blow more strongly and steady than land-based winds. The following sections
examine the offshore wind market in more detail.
FFaaccttoorrss IInnfflluueenncciinngg tthhee GGrroowwtthh ooff UU..SS.. MMaarrkkeett
Demand-Side Factors: Economic, Security, and Environmental
Despite a lack of offshore wind power currently online, the federal government has an ambitious
goal. Under President George W. Bush, the Department of Energy set a “20% Wind Energy by
2030” goal in July 2008.31 President Obama has reiterated this goal.32 The Department of
Energy’s 20% Wind Energy by 2030 report provided a scenario under which the U.S. would
generate 20% of its electricity from wind with offshore wind contributing 54 GW (54,000
MW).33 In order to meet this goal for offshore wind, the Department of Energy has detailed an
“OSWInD” strategy for offshore wind. The strategy calls for an interim deployment of 10GW of
capacity by 2020 at a cost of energy of $0.10/kWh en route to meeting the total production
goal of 54GW by 2030 at a cost of $0.07kWh.34
Offshore wind farms could provide a significant energy source to meet the energy demands of
population centers up and down the Atlantic seaboard. The U.S. Energy Information
Administration (EIA) projected electricity consumption to grow at a rate of 1.1%.35 Most domestic
29 Kleinhenz & Associates. (2010, July). The Potential Economic Impacts in Ohio Associated with the Emergence of a Lake Erie Offshore Wind Industry. Retrieved from: http://www.nortech.org/images/stories/_pdf/LEEDCo_Economic_Impact_Study_FINAL.pdf. 30 European Wind Energy Association (2007, December). Delivering Offshore Wind Power in Europe. Retrieved from: http://www.ewea.org/fileadmin/ewea_documents/images/publications/offshore_report/ewea-offshore_report.pdf. 31 U.S. Department of Energy, National Renewable Energy Laboratory. (2008, July) 20% Wind Energy by 2030: Increasing Wind Energy’s Contribution to U.S. Electricity Supply. (NREL/TP-500-41869). Retrieved from: http://www.nrel.gov/docs/fy08osti/41869.pdf. 32 White House Office of the Press Secretary. (2011, January 25). Remarks by the President in 2011 State of the Union Address. Retrieved from White House website: www.whitehouse.gov/the-press-office/2011/01/25/remarks-president-state-union-address/ 33 U.S. Department of Energy. (2011, February). A National Offshore Wind Strategy: Creating an Offshore Wind Energy Industry in the United States, Retrieved from
http://www1.eere.energy.gov/windandhydro/pdfs/national_offshore_wind_strategy.pdf. 34 Ibid, p. iii. 35 US Offshore Wind Collaborative. (2009, October). U.S. Offshore Wind Energy: A Path Forward. Retrieved from: http://www.usowc.org/
INTERNATIONAL ECONOMIC DEVELOPMENT COUNCIL 17
energy consumption occurs in the 26 states that have high coastal winds, including the dense
region of the Northeast.36
Clean energy sources, including offshore wind, are oftentimes more expensive per energy unit
than fossil fuels. Fluctuating commodity prices, supply chain inefficiencies, and a trend toward
larger and larger turbines are currently pushing up offshore wind costs in places like Europe.
Utilities and the consumers that they serve demand cheap energy sources and oppose increases to
their utility bills. As a result, states have found they must play a role in the market and mandate
that utilities produce a percentage of their energy from clean energy sources through the
introduction of renewable production standards (RPS). Offshore wind is an attractive alternative
particularly for regions like the Northeast. The Northeast does not have as plentiful a supply of
solar energy as other regions of the country, and it also may face obstacles to land-based wind
development, such as a lack of open land for new transmission lines.
However, RPS’s may not be sufficient to develop offshore wind due to the high costs of
development.37 States are exploring added incentives targeted at offshore wind such as “carve-
outs” and RPS multipliers (see discussion in Policy Tools section.)
Supply-Side Factors: Ample but Constrained
The U.S. absence from the offshore wind market is striking considering that in 2008 and 2009, it
was the top worldwide producer of onshore wind energy (losing the top spot to China in 2010.)38
By the end of 2010, the U.S. onshore wind industry had reached 40,181 MW of total installed
capacity with projects located in 38 states.39 The U.S. onshore wind industry has a far-reaching
supply of businesses and workers, including 400 manufacturing facilities employing about 20,000
36 U.S. Department of Energy, National Renewable Energy Laboratory. Musial, Walter, NREL and Bonnie Ram, Energetics. (2010, September). Large-Scale Offshore Wind Power in the United States: Assessment of Opportunities and Barriers, p. 2. ( NREL/TP-500-40745). Retrieved from www.nrel.gov/wind/pdfs/40745.pdf on July 20, 2011 37 Inwood, S. (2011, June). Program on Technology Innovation: Integrated Generation Technology Options, pp. I-11, Retrieved from Electric Power Research Institute website: http://rfflibrary.wordpress.com/2011/07/30/program-on-technology-innovation-integrated-generation-technology-options/. 38 Asmus, Peter. (2011, June 1). Which State Will Lead With First Installed Offshore Wind Project in the U.S.? Pike Research Blog Articles: Retrieved from http://www.pikeresearch.com/blog/articles/which-state-will-lead-with-first-installed-offshore-wind-project-in-the-u-s. 39 AWEA. (2011). AWEA U.S. Wind Industry Annual Market Report. Forward.
INTERNATIONAL ECONOMIC DEVELOPMENT COUNCIL 18
workers.40, 41 Additionally, about 50 percent of the content for turbines installed on U.S. soil is from
domestic suppliers, though some sources have indicated that this percentage has declined.42
The strong position of the U.S. in the onshore wind market should help with development of the
offshore wind industry. One advantage is that the industries share many of the same businesses in
their supply chains. This is particularly true for the Great Lakes and Gulf Coast regions, where the
land-based industry is especially strong. However, developing wind farms for the marine
environment requires specialized skills, technology, and equipment. Retooling and retraining is
necessary, and these will be discussed in the Domestic Manufacturing section of this report.
Two of the most important obstacles to offshore development are permitting and obtaining a
purchaser for the energy. These two obstacles are related to other hurdles hindering
development, including financing and opposition by stakeholders. It is estimated that it now takes
an average of seven to ten years for a project to be permitted.43 There are multiple agencies
with different and sometimes overlapping jurisdictions conducting the permitting. The first project
to initiate the permitting process was the Cape Wind project, which submitted its first application
in November, 2001 and was awarded a lease by the Department of Interior in October 2010.44
Beyond permitting, the additional challenge is finding purchasers for the wattage. This is
emerging as the more intractable barrier to the domestic offshore wind industry. Energy produced
by offshore wind farms is currently priced higher than energy from land-based wind farms.
Offshore wind is also priced higher than other fossil fuels, including coal, oil, and natural gas,
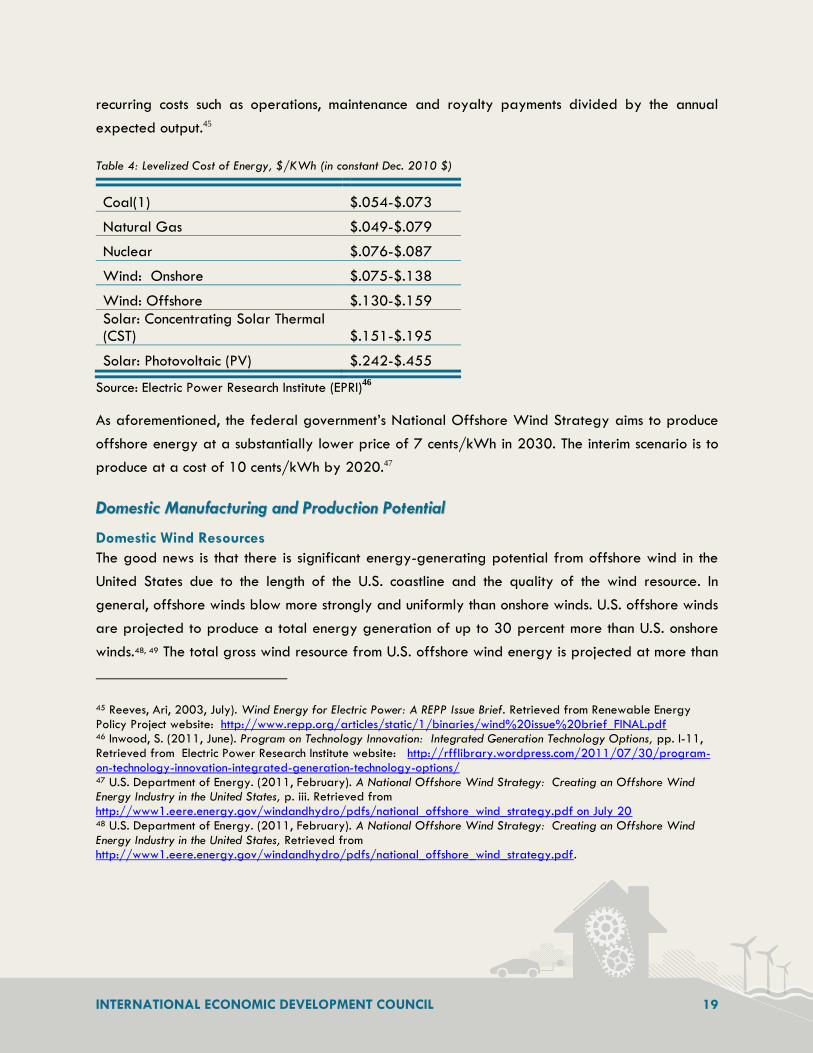
which are used to produce the majority of electricity in the U.S. Table 4 shows estimates from the
Electric Power Research Institute (EPRI) for the levelized cost of energy in 2015 for various energy
sources. The levelized cost of energy is the annual cost of recovering the total capital costs plus
40 Ibid, p. 36. 41 Ibid. 42 Ibid, Forward. 43 U.S. Department of Energy, National Renewable Energy Laboratory. Musial, Walter, NREL and Bonnie Ram, Energetics. (2010, September). Large-Scale Offshore Wind Power in the United States: Assessment of Opportunities
and Barriers. ( NREL/TP-500-40745). Retrieved from www.nrel.gov/wind/pdfs/40745.pdf. 44 U.S. Department of Energy. (2011, February). A National Offshore Wind Strategy: Creating an Offshore Wind Energy Industry in the United States, p. 17. Retrieved from http://www1.eere.energy.gov/windandhydro/pdfs/national_offshore_wind_strategy.pdf
INTERNATIONAL ECONOMIC DEVELOPMENT COUNCIL 19
recurring costs such as operations, maintenance and royalty payments divided by the annual
expected output.45
Table 4: Levelized Cost of Energy, $/KWh (in constant Dec. 2010 $)
Coal(1) $.054-$.073
Natural Gas $.049-$.079
Nuclear $.076-$.087
Wind: Onshore $.075-$.138
Wind: Offshore $.130-$.159
Solar: Concentrating Solar Thermal (CST) $.151-$.195
Solar: Photovoltaic (PV) $.242-$.455
Source: Electric Power Research Institute (EPRI)46
As aforementioned, the federal government’s National Offshore Wind Strategy aims to produce
offshore energy at a substantially lower price of 7 cents/kWh in 2030. The interim scenario is to
produce at a cost of 10 cents/kWh by 2020.47
DDoommeessttiicc MMaannuuffaaccttuurriinngg aanndd PPrroodduuccttiioonn PPootteennttiiaall
Domestic Wind Resources
The good news is that there is significant energy-generating potential from offshore wind in the
United States due to the length of the U.S. coastline and the quality of the wind resource. In
general, offshore winds blow more strongly and uniformly than onshore winds. U.S. offshore winds
are projected to produce a total energy generation of up to 30 percent more than U.S. onshore
winds.48, 49 The total gross wind resource from U.S. offshore wind energy is projected at more than
45 Reeves, Ari, 2003, July). Wind Energy for Electric Power: A REPP Issue Brief. Retrieved from Renewable Energy Policy Project website: http://www.repp.org/articles/static/1/binaries/wind%20issue%20brief_FINAL.pdf 46 Inwood, S. (2011, June). Program on Technology Innovation: Integrated Generation Technology Options, pp. I-11, Retrieved from Electric Power Research Institute website: http://rfflibrary.wordpress.com/2011/07/30/program-on-technology-innovation-integrated-generation-technology-options/ 47 U.S. Department of Energy. (2011, February). A National Offshore Wind Strategy: Creating an Offshore Wind Energy Industry in the United States, p. iii. Retrieved from
http://www1.eere.energy.gov/windandhydro/pdfs/national_offshore_wind_strategy.pdf on July 20 48 U.S. Department of Energy. (2011, February). A National Offshore Wind Strategy: Creating an Offshore Wind Energy Industry in the United States, Retrieved from http://www1.eere.energy.gov/windandhydro/pdfs/national_offshore_wind_strategy.pdf.
INTERNATIONAL ECONOMIC DEVELOPMENT COUNCIL 20
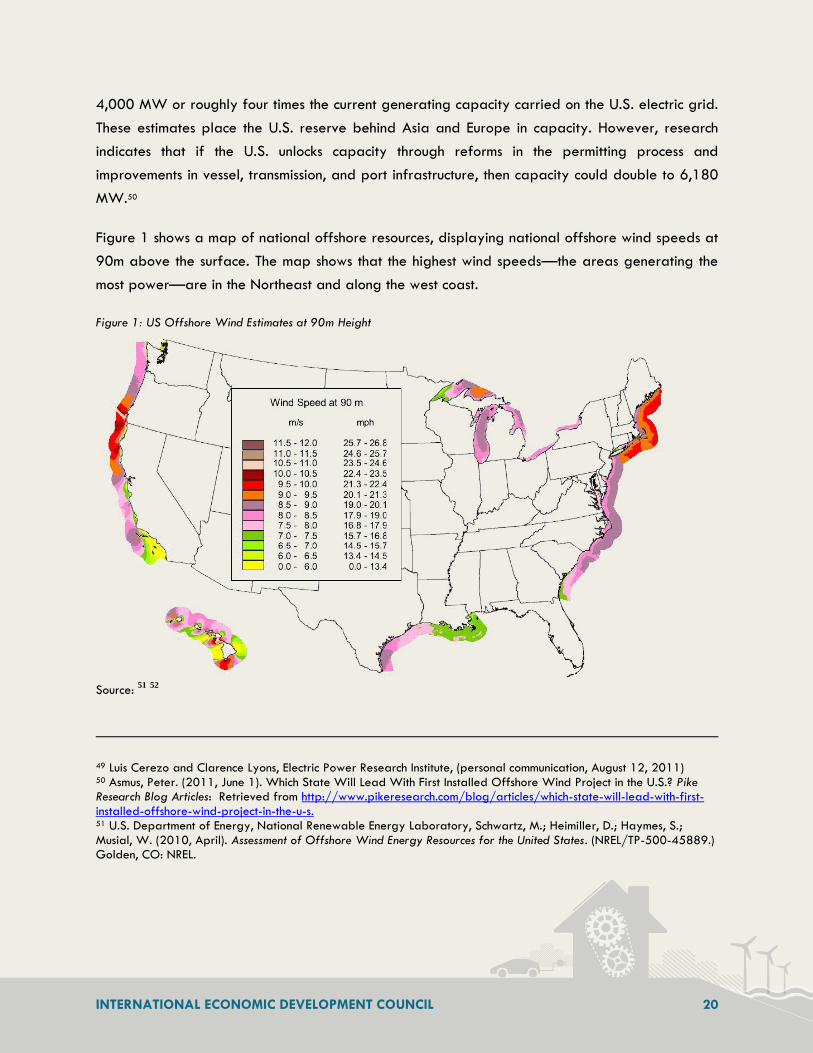
4,000 MW or roughly four times the current generating capacity carried on the U.S. electric grid.
These estimates place the U.S. reserve behind Asia and Europe in capacity. However, research
indicates that if the U.S. unlocks capacity through reforms in the permitting process and
improvements in vessel, transmission, and port infrastructure, then capacity could double to 6,180
MW.50
Figure 1 shows a map of national offshore resources, displaying national offshore wind speeds at
90m above the surface. The map shows that the highest wind speeds—the areas generating the
most power—are in the Northeast and along the west coast.
Figure 1: US Offshore Wind Estimates at 90m Height
Source: 51
52
49 Luis Cerezo and Clarence Lyons, Electric Power Research Institute, (personal communication, August 12, 2011) 50 Asmus, Peter. (2011, June 1). Which State Will Lead With First Installed Offshore Wind Project in the U.S.? Pike Research Blog Articles: Retrieved from http://www.pikeresearch.com/blog/articles/which-state-will-lead-with-first-
installed-offshore-wind-project-in-the-u-s. 51 U.S. Department of Energy, National Renewable Energy Laboratory, Schwartz, M.; Heimiller, D.; Haymes, S.; Musial, W. (2010, April). Assessment of Offshore Wind Energy Resources for the United States. (NREL/TP-500-45889.) Golden, CO: NREL.
INTERNATIONAL ECONOMIC DEVELOPMENT COUNCIL 21
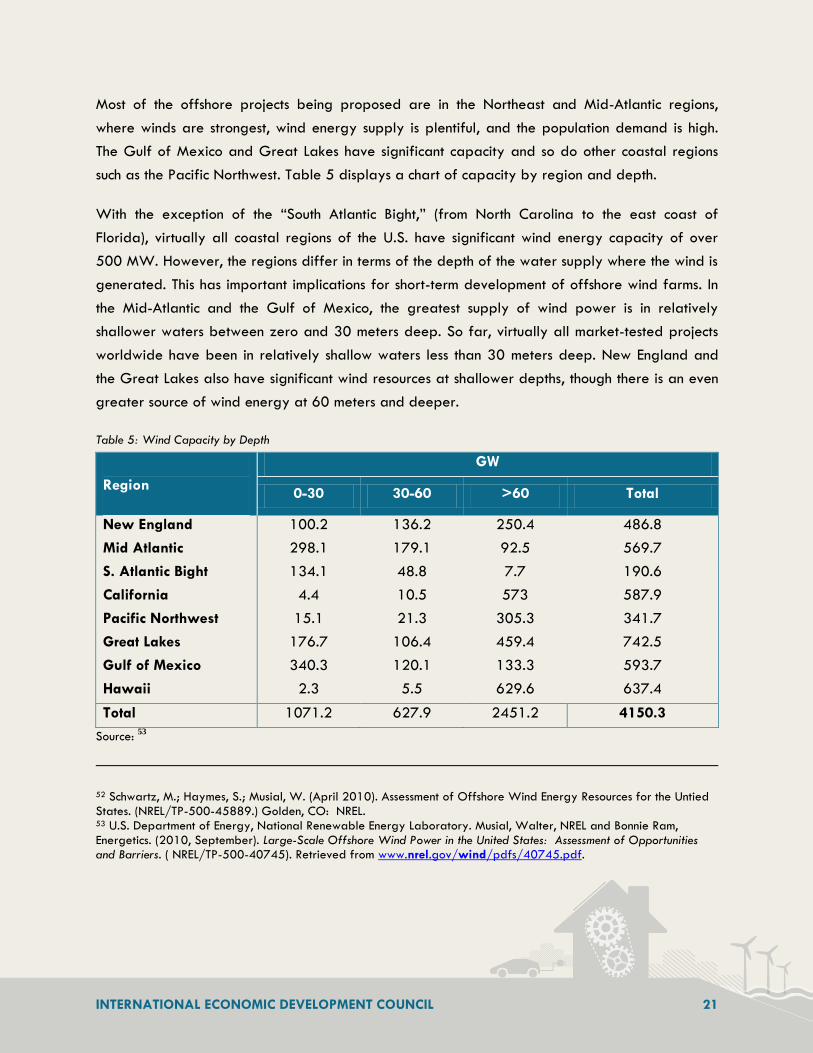
Most of the offshore projects being proposed are in the Northeast and Mid-Atlantic regions,
where winds are strongest, wind energy supply is plentiful, and the population demand is high.
The Gulf of Mexico and Great Lakes have significant capacity and so do other coastal regions
such as the Pacific Northwest. Table 5 displays a chart of capacity by region and depth.
With the exception of the “South Atlantic Bight,” (from North Carolina to the east coast of
Florida), virtually all coastal regions of the U.S. have significant wind energy capacity of over
500 MW. However, the regions differ in terms of the depth of the water supply where the wind is
generated. This has important implications for short-term development of offshore wind farms. In
the Mid-Atlantic and the Gulf of Mexico, the greatest supply of wind power is in relatively
shallower waters between zero and 30 meters deep. So far, virtually all market-tested projects
worldwide have been in relatively shallow waters less than 30 meters deep. New England and
the Great Lakes also have significant wind resources at shallower depths, though there is an even
greater source of wind energy at 60 meters and deeper.
Table 5: Wind Capacity by Depth
Region
GW
0-30 30-60 >60 Total
New England 100.2 136.2 250.4 486.8
Mid Atlantic 298.1 179.1 92.5 569.7
S. Atlantic Bight 134.1 48.8 7.7 190.6
California 4.4 10.5 573 587.9
Pacific Northwest 15.1 21.3 305.3 341.7
Great Lakes 176.7 106.4 459.4 742.5
Gulf of Mexico 340.3 120.1 133.3 593.7
Hawaii 2.3 5.5 629.6 637.4
Total 1071.2 627.9 2451.2 4150.3
Source: 53
52 Schwartz, M.; Haymes, S.; Musial, W. (April 2010). Assessment of Offshore Wind Energy Resources for the Untied
States. (NREL/TP-500-45889.) Golden, CO: NREL. 53 U.S. Department of Energy, National Renewable Energy Laboratory. Musial, Walter, NREL and Bonnie Ram, Energetics. (2010, September). Large-Scale Offshore Wind Power in the United States: Assessment of Opportunities and Barriers. ( NREL/TP-500-40745). Retrieved from www.nrel.gov/wind/pdfs/40745.pdf.
INTERNATIONAL ECONOMIC DEVELOPMENT COUNCIL 22
One drawback is that technology for building installations at greater depths is only recently
starting to become commercially available. Thus, while states like California and Hawaii may
have significant capacity at 60 meters and deeper, the offshore wind supply there is not likely to
be captured soon due to technological limitations. However, the U.S. is still devoting resources to
researching deep water or “next generation” technologies such as floating turbines. Wind
captured further offshore is stronger and can provide a more plentiful energy supply and
eventual economies of scale. The main active demonstration project involving floating turbines is
being proposed off the coast of Maine by Statoil. Statoil is a pioneer in floating turbine
technology; its Norwegian parent company built the world’s first large scale floating wind turbine
project off the coast of Norway.
PPrroojjeeccttss iinn tthhee PPiippeelliinnee
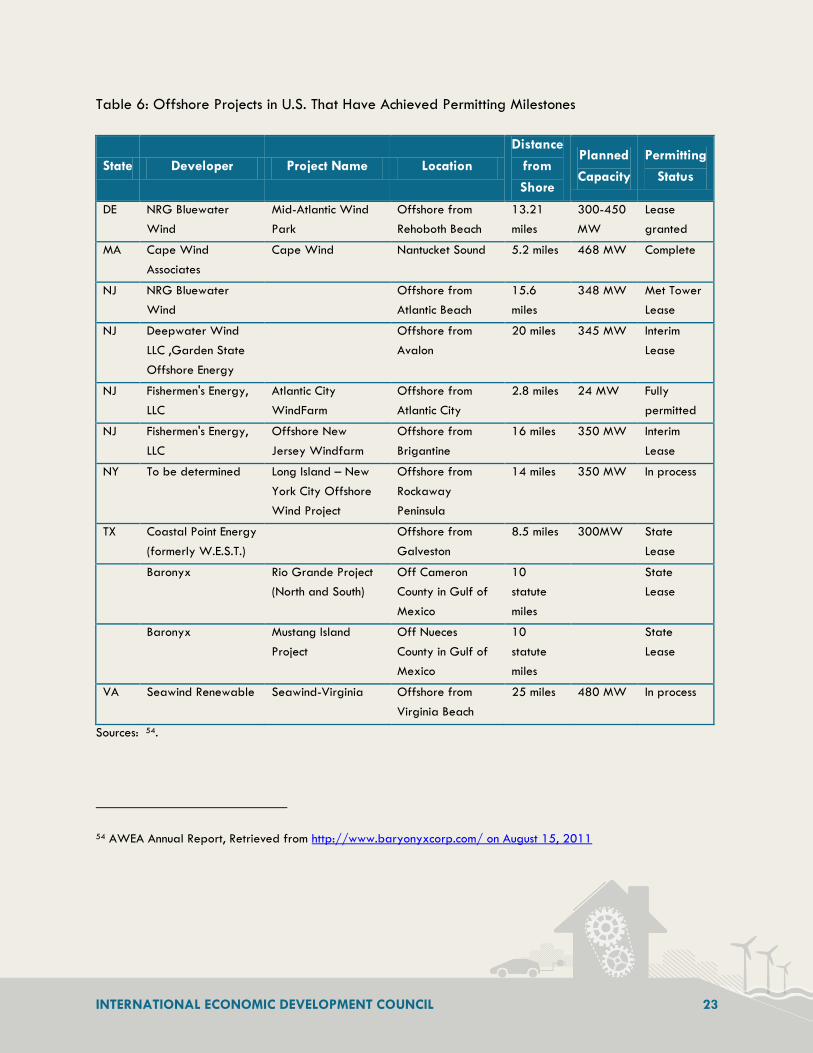
Table 6 is a list of projects that have achieved important milestones in permitting as of mid-2011.
It is perceived that the permitting process for projects in state waters—usually three nautical miles
(3 n.m.) or less from the coastline—takes less time than the permitting process for federal waters.
Indeed, as Table 6 shows, many projects which have been permitted are in state waters. Some
are demonstration projects with small energy output. In federal waters, demonstration projects
are often paired with large-scale utility projects proposed by the same developer. Other
projects, specifically in Texas, are utility-scale since the state’s waters extend nine nautical miles
from the coastline.
INTERNATIONAL ECONOMIC DEVELOPMENT COUNCIL 23
Table 6: Offshore Projects in U.S. That Have Achieved Permitting Milestones
State Developer Project Name Location
Distance
from
Shore
Planned
Capacity
Permitting
Status
DE NRG Bluewater
Wind
Mid-Atlantic Wind
Park
Offshore from
Rehoboth Beach
13.21
miles
300-450
MW
Lease
granted
MA Cape Wind
Associates
Cape Wind Nantucket Sound 5.2 miles 468 MW Complete
NJ NRG Bluewater
Wind
Offshore from
Atlantic Beach
15.6
miles
348 MW Met Tower
Lease
NJ Deepwater Wind
LLC ,Garden State
Offshore Energy
Offshore from
Avalon
20 miles 345 MW Interim
Lease
NJ Fishermen's Energy,
LLC
Atlantic City
WindFarm
Offshore from
Atlantic City
2.8 miles 24 MW Fully
permitted
NJ Fishermen's Energy,
LLC
Offshore New
Jersey Windfarm
Offshore from
Brigantine
16 miles 350 MW Interim
Lease
NY To be determined Long Island – New
York City Offshore
Wind Project
Offshore from
Rockaway
Peninsula
14 miles 350 MW In process
TX Coastal Point Energy
(formerly W.E.S.T.)
Offshore from
Galveston
8.5 miles 300MW State
Lease
Baronyx Rio Grande Project
(North and South)
Off Cameron
County in Gulf of
Mexico
10
statute
miles
State
Lease
Baronyx Mustang Island
Project
Off Nueces
County in Gulf of
Mexico
10
statute
miles
State
Lease
VA Seawind Renewable Seawind-Virginia Offshore from
Virginia Beach
25 miles 480 MW In process
Sources: 54.
54 AWEA Annual Report, Retrieved from http://www.baryonyxcorp.com/ on August 15, 2011
INTERNATIONAL ECONOMIC DEVELOPMENT COUNCIL 24
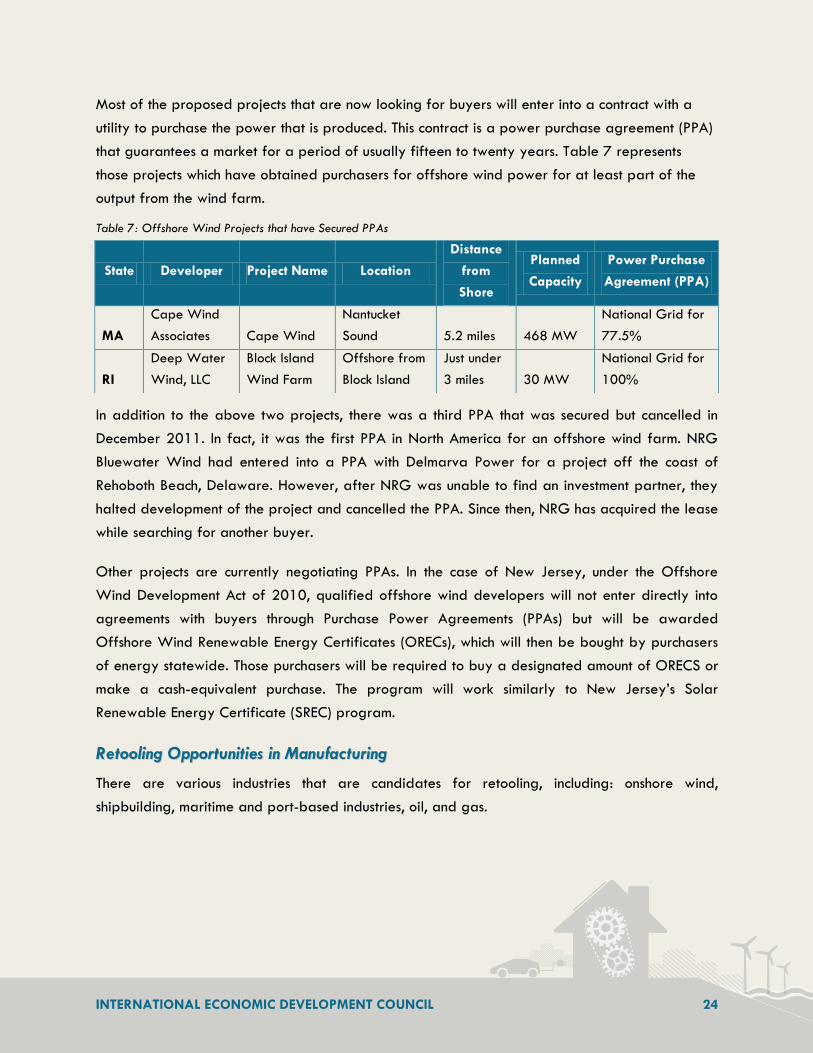
Most of the proposed projects that are now looking for buyers will enter into a contract with a
utility to purchase the power that is produced. This contract is a power purchase agreement (PPA)
that guarantees a market for a period of usually fifteen to twenty years. Table 7 represents
those projects which have obtained purchasers for offshore wind power for at least part of the
output from the wind farm.
Table 7: Offshore Wind Projects that have Secured PPAs
In addition to the above two projects, there was a third PPA that was secured but cancelled in
December 2011. In fact, it was the first PPA in North America for an offshore wind farm. NRG
Bluewater Wind had entered into a PPA with Delmarva Power for a project off the coast of
Rehoboth Beach, Delaware. However, after NRG was unable to find an investment partner, they
halted development of the project and cancelled the PPA. Since then, NRG has acquired the lease
while searching for another buyer.
Other projects are currently negotiating PPAs. In the case of New Jersey, under the Offshore
Wind Development Act of 2010, qualified offshore wind developers will not enter directly into
agreements with buyers through Purchase Power Agreements (PPAs) but will be awarded
Offshore Wind Renewable Energy Certificates (ORECs), which will then be bought by purchasers
of energy statewide. Those purchasers will be required to buy a designated amount of ORECS or
make a cash-equivalent purchase. The program will work similarly to New Jersey’s Solar
Renewable Energy Certificate (SREC) program.
RReettoooolliinngg OOppppoorrttuunniittiieess iinn MMaannuuffaaccttuurriinngg
There are various industries that are candidates for retooling, including: onshore wind,
shipbuilding, maritime and port-based industries, oil, and gas.
State Developer Project Name Location
Distance
from
Shore
Planned
Capacity
Power Purchase
Agreement (PPA)
MA
Cape Wind
Associates Cape Wind
Nantucket
Sound 5.2 miles 468 MW
National Grid for
77.5%
RI
Deep Water
Wind, LLC
Block Island
Wind Farm
Offshore from
Block Island
Just under
3 miles 30 MW
National Grid for
100%
INTERNATIONAL ECONOMIC DEVELOPMENT COUNCIL 25
Onshore-Offshore Retooling
The most obvious kind of retooling, which prima facie seems the easiest, is retooling onshore
manufacturers and supply chain businesses to service the offshore industry. However, there are
substantial differences in production. The main component markets of the turbine are: foundations,
towers, nacelles, blades, power cable systems, marine installation, operations and maintenance,
and vessel construction.55 While many of these components are similar across land-based and
offshore turbines, the marine climate does lend itself to some important design differences. For
instance:
Most offshore installations use larger turbine designs.
Corrosion protection is needed with outside surface protection against environmental
contaminants such as salt.
Foundation design for offshore wind development requires larger multi-pile foundations for
towers as well as floating structures and towers.
These products offer new opportunities for existing manufacturers of turbines and foundations to
innovate or for new entrants to the field. The general trend has been a focus on scaling current
technology to accommodate the larger sizes needed for greater depths and stronger winds.56
However, some expertise will be outside the scope of land-based technology. In some cases,
investments to adapt a facility to produce for the offshore market may be prohibitively
expensive. As a result, the land-based supply chain may have the capacity to produce some
components for the land-based industry, but eventually experts predict there will also be some
“decoupling.” A “decoupling” implies that a supply chain dedicated to production of offshore
technology and products may emerge. The move for more radical and “next-generation”
redesign would likely involve the activities of a new, specialized offshore supply chain.
55 Kleinhenz & Associates. (2010, July). The Potential Economic Impacts in Ohio Associated with the Emergence of a Lake
Erie Offshore Wind Industry. Retrieved from: http://www.nortech.org/images/stories/_pdf/LEEDCo_Economic_Impact_Study_FINAL.pdf. 56 US Offshore Wind Collaborative. (2009, October). U.S. Offshore Wind Energy: A Path Forward. Retrieved from: http://www.usowc.org/
INTERNATIONAL ECONOMIC DEVELOPMENT COUNCIL 26
Ship Building Industry
There is also potential in the shipbuilding industry for the manufacturing of specialized offshore
wind vessels. There are several factors precipitating demand for domestic production of these
ships. Currently, there are virtually no such ships in the U.S., since the offshore wind industry is not
yet on-line, and the supply servicing offshore wind farms in Europe and Asia is being utilized at
full capacity. Additionally, it would be very expensive to charter a boat from Europe to service
U.S. installations. Finally, based on the interpretation of the Jones Act, which has been in existence
since 1920, foreign vessels may not be allowed to service wind farms in U.S. waters. With
offshore wind vessels costing an estimated $260 million and taking about two years to build,
manufacturing of these ships could be a boon to the U.S. shipbuilding industry and result in the
retention or creation of a significant number of jobs.57, 58 However, the industry will need
incentives and financing mechanisms that help developers mitigate the risk associated with such a
large investment.
57 Trabish, Herman. (2010, December 30). The Emerging Opportunity in Offshore Wind Vessels. Greentechmedia.
Retrieved from: http://www.greentechmedia.com/articles/read/the-emerging-opportunity-in-offshore-wind-vessels/ 58 Fichaux, Nicholas & Wilkes, Justin. (2009). Oceans of Opportunity: Harnessing Europe’s largest domestic resource, p. 55. Retrieved from European Wind Energy Association website: http://www.ewea.org/fileadmin/ewea_documents/documents/publications/reports/Offshore_Report_2009.pdf

INTERNATIONAL ECONOMIC DEVELOPMENT COUNCIL 27
Ship Building Industry and the Jones Act
The Jones Act restricts the transportation of merchandise between points in the U.S. to U.S.
built-vessels. These ships must fly the flag of the U.S. and be owned and crewed by U.S.
citizens. If indeed the Jones Act is judged to apply to the huge seagoing vessels needed to
erect and maintain offshore wind turbines, then there are a few important implications. In the
short term, there would be a shortage/absence of specialized vessels to service offshore wind
farms in the U.S. The best candidates would be ships used to service the oil and gas industries
that are located in the Gulf of Mexico.
In the longer term, this could be a boon for the U.S. ship building industry. The European
experience indicates that specialized wind system installation vessels, rather than adapted oil
and gas vessels, are required for cost-effective, high volume installation. Such vessels are major
undertakings, as they must support 100 to 200 ton towers and cranes, are estimated to cost
$150 million to $250 million per ship, and take about two years to construct. Another
possibility is that foreign companies already building these ships—including South Korea’s
Daewoo Shipbuilding and Marine Engineering and Samsung Heavy Industries, Poland’s Crist
Shipyard, and Germany’s Sietas shipyard—set up a domestic shipbuilding capacity in the U.S.
so that their ships could comply with the Jones Act.
Precedents are still being established. It is possible that further legal interpretation could allow
foreign ships. In May 2010, regulators indicated that a stationary foreign vessel could be used
in U.S. waters to install a meteorological tower, which would be necessary for offshore wind
farms. But for reasons including the Jones Act, as well as the high cost of leasing foreign ships
and the lack of availability, the U.S. ship-building industry could stand to benefit.

INTERNATIONAL ECONOMIC DEVELOPMENT COUNCIL 28
Maritime and Port-Based Industry/Oil and Gas Industry
Ports will serve as future staging areas for offshore wind farms, and the businesses that currently
support ports will have to gain skills and capacity related to the new industry. An existing port
infrastructure is needed for the large specialized ships that service offshore wind farms. A strong
local supply chain of businesses is also crucial. The Gulf of Mexico is one area that has both a
strong port-based industry and an existing supply chain that operates in deep water due to its
experience in oil and gas.
Other Manufacturing and Industries
In addition to the industries mentioned above, there may be opportunities in offshore wind for
welders, metal workers, semiconductor companies, machinists, and construction workers. Various
state supply chain studies (often based on similar ones focused on onshore wind) have identified
businesses by NAICS code.
OOppppoorrttuunniittiieess iinn FFoorreeiiggnn DDiirreecctt IInnvveessttmmeenntt
Just as foreign onshore wind companies such as Gamesa, Siemens, and Mitsubishi have invested in
U.S. facilities, foreign manufacturers with offshore facilities could confer economic benefits to the
U.S. as well. However, so far foreign companies are not moving major manufacturing facilities to
the U.S. as they are waiting for U.S. offshore wind farms to start construction, become
operational, and start producing a steady stream of energy.
Most current U.S. offshore developments are already importing components or have their sights
set on importing turbines and major components from foreign companies. Energy Management,
Inc., the company developing the Cape Wind project in Cape Cod, has indicated it will buy its
turbines from Siemens.59 The Deepwater Wind project off the coast of Rhode Island is interested
in the most state-of-the-art and largest turbine on the market: the 6MW turbine being
manufactured by Repower Systems, Nordex, Alstom, and Siemens. All of these are foreign
companies.60 Indeed, in its report for the Massachusetts Clean Energy Center, Tetra Tech EC, Inc.
59 George Sterzinger, personal communication, July 25, 2011. 60 Franco, Mark del. (2011, Summer). “The 6MW Offshore Turbine Sets Sail for North America.” Offshore Wind. A Supplement to Wind Power. P. 10.
[Type a
quote from
the
document
or the
summary of
an
interesting
point. You
can position
the text
box anyere
the
document.
Use the
Text Box
Tools tab to
change the
formatting
of the pull
quote text
box.]

INTERNATIONAL ECONOMIC DEVELOPMENT COUNCIL 29
concludes that “most, if not all, turbine components pieces for the planned offshore wind farms
would be manufactured and shipped from European facilities.”61
However, foreign companies have also begun to partner with U.S. companies. The Spanish
company Gamesa partnered with Northrop Grumman’s shipbuilding operations to launch the
Offshore Wind Technology Center in Chesapeake, Virginia and develop the next generation of
wind technology suitable for offshore conditions.62
OOppppoorrttuunniittiieess iinn EExxppoorrtt DDeevveellooppmmeenntt
Development for the export market provides economic returns for U.S. businesses. Not only will it
produce revenue and jobs, but it will also help the domestic industry develop expertise. When the
offshore industry takes off in the U.S., these businesses will be ready to serve that market.
There is some export potential in the works, specifically in research and development. Within the
U.S., General Electric has developed a 4.0 MW turbine for the offshore wind market. As of
October 2010, GE had 35.7 MW installed offshore in Sweden and Ireland and was testing
38.5MW in Norway.63 In addition, Clipper Wind has developed, but has not yet deployed, its
Brittania 10.0 MW turbine.64 Because offshore wind development is still a nascent field, there is
room for the U.S. to compete and become a technology and manufacturing leader (see text box
below.)
http://issuu.com/zackinpublications/docs/osf2010_online?mode=embed&layout=http%3A%2F%2Fskin.issuu.com%2Fv%2Flight%2Flayout.xml&showFlipBtn=true. 61 Tetra Tech EC, Inc. (February 2010). Port and Infrastructure Analysis for Offshore Wind Energy Development, p. 6. Retrieved from Massachusetts Clean Energy Center website: http://www.masscec.com/index.cfm/pk/download/id/11693/pid/11151. 62 Franco, Mark del. (2011, Summer). State Addresses Offshore Issues. Offshore Wind. A Supplement to Wind Power. pp. 3-4. Retrieved from http://issuu.com/zackinpublications/docs/osf2010_online?mode=embed&layout=http%3A%2F%2Fskin.issuu.com%2Fv%2Flight%2Flayout.xml&showFlipBtn=true 63 AWEA. (October). Presentation at the AWEA. 64 AWS Truewind. (2010, September). New York’s Offshore Wind Energy Development Potential in the Great Lakes: Feasibility Study.” Retrieved from: http://www.awstruepower.com/wpcontent/media/2010/09/NYSERDA_AWST_NYGreatLakesFS.pdf. On August 1, 2011.
INTERNATIONAL ECONOMIC DEVELOPMENT COUNCIL 30
U.S. Companies Powering Wind in Asia and Europe
If not manufacturing or servicing the U.S. offshore industry, U.S. firms can develop products for
the foreign market, just as American Semiconductor and Principle Power are making products
for China and Europe. American Superconductor has a strong foothold in the overseas offshore
wind-farm market. Its superconducting technology is leading it into the market of
superconducting wind turbines, which it has commercially licensed for the overseas market in
Europe and China. The company hopes that U.S. wind farms will one day be a customer.
Meanwhile, Principle Power’s technology will be deployed in Portugal.
Overall European demand is high. In Europe, there is a projected need for 30 GW over the
next five years, which would require 10,000 turbine structures by 2020 to meet demand
forecasts. The current manufacturing industry does not have the this fabrication capacity, which
presents export opportunities for U.S. manufacturers.
CCoommppaarraattiivvee aanndd CCoommppeettiittiivvee AAddvvaannttaaggeess ooff tthhee IInndduussttrryy wwiitthhiinn tthhee UU..SS..
Of the approximately 20 projects in the pipeline, the majority of proposed offshore wind farms
have been located in the North Atlantic and Mid-Atlantic regions of the Atlantic Outer Continental
Shelf (OCS), the Great Lakes region, and the Gulf of Mexico.65 Within the OCS, some of the
earliest projects have been in the North Atlantic, including the Cape Wind Massachusetts project
that was the first to receive a federal permit. But the Mid-Atlantic states of Maryland, Delaware,
Virginia, and North Carolina are also developing projects and are a target area of federal
support.
Meanwhile, the Great Lakes region and Texas have their own comparative advantages, including
being in state water jurisdiction. Table 8 outlines a few of the main regional advantages of the
North Atlantic, Mid-Atlantic, Great Lakes, and Gulf Coast.
65 The DOE divides the OCS into the following areas: North Atlantic (Maine, New Hampshire, Massachusetts, Rhode Island, Connecticut, New York, New Jersey); Mid-Atlantic (Delaware, Maryland, Virginia, North Carolina); South Atlantic (South Carolina, Georgia, Florida) and Straits of Florida (Florida).

INTERNATIONAL ECONOMIC DEVELOPMENT COUNCIL 31
Table 8: Regional Advantages
Region Strong
Demand
Early/
Demo
Projects
State Water
Jurisdiction
Land-Based
Wind
Synergy
Port/Oil
and Gas
Synergy Weather
North Atlantic X X X
Mid-Atlantic X X X
Great Lakes X X X X
Gulf Coast X X X
NNoorrtthh AAttllaannttiicc –– HHiigghh DDeemmaanndd CCeenntteerrss
This region includes Massachusetts, Maine, and Rhode Island. These states have several distinct
advantages.
Strong wind supply
Maine has some of the strongest winds on the Atlantic coast. The winds along the coast follow the
pattern of being strongest in the north and weaker further south, which explains the absence of
offshore wind farm development among states in the southern U.S.
Demand
The North Atlantic is the most densely populated area in the U.S. and also has some of the highest
electricity rates. Many of the states in the Northeast depend heavily on heating oil to heat the
homes, which results in particularly high heating bills.
Research and Development (R&D)
There is extensive R&D being done in these areas. The Advanced Structures and Composite
Center (AEWC) in Maine is the major R&D center in the country for deep water/“next generation”
technology. The Massachusetts testing facility will allow domestic turbine component companies to
develop their technology for the offshore industry.
Early Projects
In 2010, the Cape Wind Project received the first lease to build a wind farm in the Nantucket
Sound (see case study in Appendix 2). It is almost a decade in development and could become

INTERNATIONAL ECONOMIC DEVELOPMENT COUNCIL 32
the first wind farm off the coast of U.S. waters. It has made the most progress toward achieving
regulatory approval, but the project is still trying to get a major utility to buy the balance of the
project’s power. The utility National Grid has entered into a PPA for one-half the supply, and the
State of Massachusetts has entered into a PPA for 27.5% of the rest.
Demonstration Projects
In Rhode Island and New Jersey, developers are proposing demonstration projects. Demonstration
projects have the advantage of potentially developing faster since they can go through state
permitting channels and do not require such a large investment outlay.
Disadvantages
The North Atlantic region also suffers from some disadvantages. With a relatively longer history
of proposed offshore wind development, opposition to this has also developed and grown over
time. In Massachusetts, the Alliance to Protect Nantucket Sound was formed in 2011 with the
mission of the long-term preservation of Nantucket Sound. The group comprises a vast diversity of
stakeholders including U.S. Senators, state representatives, towns and counties on the Sound,
fishing groups, environmental groups, and other interests. The opposition of the late Senator
Edward Kennedy to the project was a major thorn in the side of developers and proponents. In
New Jersey, the Beacon Group recently released a highly publicized report claiming that the
State’s Offshore Wind Development Act would pass on the project’s high cost to residential and
commercial electricity consumers and would result in a net loss of revenue and jobs for the state of
New Jersey.66
Waters in the far northeast experience some icy conditions, but this is not enough to significantly
affect design and conditions for wind turbines, according to the Department of Energy. Likewise,
66 Tuerck, David, Bachman, Paul, & Murphy, Ryan. (2011, June). The Cost and Economic Impact of New Jersey’s Offshore Wind Initiative. Retrieved from Beacon Hill Institute website: http://www.beaconhill.org/BHIStudies/NJ-Wind-2011/NJWindReport2011-06.pdf.
INTERNATIONAL ECONOMIC DEVELOPMENT COUNCIL 33
there is some risk of extreme weather conditions from “nor’easter” storms, but this also should not
significantly affect wind farm development.67
MMiidd--AAttllaannttiicc –– TThhee NNeexxtt NNeeww FFrroonnttiieerr??
This region includes New Jersey, Delaware, Maryland, and Virginia. Despite the highest profile
offshore project being the Cape Wind project in Massachusetts, various Mid-Atlantic states are
competing to have the first offshore energy project on-line. These states have advantages
including the following.
Federal Focus
Public sector investment has been strongest in the Mid-Atlantic. In 2009, the Department of Interior
issued its first five leases for offshore development: four in New Jersey and one in Delaware.
These five “interim leases” allowed companies to begin preliminary site research by erecting
meteorological towers to measure things like wind and wave speed and direction. Additionally,
the federal government (DOE) is beginning its new initiative to streamline the leasing process in
New Jersey, Delaware, Maryland, and Virginia. As a first step, it has completed a draft
environmental assessment for the wind energy areas (WEAs) in these states.68
Demand
There is strong demand for indigenous sources of energy in the Mid-Atlantic. Virginia, for
example, is the second largest importer of electricity after California.69
67 U.S. Department of Energy, National Renewable Energy Laboratory. Musial, Walter, NREL and Bonnie Ram, Energetics. (2010, September). Large-Scale Offshore Wind Power in the United States: Assessment of Opportunities and Barriers, p. 56. ( NREL/TP-500-40745). Retrieved from www.nrel.gov/wind/pdfs/40745.pdf. 68 U.S. Department of the Interior, Bureau of Ocean Energy Management, Regulation and Enforcement, Office of Offshore Alternative Energy Programs. (2011, July). “Commercial Wind Lease Issuance and Site Characterization Activities on the Atlantic Outer Continental Shelf Offshore New Jersey, Delaware, Maryland, and Virginia. Draft Environmental Assessment.” Retrieved from http://www.boemre.gov/offshore/RenewableEnergy/PDFs/MidAtlanticWEAs_DraftEA.pdf on July 15, 2011. 69 Franco, Mark del. (2011, Summer). State Addresses Offshore Issues. Offshore Wind. A Supplement to Wind Power. Pp. 3-4. Retrieved from: http://issuu.com/zackinpublications/docs/osf2010_online?mode=embed&layout=http%3A%2F%2Fskin.issuu.com%2Fv%2Flight%2Flayout.xml&showFlipBtn=true on July 27, 2011.
INTERNATIONAL ECONOMIC DEVELOPMENT COUNCIL 34
Disadvantages
The Mid-Atlantic contains waters that are located in or near the tropical waters coming from the
Gulf of Mexico, which often lead to hurricane threats up and down the coast. As a result, survival
conditions for turbines in the Mid-Atlantic and in the Gulf states (including Florida, Texas, and
Louisiana) will be affected.70 This is a threat not faced by wind farms in Europe.
GGrreeaatt LLaakkeess –– WWhheerree tthhee TTuurrbbiinneess BBllooww IInnllaanndd
This region includes New York, Michigan, and Ohio and is differentiated from other coastal areas
in the U.S. because its wind power generates from a freshwater supply. There are several
advantages of the region.
Gentler Water Conditions
The Great Lakes comparative advantages include wave loads that are roughly a third of those in
rougher ocean climates. This provides for better construction conditions and potentially different
weatherization requirements for equipment going in the water.71
State Permits
The U.S. Army Corps of Engineers has prime federal jurisdiction over permitting offshore wind
energy in Great Lakes. There is a memorandum of understanding between the Army Corps and
several states to coordinate review of these projects.
Domestic Supply Chain Proximity
Unlike the ACS areas, the Great Lakes region is near an already developed supply chain of
businesses for the onshore wind industry. For example, the Ohio Department of Development has
identified more than 500 existing businesses in the wind supply chain, with the largest clusters
70 U.S. Department of Energy, National Renewable Energy Laboratory. Musial, Walter, NREL and Bonnie Ram, Energetics. (2010, September). Large-Scale Offshore Wind Power in the United States: Assessment of Opportunities and Barriers, p. 57. ( NREL/TP-500-40745). Retrieved from www.nrel.gov/wind/pdfs/40745.pdf. 71 Franco, Mark del. (2011, Summer). Capacity Meets Commerce in Lake Erie Wind Project. Offshore Wind. A Supplement to Wind Power, P. 10. Retrieved from: http://issuu.com/zackinpublications/docs/osf2010_online?mode=embed&layout=http%3A%2F%2Fskin.issuu.com%2Fv%2Flight%2Flayout.xml&showFlipBtn=true
INTERNATIONAL ECONOMIC DEVELOPMENT COUNCIL 35
around Cleveland, Cincinnati, Dayton, Toledo, and Columbus.72 The Great Lakes region is home to
a manufacturing base that has drastically downsized in the past few decades and is hoping some
of its former capacities in automotive manufacturing and machine tooling might be adapted to
offshore wind.
Port/Infrastructure Capacity
In addition to having businesses that supply the industry, the Great Lakes region also has
experience with, and infrastructure developed to, ship turbine components.
Disadvantages
Disadvantages of this region include the relatively weak strength of winds that will lead to a
lower energy output. Another concern for offshore development is that shipping lanes in the Great
Lakes are too narrow for the passage of some of the oversized vessels that transport the large
turbines for offshore wind farms. Finally, the icy conditions in the Great Lakes can serve as a
threat to production at the wind farms and necessitates the construction of properly weatherized
equipment.73
GGuullff CCooaasstt//TTeexxaass -- OOiill aanndd OOnnsshhoorree WWiinndd EEnneerrggyy SSyynneerrggiieess
The Gulf Coast has several advantages, including the following.
Synergy with Oil and Gas Industry
The supply chain that services the oil fields of the Gulf of Mexico may be able to adapt and
service the offshore wind industry. Texas’s oil industry confers the state a unique expertise in deep
water technology, including foundations and platforms associated with drilling for oil off the
coast. This expertise may be transferrable to deepwater offshore wind farm operations. More
generally, Texas has an advantage in its port infrastructure and marine industries. It has an
established industry dedicated to offshore engineering, construction, and fabrication for large
72 Ohio Department of Development. Retrieved from
http://development.ohio.gov/wind/ManufacturingSupplyChain.htm/ 73 U.S. Department of Energy, National Renewable Energy Laboratory. Musial, Walter, NREL and Bonnie Ram, Energetics. (2010, September). Large-Scale Offshore Wind Power in the United States: Assessment of Opportunities and Barriers, p. 57-58. ( NREL/TP-500-40745). Retrieved from www.nrel.gov/wind/pdfs/40745.pdf.
INTERNATIONAL ECONOMIC DEVELOPMENT COUNCIL 36
ships and platforms as well as a harbor system with readiness for portside staging and
fabrication. The development of an offshore wind industry could also come at a welcome time for
the local economy if the oil exploration industry begins to downsize, as some expect, vacating
resources in infrastructure, businesses, and the workforce.
Synergy with Land-Based Wind Industry
Like the Great Lakes region, Texas has a synergy with a strong land-based wind industry. Texas
leads the nation in installed production for land-based wind. It is the first state to have surpassed
the 10,000 MW mark, with 10,085 MW of installed capacity at the end of 2010.74 It gets
roughly 8% of its power supply from wind.75 Texas is home to a large number of wind-related
manufacturing facilities that service these wind farms and could potentially produce parts for the
off-wind industry.
Utility Structure
Texas has also developed an innovative transmission system for onshore wind. 76 It has one utility
(ERCOT) that services the majority (75%) of the state, and it currently incorporates a substantial
amount of land-based wind into its grid. ERCOT invested substantially in its ability to absorb wind
energy from the wind-rich regions of west Texas and the inland coastal regions and transmit this
power to the grid. The cost of this investment was spread out across the consumer base.
Additionally, while wind farms have to pay for the cost of their connection to the utility grid, they
do not have to the pay the cost for any upgrade in the transmission system to accommodate the
energy load. This covers costs in one important area for wind farm developers.
State Water Jurisdiction
Texas has jurisdiction over waters extending nine nautical miles off its coast, compared to other
states that have jurisdiction only within three miles from the coast (such as the Eastern seaboard.)77
This gives them an advantage in developing projects at a greater depth that are not subject to
74 American Wind Energy Association. (2011). AWEA U.S. Wind Industry Annual Market Report, p.2. 75 http://www.nytimes.com/2011/02/11/us/11ttwind.html 76 American Wind Energy Association. (2011). AWEA U.S. Wind Industry Annual Market Report, p.10. 77 Asmus, Peter. (2011, June 1). Which State Will Lead With First Installed Offshore Wind Project in the U.S.? Pike Research Blog Articles: Retrieved from http://www.pikeresearch.com/blog/articles/which-state-will-lead-with-first-installed-offshore-wind-project-in-the-u-s.
INTERNATIONAL ECONOMIC DEVELOPMENT COUNCIL 37
the federal permitting process. The two projects currently furthest along in development by
Baronyx and by Coastal Point Energy are both in state waters. However, there are concerns from
the Corpus Christi Naval Air Station that the turbines could interfere with radar systems, and
environmental groups are asking for an environmental assessment to determine, among other
factors, how the wind farms might affect populations of migratory birds, fish, and the rare breed
of ridley sea turtles.78
Disadvantages
This region also presents several hurdles. Wind turbines located off the coast of Texas are
situated in a region of the Gulf of Mexico that is highly susceptible to hurricanes. This necessitates
the weatherization of turbines and platforms to mitigate damaging effects and, more generally,
places them at risk for damage in the event of inclement weather. Additionally, there is
competition from clean energy sources from land-based wind as well as solar energy, and natural
gas is plentiful in the region.
MMaajjoorr SSttaakkeehhoollddeerrss aanndd PPaarrttnneerrsshhiippss
Market development of offshore wind will require greater cooperation among regional players
and private, public, and nonprofit stakeholders. Partnerships are especially crucial from a
regulatory standpoint. In the case of Cape May, for example, 17 regulatory agencies were
involved. Partnerships may also be crucial for purposes of creating scale in order to produce a
better energy product and at a better cost. The major players in the offshore industry include
multiple federal agencies, state governments, developers, utilities, industry trade and research
organizations, universities, and other stakeholders. Table 9 below summarizes major players.
78 Mahoney, Melissa. (2011, August 8). “Offshore wind Texas-style: fast and big. smartplanet. Retrieved from: http://www.smartplanet.com/blog/intelligent-energy/offshore-wind-texas-style-fast-and-big/8080
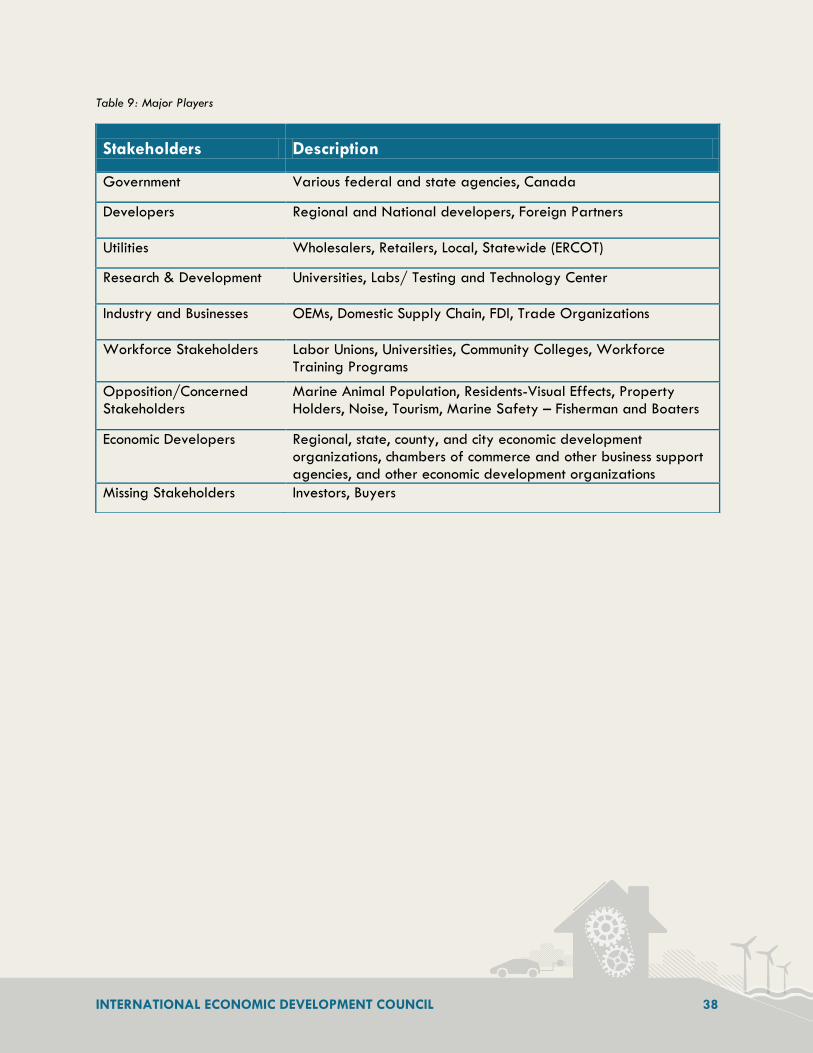
INTERNATIONAL ECONOMIC DEVELOPMENT COUNCIL 38
Table 9: Major Players
Stakeholders Description
Government Various federal and state agencies, Canada
Developers Regional and National developers, Foreign Partners
Utilities Wholesalers, Retailers, Local, Statewide (ERCOT)
Research & Development Universities, Labs/ Testing and Technology Center
Industry and Businesses OEMs, Domestic Supply Chain, FDI, Trade Organizations
Workforce Stakeholders Labor Unions, Universities, Community Colleges, Workforce Training Programs
Opposition/Concerned Stakeholders
Marine Animal Population, Residents-Visual Effects, Property Holders, Noise, Tourism, Marine Safety – Fisherman and Boaters
Economic Developers Regional, state, county, and city economic development organizations, chambers of commerce and other business support agencies, and other economic development organizations
Missing Stakeholders Investors, Buyers

INTERNATIONAL ECONOMIC DEVELOPMENT COUNCIL 39
LLooccaall//SSttaattee GGoovveerrnnmmeenntt
Federal Government
The Energy Policy Act of 2005 designated the Department of Interior (DOI) as the lead permitting
agency for offshore wind development in federal waters, which generally begin three nautical
miles from shore and extend outward to 200 nautical miles. States have jurisdiction over
permitting if it takes place within state waters. While state waters usually extend three miles from
the shoreline, Texas has jurisdiction over waters nine nautical miles from its coast. Within the DOI,
the Bureau of Ocean Energy Management, Regulation and Enforcement (BOEMRE), formerly
known as the Minerals Management Service (MMS), is the federal agency responsible for
overseeing the safe and environmentally responsible development of energy and mineral
resources on the Outer Continental Shelf.
Various federal statute and agencies play a role in offshore development, and they have the
mandate and authority to review and/or approve aspects of offshore wind projects. These
agencies include the:
Department of Interior Bureau of Ocean Management, Regulation and Enforcement
(BOEMRE),
Environmental Protection Agency (EPA),
Fish and Wildlife Service (FWS),
National Park Service (NPS),
National Oceanic and Atmospheric Administration (NOAA),
National Marine Fisheries Service (NMFS),
Federal Aviation Administration (FAA),
Department of Defense (DOD), U.S. Coast Guard (USCG),
Army Corps of Engineers, and
Federal Energy Regulatory Commission (FERC). 79
79 Ibid.

INTERNATIONAL ECONOMIC DEVELOPMENT COUNCIL 40
The application and review process for offshore wind is more extensive than for land-based wind
projects, which are often on private land instead of in federal waters. The process for onshore
wind projects has also developed through ten years of learning and improving. Yet, the process
for offshore wind is also improving. For example, the review of the application for the Cape
Wind development included the active participation of 17 federal and state agencies.80 As a
result, in 2010, the DOI and DOE entered into a Memorandum of Understanding (MOU) to
collaborate and bring together the resources and expertise of both agencies to develop
commercial-scale offshore wind and water energy projects on the U.S. Outer Continental Shelf.
Regional Governmental Partnerships
The Bureau of Ocean Energy Management is working closely with coastal states to establish task
forces on offshore energy development.81 These states include Washington, Oregon, California,
Hawaii, New Jersey, Delaware, Maine, New York, Rhode Island, Florida, Maryland, North
Carolina, South Carolina, Georgia, Massachusetts, and Virginia.
In June 2001, U.S. Secretary of the Department of the Interior Secretary Ken Salazar signed a
MOU with the governors of 10 East Coast states to establish an Atlantic Offshore Wind Energy
Consortium to promote the efficient, orderly, and responsible development of wind resources on
the Outer Continental Shelf.82 However, no progress was made on the MOU, and the initiative is
no longer functional.
DOE has indicated the need to undertake collaborative studies with utilities to model offshore
wind energy and potential for integration. Enhanced grid interconnection is needed to make the
costs of the offshore wind industry viable.83 Many of the electric grid projects currently being
proposed cross state boundaries, and cooperation among the states is mandatory in these cases.
80 Gordon, James S. (2011, June 1). Statement as prepared for delivery of James S. Gordon, President, Cape Wind Association, LLC before the U.S. House Committee on Natural Resources. 81 Bureau of Ocean Energy Management. State Activities. Retrieved from http://www.boem.gov/Renewable-Energy-Program/State-Activities/Index.aspx 82 U.S. Department of the Interior. (2010, June 8). Salazar Signs Agreement with 10 East Coast Governors to Establish Atlantic Offshore Wind Energy Consortium, Announces New Atlantic Offshore Renewable Energy Office. Retrieved from Department of Interior website: http://www.doi.gov/news/pressreleases/Salazar-Signs-Agreement-with-10-East-
Coast-Governors-to-Establish-Atlantic-Offshore-Wind-Energy-Consortium.cfm. 83 Hart, Christopher Dr. (2010, October 5). Creating an Offshore Wind Industry in the United States: A National Vision and Call to Action. U.S. Department of Energy. Presentation at AWEA North American Offshore Wind 2010 Conference & Exhibition, Atlantic City, New Jersey.
INTERNATIONAL ECONOMIC DEVELOPMENT COUNCIL 41
For example, the Atlantic Wind Connection project (which counts Google among its investors) is
designed to join together up to 12 offshore wind projects stretching 350 miles from northern New
Jersey to southern Virginia and creating a “superhighway” of underwater cables. The principle is
that states should not just compete but should collaborate. In fact, the viability of the industry may
be dependent on large projects that stretch across multiple states and achieve economies of scale
to bring down the cost of offshore wind energy.
State and Local Government
In addition to the federal agencies above, states conduct their own regulatory review related to
environment, marine animal, shipwreck, and other policies. State governments also have a role in
ensuring the leasing and development process for each project is open to competitive bidding.
Additionally, states are involved in providing support and incentives for research, business
development, and conducting various impact studies. One of the most aggressive states is New
Jersey, which offers a program of $100 million in prospective tax breaks to domestic businesses
in the offshore wind industry. Massachusetts and New York State Energy Research and
Development Authority also have outstanding program portfolios for offshore wind.
As discussed above, the role of the state is greater if the project is within state waters. When
projects are in federal waters, states still have multiple roles to play, including: providing leases,
rights-of-way, and other land-use approvals required to site and connect grids for projects.
DDeevveellooppeerrss –– AA DDiivveerrssee SSeett ooff PPrroossppeeccttiivvee MMaarrkkeett SSuupppplliieerrss
Developers may be private companies or consortiums of companies. They may be focused on one
local project or developing offshore wind in multiple regions. They may represent environmental,
economic, and/or group interests. Often times, developers form for the purpose of one
development. For example, in Ohio, the Lake Erie Economic Development Corporation (LEEDCo) is
a consortium of local companies that are working together to develop a demonstration project
that they hope will produce the first offshore wind energy in the U.S. LEEDCo has tapped Great
Lakes Ohio Wind (GLOW), a project management firm, to design, finance, and build the project
off the coast of Cleveland.84
84 Ibid.
INTERNATIONAL ECONOMIC DEVELOPMENT COUNCIL 42
NRG Bluewater Wind, LLC has positioned itself as a developer for offshore wind in multiple states
and is developing offshore wind energy projects in Delaware, Maryland, New Jersey, and New
York. However, the NRG Bluewater Wind project halted development of its Delaware project,
citing the inability to find an investment partner.85, 86
In New Jersey, Fishermen’s Energy, LLC is developing two projects off the coast of Atlantic City.
The developer is a consortium formed by principals of east coast fishing companies. Traditionally,
fishermen have often opposed offshore wind farms, viewing them as a competing use of coastal
waters that might threaten productive fishing grounds and seafood industries. In this case,
fishermen have come together to develop offshore energy using their knowledge of marine
resources in such a way that they can be stewards of sustainable marine resources. They believe
they are removing one of the main forces of opposition and capturing the opportunity that wind
has to offer instead of viewing it as a threat.87
UUttiilliittiieess –– TThhee EEsssseennttiiaall RRoollee ooff MMaarrkkeett BBuuyyeerrss
Utilities are another crucial player whose participation is necessary for the development of the
offshore wind industry. Utilities who agree to buy energy output from wind farms are buying
more expensive energy than they would from natural fossil fuel sources and other alternative
sources like land-based wind sources. There is natural reluctance to buy offshore energy and pass
this cost onto customers. Utilities cannot afford to lose their customer base, especially large
industrial customers. The fear is that high energy costs may be one factor that drives businesses to
move.
In addition to the higher cost, utilities are entering the unknown. There are concerns about the
ability of offshore wind to produce a steady flow of energy due to the volatility of wind, which
would necessitate the use of a fossil fuel source to compensate for times when wind energy output
is low. There are also concerns about connectivity with the existing electrical grid. Utilities are
buying a product that has been untested in the U.S. market based on a technology that is
relatively new. They are concerned about not just the cost but the dependability of the product.
85 About NRG BlueWater. Retrieved from NRG BlueWater website: http://www.bluewaterwind.com/aboutbww.htm 86 Power Engineering. (2011, December 28). NRG Bluewater Wind terminates offshore PPA. Power Engineering. Retrieved from: http://www.power-eng.com/articles/2011/12/nrg_offshore.html. 87 About Fishermen Energy. Retrieved from Firshermen Energy web site: http://www.fishermensenergy.com/about-welcome.html
INTERNATIONAL ECONOMIC DEVELOPMENT COUNCIL 43
RReesseeaarrcchh aanndd DDeevveellooppmmeenntt –– RR&&DD PPaarrttnneerrsshhiippss
Various universities have important research centers that partner with industry and government.
The University of Maine hosts the Advanced Structures and Composite Center (AEWC) and is
building a 37,000 square foot Offshore Wind Laboratory focusing on next generation
technology. The University of Maine is a founding member of the DeepCWind Consortium, which is
committed to advancing deepwater technology.
The Great Lakes, Northeast, Mid-Atlantic, and Gulf Coast all have R&D actively taking place at
universities and research centers. In Michigan, Michigan State University, Grand Valley State
University, and the University of Michigan have all been involved in research and development of
the industry. The University of Rhode Island Partnership for Energy and a Center of Excellence for
Research on Offshore Renewable Energy were founded in 2008. The University of North
Carolina-Chapel Hill received stimulus funds for offshore research, while North Carolina State
University received a DOE grant for a wind power study. The University of Delaware is
undertaking numerous projects with support and partnership from DOE and the state. In the Gulf
Coast region, the University of Houston, Texas Tech University, and Texas State Technical College
have all been active in research and advancement of the industry.
Some research universities, aided by the federal government, are starting to provide education in
offshore wind. The University of Massachusetts Wind Energy Center won a $253,000 grant from
DOE’s 20% Wind by 2030 program to develop a graduate-level course in Offshore Wind
Energy Systems Engineering.88
IInndduussttrryy aanndd IInndduussttrryy PPaarrttnneerrsshhiippss
These include original equipment manufacturers (OEMs) such as General Electric and Clipper
Wind, foreign companies such as Siemens and Gamesa, and businesses along the offshore wind
supply chain. Supply chain businesses include turbine manufacturers, cable suppliers, vessel
operators, marine installation companies, resource assessment and geotechnical and geophysical
firms, environmental and permitting consultants, and law firms. These organizations often work
88 Morton, Laura Smith. (2010, October 7). Collaborations as Industry Drivers: U.S. Department of Energy Initiatives. U.S. Department of Energy. Presentation at AWEA North American Offshore Wind 2010 Conference & Exhibition, Atlantic City, New Jersey.
INTERNATIONAL ECONOMIC DEVELOPMENT COUNCIL 44
closely with local, state, and federal governments to gain support for research and development,
regulatory and permitting assistance, and economic development.
AAddvvooccaaccyy OOrrggaanniizzaattiioonnss
Industry and business are some of the principal partners in advocacy organizations for the
industry. These groups represent domestic businesses in the existing supply chain, including those
that have been working in land-based wind, businesses exploring the next generation of
technology, and foreign businesses looking to invest in the U.S. offshore wind market. Advocacy
organizations include those listed below.
Offshore WindDC
The Offshore Wind Development Coalition (OffshoreWindDC) is the main trade organization
serving businesses in the offshore wind energy industry. OffshoreWindDC advocates for federal
policy initiatives promoting offshore wind farms, including loan guarantees and a production and
investment tax credit. OffshoreWindDC was founded in 2010 by seven offshore wind developers
along with its affiliate the American Wind Energy Association (AWEA). The organization also
represents supply chain businesses, including: turbine manufacturers, cable suppliers, vessel
operators, marine installation companies, resource assessment and geotechnical firms,
environmental and permitting consultants, and law firms. The organization includes international
members such as the Irish offshore wind developer Mainstream Renewable Power, which recently
became a member of the Board of Directors and has expressed an interest in developing a major
wind farm in New Jersey.89
The US Offshore Wind Collaborative
USOWC launched in 2009 with a mission of addressing the technical, environmental, economic
and regulatory issues necessary to catalyze the sustainable development of offshore wind energy
in the U.S. USOWC is an interdisciplinary, non-profit organization representing a diverse group
of offshore wind energy stakeholders. Located in Cambridge, Massachusetts, it provides a forum
for information-sharing, problem-solving, and capacity-building among government, industry,
academia, energy, and environment advocates. It received startup funding from the
89 Jim Lanard, President, OffshoreWindDC, President (personal Communication, August 3, 2011)

INTERNATIONAL ECONOMIC DEVELOPMENT COUNCIL 45
Massachusetts Clean Energy Center (MCEC), along with program funding from the Energy
Foundation.
The DeepCWindConsortium
DeepCWindConsortium is a group committed to advancing deepwater offshore wind technology.
The University of Maine is its founding member, and it is comprised of representatives from the
public and private sector committed to research, commercialization and development of offshore
wind farm technology and installations.
The Great Lakes Wind Collaborative
GLWC is a multi-sector coalition of stakeholders in the wind energy industry working to facilitate
the sustainable development of wind power in the Great Lakes region, including Canada and the
U.S. It was formed in 2007, and there are currently about 450 members from the eight U.S. states
(Minnesota, Wisconsin, Illinois, Indiana, Michigan, Ohio, Pennsylvania, and New York) and two
Canadian provinces (Ontario and Quebec) that border the Great Lakes. The GLWC’s Offshore
Wind Workgroup’s top priorities are to establish a regional voice and to improve federal-state
coordination and communication for Great Lakes offshore wind permitting and policy. Specific
agenda items include completing a Great Lakes Ports Survey, conducting public perception
studies, and developing offshore wind best practices.
Offshore Wind Accelerator Project
OWAP is led by the Clean Energy States Alliance (CESA) with support from private foundations.
CESA is a nonprofit coalition of state and municipal clean energy programs formed in 2002 to
facilitate state and federal partnerships to advance clean energy technologies. OWAP’s primary
function is to serve as an information portal on offshore development priorities by producing
reports, polls, and other resources on top challenges and issues like project siting, power
procurement, and offshore wind supply chains.
WWoorrkkffoorrccee SSttaakkeehhoollddeerrss
These are stakeholders that represent, train, and educate the workforce, including: labor unions,
universities, and community colleges. It is important for developers to engage unions from the
beginning, as a largely unionized workforce may carry out the construction and installation phrase
INTERNATIONAL ECONOMIC DEVELOPMENT COUNCIL 46
(perhaps less so in the South) as well as much of the work during the operations and maintenance
phase. Working with the unions, developers can gain better cost projections for contractors,
including: longshoreman, electricians, elevator operators, piledrivers, and a whole host of trades.
Fostering the relationship at the beginning means smoother negotiations and work progress as the
project gets underway. Additionally, as the developers of Cape Wind found, the unions were
active and crucial partners in lobbying at the state house and at the U.S. Congress for the project.
For unions, the project was high stakes, with the promise of providing thousands of jobs for a
hard-hit region and sector. The unions may be able to draw on relationships and connections that
the developers may not have in order to help move a project along.
Training is a very important part of workforce readiness. Investors, foreign and domestic, will be
looking to see to what extent the workforce is skilled to install and operate the wind farms. Using
the land-based wind industry as a model, community colleges and universities can be enlisted to
offer specialized training. Additionally, unions have training academies that can offer specialized
skills. Partners should work together to coordinate the curriculum with the needs of the project and
the industry.
OOppppoossiittiioonn aanndd CCoonncceerrnneedd SSttaakkeehhoollddeerrss
Stakeholders who anticipate they may be adversely affected by offshore development also need
to be engaged in the process from an early stage so as not to produce an unexpected and
intractable roadblock further down the line. Representative interests include:
The marine animal population, where concerns over local populations of birds, bats, sea
turtles, and other marine life are required to understand the potential risks and mitigate
possible adverse effects;
Local residents and those along the shoreline where the view may be obstructed by the
turbines;
Local property holders who are concerned their real estate loses value due to view, noise, and
other effects of the wind farm;
Fishermen who are concerned that fishing reserves might be lost;
Recreational boaters and shippers concerned about shipping lanes being disturbed;

INTERNATIONAL ECONOMIC DEVELOPMENT COUNCIL 47
Historical preservationists who are concerned about undiscovered or unpreserved shipwrecks,
and;
Native Americans whose view for ceremonial prayer might be obstructed.
EEccoonnoommiicc DDeevveellooppeerrss
Economic developers bring a wealth of experience in helping new industries get off the ground
and can apply tools and expertise to help the offshore wind industry overcome hurdles and
achieve take-off. Economic developers can play a proactive role supporting the development of
the supply chain, workforce and infrastructure. Additionally, they can help inform policymakers on
conditions and incentives in the regulatory and policy environment that will help foster sound and
sustainable growth. Economic developers are actively involved in regional planning, helping to
synchronize local industries and supply chains, supporting research and development institutions
and partnerships, and coordinating policy and communication on offshore wind. The Hurdles and
Solutions follow-up report discusses the role of economic developers in detail.
MMiissssiinngg SSttaakkeehhoollddeerrss -- IInnvveessttoorrss aanndd PPuurrcchhaasseerrss
Financial players and purchasers are two of the primary players that are missing in the
marketplace and are thus inhibiting the development of offshore wind projects. Financial players
include investors and lenders, and purchasers of energy include utilities that will enter into PPAs
with projects. Some projects such as Cape Wind are ready to start construction but have not sold
adequate energy to guarantee a funding stream that enables the project to be financially viable.
Cape Wind has sold only two-thirds of its 468 MW wind capacity. Since the marginal cost of
wind is zero, it is absolutely crucial that it sell a large portion of its MW to achieve profitability.
Investors/Funding
The persistent lack of available financing for clean energy projects has been taken up by
Congress, but action is stalled due to budget deficit reduction measures. The current environment
for investment is wrought with risk and there are minimal government resources in this area.
Creative solutions are needed to finance this high risk industry, which has the potential for high
rewards in the long term.
Recognizing the dearth of green investment, the Energy Committee passed a measure to create a
Clean Energy Deployment Administration (CEDA) in 2009 on a bipartisan basis, but the
INTERNATIONAL ECONOMIC DEVELOPMENT COUNCIL 48
Committee has now indicated that the cost of the program would need to be offset by spending
reductions elsewhere in the federal budget .90 The idea was that CEDA would reuse its funding
over time to back private lending for clean energy projects, instead of only offering one-time
payments in the form of grants or tax credits as previous programs have done.
Purchasers
It is a difficult sell to entice utilities to buy offshore wind energy that is priced higher than other
clean energy sources and perhaps two to three times as high as some fossil fuels. Renewable
performance standards are now existent in over 30 states, but they do not specify that a certain
amount must be set aside or carved out for offshore wind (with the exception of New Jersey,
although the offshore wind is not on-line yet so the requirement is not yet active).91 The continual
question is how costs can be brought down so that utilities can justify to their customers the pass-
through of the premium for the offshore wind source. A mixture of capital cost reduction and
technology enhancement, policy mandate, government procurement, and good will on the part of
the utilities will be needed.
PPoolliiccyy TToooollss
Stakeholders in the offshore wind industry point to important financial tools that have spurred
growth of other clean energy industries like land-based wind. The two most often cited policies
are the Internal Revenue Service’s investment tax credit and the Department of Energy’s loan
guarantee program.
One important note, however, is that neither of these programs has actually benefitted offshore
wind because they apply to products that are in service or will be within a very short timeline.
Given the current conservative fiscal climate and the likely expiration of some stimulus programs,
it is now almost certain these programs will not benefit offshore wind unless they are renewed.
90United States Senate Committee on Energy and Natural Resources. Murkowski: Clean Energy Deployment Administration Needs Offsets. Retrieved from: http://energy.senate.gov/public/index.cfm?FuseAction=PressReleases.Detail&PressRelease_Id=77e3a383-e3b8-48c8-972b-22ecd32cfa8f 91 Inwood, S. (2011, June). Program on Technology Innovation: Integrated Generation Technology Options, pp. I-11, Retrieved from Electric Power Research Institute website: http://rfflibrary.wordpress.com/2011/07/30/program-on-technology-innovation-integrated-generation-technology-options/.
INTERNATIONAL ECONOMIC DEVELOPMENT COUNCIL 49
Stakeholders believe these kinds of programs and incentives in some form are necessary at the
federal level to help incentivize investors and developers as well as reduce risk. These programs
need to be reliable in order to make the financing models work.
TTaaxx ccrreeddiittss
The principle financing incentive from the federal government for the wind industry has been the
Renewable Electricity Investment Tax Credit (ITC) program offered by the Internal Revenue
Service (IRS). Starting in 2009 with the American Recovery and Reinvestment Act (ARRA), wind
project developers can choose to receive a 30% ITC as an alternative to the production tax
credit. However, the ITC is set to expire at the end of 2013 unless it is renewed. Or, as another
popular incentive, they can take what is essentially cash up front: Treasury grants in lieu of 30%
tax credits, designed to promote the growth of clean energy. The Treasury grants program, also
known as the Sec. 1603 program, is set to expire at the end of 2011. 92 93
The American Wind Energy Association (AWEA) credited Sec. 1603 with enabling construction of
10,000 megawatts of new land-based wind capacity in 2009, which was 6,000 more MW than
would have been installed without the program.94
LLooaann gguuaarraanntteeeess
The Department of Energy’s loan guarantee program was created by the Energy Act of 2005
with the goal of helping companies commercialize new technology. The loan guarantee program
guarantees the debt of privately owned clean energy developers and manufacturing companies,
thereby ensuring that, if they cannot pay the balance on a loan, the government will. This is crucial
for companies in early stages of technology commercialization where the product is not proven
and financing would be unlikely or at a prohibitively high rate without a government guarantee.
The ARRA stimulus bill appropriated $6 billion for loan guarantees for projects in clean energy
including wind energy. Several projects, including Cape Wind, are under consideration for a loan
92 Production Tax Credit for Renewable Energy. Retrieved from Concerned Scientists website: http://www.ucsusa.org/clean_energy/solutions/big_picture_solutions/production-tax-credit-for.html 93 American Wind Energy Association. Federal Policy. Retrieved from: http://www.awea.org/issues/federal_policy/index.cfm Accessed 7/28/11. On July 28, 2011. 94 Tax Credit For Offshore Wind Facing Another Uphill Battle. (2011, March 31). Offshorewindwire. Retrieved from http://offshorewindwire.com/2011/03/31/tax-credits-facing-uphill-battle/

INTERNATIONAL ECONOMIC DEVELOPMENT COUNCIL 50
guarantee program.95 While the loan guarantee program has been an important source of
support for clean energy industries like land-based wind, it has yet to provide one conditional
commitment or close one loan for an offshore project as of April 2013.96
NNaattiioonnaall CClleeaann EEnneerrggyy PPoolliiccyy//TTaarrggeett
Clean energy targets are a major policy tool employed worldwide and increasingly in the U.S. to
help foster the development of clean energy. The targets may or may not be binding. As of
2010, more than 85 countries had some form of an energy target.
The federal government has an ambitious goal. The Department of Energy’s 20% Wind Energy
by 2030 report produced under President George W. Bush provided a scenario in which the U.S.
would generate 20% of its electricity from wind with offshore wind contributing 54GW.97, 98
President Obama called for 80% of the nation’s electricity to be generated by clean energy
sources, including offshore wind.99 President Obama’s Goals for Offshore Renewable Energy
include achieving 10 GW of wind capacity in the OCS and Great Lakes by 2020.100
RReenneewwaabbllee EEnneerrggyy SSttaannddaarrddss
A renewable electricity standard (RES), also known as a renewable portfolio standard (RPS), is a
policy that sets hard targets for clean energy. Today, 28 states and the District of Columbia have
renewable electricity standards and seven states have renewable energy goals.
95 Szaniszlo, M. (2013, April 5). Mass. delegation pushes for Energy Dept. loan for Cape Wind. Boston Herald. Retrieved from http://bostonherald.com/business/technology/technology_news/2013/04/mass_delegation_pushes_for_energy_dept_loan_for_cape 96 Edward Righter, DOE, Loan Guarantee Program (personal communication, August 9, 2011) 97 U.S. Department of Energy, National Renewable Energy Laboratory. (2008, July) 20% Wind Energy by 2030: Increasing Wind Energy’s Contribution to U.S. Electricity Supply. (NREL/TP-500-41869). Retreived from: http://www.nrel.gov/docs/fy08osti/41869.pdf. 98 U.S. Department of Energy. (2011, February). A National Offshore Wind Strategy: Creating an Offshore Wind Energy Industry in the United States, Retrieved from http://www1.eere.energy.gov/windandhydro/pdfs/national_offshore_wind_strategy.pdf. 99 White House Office of the Press Secretary. (2011, January 25). Remarks by the President in 2011 State of the Union Address. Retrieved from White House website: www.whitehouse.gov/the-press-office/2011/01/25/remarks-president-state-union-address/ 100 Department of Interior, The Bureau of Ocean Energy Management, Regulation and Enforcement. “The Bureau of Ocean Energy Management, Regulation and Enforcement, Fact Sheet: Renewable Energy on the Outer Continental Shelf” Retrieved from: http://www.boemre.gov/offshore/RenewableEnergy/PDFs/BOEMREAlternativeEnergyfactsheet.pdf
INTERNATIONAL ECONOMIC DEVELOPMENT COUNCIL 51
With an RES in place, the utility buys some of its energy from the clean energy source. This cost is
then passed onto consumers, which effectively constitutes a tax on the consumers in that state or
region that receive service from the utility. The effective tax on utility customers is argued as a
reasonable policy tool, because clean energy is a public good and because the tax is necessary
to help jump start the industry. The tax presumably decreases as the industry technology becomes
more developed and economies of scale are achieved.
There is a threat that consumers may contest this in court, if not via the democratic process through
protests and votes, which could result in the mandate being overturned.101 In Rhode Island, the
State Supreme Court just upheld the Constitutionality of the PPA between Deepwater and
National Grid in the face of opposition. In Europe, nations often set electricity rates, so they do
not have the problem of consumer opposition since consumers are charged uniformly throughout
the country. As a result, there is some demand among economic and environmental interests for a
national renewable energy standard.
RR&&DD IInnvveessttmmeenntt
PPuubblliicc IInnvveessttmmeenntt –– AAnn UUnncceerrttaaiinn FFuuttuurree
In December 2012, DOE announced R&D awards of $168 million total for offshore wind
demonstration.102 The awards fund seven projects in Maine, New Jersey, Ohio, Oregon, Texas,
and Virginia. This round of funding represents the first phase of a six-year initiative that seeks to
expedite commercial offshore development in state and federal waters by 2017. Award
recipients include Baryonyx Corporation (Austin, Texas), Fishermen’s Atlantic City Windfarm (New
Jersey), Lake Erie Development Corporation (Cleveland, Ohio), Principle Power (Seattle,
Washington), Statoil North America (Stamford, Connecticut), the University of Maine, and
Dominion Virginia Power (Richmond, Virginia).
101 George Sterzinger, Executive Director, Renewable Energy Policy Project, (personal communication, July 25, 2011) 102 U.S. Department of Energy. (2012,December 12). DOE Wind Program Selects Seven Projects to Demonstrate Next-Generation Offshore Wind Technologies. Retrieved from http://www1.eere.energy.gov/wind/news_detail.html?news_id=18842
INTERNATIONAL ECONOMIC DEVELOPMENT COUNCIL 52
The DOE allocated $90 million to offshore wind research and test facilities through ARRA and FY
2009 and FY 2010 appropriated funds.103 The following represent main areas where the
research and development money was allocated.
Wind technology testing centers
Next generation technology
Reducing market barriers
The majority of the dollars allocated were for major investments in technology development,
including wind technology testing centers at Clemson University, the Massachusetts Clean Energy
Center, and the University of Maine, as well as investment in next generation technology at the
University of Maine. There were also several studies and plans funded for specific projects and
regions to reduce market barriers. See Appendix I for more detail on these DOE funded
programs.
The DOE also unveiled awards of $43 million in funding to 41 new offshore wind power projects.
The awards announced on September 11, 2011 ranged from approximately $200,000 to $4
million. The grants were for technology development and for removing market barriers. The
highest awards of about $4 million each were for innovative offshore wind turbine development
and went to Alstom Power in Richmond, Virginia, Sandia National Laboratories in Albuquerque,
New Mexico, Siemens Energy, Inc. in Orlando, Florida and Zimitar, Inc. in San Francisco,
California.104 Given the current drive toward deficit reduction, it is uncertain at what level the
federal government will make such investments in offshore wind technology moving ahead.
PPrriivvaattee IInnvveessttmmeenntt –– TTeessttiinngg tthhee WWaatteerrss
In terms of clean energy, wind is the most popular renewable source for investors. Fifty percent, or
about $17 billion, in U.S. investment in clean energy in 2010 was directed to the wind sector.
However, offshore and onshore wind are conflated in this figure, so the amount of offshore
investment is unknown. It is safe to say that onshore wind captures the lion’s share of the
103 U.S. Department of Energy. (2011, February). A National Offshore Wind Strategy: Creating an Offshore Wind
Energy Industry in the United States, p. iii, Retrieved from http://www1.eere.energy.gov/windandhydro/pdfs/national_offshore_wind_strategy.pdf. 104 U.S. Department of Energy. Secretary Chu Unveils 41 New Offshore Wind Power R&D Projects. Retrieved from: http://energy.gov/articles/secretary-chu-unveils-41-new-offshore-wind-power-rd-projects

INTERNATIONAL ECONOMIC DEVELOPMENT COUNCIL 53
investment, while offshore wind captures a small amount that is subject to the risk assessments of
investors, the overall drag in the economy, and other factors.
Globally, investment in wind energy leads all other forms of clean energy, followed by solar
energy, which did have a faster growth rate in 2010. Wind level investments increased globally
by 34 percent in 2010, while solar investments increased 59%.105 Analysts say offshore wind
comprises a growing segment of the wind sector though precise levels of investment are not
available, largely because much investment is early-stage venture capital where the dollar
amount is not disclosed.106
Investment in the U.S. offshore wind sector is coming from the following sources.
In-house R&D—Existing U.S. land-based turbine manufacturing companies are investing in-house
in the development of products for the offshore market.
Foreign Investment—Foreign companies are investing independently or in partnership with U.S.
companies.
Venture capital (VC)—Investors are providing significant cash outlays for early stage
development energy companies and securing an equity stake in those companies.
In-House R&D – Major OEMs Developing for Foreign Market
There are some visible fruits of research and development taking place at existing companies
with substantial market share in the land-based wind turbine market.107 General Electric has
developed a 4.0 model in Europe, and Clipper is developing an even larger 10.0 turbine.108
Venture Capital – Critical for Industry Takeoff
There is a tradition of strong U.S. venture capital investments in clean energy relative to other
countries, and it is hoped VC will fuel the offshore wind industry as well. When it comes to clean
105 Ibid. 106 The Pew Charitable Trusts. (2010 Edition). Who’s Winning the Clean Energy Race? G-20 Investment Powering Forward. P. 46. Retrieved from http://www.pewtrusts.org/our_work_report_detail.aspx?id=57969 on July 15, 2011. 107 George Sterzinger, (personal communication, July 25, 2011) 108 Lucas, Martin and Stergoulis,Evan. (2011, October). A legal perspective on making offshore wind bankable – some experiences from the European Offshore Wind Market. Presented Presentation at the AWEA Offshore Windpower Conference and Exhibition, Baltimore, Maryland.
INTERNATIONAL ECONOMIC DEVELOPMENT COUNCIL 54
energy, the U.S. venture capital market is a crucial source of finance. The U.S. accounted for 73%
of total venture capital investment in clean energy among all G-20 countries in 2010.109
However, the long delay and relatively barren output thus far from investment in the offshore
wind industry, the sluggish economy and the uncertainty of the regulatory environment, as well as
the presence of incentives are all limiting factors on VC outlays for the offshore wind industry.
Additionally, Pew reports that investors are hesitant to commit money because the United States’
commitments to clean energy have a “lack of clarity” and there is an “uncertainty surrounding
continuation of key financial incentives.”110
There is also a strong tradition in the U.S. of political support for fossil fuel industries due to
powerful lobbies in coal, natural gas, and other energy industries. Because these resources are
concentrated in different parts of the U.S., energy policy has often developed according to
regional energy interests, thereby hindering development of a national energy policy and
introducing the possibility of multiple veto points into the process for any particular clean energy
initiative. Confronting this hurdle, among others, is the goal of the next section of this report.
109 The Pew Charitable Trusts. (2010 Edition). Who’s Winning the Clean Energy Race? G-20 Investment Powering Forward, p. 46. Retrieved from http://www.pewtrusts.org/our_work_report_detail.aspx?id=57969 on July 15, 2011. 110 Ibid.

INTERNATIONAL ECONOMIC DEVELOPMENT COUNCIL 55
HHUURRDDLLEESS AANNDD SSOOLLUUTTIIOONNSS:: OOFFFFSSHHOORREE WWIINNDD EENNEERRGGYY
MMAARRKKEETT
The U.S. offshore wind industry has encountered numerous hurdles in the past decade. While
many projects are in the pipeline, none have been built. Projects have faced various hurdles,
including high capital costs, difficulty finding buyers in the marketplace and a complicated and
drawn-out permitting and regulatory framework. Given that the U.S. is one of the world’s leaders
in land-based wind, the delay in getting even one offshore wind farm on-line is confounding to
many.
Economic developers bring a wealth of experience in helping new industries get off the ground
and can apply tools and expertise to help the offshore wind industry overcome hurdles and
achieve take-off. Economic developers can play a proactive role supporting the development of
the supply chain, workforce and infrastructure. Additionally, they can help inform policymakers on
conditions and incentives in the regulatory and policy environment that will help foster sound and
sustainable growth.
The goal of this chapter is to identify and discuss the main hurdles facing the offshore wind
industry. Additionally, the chapter identifies potential economic development strategies to help
overcome these hurdles as well as providing examples of initiatives that have been implemented.
Hurdles can be summarized into the following categories:
Supply-side Hurdles - Supply-side hurdles relate to high capital, operating and financing costs
that make it difficult to get wind farms up and operational.
Demand-side Hurdles – Demand-side hurdles relate to securing purchasers for the offshore wind
energy, which is often priced higher than fossil fuels and other renewable energy sources.
Regulations and policy hurdles –The complex and long regulatory and permitting process has
delayed projects for years. The industry also faces an uncertain environment for new and existing
policies that help promote the industry.
Political hurdles - Many believe the U.S. is hindered compared to other countries because it lacks
a unified national energy policy that includes binding commitments for renewable energy. At the

INTERNATIONAL ECONOMIC DEVELOPMENT COUNCIL 56
local or project level, there are challenges from opposition stakeholders representing property,
economic, energy and other interests.
SSuuppppllyy SSiiddee IIssssuueess –– HHooww ttoo OOvveerrccoommee HHiigghh CCoossttss
Offshore wind technology is more expensive than fossil fuel sources and some renewable energy
sources. Capital costs and operating costs are high. This can be a disincentive to investors worried
Offshore Wind Energy: Hurdles to Development
Supply-side Demand-side Regulatory and
policy Political
Invest in turbine R&D (such as incubator)
Assist in regional grid planning
Identify synergies with existing industries (i.e. oil and marine-based)
Create stimulus for ship-building
Support financing streams for investors
Identify/retool existing businesses in supply chain
Provide workforce training with local partners
Attract FDI and forge foreign partnerships
Support “carve-outs” for offshore wind
Structure incentives in RPS
Provide production incentives (i.e. ITC)
Establish government procurement program
Streamline the approval process
Improve coordinated review
Support tax credit programs
Align communication strategies
Use proactive growth strategies in a recession
Engage and respond to opposition stakeholders
Public education to garner understanding and support for offshore wind

INTERNATIONAL ECONOMIC DEVELOPMENT COUNCIL 57
about the viability of supporting the industry. Financing costs can add significantly to the project’s
budget and play a “make or break” role.
Offshore wind farms incur high costs due to the lack of experience in the industry as well as high
costs associated with building and operating installations that meet the demands of the marine
environment. A fully installed offshore wind farm comes at a cost of about $4,600/kW, which
comes close to being twice the cost of a land-based wind farm, which costs about $2,400/kW.111
Ultimately, proponents believe the long-term efficiency gains from offshore wind are undeniable
and will more than compensate for short-term investments. Offshore wind velocity is stronger and
steadier than onshore wind, enabling offshore turbines to operate at a higher capacity. Offshore
wind also corresponds more with peak hour electricity usage for coastal cities. Thus, the strongest
winds deliver energy supply at periods of high demand, which leads to more competitive pricing
for offshore wind energy.112 Once captured, the cost of the wind energy is free – that is to say, it
is inexhaustible and there are no marginal costs per additional unity of energy. In the short term,
however, costs may actually increase until the industry develops the next generation of higher-
capacity, more efficient wind farms.
The major components of cost for an offshore wind farm include:
Capital costs (turbine, electrical infrastructure, support structure, logistics and installation)
Operating and maintenance costs (O&M costs)
Financing costs
Project development and permitting costs
Capital costs and O&M costs are projected to increase in the short term due to aggressive
development, learning costs associated with a new industry and other factors. In order to achieve
long-term efficiency gains and reduce costs, technology, scale and skill all need to be further
111 Wood, Elisa. (2010, March 22). Offshore Awakening: US Investment Flows to Offshore Wind. RenewableEnergyWorld.com. Retrieved from
http://www.renewableenergyworld.com/rea/news/article/2010/03/offshore-awakening 112 U.S. Department of Energy & U.S. Department of the Interior, Beaudry-Losique, Jacques et al. (2011, February). A National Offshore Wind Strategy: Creating an Offshore Wind Energy Industry in the United States, p. 7. Retrieved from: http://www1.eere.energy.gov/windandhydro/pdfs/national_offshore_wind_strategy.pdf
INTERNATIONAL ECONOMIC DEVELOPMENT COUNCIL 58
developed and enhanced. This will require strategies and initiatives including research and
development, supply chain development, workforce development and regional planning.
The offshore industry is in a “steep development phase”; capital costs for offshore wind farms
have been on the rise as wind farms generate higher capacities of energy and operate in waters
that are deeper and further from shore. According to one study from the United Kingdom,
offshore wind farm capital costs more than doubled from 2005 to 2010.113 For the currently
proposed projects off the U.S. Atlantic coast and in the Great Lakes, the cost of offshore wind is
more than the originally projected range of 13 to 16 cents and closer to 20 to 30 cents.
Additionally, in some places, onshore wind is being sold much cheaper than 7 to 14 cents, with
some estimates for between 4 and 6 cents in states like Texas.114
Major capital costs components are:
Electrical Infrastructure/Transmission Systems
Turbines
Support Structure (Foundations)
Electrical infrastructure and turbines both comprise about 40 percent of project costs. This differs
from the cost structure for the land-based wind industry, where turbines are by far the highest
capital cost component and transmission costs are relatively lower.
113 Willow, Christopher & Valpy, Bruce. (2011 June). Offshore Wind: Forecasts of future costs and benefits, p. 8. Retrieved from RenewableUK website: http://www.bwea.com/pdf/publications/Offshore_report.pdf 114 15. Kim K Zuhlke, Little Blue Ridge LLC, (personal communication, August 22, 2011)
Hurdle Capital costs for offshore wind farms are higher than for onshore wind farms.
INTERNATIONAL ECONOMIC DEVELOPMENT COUNCIL 59
EEDD SSttrraatteeggiieess
Invest in R&D and regional planning
Process and product innovations in offshore turbines can result in significant cost savings. In
addition, regional planning can help adapt products for a larger scale, resulting in a savings in
per unit capital costs.
Offshore wind projects face high capital costs associated with infrastructure – specifically the
high-voltage electrical cables on the ocean floor that connect the offshore farm to the electrical
grid. For projects in 2011, the cost of the electrical system was estimated to account for about 40
percent of total capital expenditures for wind farms in the United Kingdom.115 Costs of
transmission are mediated by several forces, including distance from wind farm to the grid, the
conditions of the ocean floor, and upgrades to the transmission system to accommodate increased
loads. Because of heavy transmission costs, it is important to anchor wind farms near substations
on the existing land-based grid. The best candidates are substations that both have the capacity
to support the additional load from the offshore farm and are located a minimal distance away.
Another large cost variable is related to the kind of cable used. So far, the industry standard for
wind farms constructed close to the shore is alternative current (AC) export cables. However, for
proposed wind farms in Europe and the United States that are greater than 80 kilometers from
the grid, high voltage direct current (HVDC) systems are now favored. Currently, there is a
shortage of HVDC cable. This is one of the two major bottlenecks to the development of the
offshore industry, in addition to the shortage of vessels.116
115 Willow, Christopher & Valpy, Bruce. (2011 June). Offshore Wind: Forecasts of future costs and benefits, p. 5. Retrieved from RenewableUK website: http://www.bwea.com/pdf/publications/Offshore_report.pdf 116 European Wind Energy Association (2011). Wind in our Sails. Retrieved from European Wind Energy Association website: http://www.ewea.org/fileadmin/ewea_documents/documents/publications/reports/23420_Offshore_report_web.pdf
Hurdle Electrical Infrastructure and Transmission Systems – Super Grids

INTERNATIONAL ECONOMIC DEVELOPMENT COUNCIL 60
One of the main problems associated with offshore wind is its variability – the energy generates
depends on the time of day and season of year. Ultimately, grids will need to service multiple
wind farms in order to achieve economies of scale as well as an efficient energy delivery system
that can mitigate wind’s natural volatility.
EEDD SSttrraatteeggiieess
Regional grid planning
A regional grid draws energy from a source of wind at any given time and location on the grid
and circulates it to provide a more stable energy supply. Economic developers should promote
regional strategies to reduce grid costs.
Example Initiative - Europe’s Super Grid - Europe is developing a supergrid, or a series of
undersea grid connections that will allow energy to be produced on a regional rather than
national scale. The grid would connect cables off the Atlantic coast of UK, France, Denmark,
Netherlands, Germany, Ireland, Belgium, Norway, Sweden and possibly Spain and Portugal.
More than 100GW of offshore wind projects are at some stage of development in Europe, and
they are candidates for integration into the grid. In December 2010, ministers signed the
Northsea countries Offshore Grid Initiative Memorandum of Understanding, which is the latest
step in the program. The project also hopes to capture synergies with other sources of marine
energy – including harnessing wave energy into the grid. 11
Example Initiative – Atlantic Grid Holdings - Atlantic Grid LLC has proposed a direct current
subsea transmission system, which would transport power from winds 12-15 miles off the U.S.
eastern seaboard to cities in New York, New Jersey, Delaware, Maryland and Virginia. The
transmission lines would accommodate 7,000 MW of wind energy. The project is being reviewed
by DOI as of mid-2012.1
Example Initiative - Atlantic Wind Connection Project – The Trans-Elect Development Company
has announced a $5 billion project for a transmission line up and down the Atlantic coast. The
underwater cable infrastructure will serve as a “backbone” that is expected to have a final
capacity of as much as 7,000 MW. It will connect Virginia to northern New Jersey and
potentially New York City. The first of five phases is expected to be constructed by 2016,
connecting Northern New Jersey with southern Delaware with a 2,000 MW capacity. 111
INTERNATIONAL ECONOMIC DEVELOPMENT COUNCIL 61
Capital costs are rising with the development of larger, higher-capacity turbines built to capture
more energy and operate further from the shoreline. Along with the grid system, turbines are the
highest capital cost, accounting for about 40 percent of total costs. This is projected to rise from
40 percent to 44 percent by 2022.117 Turbine size has grown from an average of 0.5 MW in the
1990’s to an average of 3 MW from 2000 to 2010. From 2015 to 2030, they are projected to
average in size to be between 5 and 6 MW.118 It is projected that the cost of the turbines will
increase in the medium term but will level out or decrease in the long term.
EEDD SSttrraatteeggiieess
Greater Turbine Efficiency
Economic developers can encourage turbine R&D by U.S. companies as well as initiate plans to
site domestic manufacturing of these turbines and their components.
117 Willow, Christopher & Valpy, Bruce. (2011 June). Offshore Wind: Forecasts of future costs and benefits, p. 5.
Retrieved from RenewableUK website: http://www.bwea.com/pdf/publications/Offshore_report.pdf 118 Reuter, Guido. (2010, October). Realizing local economic benefits from offshore wind projects. Supply Chain America, Siemens Wind Power. Presentation at AWEA North American Offshore Wind 2010 Conference & Exhibition, Atlantic City, New Jersey.
Hurdle Turbines – Working on the “Next Generation”
Example Initiative - General Electric is developing turbines that have higher capacity and
efficiency. The LEEDCo wind farm project north of Cleveland will employ 54 MW turbines. Each
weighs 225 tons and spins three 176-foot blades that are longer and lighter than the average
turbine blade. The turbine operates without many of the moving parts (i.e., gearbox, starter
brushes and coils), reducing maintenance, and also draws no power from the electric grid to
achieve its momentum, increasing efficiency.119

INTERNATIONAL ECONOMIC DEVELOPMENT COUNCIL 62
Research and development can also be done into the production of offshore turbines that
incorporate wave (hydrokinetic), tidal and ocean current energy systems. This will result in still
more energy potentially being captured by a wind farm installation.119
Offshore facilities must bear not only the costs of turbines, but foundations, towers, transmission
and installation related to a complex design system. These must harness wind energy while
bearing up under storms, waves and tides. Foundations cost about 19 percent of total capital
expenditures in 2011, and this is projected to rise in the future, by one measure to 22 percent by
2022.120 Costs rise as foundations must accommodate deeper water conditions. By one measure,
each meter of tower height is an additional $2,000.121
The majority of foundations currently used are cylindrical, steel monopoles, but these structures
are unable to provide resistance to larger loads from stronger waves further offshore. As a result,
there are likely to be increased R&D and capital costs involved in the transition to the next
generation of foundations. Many currently proposed projects in deeper waters will require other
designs such as space-frames, tripile and concrete gravity-based foundations. In the longer term,
for waters in even greater depths (i.e. >90m), floating turbine designs may also be used. This will
incur higher capital expenditures, at least until they are fully transitioned into the market.
119 Cerezon, Luis and Rosinski, Stan (2011, July). Wind Power: Issues and Opportunities for Advancing Technology, Expanding Renewable Generation and Reducing Emissions, p. 9, Electric Power Research Institute. 120 Ibid, p. 5. 121 Wood, Elisa. (2010, March 22). “Offshore Awakening: US Investment Flows to Offshore Wind. “ RenewableEnergyWorld.com. Retrieved from http://www.renewableenergyworld.com/rea/news/article/2010/03/offshore-awakening on July 15, 2011.
Hurdle Support Structure/Foundations – Adapting to Deeper Waters
INTERNATIONAL ECONOMIC DEVELOPMENT COUNCIL 63
EEDD SSttrraatteeggiieess
Synergies with Existing Industries
Just as in the case of turbines, economic developers can help the U.S. be in the forefront of
developing technology for foundations. The oil industry, which employs platforms and foundations
for deep sea drilling operations, may be one source of synergy in R&D.
Ports and terminals must be developed along the U.S. coastline that are able to efficiently and
safely service offshore operations. Currently, few are in a position to do this. Logistics and
installation account for about 23 percent of total capital expenditures in 2011, though unlike
turbines and foundations, this component may actually see effective cost controls in the near
future. By one estimate, it could reduce to 18 percent of total capital costs by 2022.122 However,
given that the U.S. industry is in its infancy and there are no staging ports serving wind farms, it
seems possible this component could be higher for U.S. offshore wind farms.
122 Willow, Christopher & Valpy, Bruce. (2011 June). Offshore Wind: Forecasts of future costs and benefits, p. 5. Retrieved from RenewableUK website: http://www.bwea.com/pdf/publications/Offshore_report.pdf
Hurdle Logistics and Installation – Developing and Adapting Port Infrastructure
Example Initiative – Maine’s Advanced Turbine Development – Currently, various research and
development is occurring at the AEWC Advanced Structure and Composites Center housed at the
University of Maine. The Center is invested in the “next generation” of turbines, which service
depths of up to 60 or 90 meters. The DOE is supporting a multi-year research program focused
on the development and testing of floating offshore wind energy platforms. The University of
Maine was also selected by DOE in 2009 to lead a 35 member university-industry consortium
focused on R&D for deepwater development.122
INTERNATIONAL ECONOMIC DEVELOPMENT COUNCIL 64
Ports and terminals servicing offshore wind farms have some unique requirements. While a
traditional port handles cargo with a focus on containers, an offshore wind port handles cargo
and also large bulky objects, pre-assembly (staging) materials, manufacturing, testing while
additionally serving as a transit point for the crew travelling to and from the wind farm. It might
be considered partly a port, partly a shipyard and partly an operations headquarters.123
EEDD SSttrraatteeggiieess
Synergies with Oil and Marine-Based Industries
Confronting this hurdle means adapting ports that are already good candidates with potential to
serve the offshore industry as well as developing new ports. Some ports in the U.S., especially in
the Gulf of Mexico, are already well-positioned in terms of land area, infrastructure and skilled
personnel as a result of serving as a staging area for the oil and gas industries and its large
tankers. Outside the Gulf region, ports may have to undergo more upgrades to allow them to
accommodate oversized vessels.
It is necessary to identify sites that already meet some base criteria, such as adequate quayside
length. An offshore port must have a sufficient land area equipped with cranes and lifting
appliances to offload components including wind blades and outload them to installation vessels.
It is also optimal that this port be of a sufficient size – and in a central location – to service
multiple wind farm projects.
123 Nerland, Christian. (2011, October). Onshore Infrastructure for Offshore Wind Development. Det Norske Veritas. Presentation at the AWEA Offshore Windpower Conference and Exhibition, Baltimore, Maryland.
Example Initiative – Paulsboro, New Jersey Port - The Paulsboro, New Jersey port has been
identified as possessing the requisite features to accommodate offshore wind: deep water, the
ability to accommodate large barges and shipping vessels, central location in New Jersey as
well as direct access to the entire Atlantic region. With the hope that the port can become a hub
for the state and region, the state’s Offshore Wind Act is providing up to $100 million in tax
credits to companies that set up wind energy facilities at the port. Other waterfront sites such as
Perth Amboy, New Jersey are also positioning themselves to benefit from state incentives.124
INTERNATIONAL ECONOMIC DEVELOPMENT COUNCIL 65
Offshore wind farms incur high costs for operating and maintenance (O&M). This is primarily due
to inexperience in the industry, complicated access to installations and the extra demands of the
marine environment. In addition, legal restrictions in the Jones Act are a wildcard in the cost
equation. The largest shares of O&M expenses are:
Condition Monitoring
General Maintenance
Health and Safety Inspections
Environmental Impact Monitoring
Personnel (i.e. Engineers and Technicians)
Vessel Charter Costs
Building Rentals
Port Berthing Fees
In the short-term, these costs are projected to rise while the industry develops, but they may
decline once expertise is established and economies of scale are realized. Operating costs may
go down as a function of increasing turbine size; it costs less to maintain fewer, larger turbines.124
One O&M cost likely to differ substantially for U.S. developers in comparison to European wind
farms is the cost of vessels for installation and maintenance. Mark Rodgers, spokesman for the
Cape Wind project in Massachusetts, said in September 2011 that “the biggest single challenge
124 Willow, Christopher & Valpy, Bruce. (2011 June). Offshore Wind: Forecasts of future costs and benefits, p. 7. Retrieved from RenewableUK website: http://www.bwea.com/pdf/publications/Offshore_report.pdf
Hurdle Operating and Maintenance Costs - Marine Challenges and the Jones Act Wildcard
Hurdle Financing Costs – “Make or Break”
INTERNATIONAL ECONOMIC DEVELOPMENT COUNCIL 66
for the industry is installation vessels.”125 The shortage of ships has been identified as the main
bottleneck in Europe, and the Jones Act only compounds the problem for the U.S. Offshore wind
farms require “Jones Act Qualified” vessels that are U.S. owned. Currently there are none. As a
result, there will be significant costs in the short term related to finding ships that can service new
offshore farms. There are two principle short-term solutions: 1) leasing oil and gas boats that are
adapted for offshore purposes from the Gulf (as is the plan for Cape Wind), or 2) employing a
combination of U.S. and European vessels (as was the plan for NRG Bluewater Wind in
Delaware). In the second scenario, NRG Bluewater plans to technically abide by Jones Act
regulations by having those U.S. vessels take components out to the European vessels, who will
then install them.
EEDD SSttrraatteeggiieess
Shipbuilding Stimulus
There needs to be a short-term plan to deal with the shortage of vessels either by leasing foreign
vessels and/or adapting oil and gas vessels from the Gulf. There also needs to be a long-term
strategy in place that may involve incentivizing the shipbuilding industry to begin production. The
investment is hefty – the estimated cost of each ship is 200 million Euro/260 US dollars.126
Government can take measures that support the risk related to the investment involved in building
vessels.
Financing can ultimately make or break a project. Financing and discount rates are uncertain,
depending on a variety of factors: the regulatory environment, capital and operational costs in a
new industry and government support for the industry. The cost of capital for a project can vary
between 4 percent and 20 percent based on risk allocation. A project with government ownership
or a government loan guarantee is likely to be at the lower end of the spectrum compared to a
125 Wickless, Andy. Navigant Energy. (11 October, 2011) . “American Opportunities in the Offshore Wind Energy Supply Chain.” Presented at the AWEA Offshore WindPower 2011 conference. Baltimore, Maryland.
126 Fichaux, Nicholas & Wilkes, Justin. (2009). Oceans of Opportunity: Harnessing Europe’s largest domestic resource, p. 55. Retrieved from European Wind Energy Association website: http://www.ewea.org/fileadmin/ewea_documents/documents/publications/reports/Offshore_Report_2009.pdf

INTERNATIONAL ECONOMIC DEVELOPMENT COUNCIL 67
leveraged project, or a project that is all equity.127 The project capital cost can also vary
incredibly based on discount rate.
EEDD SSttrraatteeggiieess
Support various financing streams
Economic developers should support the continuation of reliable tax benefit, loan guarantee and
other programs (especially the ITC) that give investors some protection from risk and help drive
down discount rates.128 Other ways to financially assist the industry in its infancy include
identifying or creating a dedicated funding mechanism. The persistent lack of financing for clean
energy projects has been taken up by Congress, such as through the proposed creation of a
Clean Energy Deployment Administration to back private lending. However, this has been stalled
due to budget deficit reduction measures and looks unlikely to come to fruition.129
Hurdle
Identifying and Retooling Existing Businesses in Supply Chain
EEDD SSttrraatteeggiieess
Supply Chain Identification
Economic developers can support efforts to identify existing businesses in the supply chain that will
manufacture products and provide services to the industry. Existing businesses will come from the
land-based wind industry as well as manufacturing and marine-based industries. Existing
businesses will need to retool or adapt their manufacturing for the offshore industry and in some
127 Levitt, Andrew, Kepmton, Willet & Firestone, Jeremy. (2010, October 7). “Cost of Energy for Offshore Wind in the United States. University of Delaware and NREL. Presentation at AWEA North American Offshore Wind 2010 Conference & Exhibition, Atlantic City, New Jersey. 128 Ibid. 129 United States Senate Committee on Energy and Natural Resources. (2011, May 3). Murkowski: Clean Energy Deployment Administration Needs Offsets. (Press Release). Retrieved from http://energy.senate.gov/public/index.cfm?FuseAction=PressReleases.Detail&PressRelease_Id=77e3a383-e3b8-48c8-972b-22ecd32cfa8f
INTERNATIONAL ECONOMIC DEVELOPMENT COUNCIL 68
cases (i.e. for Midwestern suppliers), figure out distribution channels to service offshore wind
farms. Because many offshore components are oversized and thus have high transport costs, the
trend of “decoupling” which has been observed internationally is expected to continue. While
many of the products developed for offshore wind were from suppliers to the land-based
industry, there is emerging an increasingly specialized, dedicated supply chain for the offshore
wind industry.130
The U.S. has traditionally led the world in innovation in new industries and can do so in the
offshore industry as well. The industry is currently in a steep development phase, and new
specialized firms are just starting up worldwide to meet the different design and operating
requirements for offshore wind farms. The U.S. is not necessarily far behind if it enters at this
stage in the innovation curve.
EEDD SSttrraatteeggiieess
Offshore Wind Incubator
Support innovation for dedicated supply chains for the offshore industry. Given the large existing
market abroad and the potential domestic market, the time is already ripe for increased
innovation in offshore wind.
130 Wickless, Andy. (11 October, 2011) . American Opportunities in the Offshore Wind Energy Supply Chain. Navigant Energy. Presentation at the AWEA Offshore Windpower Conference and Exhibition, Baltimore, Maryland.
Hurdle
New Businesses May Lack Financing and Lack U.S. Market
Example Initiative - Carbon Trust Offshore Wind Accelerator - In the United Kingdom, a team of
international and British wind farm developers, energy companies, state owned utilities and other
partners collaborated in a 40 million pound project with the goal of reducing the cost of offshore
wind by 10 percent. The Carbon Trust Offshore Wind Accelerator would accelerate the
development of new innovations in the industry. The group is funding research into four key areas:
foundations, access, electrical systems and array design.131,132
INTERNATIONAL ECONOMIC DEVELOPMENT COUNCIL 69
Until the domestic market develops, new businesses can find ample opportunities for revenue in
the foreign market. There is a projected need for 30 GW of offshore wind production in Europe
in the next five years. This will require 10,000 turbine structures and all the component parts and
technology by 2020.
Develop Products for Export Market
Some companies have arisen to serve the global markets: American Semiconductor and Principle
Power are developing and commercializing technology for the offshore foreign market.
The U.S. lacks a skilled workforce to operate wind farms in the marine environment. In order to
obtain financing, U.S. projects will need experienced offshore wind crews to work on the wind
farms. There will be a shortage of such workers, and at the onset, Europeans who have the
expertise will likely be employed. However, Europe is even facing a shortage of skilled workers
for the growing offshore wind industry. In particular, project managers, operations and
maintenance technicians and electrical engineers are among the jobs in short supply.131132
EEDD SSttrraatteeggiieess
Workforce Training with Local Educational Partners
The industry will need to develop local education programs, some of which have been already
proposed by developers working with community colleges.
Workforce Training Abroad
131 Fichaux, Nicholas & Wilkes, Justin. (2009). Oceans of Opportunity: Harnessing Europe’s largest domestic resource, p. 62. Retrieved from European Wind Energy Association website:
http://www.ewea.org/fileadmin/ewea_documents/documents/publications/reports/Offshore_Report_2009.pdf 132 European Wind Energy Association. (2009, January). Wind at Work: Wind energy and job creation in the EU. Retrieved from: http://www.ewea.org/fileadmin/ewea_documents/documents/publications/Wind_at_work_FINAL.pdf
Hurdle
Lack of skilled workforce
INTERNATIONAL ECONOMIC DEVELOPMENT COUNCIL 70
U.S. companies should be encouraged to grow in the offshore market abroad. By placing facilities
or personnel there, they not only tap into the market, but they train workers who can later service
U.S. offshore wind farms.
Work With Unions
Developers should work with unions and enlist them as partners in advance of and at the start of
a project. Many trades, including the electricians and seafarers, have an infrastructure of training
academies for their union workers.
In order to get the industry off the ground in a high-cost, high-risk environment, public and private
sources of financing are key. In addition to the government, private angel investors are crucial.
For example, Google just invested a large amount in the Atlantic Coast grid project. Another
important financing source is foreign investment from established companies who may set up
operations alone or in partnership with an American company.
EEDD SSttrraatteeggiieess
Support Government Programs that Mitigate Risk
Lenders need security in order to release the funds to the developers. For this reason, government
policies including loan guarantees are crucial to helping the industry get off the ground.
Hurdle
Difficulty in attracting foreign investment to the U.S. offshore industry
Foreign investment is an important element to growth of the offshore industry, especially in the
short term. Foreign companies have already created hundreds of jobs in the U.S. land-based wind
industry. Many foreign companies are already fully operational in Europe and need only
Hurdle
Lenders are risk averse, restricting the supply of financing
INTERNATIONAL ECONOMIC DEVELOPMENT COUNCIL 71
transplant their offshore technologies and business plan here. In time, the U.S. will also have
home-grown expertise.
While many foreign companies are staying on the sidelines until wind farms are actually
operational, some are starting to eye the U.S. market in advance of its take off. In attempts to
attract foreign investors, a similar set of factors that applied to companies in the land-based
industry applies. Siemens indicated their decision to “localize” or bring a facility to the U.S. was
motivated by factors including:
Significant and predictable incentives schemes
Clear and consistent local content requirements
A developed local supply chain
Clear and fast approval processes
Clarity on responsibility for grid connections
Financing availability
Local community support and local infrastructure.133
EEDD SSttrraatteeggiieess
Attract FDI and Forge US-Foreign partnerships
Economic developers should focus on efforts to attract FDI from the offshore wind industry,
especially foreign companies that might partner with U.S. companies. One example is Gamesa,
who is collaborating with Northrup Grundman on a project in Chesapeake, Virginia.
DDeemmaanndd SSiiddee IIssssuueess –– FFiinnddiinngg oorr ““MMaakkiinngg”” tthhee MMaarrkkeett
Currently, offshore wind energy is higher than the price of fossil fuels as well as some renewable
sources. Competition against land-based wind energy and solar energy can limit the demand for
offshore wind and in turn discourage investment. Thus, offshore wind faces challenges to finding a
purchaser.
133 Reuter, Guido. (2010, October). Realizing local economic benefits from offshore wind projects. Supply Chain America, Siemens Wind Power. Presentation at AWEA North American Offshore Wind 2010 Conference & Exhibition, Atlantic City, New Jersey.

INTERNATIONAL ECONOMIC DEVELOPMENT COUNCIL 72
Price differentials vary from market to market. In New England, there is generally limited onshore
wind, and solar energy is more expensive than in sundrenched markets such as the Southwest.
New England also has the highest fossil fuel energy prices in the country and is one of most dense
and populous markets for electricity. For this reason, it is believed that offshore wind can fare
well there, especially in the long term after prices start to benefit from experience and sale in the
industry.
In some energy-rich places, offshore wind may have a harder time competing because of the
presence of cheaper renewable energy as well as fossil fuel. Markets in the Midwest such as the
Great Lakes region are home to a strong land-based wind supply. Likewise, Texas has both
onshore wind and natural gas sources that are indigenous and plentiful. In these places, offshore
wind will have to compete at an even lower price point in the energy market.
EEDD SSttrraatteeggiieess
Set-aside/Carve-out
Until offshore energy can better compete with other renewable energies, renewable standards
need to have a “carve-out” or set-aside. These are an additional requirement for a portion of the
total renewable energy to come from a specific source such as offshore energy. So far, only New
Jersey has a carve-out for offshore wind in its renewable production standard.
In order to obtain financing, developers need long-term purchase agreements that provide the
guarantee of cash flow for 15 to 25 years. Purchase power agreements (PPAs) are the current
Hurdle
The Renewable Energy SubMarket – Competing Against Land-Based Wind and Solar
Energy
Hurdle
The Challenges of Finding Buyers and Securing Purchase Power Agreements (PPAs)
INTERNATIONAL ECONOMIC DEVELOPMENT COUNCIL 73
mechanism for this guarantee. However, utilities and energy purchasers are assuming a higher
degree of risk when they enter into a PPA for offshore energy. As a result, only a few have been
established
Successful PPAs have required some sort of outside support, either state policy that: 1) helps the
utilities financially bear the burden of the higher cost, and/or 2) spread it out over a larger
population of electric consumers. Successful PPAs also require building partnerships with utilities to
align economic development goals.
EEDD SSttrraatteeggiieess
Incentive-based PPAs
PPAs could be structured to allow utilities to defray or spread higher costs of renewable energy
over a wider service area.
Finally, another strategy is encouraging utilities to adjust their cost comparison to consider other
factors. For example, it may make sense for utilities to hedge against potential increases in the
Example Initiative – Renewable Energy Credit Incentive - In the case of the PPA between
Bluewater Wind Delaware LLC and Delmarva Power & Light Co., a key factor was the utility’s
receipt of a 350 percent credit toward meeting Delaware’s renewable portfolio standard
and a legislative requirement that costs arising from the PPA be distributed evenly through all
of Delmarva’s customer base.
Example Initiative – Cost Sharing - In New Jersey’s renewable certificate program, utilities
and energy purchasers are mandated to buy renewable energy credits, and the costs are
spread throughout the state beyond the area of the utility that is proximate to the wind farm.
Example Initiative – Equity - The U.S. Offshore Wind Collaborative (USOWC) suggests that
utilities entering into PPAs might seek equity in an offshore wind project in order to prevent
any losses incurred from showing up as liabilities on the books.1 However, this is not likely to
be financially feasible without changes to PUC regulations.
INTERNATIONAL ECONOMIC DEVELOPMENT COUNCIL 74
price of fossil fuels by investing a share of their energy purchase in offshore wind – thus
diversifying their portfolio.
Many projects are unable to find a buyer for their energy. This has led many to call for “market-
making” mechanisms that involve a stronger role for government. These mechanisms include direct
subsidy, government procurement or a national standard for renewable energy.
EEDD SSttrraatteeggiieess
Funding Assistance for Energy Production
Some say that the government should directly subsidize the offshore wind industry, at least in
parity with subsidies for the oil and gas industry. The investment tax credit (ITC) can help achieve
some support by providing a tax credit for investment expenditures.
Government Procurement
This involves the government boosting demand for the market as a direct consumer of offshore
energy through a procurement program. This may provide a short-term fix until the product
develops to the scale that it is viable on the private market.
TThhee RReegguullaattoorryy aanndd PPoolliiccyy EEnnvviirroonnmmeenntt
Government plays a crucial role in determining if and when the offshore wind industry gets off
the ground. They are active as regulators and as well as stimulators for the industry.
Hurdle
A lack of market making mechanisms
Hurdle The Permitting Process – Coordination and Streamlining Initiatives
INTERNATIONAL ECONOMIC DEVELOPMENT COUNCIL 75
The permitting process is characterized by multiple agencies at different levels of government,
often with overlapping jurisdictions. Over 15 federal statutes and 10 agencies have mandate and
authority to review and/or approve aspects of offshore wind projects. These agencies have
concerns including environmental and cultural resources, historic preservation sites, protected areas
such as marine sanctuaries and wildlife refuges, and competing uses such as for ship navigation,
commercial fishing and Department of Defense Training134. As a result, the typical timeline for
projects to get permitted has been seven to ten years.135 The process for getting permits
approved to build offshore wind farms in federal waters is cited by many as the principle source
of delay for the projects in the pipeline. As a recent Department of Energy report reflects, the
offshore wind industry is facing a new and untested permitting process for a nascent industry in
which there is no “institutional knowledge about offshore wind energy facilities.”136 Thus, while
permitting for land-based wind facilities can take between one and two years, offshore wind
farm projects are in suspension for years.
EEDD SSttrraatteeggiieess
Streamline approval process
Economic developers should advocate shortening the timeline for permitting new projects and
simplify the process to reduce overlap and multiplicity of actors.
Example Initiative - Smart from the Start - In order to respond to these bottlenecks and help
the offshore wind industry, the federal government is trying to streamline its own regulatory
process. The Smart from the Start initiative could shorten the permitting timeline for projects
by more than half137. This initiative is attempting to directly address issues related to energy
resource planning, sitting and permitting as well as complementary infrastructure needs. Under
Smart from the Start, the Department of the Interior aims to: 1) Streamline the approval
134 U.S. Department of Energy. (2011, February). A National Offshore Wind Strategy: Creating an Offshore Wind Energy Industry in the United States. Retrieved from http://www1.eere.energy.gov/windandhydro/pdfs/national_offshore_wind_strategy.pdf 135 U.S. Department of Energy. (2011, February). A National Offshore Wind Strategy: Creating an Offshore Wind Energy Industry in the United States, p. 17. Retrieved from http://www1.eere.energy.gov/windandhydro/pdfs/national_offshore_wind_strategy.pdf. 136 U.S. Department of Energy, National Renewable Energy Laboratory. Musial, Walter, NREL and Bonnie Ram, Energetics. (2010, September). Large-Scale Offshore Wind Power in the United States: Assessment of Opportunities
and Barriers, p. 10-12. ( NREL/TP-500-40745). Retrieved from www.nrel.gov/wind/pdfs/40745.pdf 137 U.S. Department of Energy. (2011, February). A National Offshore Wind Strategy: Creating an Offshore Wind Energy Industry in the United States, p. 17. Retrieved from http://www1.eere.energy.gov/windandhydro/pdfs/national_offshore_wind_strategy.pdf on July 20, 2011.

INTERNATIONAL ECONOMIC DEVELOPMENT COUNCIL 76
process and implement a comprehensive and expedited leasing framework; 2) implement a
leasing framework by identifying wind energy areas (WEAs) on the Atlantic Outer Continental
Shelf and conducting environmental reviews; and, 3) moving forward separately to process
applications to build offshore transmission lines.138
To date, DOE is identifying Wind Energy Areas (WEA’s) deemed as potential lease areas and
has conducted a draft regional environmental assessment on WEAs in the first four target states
of New Jersey, Delaware, Maryland and Virginia.
Improve Coordinated Review
Economic developers should support measures to coordinate project review processes by state
and federal actors as another important way of shortening the length of the project timeline.
Indeed, this will be necessary as projects cross state lines (such as proposed underwater
infrastructure projects.)
Key programs that have helped other industries grow are under threat of being suspended or
terminated. The principle federal financing incentive for the land-based wind industry has been
the PTC. With ARRA, wind project developers can alternatively choose to receive a 30 percent
ITC, which will be more critical for offshore wind at this early stage. Another popular incentive is
the Section 1603 program, which provides cash up front or grants in lieu of 30 percent tax
credits.139,140
The reliability and the continuity of the investment tax credit are crucial to the wind industry – as
the example of the onshore wind industry shows. The American Wind Energy Association credited
138 Ibid, p. 13. 139139 Union of Concerned Scientists. (2011). Production Tax Credit for Renewable Energy. Retrieved from http://www.ucsusa.org/clean_energy/solutions/big_picture_solutions/production-tax-credit-for.html 140 American Wind Energy Association. (2011). Federal Policy. Retrieved from http://www.awea.org/issues/federal_policy/index.cfm
Hurdle
Policy Incentives – Crucial Stimulus Tools for Offshore Wind

INTERNATIONAL ECONOMIC DEVELOPMENT COUNCIL 77
Sec. 1603 with enabling construction of 10,000 MW of new land-based wind capacity in 2009
— 6,000 more MW than would have been installed without the program.141 However, the PTC
was allowed to expire in 1999, 2001 and 2003 – and this was correlated with 2000, 2002 and
2004 being the only years since 1999 that there has been an annual drop in new onshore wind
installations.142,143 The production tax credit is again set to expire in 2012.
The short life span and uncertain renewals of the tax credit program are incompatible with the
development timeline of offshore wind and other renewable energy projects. With the production
tax credit set to expire in 2012, it cannot be calculated into cost projections for purposes of
applying for financing.144
EEDD SSttrraatteeggiieess
Support Tax Credit Programs
Economic developers should advocate for long-term extension of key tax programs.
Example Initiative – Long Term PTC – In 2011, Senator Tom Carpenter (D-DE) and Senator
Olympia Snowe (R-ME) proposed a bill to extend the investment tax credit to allow for a
longer lead time in development. Once awarded a tax credit, companies have five years to
install an offshore wind facility. Tax credits are only offered for the first 3,000 MW of
offshore wind facilities or an estimated 600 wind turbines. This legislation is designed to get
the industry off the ground.145,146
141 Offshorewindwire.com. Tax Credit For Offshore Wind Facing Another Uphill Battle. (2011, March 31). Offshoerwindwire.com. Retrieved from http://offshorewindwire.com/2011/03/31/tax-credits-facing-uphill-battle/ 142 Reuter, Guido. (2010, October). Realizing local economic benefits from offshore wind projects. Supply Chain America, Siemens Wind Power. Presentation at AWEA North American Offshore Wind 2010 Conference & Exhibition, Atlantic City, New Jersey. 143 Jim Lanard, President, OffshoreWindDC, President (personal Communication, August 3, 2011) 144 Statement of James S. Gordon, President Cape Wind Associates, LLC before the U.S. House Committee on Natural Resources. (2011, June 1). 145 Offshorewindwire.com. (2011, July 7). Afternoon Roundup: Senators Carper and Snowe Introduce Offshore Wind Tax Credit Bill. Offshorewindwire.com. Retrieved from http://offshorewindwire.com/2011/07/21/afternoon-
roundup-senators-carper-and-snowe-introduce-investment-tax-credit-legislation-for-offshore-wind/ 146 Tom Carpenter. U.S. Senator for Delaware. (2011, July 21). Sens. Carper, Snowe Introduce Bill to Encourage Offshore Wind Energy Production. (Press Release). Retrieved from http://carper.senate.gov/public/index.cfm/pressreleases?ID=fdef0fd4-8302-488e-aae6-4caf97975ba1
INTERNATIONAL ECONOMIC DEVELOPMENT COUNCIL 78
PPoolliittiiccaall HHuurrddlleess
There are political hurdles at the national and project level. The lack of a national policy for
offshore wind hinders the development of the industry and puts it at a comparative disadvantage
to countries in Europe as well as China. The interests that preclude development of a national
policy are expressed at the local level by opposition stakeholders in various projects.
Many stakeholders believe that the U.S. is hindered compared to other countries because it lacks
a unified national energy policy that includes not just goals but binding commitments. Although the
United States has embraced aspirational targets, including a goal to produce 20 percent of its
electricity from wind with offshore wind contributing 54 GW (54,000 MW),147 its commitment to
renewable energy has lagged behind many other Western countries. In 2007, the U.S. signed the
Kyoto Protocol to reduce greenhouse gases, but since then it has neither ratified nor withdrawn
from the Treaty, so it has effectively been non-binding.
Many countries in Europe demonstrate a stronger commitment to renewable energy evidenced by
being signatories to Kyoto and enacting policies such as feed-in-tariffs and national portfolio
standards. As a result, as of February 2011, there were 39 offshore projects online generating in
excess of 2,000 MW of capacity in Europe.148
The U.S. lacks a cohesive national energy in part because it is driven by regional interests. While
some regions have strong, established interests in fossil fuels, other regions are moving ahead to
develop renewable energy. Indeed, many U.S. communities, states and regions have initiated
policies toward greenhouse gas reduction. In 2006, California passed a law to reduce state
147 U.S. Department of Energy & U.S. Department of the Interior, Beaudry-Losique, Jacques et al. (2011, February). A National Offshore Wind Strategy: Creating an Offshore Wind Energy Industry in the United States. Retrieved from:
http://www1.eere.energy.gov/windandhydro/pdfs/national_offshore_wind_strategy.pdf 148 U.S. Department of Energy, National Renewable Energy Laboratory. Musial, Walter, NREL and Bonnie Ram, Energetics. (2010, September). Large-Scale Offshore Wind Power in the United States: Assessment of Opportunities and Barriers. ( NREL/TP-500-40745). Retrieved from www.nrel.gov/wind/pdfs/40745.pdf
Hurdle
National Energy Policy/Politics – an Uncertain Mandate for Offshore Wind
INTERNATIONAL ECONOMIC DEVELOPMENT COUNCIL 79
greenhouse-gas emissions by 25 percent by 2020, putting them in line with Kyoto targets. More
than 400 cities also adopted similar targets. Additionally, 29 states and the District of Columbia
have a RPS program. In 2007, eight Northeastern US states created the Regional Greenhouse
Gas Initiative (RGGI), a state level emissions capping and trading program.
However, while individual initiatives may help bolster the industry, they create an incentive
structure that can pit states and regions against one another. As long as communities and states
have different standards, companies may make locational decisions based on criteria including
cost of compliance with requirements for renewable energy usage.
EEDD SSttrraatteeggiieess
Align communication messages
Communicate a national goal that effectively conveys the importance of offshore wind for present
and future national security, environmental and economic benefits. In the United States, advocates
for offshore energy employ one or some combination of three main areas of argument149:
1. Energy Supply/Independence – Offshore wind creates another domestic supply of energy,
lessening the need for foreign oil and dependence on countries that produce it. According to
NREL, reliance on foreign energy “has significant implications for the national security
situation, transferring wealth to several despotic regimes and leaving our economy vulnerable
to the decisions of these governments.”150 The development of indigenous offshore energy
could help mitigate this.
2. Environment – Offshore wind provides a clean, inexhaustible energy source, reducing the
harmful impact of greenhouse gases.
3. Economy – Offshore wind will create green jobs – jobs in manufacturing, services and
technology, some of which will accrue to sectors and regions that have been hard hit by the
loss of manufacturing. It will provide an antidote to slowing economic trends.
All three of these arguments are employed by supporters of the industry. Yet, it is often the case
that for political reasons, each of these arguments has been emphasized at different times –
dependent on whether the country faces a national security challenge, is supportive of policies for
a clean environment or is facing tough economic times. For example, since the recent depression
149 Ibid, p. 10-12 150 Ibid, p. 12.
INTERNATIONAL ECONOMIC DEVELOPMENT COUNCIL 80
and amidst the slow recovery, the economic or “green job” argument has been recently employed
with some frequency. But even that can be vulnerable. For example, studies can show that
offshore wind energy may be expensive in the short term resulting in the need for someone – i.e.
government, residential and industrial utility customers - to pick up the cost until the industry can
achieve efficiencies.151
Shoring up support for investing in a new industry is difficult given the current economic slowdown.
The economic context cannot be ignored: the U.S. is in the greatest economic slowdown since the
Great Depression. Given federal and state budget shortfalls, it follows that policy-makers are
often more focused on the short-term bottom line and less receptive to calls for investment in new
industries.
EEDD SSttrraatteeggiieess
Proactive Growth Strategies in a Recession
Use recession as a chance to spotlight structural problems in the U.S. economy that demand the
need for new industries to produce jobs that have been lost and won’t come back. The recession
provides an impetus for the U.S. to rally behind renewable energy industries partially by touting
their potential to create green jobs during a time of high unemployment (among other
environmental and national security benefits.) The job benefit will pay off even more in the long-
term as the industry develops.
While there has been recent support for stimulus funding for renewable energy industries, it is
uncertain funding at this level will continue given demands for deficit reduction. Active educating
about the need for offshore wind will be necessary.
151 Tuerck, David, Bachman, Paul, & Murphy, Ryan. (2011, June). The Cost and Economic Impact of New Jersey’s Offshore Wind Initiative. Retrieved from Beacon Hill Institute website: http://www.beaconhill.org/BHIStudies/NJ-Wind-2011/NJWindReport2011-06.pdf.
Hurdle
The current economic slowdown can damper public investment
INTERNATIONAL ECONOMIC DEVELOPMENT COUNCIL 81
Hurdle
Opposition stakeholders can delay and derail a project
Opposition stakeholders include those who oppose an offshore project on any one or several of
the following grounds:
Competing Fossil Fuel Interests
Land Owners/Visual Effects
Marine Life/ Animal Population (i.e. native marine animals, bats, birds)
Visual Effects
Property Holders
Noise
Tourism
Marine Safety – Fisherman and Boaters
Native Americans – sacred ground
Industry/Taxpayers
Two examples of opposition to offshore wind are the BlueWater Wind and Cape Wind projects
in Delaware and Massachusetts. In a survey of 1,000 residents near the projects, opponents were
most concerned with fishing and recreational boating safety, followed by marine life/environment
followed third by aesthetics.152
The best known and most well-funded example of opposition to an offshore wind project is the
case of Cape Wind. The project was opposed by the well-funded Alliance to Protect Nantucket
Sound, led by members of the business community from the fossil fuel industry and wealthy
landowners on Nantucket Sound. At one point, the Chair of the Alliance was William Koch, who
donated $1.5 million of his own funds to oppose the project. Koch has a house on Nantucket
152 Firestone, Jeremy, Lilley, Meredith Blaydes & Kempton, Willet. (2010, Oct 6). Mapping Public Perceptions and Preferences Through Space and Time. Center for Power-free Carbon Integration, University of Delaware. Presentation at AWEA North American Offshore Wind 2010 Conference & Exhibition, Atlantic City, New Jersey.
INTERNATIONAL ECONOMIC DEVELOPMENT COUNCIL 82
Sound and a business background in the energy industry.153 The Alliance launched over ten
appeals to federal and state courts to block passage of the project.154 Another well-placed
opponent of the project was Senator Edward (Ted) Kennedy who had a family history and
property on the Sound.
Opposition can be directed at developers as well as the state in response to aggressive
initiatives. In New Jersey, the Offshore Wind Development Act that Governor Chris Christie signed
into law in 2010 generated pushback. A report by the Beacon Hill Institute concluded that the
policies would result in a high cost to the state’s residential and commercial consumers of
electricity and a net loss of revenue and jobs to the state of New Jersey.
Additionally, offshore wind opponents may take their battles to court. In Rhode Island, the
offshore wind farm off Block Island being developed by Deepwater Grid faced a state Supreme
Court review over the legality of the PPA the developer signed with National Grid. Industrial
energy consumers and NGOs such as the Ocean State Policy Research Institute said the PPA
would increase energy costs, ultimately hurting residents, companies and costing the state jobs.
Companies claimed they could see a threefold rate hike under the PPA. In July 2011, the Rhode
Island Supreme Court decided not to overrule the state Public Utility Commission and to let the
PPA stand on the grounds that Rhode Island residents would experience environmental and
economic benefits.155,156
More generally, the offshore wind industry could be affected by cases that are brought against
state programs such as the RPS. Law suits attacking RPS programs are pending in Colorado,
Massachusetts, New Jersey and New York. They are based on the Commerce Clause or Article 1,
section 8, clause 3 of the Constitution that has been interpreted to strike down laws that impede
interstate commerce. Since RPS requires that utilities purchase a certain percent of renewable
153 Doyle, Tim (2006, September 21). Koch's New Fight. Fortune. Retrieved from: http://www.forbes.com/2006/09/21/koch-gordon-nantucket-biz_cz_td_06rich400_0921nantucket.html 154 Statement of James S. Gordon, President Cape Wind Associates, LLC before the U.S. House committee on Natural Resources. (2011, June 1). 155 Tiernan, Erin. (2011, May 12). Industrial Companies Challenge Block Island's Off Shore Wind Farm. Narragansettpatch. Retrieved from http://narragansett.patch.com/articles/industrial-companies-challenge-block-
islands-offshore-wind-farm 156 Renewbl.com. (2011, July 5) Deepwater Wind's PPA for Block Island wind farm approved. Renewbl.com. Retrieved from http://www.renewbl.com/2011/07/05/deepwater-winds-ppa-for-block-island-wind-farm-approved.html

INTERNATIONAL ECONOMIC DEVELOPMENT COUNCIL 83
energy from instate providers, these law suits are claiming the RPS programs are
unconstitutional.157
EEDD SSttrraatteeggiieess
Economic developers should help identify opposition stakeholders and be ready to respond to
areas of potential challenge to the offshore project. Engage opposition stakeholders from the
beginning and at all stages of the development and review process.
HHyyddrrooeelleeccttrriicciittyy:: PPaarraalllleellss ttoo tthhee OOffffsshhoorree WWiinndd IInndduussttrryy
The hydroelectric industry faced many of the same hurdles as the offshore wind industry does
today. Hydroelectric plants are expensive to construct. The typical hydroelectric plant requires
$52.7 to $71.3 million of startup capital.158 However, once operational, they are cheaper to
maintain than traditional energy technologies such as fossil-fuel steam, nuclear steam, and gas
turbines.159 Hydroelectric plants also face regulatory and permitting difficulties. The process for
licensing and relicensing dams can be lengthy and expensive, taking from three to seven years
and involving as many as 13 federal agencies.160 Political hurdles are also an issue. Hydropower
projects often run into the NIMBY (Not-In-My-Backyard) attitude raised by locals who fear the
environmental impacts of a dam as well as accidents stemming from poor engineering.
Although these issues have not been completely resolved, the hydroelectric industry boomed over
the latter half of the 20th century. Figure 2 outlines historical U.S. energy generation from
traditional and renewable energy sources, including conventional hydropower.161 Although
hydropower generation has reached a plateau in recent decades, it is the most popular form of
renewable energy generation today.
157 Cavanaugh, Michael and Humes, Stephen J. (October, 2011) . Constitutional Challenges to Renewable Energy – Threats and Opportunities for Offshore Wind. Holland & Knight . Presentation at the AWEA Offshore Windpower Conference and Exhibition, Baltimore, Maryland. 158 Idaho National Laboratory. (2005, July 18). Hydropower Plant Costs and Production Expenses. Retrieved from http://hydropower.inel.gov/hydrofacts/plant_costs.shtml 159 Ibid. 160 The National Energy Education Development (NEED) Project. (2011). Hydropower. Retrieved from http://www.need.org/needpdf/infobook_activities/SecInfo/HydroS.pdf 161 Conventional hydropower (i.e. a dam and turbine system) is the most popular hydropower technology in the U.S.
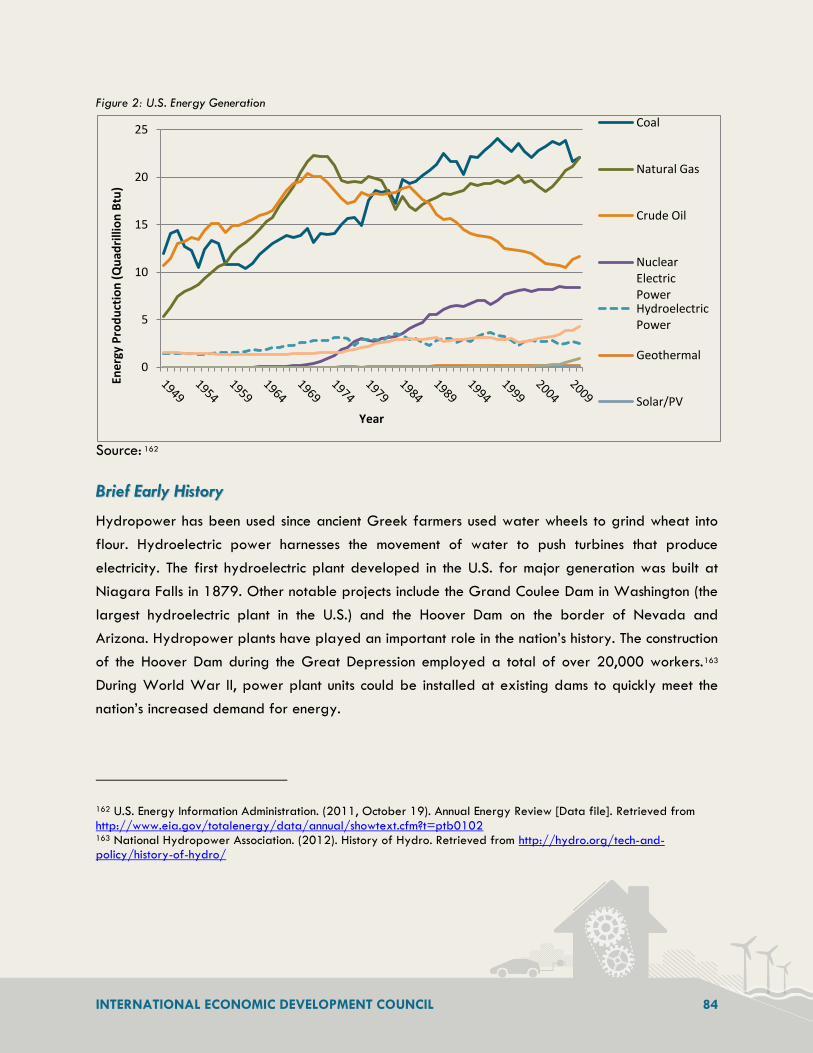
INTERNATIONAL ECONOMIC DEVELOPMENT COUNCIL 84
Figure 2: U.S. Energy Generation
Source: 162
BBrriieeff EEaarrllyy HHiissttoorryy
Hydropower has been used since ancient Greek farmers used water wheels to grind wheat into
flour. Hydroelectric power harnesses the movement of water to push turbines that produce
electricity. The first hydroelectric plant developed in the U.S. for major generation was built at
Niagara Falls in 1879. Other notable projects include the Grand Coulee Dam in Washington (the
largest hydroelectric plant in the U.S.) and the Hoover Dam on the border of Nevada and
Arizona. Hydropower plants have played an important role in the nation’s history. The construction
of the Hoover Dam during the Great Depression employed a total of over 20,000 workers.163
During World War II, power plant units could be installed at existing dams to quickly meet the
nation’s increased demand for energy.
162 U.S. Energy Information Administration. (2011, October 19). Annual Energy Review [Data file]. Retrieved from http://www.eia.gov/totalenergy/data/annual/showtext.cfm?t=ptb0102 163 National Hydropower Association. (2012). History of Hydro. Retrieved from http://hydro.org/tech-and-policy/history-of-hydro/
0
5
10
15
20
25 En
erg
y P
rod
uct
ion
(Q
uad
rilli
on
Btu
)
Year
Coal
Natural Gas
Crude Oil
Nuclear Electric Power Hydroelectric Power
Geothermal
Solar/PV
INTERNATIONAL ECONOMIC DEVELOPMENT COUNCIL 85
The U.S. Army Corps of Engineers is the U.S.’s largest owner and operator of hydroelectric plants,
managing about a third of the nation’s hydroelectric output.164 Congress also authorized the
Department of the Interior’s Bureau of Reclamation to construct hydroelectric plants, especially in
the resource-rich western U.S. The federally-established Tennessee Valley Authority also manages
a significant number of plants along the Tennessee River. These plants are self-powering, and
excess power is sold to rural electric power co-ops, public utility districts, municipalities, state and
federal agencies, and (at lowest priority) private utilities. Hydroelectric plants have become
crucial to the local manufacturing and farming operations that rely on them for energy and
irrigation. Today, the Bureau and the Corps of Engineers are focused on modernizing existing
facilities to increase efficiency and reliability.
Although hydroelectric plants face significant hurdles, their benefits outweigh their costs. The
evolution of the hydroelectric industry includes some solutions that can be applied to the offshore
wind industry as well.
Hurdle Hydroelectric plants require a high upfront investment.
EEDD SSttrraatteeggiieess
Increased R&D to raise lifetime of plants
The business model for hydroelectric plants has largely prevailed because of low operational
costs and the long lifetime of plants. Hydroelectric plants on average cost $2,000 per kWh of
capacity to build, but they cost less than one cent per kWh to operate and maintain.165 Further,
many plants constructed 50 to 100 years ago are still operational today.166 The long lifetime of
plants can be credited to their sustainable design. The design of hydroelectric plants today is
164U.S. Army Corps of Engineers. (2012). Hydropower. Retrieved from http://operations.sam.usace.army.mil/Hydropower/ 165 Idaho National Laboratory. (2005, July 18). Hydropower Plant Costs and Production Expenses. Retrieved from http://hydropower.inel.gov/hydrofacts/plant_costs.shtml 166 International Energy Agency. (2010). Renewable Energy Essentials: Hydropower. Retrieved from http://www.iea.org/papers/2010/Hydropower_Essentials.pdf

INTERNATIONAL ECONOMIC DEVELOPMENT COUNCIL 86
generally standardized, with many of the drastic changes happening before World War II.167
Increasing federal regulation during this time required private developers to cooperate with new
safety standards as well as federal plans for hydropower development.168 In the 1920’s, the
Army Corps of Engineers began doing hydropower design work as well. As hydropower became
more of a federal priority, private and public engineering alike started to converge.
Modernizing hydroelectric plants is a federal priority today. The 2009 Recovery Act awarded
$30.6 million in funding to modernize seven hydropower facilities.169 The Department of Energy’s
Water Power Program works actively with federal laboratories across the nation to support
ongoing research in water power technologies.170 In a similar vein, the market for offshore wind
will be more feasible as turbines increase in size and thus generate greater efficiencies. Although
large turbines represent a higher upfront investment, increasing the quality and durability of these
turbines will help justify the cost.
Cost sharing among public and private sectors
Although the federal government played an integral part in financing the nation’s largest
hydroelectric plants, other partners provided significant funding as well. The National Water
Commission estimates funding streams in the first half of the 20th century. Up to 1968, federal
financing for hydropower totals to $9.3 billion, state and local governments contributed $3.2
billion, and the private sector pitched in $6.2 billion (in 1972 dollars).171 As federal budgets have
tightened in recent years, public-private investment in hydropower projects has become more
common. In Utah, the Central Utah Project (a federally-funded water supply initiative) partnered
167 U.S. Department of the Interior – Bureau of Reclamation. (2009, August 12). The History of Hydropower Development in the United States. Retrieved from http://www.usbr.gov/power/edu/history.html 168 Billington, D., Jackson, D. & Melosi, M. (2005). The History of Large Federal Dams: Planning, Design and Construction. U.S. Department of the Interior – Bureau of Reclamation. Retrieved from http://www.cr.nps.gov/history/online_books/dams/federal_dams.pdf 169 National Hydropower Association. (2012). Modernizing Hydropower. Retrieved from http://hydro.org/tech-and-policy/developing-hydro/modernizing/ 170 U.S. Department of Energy – Energy Efficiency and Renewable Energy. (2011, December 8). Water Power Program. Retrieved from http://www1.eere.energy.gov/water/index.html 171 Eisel, L. & Wheeler, R. (1980). Financing Water Resources Development. Federal Reserve of Kansas City. Retrieved from http://www.kc.frb.org/Publicat/sympos/1979/s79eisel.pdf

INTERNATIONAL ECONOMIC DEVELOPMENT COUNCIL 87
with a private utility to develop hydropower.172 The government will profit by selling leases to the
site, while the private utility gains from selling the energy generated.
Past hydropower projects point to a blueprint for negotiating cost sharing between various partners. These can also apply to the offshore wind sector:173
Timing of contribution (up front or reimbursement)
Interest rate on reimbursable balance and the number of interest-free years
Length of repayment period
Value and terms of transfer accounts
Value of contributions in kind
Hurdle
Hydroelectric plants involve a complex permitting and regulatory process.
EEDD SSttrraatteeggiieess
Established primary regulatory agency early on
Hydroelectric plants can raise environmental concerns since they may impact water resources, fish
and wildlife. These complicate the permitting process. Before 1920, hydropower developers
needed a special act of Congress to move forward with plans involving federal lands.174 Permits
were given away on a “first come, first serve” basis and were impacted by each state’s
Congressional representation. When World War I hit, demand for electricity skyrocketed, and
supply had to be expanded quickly. Congress established the Federal Power Commission to
regulate non-federal hydropower projects that would affect federal lands or interstate
commerce. The FPC underwent a number of transitions over the years, and was reorganized into
the Federal Energy Regulatory Commission after the 1970’s energy crisis. The FERC now regulates
56 percent of hydroelectric projects in the U.S. The remaining projects were built by the federal
172 DeBruin, L. (2011, May 11). U.S. seeking private funds to build Utah hydropower. Bloomberg BusinessWeek. Retrieved from http://www.businessweek.com/ap/financialnews/D9N584400.htm 173 Eisel, L. & Wheeler, R. (1980). Financing Water Resources Development. Federal Reserve of Kansas City. Retrieved from http://www.kc.frb.org/Publicat/sympos/1979/s79eisel.pdf 174 Finnegan, D. & Warning, K. (2011). Hydropower. Center for Culture, History and Environment. University of Wisconsin-Madison. Retrieved from http://che.nelson.wisc.edu/cool_stuff/energy/hydro.shtml#history
INTERNATIONAL ECONOMIC DEVELOPMENT COUNCIL 88
government and are supervised by the agency that built them (i.e. Bureau of Reclamation, Army
Corps of Engineers or the Tennessee Valley Authority).175
Today, private hydropower developers still undergo a lengthy permitting process and must
interface with a variety of stakeholders: the FERC, federal and state agencies, local governments,
tribes, non-governmental agencies as well as the general public. The National Hydropower
Association suggests key steps to expedite hydropower development. This includes streamlining
licensing for minimal impact projects and for the Army Corps and Bureau of Reclamation to
conduct an internal review of possible development sites in order to attract more private
investment.176 Offshore wind permitting faces a lack of knowledge and leadership on the federal
level. While these issues may not be solved overnight, the evolution of the hydropower permitting
process demonstrates a step by step approach to consolidating regulatory hoops.
Hurdle
Hydroelectric plants often face political hurdles due to environmental and social
concerns.
SSoolluuttiioonnss
Launched marketing campaign to emphasize cautionary measures
The environmental impact of hydroelectric plants varies on a case-by-case basis.177 At their worst,
hydroelectric plants can impact the population and migration of fish by altering water levels or
by catching fish in turbine blades. For example, hydropower facilities along the Columbia River in
Washington are thought to have contributed to the decline of the local salmon population.178 Some
175 Federal Energy Regulatory Commission. (2011, November 18). Use and Regulation of a Renewable Resource. Retrieved from http://www.ferc.gov/industries/hydropower/gen-info/regulation/use.asp 176 National Hydropower Association. (2012). More Efficient Regulatory Process for Hydro. Retrieved from http://hydro.org/tech-and-policy/policy-priorities/more-efficient-regulatory-process/ 177 Environmental Protection Agency. (2007, December 28). Hydroelectricity. Retrieved from
http://www.epa.gov/cleanenergy/energy-and-you/affect/hydro.html 178 Brower, M. (2002, October 26). Environmental Impacts of Renewable Energy Technologies. Union of Concerned Scientists. Retrieved from http://www.ucsusa.org/clean_energy/our-energy-choices/renewable-energy/environmental-impacts-of.html

INTERNATIONAL ECONOMIC DEVELOPMENT COUNCIL 89
plants have installed technology to mitigate such impacts: “fish ladders” that help transport fish
over dams, screens that protect fish from turbine blades, and even underwater lights that help
night-migrating fish swim around turbine blades.179 Marketing these cautionary measures will help
alleviate the concerns raised by conservationists. For example, the National Hydropower
Association (NHA) issues “Outstanding Stewards of America’s Waters” awards each year for
hydropower electricity projects that make exceptional efforts to protect river ecosystems. The
winners are profiled on NHA’s website with details of the specific environmental challenge at the
project site, the technology or method used to tackle it,
and the resulting benefits to the wildlife and ecosystem.
As more innovative and cost-effective measures are
developed to protect wildlife, marketing these
technologies will help dispel outdated misconceptions
about hydropower’s environmental impacts.
Emphasize impacts of hydropower relative to other
energy technologies
While some hydroelectric facilities do have real
environmental impacts, it is important to emphasize the
“bigger picture” of these impacts relative to those of
other technologies. Increasing concerns about greenhouse gas emissions have made renewable
energy generation indispensable. Hydroelectric plants do not emit carbon dioxide or sulfur
dioxide like coal, oil or natural gas plants do, and they do not risk radioactive contamination like
do nuclear power plants.180 Further, the environmental impacts of hydropower facilities must not
be confused with the byproducts of other human activities. For example, irrigation, timber, mining,
home construction and the activities of other local industries can also impact the river system.181
The exact roles of these various activities in the ecosystem are difficult to ascertain in isolation,
and the environmental impact of hydropower is still a subject of debate among scientists.
Attempts to minimize these possible impacts must take into account other local activities as well.
179 Ibid. 180 Baird, S. (n.d.) Hydro-Electric Power. Ohio State University – Physics Department. Retrieved from http://www.physics.ohio-state.edu/~kagan/phy367/P367_articles/HydroElectric/hydroelectric.html 181 Foundation for Water & Energy Education. (2012). Overview of Hydropower in the Northwest. Retrieved from http://fwee.org/education/the-nature-of-water-power/overview-of-hydropower-in-the-northwest/
Figure 3: Fish ladder at the Ice Harbor Dam in
Washington. Source: EERE
INTERNATIONAL ECONOMIC DEVELOPMENT COUNCIL 90
Like hydropower, several offshore wind projects have faced significant opposition from local
interest groups concerned about safety, environmental impacts and aesthetics. Champions of
offshore wind can point to the environmental precautions built into the design of wind turbines and
also emphasize the relative advantages of wind energy with respect to fossil fuel technologies.
INTERNATIONAL ECONOMIC DEVELOPMENT COUNCIL 91
AAPPPPEENNDDIIXX
WWIINNDD TTEECCHHNNOOLLOOGGYY TTEESSTTIINNGG CCEENNTTEERRSS
CClleemmssoonn UUnniivveerrssiittyy - The DOE provided $45 million in funds, which was matched by $53
million in local funds, toward the large wind turbine drivetrain test facility at the Clemson
University Restoration Institute University in 2009. Drive trains takes energy generated by a
turbine’s blades and increase the rotational speed to drive the electrical generator, similar to a
car transmission.182
MMaassssaacchhuusseettttss CClleeaann EEnneerrggyy CCeenntteerr - The DOE awarded $24.7 million in funding from the
American Recovery and Reinvestment Act (ARRA) to accelerate development of the Massachusetts
Clean Energy Center’s (MassCEC) Wind Technology Testing Center Charlestown, Massachusetts in
May 2009. The center had previously received a $2 million federal NREL grant in 2007 towards
its development. The Center will be the first commercial large blade test facility in the nation,
testing blades up to 90 meters in length– including offshore blades – with the goal of expediting
their deployment to the marketplace. 183 The WTTC is uniquely positioned on an existing deep
water port and near interstate highways, allowing blades to be shipped in by water or with
shorter blades shipped by road if required.184 In May 2011, the facility opened its doors. The
American company Clipper Windpower was the first business to utilize the Massachusetts Clean
Energy Center’s new WTTC.
TThhee UUnniivveerrssiittyy ooff HHoouussttoonn - The DOE awarded the University of Houston $2 million in
capital funds in 2007, as well as technical and operational assistance, for a new facility to test
large blades suitable for large turbines. The University of Houston has completed an agreement
182 http://www.clemson.edu/media-relations/article.php?article_id=2432. Accessed August 22, 2011. 183 Ibid. 184 http://www.masscec.com/index.cfm/page/Governor-Patrick-Celebrates-Opening-of-Nation's-First-Large-Scale-Wind-Blade-Testing-Facility/cdid/12142/pid/3001
INTERNATIONAL ECONOMIC DEVELOPMENT COUNCIL 92
with the DOE to design, construct and operate a wind turbine blade testing facility at Ingleside,
Texas which would have the capacity to test blades at least 70 meters in length.185,186
NNeexxtt GGeenneerraattiioonn TTeecchhnnoollooggyy// UUnniivveerrssiittyy ooff MMaaiinnee - The Department of Energy has also
contributed substantial R&D funds to develop deepwater “next generation” technology for
floating turbans in water depths of 60 meters and more. Such technology is on the cutting edge
globally. Maine received $112.4 million in federal stimulus funds to build the 37,000 square foot
Wind Laboratory187 known as the AEWC Advanced Structures and Composite Center, housed at
The University of Maine, to develop such technology. Maine also approved a bond measure in
June 2010 to provide $11 million in state funds for deepwater wind research.188
CCaappee WWiinndd CCaassee SSttuuddyy
The Cape Wind project was the first to submit an application for a federal permit to build a wind
farm in 2001, was the first to win a federal lease in 2010 and now is the only utility-sized project
with a purchase power agreement (PPA) contracting a large share of its energy supply to a
utility. Cape Wind stands to provide 468 MW of wind energy to the Cape Cod, Massachusetts
region, one-half of which has been contracted to National Grid. After a process full of many
twists and turns, Cape Wind appears on track to be the first wind farm in federal water.
Cape Wind’s regulatory review process involved the participation of 17 federal and state
agencies.189 Midway through the process in 2005, the lead regulatory agency switched from the
Army Corps of Engineers to the Department of Interior, and Cape Wind had to virtually begin the
permitting process anew. Yet while Cape Wind might have faced headaches navigating through
all that, it was the political opposition at the local and national level that almost grounded the
project.
185“University of Houston wind-power testing site approved for design.” Retrieved from http://www.tkvw.com/researchuh/news2.htm on August 15, 2011. 186 (2008, June 6). NREL Launches Major Wind Projects with DOE, Partners. Retrieved from http://www.nrel.gov/features/20080601_new_wind_projects.html on August 15, 2011. 187 US Offshore Wind Collaborative. (2010, August). “State Offshore Wind Initiatives/Proposed Projects.” Retrieved
from http://www.usowc.org/pdfs/State_Initiatives_8_3_10.pdf. on July 26, 2011. 188 Ibid. 189 Statement of James S. Gordon, President Cape Wind Associates, LLC before the U.S. House committee on Natural Resources. (2011, June 1).

INTERNATIONAL ECONOMIC DEVELOPMENT COUNCIL 93
Many of New England’s rich and powerful own land on Cape Cod. In many ways it is less a
surprise that there was significant opposition to the project than that Cape Wind Associates has
been able to overcome it. During the last ten years, the developer of the project Jim Gordon
invested significant time and effort to overcome well-funded and high-placed political opposition.
Gordon’s group Cape Wind Associates forged alliances with environmental groups, unions and
other interests, working vigorously at the local and national scale to keep the Cape Wind project
alive.
The project was opposed by many who have homes or strong ties to Cape Cod and the Nantucket
Sound. The project could be seen in the distance from the shoreline and by those sailing in the
Sound. Some exhorted the Cape as a “National Treasure,” an original waterway of the Pilgrims.
Others called the natural environment of Cape Wind a “sanctuary” that should not be disturbed.
(It does not have official sanctuary status). Many of these criticisms existed prior to the
environmental review for effects on the wildlife.190
The Alliance to Protect Nantucket Sound, also known as Save Our Sound, was the group at the
forefront of the opposition. Its tactics included organizing signatures and buying print advertising
and video infomercials which at one point featured Walter Cronkite who lived on the nearby
Martha’s Vineyard and sailed his boat in Nantucket Sound. Cronkite later changed his position
and asked the organization to stop using his image. William Koch has been Co-Chair or member
of the board of The Alliance to Protect Nantucket Sound since 2005. He has contributed $1.5
million of his own money, much of which was made in the energy industry.191 Over the course of
the project, the Alliance launched over ten appeals to the federal or state courts to block passage
of the project.192
Court cases have been launched by other parties such as the Wampanoag Tribe of Gay Head
that filed suit in July, 2011 on the grounds that the wind farm would potentially damage
190 Williams, Wendy and Whitcomb, Robert. (2007). Cape Wind: Money, Celebrity, Class, Politics and the Battle for Our Energy Future. New York, New York: BBS Public Affairs. 191 Doyle, Tim (2006, September 21). Koch's New Fight. Fortune. Retrieved from: http://www.forbes.com/2006/09/21/koch-gordon-nantucket-biz_cz_td_06rich400_0921nantucket.html 192 Statement of James S. Gordon, President Cape Wind Associates, LLC before the U.S. House committee on Natural Resources. (2011, June 1).
INTERNATIONAL ECONOMIC DEVELOPMENT COUNCIL 94
archaeological sites on the ocean floor and would obstruct the view of the rising sun, affecting
ceremonial worship.193
Many high-profile politicians from both the Democrat and Republican parties opposed the
project. Senator Edward (Ted) Kennedy who had a family history and property on the Sound was
a strong though usually low-profile opponent, as was his nephew Robert Kennedy, Jr. who spoke
up more loudly. Governor Mitt Romney was also an opponent of the Sound. Other politicians
outside of New England including U.S. Alaska Senator Ted Stevens and Virginia Senator John
Warner were also opposed to Cape Wind.194
One of the fiercest battles that Jim Gordon fought was to defeat a 2005 U.S. Senate amendment
that would have effectively shut down Cape Wind, allowing the Governor of an adjacent state to
Cape Wind to veto the project. Jim Gordon worked the halls of Congress together with
environmental, union and other groups who were able to gain the support of key politicians from
both sides including to ultimately kill the amendment.
In order to stop this legislation, Jim Wind was joined by many partners who worked the halls of
Congress including Greenpeace and the Maritime Trade Council, a group representing 17 unions
in New England including the International Brotherhood of Electricians.195 The relationship forged
with the unions was invaluable to the project on several levels: having the unions as partners
lessens the chance of labor disputes down the line and helps budgeting for labor costs be more
realistic and the unions are well-connected, experienced and influential lobbying partners.
Now Cape Wind stands poised as a survivor, ready to develop its wind farm with federal lease
in hand with the major hurdle being the sale of the remaining half of its energy. National Grid’s
contract to purchase 234 MW of energy from Cape Wind makes Cape Wind the only project to
have sold a current PPA commitment for a utility-scale amount of energy. The developer has
193 Wood, Elisa. (2010, March 22). “Offshore Awakening: US Investment Flows to Offshore Wind. “ RenewableEnergyWorld.com. Retrieved from http://www.renewableenergyworld.com/rea/news/article/2010/03/offshore-awakening on July 15, 2011. 194 Williams, Wendy and Whitcomb, Robert. (2007). Cape Wind: Money, Celebrity, Class, Politics and the Battle for
Our Energy Future. New York, New York: BBS Public Affairs. 195 Cape Wind Associates. (2003, April 24). Fishermen, maritime, and labor organizations endorse Cape Wind project. Press release from Cape Wind Associates. Retrieved from: http://www.capewind.org/modules.php?op=modload&name=News&file=article&sid=1
INTERNATIONAL ECONOMIC DEVELOPMENT COUNCIL 95
indicated it will buy turbines from Siemens that will be positioned 6 to 10 miles from shore. The
468 MW generated by Cape Wind is projected to meet approximately 75 percent of the annual
electricity needs of Cape Cod and the Islands of Martha’s Vineyard and Nantucket196.
The region where Cape Wind is situated has a need for new sources of energy due to aging
power plants, a situation which has been recognized by ISO New England, Inc., the operator of
electricity for a four-state New England region including Massachusetts. 197,198 As a result, the case
for clean wind has become more compelling. Proponents make the case that the price for offshore
wind compares more favorably to other energy sources when the “all-in” cost of fossil fuels
includes installation and maintenance of a new plant.
Residents understand the need for new energy. The region has been home to near energy crises
during particularly cold spells where the natural gas system was practically at capacity and
almost shut down. While there has been high-profile and well-funded opposition, among residents
in Cape Code and Massachusetts there has generally been majority support for the project.199
The project is also expected to generate jobs for the local economy and the growth or expansion
of businesses. A job study done for Cape Wind Associates by the firm Global Insight found that in
its initial stage, Cape Wind would generate more than 1,000 construction jobs, 50 O&M jobs and
additional spinoff jobs.200,201
Finally, the project aims to open up a new frontier in renewable energy. With its “first in the
water” splash, Cape Wind will accomplish initiation of the offshore wind industry in the United
States and lead to the success of other projects in the pipeline.
196 George Sterzinger, personal communication, July 25, 2011. 197 Lindsay, Jay. (2011, October 6). Report: New England power grid facing challenges. Bloomberg Business Week: The Associated Press. Retrieved from: http://www.businessweek.com/ap/financialnews/D9Q738RG2.html 198 ISO New England Inc. (2011, October 21). 2011 Regional System Plan. ISO New England. Retrieved from: http://www.iso-ne.com/trans/rsp/index.html 199 Williams, Wendy and Whitcomb, Robert. (2007). Cape Wind: Money, Celebrity, Class, Politics and the Battle for Our Energy Future. New York, New York: BBS Public Affairs. 200 Global Insight. (2003, April 2). Economic Impact Analysis of the Cape Wind Offshore Renewable Project. Retrieved from: http://www.capewind.org/downloads/Economic_Impact.pdf 201 Cape Wind Associates. (2011, November 3). Cape Wind & Massachusetts: Creating Jobs and Providing Clean Power to Massachusetts. Cape Wind Associates. Retrieved from: http://www.capewind.org/downloads/CapeWind&Massachusetts2.pdf