analysis of the opportunity to increase the capacity of...
TRANSCRIPT
Analysis of the Opportunity to Increase the
Capacity of the Line Creek Processing Facility
by
Jared F. Musschoot
Bachelor of Science (Chemistry), University of Saskatchewan, 2000 Bachelor of Engineering (Chemical), University of Saskatchewan, 2000
Project Submitted in Partial Fulfillment of the
Requirements for the Degree of
Master of Business Administration
in the
Beedie School of Business
Faculty of Business Administration
Jared F. Musschoot, 2015
SIMON FRASER UNIVERSITY
Spring 2015

ii
Approval
Name: Jared F. Musschoot
Degree: Master of Business Administration
Title of Project: Analysis of the Opportunity to Increase the Capacity
of the Line Creek Processing Facility
Supervisory Committee:
______________________________________
Dr. Michael Parent, Professor
Senior Supervisor
Professor of Management Information Systems and
Marketing Faculty of Business Administration
______________________________________
Dr. Leyland Pitt, Professor
Second Reader
Professor, Marketing and Dennis F. Culver EMBA
Alumni Chair of Business Faculty of Business
Administration
Date Approved: May 26th, 2015

iii
Partial Copyright License

iv
Ethics Statement

v
Dedication
To my wife Cathy, I could not have done this without your support. I truly appreciate
everything you make me do and the person you are.
Today you are You, that is truer than true. There is no one alive who is Youer than You.
Dr. Seuss

vi
Acknowledgements
Ian Anderson
Steve Warr
Kerry Lacroix
Brad Cromey
Mike Dobie
Amanda Thumma
Norm Fox
Brad Johnston

vii
Table of Contents
Partial Copyright License ............................................................................................... iii Ethics Statement ............................................................................................................ iv Dedication ....................................................................................................................... v Acknowledgements ........................................................................................................ vi Table of Contents .......................................................................................................... vii List of Tables ................................................................................................................. viii List of Figures................................................................................................................. ix List of Acronyms .............................................................................................................. x Glossary ........................................................................................................................ xii Executive Summary ......................................................................................................xiv
Chapter 1. Introduction ............................................................................................. 1
Chapter 2. Line Creek Processing Plant Background ............................................. 2
Chapter 3. Coal Business Unit Industry Analysis.................................................... 6
Chapter 4. Bottleneck Analysis............................................................................... 20
Chapter 5. Economic Analysis of Capacity Options ............................................. 28
Chapter 6. Other Impacts on Line Creek Capacity Increases ............................... 33
Chapter 7. Recommendations ................................................................................ 35
References ................................................................................................................ 36 Appendix Calculations for Economic Analysis ....................................................... 37

viii
List of Tables
Table 3-1 Teck Coal Annual Production ........................................................................ 13
Table 3-2 Teck Coal Adjusted Annual Production with Line Creek at 4 Mmtcc .............. 14
Table 3-3 Teck Coal Adjusted Annual Production with Line Creek at 5 Mmtcc .............. 14
Table 3-4 Teck Coal Process Plant Productivities ......................................................... 15
Table 3-5 Teck Coal Adjusted Process Plant Productivities with Line Creek at 4 Mmtcc .................................................................................................... 15
Table 3-6 Teck Coal Adjusted Process Plant Productivities with Line Creek at 5 Mmtcc .................................................................................................... 15
Table 3-7 Line Creek Percent of Total Spending for Teck Coal ..................................... 16
Table 3-8 Line Creek Adjusted Percent of Total Spending with Line Creek at 4 Mmtcc for Teck Coal .............................................................................. 16
Table 3-9 Line Creek Adjusted Percent of Total Spending with Line Creek at 5 Mmtcc for Teck Coal .............................................................................. 16
Table 3-10 Teck Coal Percent of Total Production ........................................................ 17
Table 3-11 Teck Coal Adjusted Percent of Total Production with Line Creek at 4 Mmtcc .................................................................................................... 17
Table 3-12 Teck Coal Adjusted Percent of Total Production with Line Creek at 5 Mmtcc .................................................................................................... 17
Table 3-13 Teck Coal Ratio of Percent of Total Spending and Percent of Total Production .............................................................................................. 18
Table 3-14 Teck Coal Adjusted Ratio of Percent of Total Spending and Percent of Total Production with Line Creek at 4 Mmtcc...................................... 18
Table 3-15 Teck Coal Adjusted Ratio of Percent of Total Spending and Percent of Total Production with Line Creek at 5 Mmtcc...................................... 19
Table 4-1 Base Case Cable Belt Capacity ..................................................................... 21
Table 4-2 Plant 4 Mmtcc Capacity ................................................................................. 22
Table 4-3 Plant 5 Mmtcc Capacity ................................................................................. 23
Table 4-4 Cable Belt 5 Mmtcc Capacity Case ............................................................... 25
Table 5-1 Capital Dollars for 4 Mmtcc Capacity ($000’s) ............................................... 29
Table 5-2 Capital Dollars for 5 Mmtcc Capacity Plant ($000's) ...................................... 30
Table 5-3 Capital Dollars for 5 Mmtcc Capacity Mine ($000's)....................................... 31
Table 5-4 Economic Analysis Summary ........................................................................ 31

ix
List of Figures
Figure 2-1 Process Flow Diagram for Line Creek Plant ................................................... 5
Figure 3-1 Primary Fuel Sources for Electricity in US 2009 ............................................. 7
Figure 3-2 Teck Annual Clean Coal Production ............................................................... 8
Figure 3-3 Porter's (Augmented) Five Forces Analysis .................................................... 9
Figure 4-1 Line Creek Operations Cable Belt ................................................................ 26

x
List of Acronyms
$/t Dollars per tonne
831 Standard grade metallurgical coal
833 Thermal coal
835 Eagle grade metallurgical coal
BCR Benefit to cost ratio
BHP Australian multinational mining company
BRN Burnt ridge north pit
BRX Burnt ridge extension pit
CC Clean coal
Cdn Canadian
CMO Coal Mountain Operations
CRO Cardinal River Operations
CTPH Clean coal tonnes per hour
c/v Conveyor
EVO Elkview Operations
FCC Fine coal classifying cyclone
FRO Fording River Operations
GDP Gross domestic product
GHO Greenhills Operations
HMC Heavy media cyclone
IRR Internal rate of return
km Kilometer
LCO Line Creek Operations
M One million
Met Metallurgical coal
mm Millimeter
Mmtcc One million metric tonnes of clean coal
mtcc Metric tonnes of clean coal
MTM Mount Michael pit
NG Natural gas
NGO Non-government organization
xi
NPV Net present value
O/F Overflow
Op days Operating days
Q1 First quarter of the year
Ref Refuse
RTPH Raw coal tonnes per hour
SBC Screen bowl centrifuge
SWOT Strengths, weaknesses, opportunities and threat analysis
TPH Tonnes per hour
U/F Underflow
WOC Water only cyclone
WS 12 hour work shift

xii
Glossary
Anionic flocculant A chemical that aids in separating solids from water in a thickener
Appropriation requisition The process by which capital money spending is approved
Cable belt The physical equipment utilized to transport raw coal from the mining area to the Processing facility
Capital cost Money spent in order to improve or replace an asset in excess of routine repairs
Cationic flocculant A chemical that aids in separating solids from water in a thickener
Clarified water Water that is used in the metallurgical and thermal plant in order to separate the coal from the refuse
Coal recovery Percentage of in pit raw coal extracted from the seam compared to the predicted volume of coal to be extracted
Cape vessel A vessel that is too big to fit through the Panama Canal
Clean coal The final product of either the metallurgical or the thermal plant
Coal Business Unit The collection of all the mining operations in Teck that produce clean coal
Coarse circuit A collection of physical equipment that processes coal larger than 0.5 mm
Eagle coal A brand of coal that has a characteristic high volatile matter component
Electric arc furnace Equipment used in the process to manufacture steel
Fines circuit A collection of physical equipment that processes coal smaller than 0.5 mm
Fixed cost An operating cost that is fixed, regardless of the total clean coal produced
Froth crowder A physical piece of equipment that reduces the cross sectional area of the top of a flotation cell. The purpose is to force more material to the product discharge of the flotation cell
Greenfield operation A potential mining property which has not begun to be developed

xiii
Headings When a shovel is digging, the vertical plane is the heading
Heavy equipment Large equipment used in the mining process
Hydrophobic Repels water
Light vehicle A pick-up truck or other similar sized vehicle
Line stand The device which the pulleys on the cable belt are mounted to
Magnetite A solid that is mixed with water and is used in the coarse circuit to modify the final product quality
Metallurgical Plant A collection of equipment utilized to produce either metallurgical or thermal clean coal. Though it is primarily used to produce metallurgical coal
Mine life The duration of the operating mine under the current rates of production as outlined in the Life of Mine document for Line Creek. The current end of mine life is 2036
Operating cost Money spent in order to mine and process clean coal including items such as labour, repair parts, consumables, power and natural gas
Panamax vessel A vessel that is small enough so that it is able to travel through Panama Canal
Porter’s Five Forces Model An analysis used to determine the strategic environment
Raw coal Material that is used as input to either the metallurgical or the thermal plant
Refuse The waste product from either the metallurgical or the thermal plant
Standard coal A brand of coal that has a characteristic low volatile matter component
Thermal dryer A vessel that uses natural gas as a heat source to evaporate water from the clean coal
Thermal Plant A collection of equipment utilized to produce only thermal coal
Total moisture The summation of all the water present in the clean coal represented as a percentage
Unit cost The total cost per tonne of clean coal produced
Variable cost An operating cost that increases or decreases in proportion to the amount of clean coal produced

xiv
Executive Summary
There is an opportunity to decrease the unit operating costs of the Line Creek
Processing Facility, while increasing the throughput and maintaining product quality. The
current bottleneck for clean coal production at Line Creek is 3.5 million metric tonnes of
clean coal (Mmtcc) per year. An analysis of the metallurgical coal market yielded an
environment that is not attractive for new entrants into the Elk Valley. Two key
bottlenecks are identified and analyzed. The 4 Mmtcc bottleneck represents a need of
$4.5M in capital money in 2016. The second bottleneck at 5 Mmtcc requires $4.5M of
capital dollars in 2016 and $105.5M capital dollars in 2017. The NPV analysis showed a
BCR of 31.4 for the 4 Mmtcc scenario over a 10 year period and a BCR of 2.2 for the 5
Mmtcc scenario over the same period. This calculation assumed a static coal price of
$122 Cdn. Considering a period of coal selling price growth over the 10 year time frame,
the gap is similar with the BCR for the 4 Mmtcc scenario at 55.8 and the BCR for the 5
Mmtcc scenario at 5.1. For the success of this opportunity, there must be no acute or
cumulative negative effects to the environment or the communities of interest.
In conclusion, the recommendation of the analysis is to proceed with the
expansion of the Line Creek Processing Facility to an annual operating capacity of 4
Mmtcc. Line Creek can realize an increase in annual production, a decrease in total
operating unit costs, and an increase in the 10 year net present value of the operation
along with a strong benefit to capital cost ratio by upgrading the heavy media wash plant
circuit. The 4 Mmtcc option is represents the most stable low risk option to elevate the
value of the Line Creek Operation asset for Teck.
A full environment scan of the increase to 4 Mmtcc is required to ensure that
Teck maintains its social and environmental licence to operate in the Elk Valley.
1
Chapter 1. Introduction
There is an opportunity to decrease the unit operating costs of the Line Creek
Operations, while increasing the throughput and maintaining product quality. The current
bottleneck for clean coal production at Line Creek is 3.5 million metric tonnes of clean
coal (Mmtcc) per year. A combination of technical, infrastructure, logistics and market
conditions make up the existing production limit. An analysis using Porter’s
(Augmented) Five Forces Model yielded an industry that is not attractive for new
entrants. This further makes internal growth within the Teck Coal existing operations a
more executable strategy. A bottleneck analysis generated significant operating step
changes. The economic evaluation of the incremental step changes in production
yielded a clear path forward when production expansion is executed. Worldwide
demand and metallurgical coal price will be the driving force for future annual production
increases for Line Creek and Teck Coal.

2
Chapter 2. Line Creek Processing Plant Background
Raw Coal Processing
The raw coal processing begins at the mine truck dump. The raw coal is sized
down to minus 200 mm in the sizer. The raw coal is conveyed from the mine truck dump
to the breaker feed hoppers. Next, the raw coal is fed to either the thermal or the
metallurgical breaker. The material is screened with a scalping screen with 50 mm
openings. The oversize material enters the one of the rotary breakers, where the minus
50 mm material from the breaker mixes with the minus 50 mm material from the scalping
screens. The plus 50 mm material rejected from the breaker is discharged to the
breaker rejects rock pile. The post breaker raw coal is fed to one of the five raw coal
silos. Each silo has its own belt feeder to feed either the thermal plant or the
metallurgical plant.
Metallurgical Plant
Raw coal is fed to the metallurgical plant via the 4-way raw coal distributor. The
raw coal is distributed to four deslime screens. Clarified water is added to the screens to
aid the separation of coarse and fine raw coal.
Coarse Circuit
The oversize material generated from the deslime screens (plus 0.5 mm) is
discharged into two heavy media sumps. Magnetite and water are added to the sumps
to make up a prescribed specific gravity. The coal, magnetite and water slurry is
pumped to four heavy media cyclones. In the heavy media cyclones, gravity separates

3
the clean coal from refuse with the aid of the density of the slurry mixture. The clean
coal is fed to the four clean coal drain and rinse screens to dewater the coal and recover
the magnetite. Clarified water is used to wash the coal during this rinsing process. The
clean coal screens discharge the coal to two coarse coal centrifuges for mechanical
drying. Following the mechanical drying, the coal is fed to a fluidized bed dryer for the
final stage of drying. The refuse from the cyclones reports to two refuse drain and rinse
screens. The refuse screens have the same function as the clean coal screens. The
refuse is then transported to a refuse bin and loaded onto a haul truck for transportation
to the refuse dump.
Fines Circuit
The undersize material from the deslime screens (minus 0.5 mm) reports to the
primary fine coal sump and is pumped to 16 primary water only cyclones. The underflow
material is fed to six secondary water only cyclones. The underflow from the secondary
water only cyclones is fed to the high frequency screen for dewatering and is discharged
as refuse. The overflow of the secondary water only cyclones is used as a recycle
stream and is fed back to the 4-way distributor. The overflow material from the primary
water only cyclones is fed to the sieve bend sump and is then pumped to eight
classifying cyclones. The underflow material from the classifying cyclones reports to the
stack sizing screens where the ultra-fines are separated from the clean coal oversize.
The oversize portion is then fed to four fine coal centrifuges. The undersize from the
stack sizing screens is mixed with the overflow from the classifying cyclones and this
product is fed to the flotation conditioning tank. Flotation collector (Nalco 9899) is added
to the conditioning tank and then the slurry is pumped to the flotation feed distributor.
Frother (Nalco 021) is added to the flotation feed as the slurry enters the separation cell.
Air is added and the cells are agitated to produce bubbles. Hydrophobic coal, coated
with collector, attaches to the air bubbles and floats to the surface to form froth that flows
over the discharge lip of the cell and into a collection launder. This flotation concentrate
is dewatered in the fine coal centrifuges along with the oversize from the stack sizing
screens. The fine coal centrifuge cake is fed to a fluidized bed dryer for the final stage of
drying. The tailings material from the flotation cells is fed to the refuse thickener.
Anionic flocculant is added to the refuse thickener to accelerate the settling of the solids
4
and the resulting underflow is fed to the belt presses, where the material is dewatered.
The cake is then transported to a refuse bin and loaded onto a haul truck for
transportation to the refuse dump with the coarse circuit refuse.
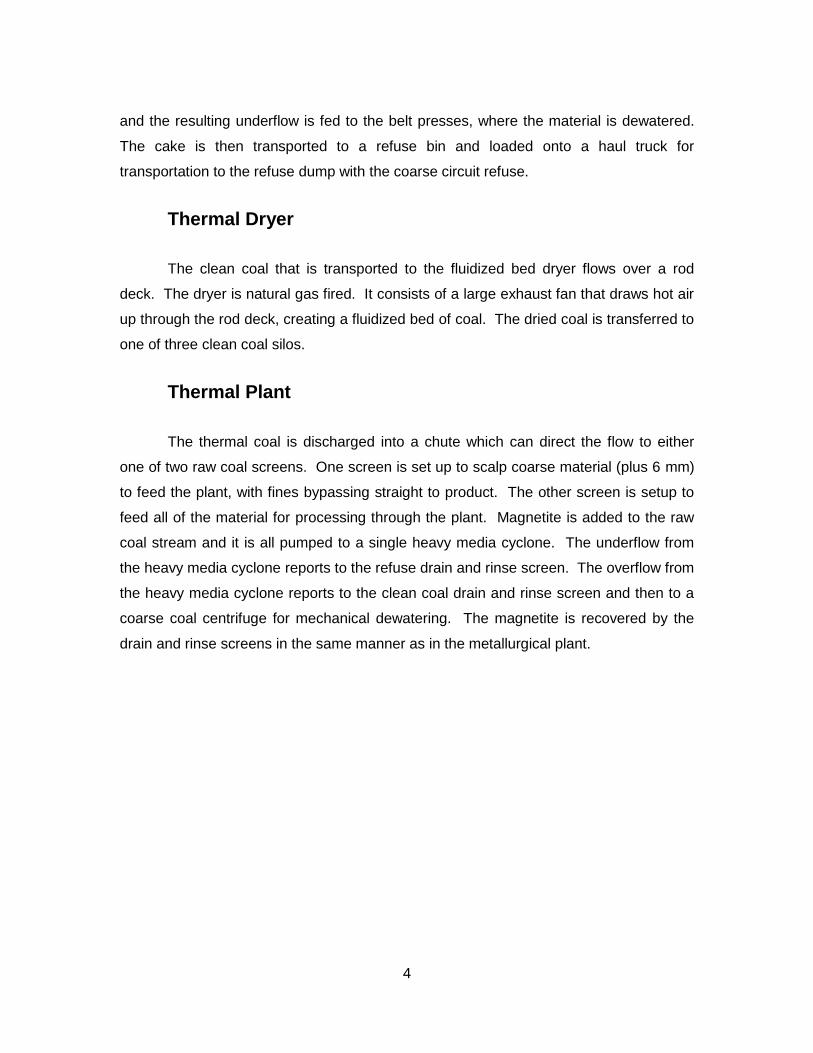
Thermal Dryer
The clean coal that is transported to the fluidized bed dryer flows over a rod
deck. The dryer is natural gas fired. It consists of a large exhaust fan that draws hot air
up through the rod deck, creating a fluidized bed of coal. The dried coal is transferred to
one of three clean coal silos.
Thermal Plant
The thermal coal is discharged into a chute which can direct the flow to either
one of two raw coal screens. One screen is set up to scalp coarse material (plus 6 mm)
to feed the plant, with fines bypassing straight to product. The other screen is setup to
feed all of the material for processing through the plant. Magnetite is added to the raw
coal stream and it is all pumped to a single heavy media cyclone. The underflow from
the heavy media cyclone reports to the refuse drain and rinse screen. The overflow from
the heavy media cyclone reports to the clean coal drain and rinse screen and then to a
coarse coal centrifuge for mechanical dewatering. The magnetite is recovered by the
drain and rinse screens in the same manner as in the metallurgical plant.

5
Conveyor #
21
Tra
nsfe
r
Sta
tion
Conveyor
# 0
1©
Au
g2
00
3 N
eil A
. McM
inn
Th
erm
al
Sca
lpin
g
Scre
en
Th
erm
al
Ro
tary
Bre
ake
r
© A
ug2
00
3 N
eil A
. McM
inn
54
32
1
Prim
ary
WO
C
feed ta
nk
Pum
ps #
45 &
#46
Prim
ary
WO
C
A &
Z B
anks
(16) 1
5"K
rebs
Secondary
WO
C
A &
Z B
anks
(6) 1
2"C
yclo
ne E
ng’g
Secondary
WO
C
feed ta
nk
Underflo
w
Overflo
w
Cla
ssify
ing C
yclo
nes
A &
Z B
anks
(8) 1
5"K
rebs
Sie
ve B
end
Sum
p
(Cla
ssify
ing
Cyclo
nes
feed ta
nk)
Overflo
w
Pum
ps #
49 &
#50
4 w
ay
Dis
tributo
r
Dry
er
Scru
bber
Retu
rn
Kero
sene O
verflo
w
Flo
tatio
n
Feed
Conditio
nin
g
Tank
Pum
ps #
71 &
#72
Underflo
w
Flo
tatio
n B
an
ks
(1) 6
x300ft 3
Wem
co
(2) 6
x300ft 3
Galig
her
5,4
00ft 3
tota
l vo
lum
eConcentra
te
Splitte
r Box
Cla
ssify
ing
Cyclo
nes
Overflo
w
Header
Secondary
WO
C U
nderflo
w
Colle
ctio
n B
ox
Flo
tatio
n
fee
d
Dis
tribu
tor
Hig
h F
requency
Scre
ens
Hig
h F
requency
Scre
en F
eed B
ox
Excess
Overflo
w
Overflo
w
Filte
r Pre
ss F
eed
box S
econdary
WO
C
Underflo
w C
olle
ctio
n
Launder
Efflu
ent
Pum
ps #
51 &
#52
Tailin
gs
De
-
Aera
tion
Tank
Tailin
gs T
hic
kenerC
onveyor #
8
Reje
ct
Bin
Centrifu
ge
Efflu
ent
tank
Pota
ble
warte
r
Catio
nic
concentra
te
Bulk
Sto
rage
Tank
Catio
nic
Flo
ccula
nt
mix
dru
m
Moyno P
um
p
x3 lin
es
Catio
nic
concentra
te
Hold
ing
Tank
Reje
ct
Pum
ps #
58
Dry
poly
mer
Flo
ccula
nt to
teM
Pota
ble
warte
r
Blo
wer
Anio
nic
floccula
nt
Bulk
Sto
rage
Tank
Pum
ps #
47 &
#48
Anio
nic
floccula
nt
Mix
Tank
Moyno P
um
p
x3 lin
es
Cle
an C
oal T
hic
kener
CC
Thic
kener
Cla
rified
Wate
r
Tank
Pum
p #
5P
um
p #
7
Pota
ble
warte
r
To T
herm
al p
lant
Pro
cess W
ate
r
Pum
p #
55
Pum
p #
59
Pota
ble
warte
r
TR
Thic
kener
Cla
rified
Wate
r
Tank
Dry
er
Pro
cess
Wate
r
Pum
p #
53 &
#54
Pum
p #
57 &
#60
Pond
Wate
r
Tank
Conveyor #
49
Magnetite
Mix
Sum
p
Fre
sh
Magnetite
(Invento
ry)
Magnetite
Scalp
ing
Scre
ens
Overs
ize
Magnetite
Thic
kener
Pum
p #
10
Overflo
w to
Flo
or L
aunder
Cla
rified
Overflo
w
Recirc
ula
tion
Magnetite
Catc
h S
um
p
Dum
p D
rain
Density
mete
rP
um
p #
8 &
#9
Pota
ble
warte
r
Overflo
w
Overd
ense
Splitte
r
Box
Magnetite
Div
erte
r
box
Therm
al
Heavy M
edia
Tank
Heavy
Media
Sum
p (2
)
Pota
ble
warte
r
Concentra
te
Magnetite
Separa
tor (4
)
Sta
ng B
ox (2
)
HM
Cyclo
nes (4
) 26" K
rebs
HM
Cle
an
Sie
ve B
en
ds
0.7
5 m
m o
pen
'gs
HM
Cle
an
D&
R S
cre
en
s
(4) 8
x16. 0
.50 m
m o
pen
'gs
Cle
an
Co
al C
entrifu
ges
(2) W
em
co
1300
Vib
ratin
g B
asket-typ
eD
ilute
Tank
Magnetite
Separa
tors
Dis
tributio
n
Box
12
3
natu
ral
gas
Dry
er
Scru
bber
Dry
er
Cyclo
nes
(2) 8
' dia
to a
tm
Dry
er
Scru
bber
Retu
rn
Underflo
w
Tailin
gs
LEGEN
D:R
aw C
oal
Magn
etite
Cle
an C
oal
Floccu
lant
Re
ject
Pro
cess W
ater
Op
tion
al Flow
L
in
e C
re
ek
O
pe
ra
tio
ns
Me
ta
llu
rg
ic
al C
oa
l P
re
pa
ra
tio
n P
la
nt F
lo
wsh
ee
t
Raw
Coal B
lendin
g
(1) A
pro
n F
eed
er
Size
r(1
) MM
D S
625
Conveyor #
41
Raw
Coal S
ilos
(5) 5
,000 to
nnes e
ach
25
,000 to
nnes to
tal
Deslim
eS
ieve Ben
ds
1.00 mm
op
en'g
s
Deslim
e S
cre
ens
(4) 8
x16, 0
.50 m
m o
pen
'gs
HM
Refu
se D
&R
Banana S
cre
ens
(2) 8
x20
, 0.5
0 m
m o
pen'g
s
1 W
ay
Fro
ther
Scre
en
Bo
wl C
entrifug
es (4
) 44"x
132"
Bird
SB
6400
Pum
ps #
03 &
#04
Mag. T
hic
k.
Cla
rified
wate
r tank
Pum
p #
11
Pum
ps #
41 &
#42
Pum
ps #
43 &
#44
Pum
ps #
30
Settlin
g
Ponds
Conveyor
# 0
3
Conveyor
# 9
1
Conveyor
# 9
0
Pla
nt T
ruck D
um
p
Sta
tion
Conveyor # 92
Outs
ide R
aw
Coal S
tacker
Bre
akers
Reje
cts
Conveyor #
02
Conveyor #
42
Conveyor #
43
Conveyor #
04
Conveyor
# 2
3
Conveyor #
70
Conveyor #
44
Conveyor
# 4
7C
onveyor
# 4
6
Conveyor
# 4
5
Conveyor
# 2
2
Co
nve
yo
r
# 5
Conveyor
# 0
6
Conveyor #
48
Conveyor #
50
Met.
Sam
ple
Tow
er
Conveyor #
51
(3) R
ail L
oadout S
ilos
13,5
00 to
nnes e
ach
40,5
00 to
nnes to
tal
Conveyor
# 5
2C
onveyor
# 5
3
Conveyor
# 2
4
Load O
ut
Sta
tion
Recla
im C
onveyor b
elt
Conveyor
# 2
0
Mc
Na
lly
Me
t Ro
tary
Bre
ak
er
10x
20
, 75h
p
-P
ittsb
urg
h
Conveyor #
07
Tra
nsfe
r Sta
tion
Tow
er
to T
he
rma
l Pla
nt
Tailin
gs
Date
:March
2009 A
pp
roved:
By: Erika H
ernan
dez
Figure 2-1 Process Flow Diagram for Line Creek Plant
6
Chapter 3. Coal Business Unit Industry Analysis
Industry Definition
Industry Boundaries and Characteristics
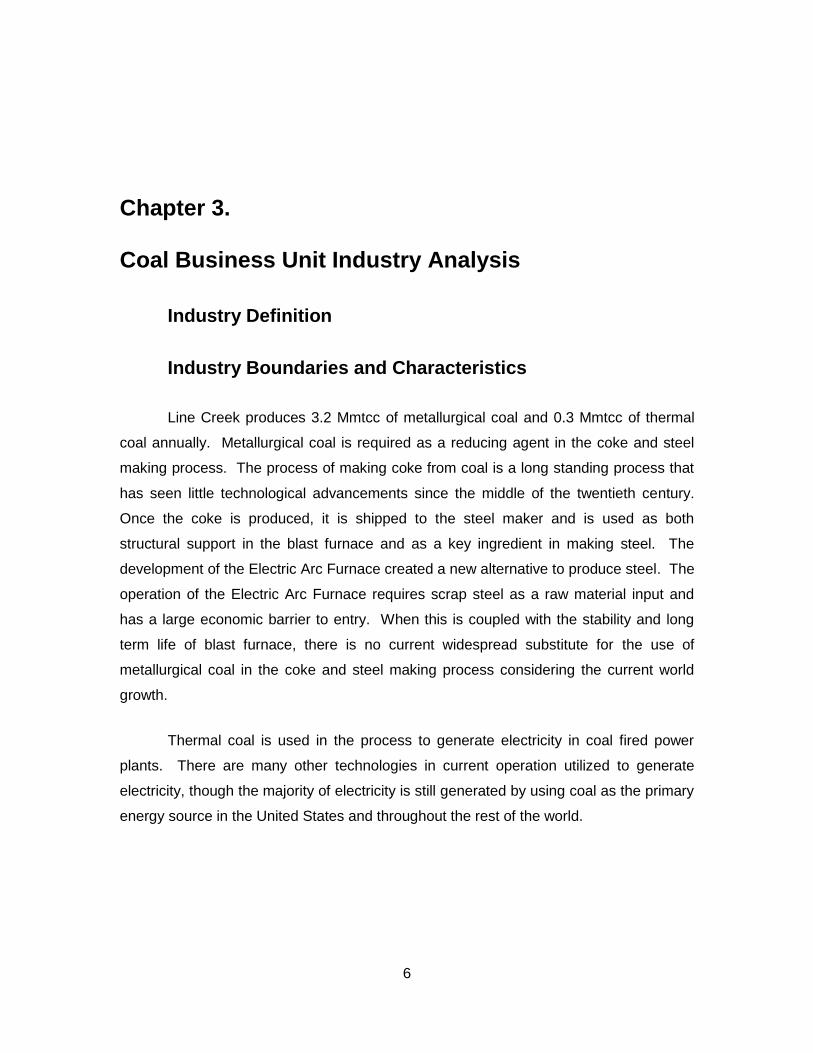
Line Creek produces 3.2 Mmtcc of metallurgical coal and 0.3 Mmtcc of thermal
coal annually. Metallurgical coal is required as a reducing agent in the coke and steel
making process. The process of making coke from coal is a long standing process that
has seen little technological advancements since the middle of the twentieth century.
Once the coke is produced, it is shipped to the steel maker and is used as both
structural support in the blast furnace and as a key ingredient in making steel. The
development of the Electric Arc Furnace created a new alternative to produce steel. The
operation of the Electric Arc Furnace requires scrap steel as a raw material input and
has a large economic barrier to entry. When this is coupled with the stability and long
term life of blast furnace, there is no current widespread substitute for the use of
metallurgical coal in the coke and steel making process considering the current world
growth.
Thermal coal is used in the process to generate electricity in coal fired power
plants. There are many other technologies in current operation utilized to generate
electricity, though the majority of electricity is still generated by using coal as the primary
energy source in the United States and throughout the rest of the world.

7
Figure 3-1 Primary Fuel Sources for Electricity in US 2009
Source:http://center.sustainability.duke.edu/resources/green-facts-consumers/what-
largest-fuel-source-electricity-united-states
Both metallurgical and thermal coal demand will remain as these products are
required in the coke and steel making process as well as the electricity generation
process. Line Creek sells its coal to a diverse group of customers located worldwide,
who utilize our product for the same purpose. However, our customers do have the
option to purchase metallurgical and thermal coals from other manufacturers.
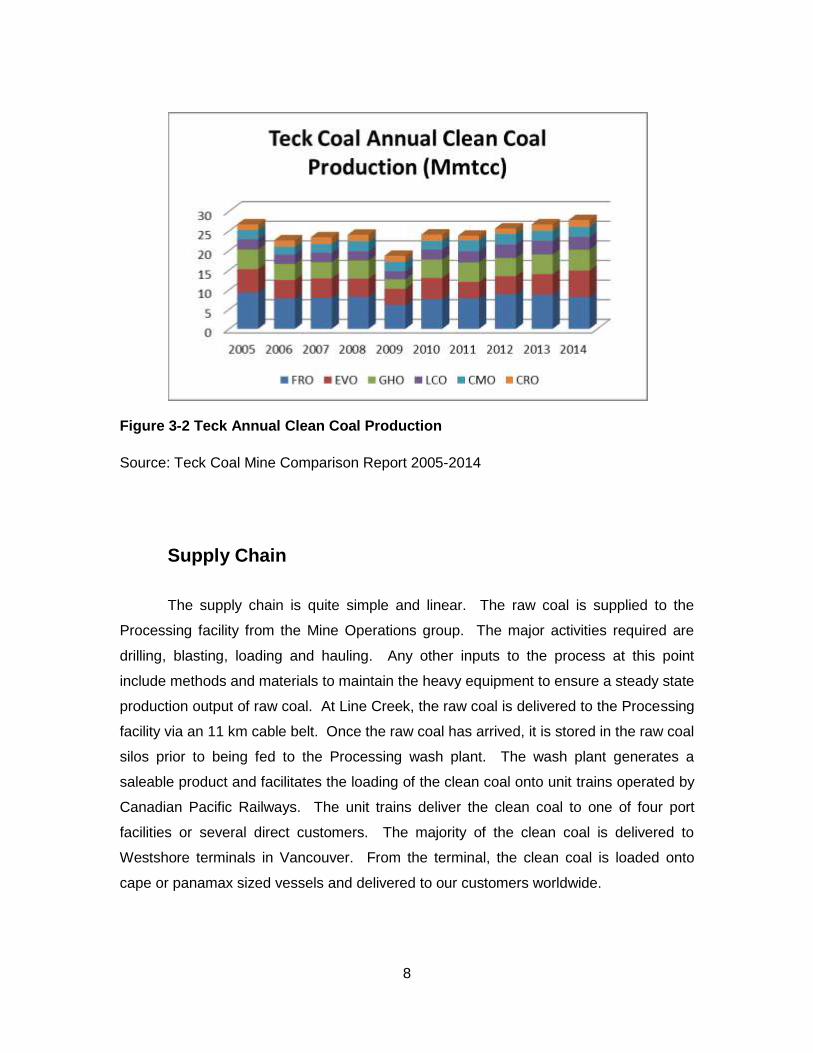
The geographical region of competitors within Canada is dominated by Teck
Coal. The majority of the coal deposits in Canada are located in Saskatchewan, Alberta
and British Columbia. Of all the operating coal mines in Canada, Teck Coal operates six
and produces 25 to 27 Mmtcc annually. Teck Coal’s competition lies largely with BHP
and the coal mines operating in Australia.
8
Figure 3-2 Teck Annual Clean Coal Production
Source: Teck Coal Mine Comparison Report 2005-2014
Supply Chain
The supply chain is quite simple and linear. The raw coal is supplied to the
Processing facility from the Mine Operations group. The major activities required are
drilling, blasting, loading and hauling. Any other inputs to the process at this point
include methods and materials to maintain the heavy equipment to ensure a steady state
production output of raw coal. At Line Creek, the raw coal is delivered to the Processing
facility via an 11 km cable belt. Once the raw coal has arrived, it is stored in the raw coal
silos prior to being fed to the Processing wash plant. The wash plant generates a
saleable product and facilitates the loading of the clean coal onto unit trains operated by
Canadian Pacific Railways. The unit trains deliver the clean coal to one of four port
facilities or several direct customers. The majority of the clean coal is delivered to
Westshore terminals in Vancouver. From the terminal, the clean coal is loaded onto
cape or panamax sized vessels and delivered to our customers worldwide.

9
Industry Dynamics
Porter’s (Augmented) Five Forces
The overall analysis of Porter’s (Augmented) Five Forces from the perspective of
Line Creek and Teck Coal generates an industry that is not attractive for new entrants
into the industry.
Figure 3-3 Porter's (Augmented) Five Forces Analysis
Source: Porter, Michael E., The Five Competitive Forces That Shape Strategy

10
Degree of Rivalry
Given that all six of the industry competitors in the Western Canadian
metallurgical coal market operate for Teck Coal, there is no impactful rivalry. The six
coal mines operate with one collective customer base and fulfill contract orders in a
united manner. The current strategy is to grow the market share of the Teck Coal
Business unit as a whole, not cannibalize the internal participants. Outside of the Elk
Valley in the world seaborne metallurgical coal market, there is significant competition.
The current market war is a clear example of this rivalry. The strategy for BHP is to
continue over production of metallurgical coal compared to the demand of this product.
The result of this strategy is shrinking margins. This effect coupled with the US dollar
exchange rate adds great pressure to Teck to be efficient and cost effective in all its
Coal Business Unit Operations.
Barriers to Entry
There are several barriers to enter into the coal market in Western Canada.
There is a barrier related to the economy of scale. Firstly, the geological nature of the
metallurgical coal industry dictates that the source of the commodity is limited. In
addition, Teck owns the mining rights for the area in the Elk Valley, which is the physical
location of the input for the final product. Secondly, it would require significant capital
monies to begin a greenfield operation. This in effect has eliminated the ability of small
or medium sized mining companies to directly compete for market share in the industry,
and limited the large established mining companies. Thirdly, there is a greater
requirement for permitting and water qualities related to the mining function. This
change has been fully seen when Line Creek went through the process of permitting a
new mining area, Phase II.
There is a barrier to accessing the supply chain flow of the commodity. The
infrastructure to transport the clean metallurgical coal is limited. There is one main line
that services the Elk Valley, and it currently transports 24 to 25 Mmtcc to the west coast

11
of Canada annually. Canadian Pacific Railway operates as a monopoly service provider
for Teck Coal and this would also be the case for any new entrant to the industry. Again,
this acts as an increased cost versus other mining options worldwide for a new entrant.
There is a barrier to entry related to government policy. New Provincial and
Federal regulations have been implemented and this has created a large first hurdle for
an aspiring corporation to set up an operation in Western Canada. A new and more
environmentally protective process has been established in order to ensure mining in a
socially responsible manner. This has resulted in a long application process involving all
the associated stakeholders and their commitments to the mining process. Dedicated
funding for reclamation is a significant change with the new expectations and will deter
any new entrants into the industry. With respect to the water quality needs in the permit
application, this would consider constituents of concern, biodiversity, First Nations,
deleterious substances, fish habitat and conservation. At Line Creek, the process was
five years from start to finish and provided great detail in the aforementioned areas in
order to begin mining in Phase II. Overall, there is a significant barrier to entry for new
participants into the metallurgical coal industry in Western Canada
Substitutes
There are no substitutes for metallurgical coal. The vast majority of iron
production is through blast furnace technology. Metallurgical coal is required as a
reducing agent in the coke and blast furnace steel making process. Iron making is a
well-established process that has been evaluated for alternatives for quite some time.
There are several alternatives, though none have currently usurped blast furnace
technology as the primary method to produce iron. Even in times of high coal prices,
these alternative technologies have yet to be fully developed or implemented.

12
Buyer
There are many buyers for coal worldwide. Metallurgical coal prices are set on a
quarterly basis and these contract prices are set based on the baseline spot prices for
the major brands of metallurgical coal. Since the buyers of metallurgical coal have
limited choices to purchase, and the producers also have limited choices, a situational
parasitic relationship exists. This is dependent on the current economic conditions of
supply and demand. New entrants into the industry would increase the supply side of
the equation and the price would drop accordingly. This acts as another positive facet
for Line Creek and Teck Coal.
Supplier
The labour market in the Elk Valley is relatively stable. There have been very
few work disruptions in the history of the operations. The area attracts individuals who
seek a stable and consistent environment for work and family. This would act to make it
attractive for new entrants into the industry.
A considerable input to the mining process is the heavy equipment utilized to
generate the raw coal for processing betterment. There are several choices for
equipment, thought the majority of all trucks are supplied by one of two manufacturers.
The supplier has the option to maintain its revenue by distributing its product to
numerous other mining companies outside of the metallurgical coal mining industry.
This would act to make it unattractive for new entrants into the industry.
This force is less important than other forces in the analysis, though overall it
would be relatively neutral in comparison.

13
Gap Analysis
The objective of any publicly traded company is to create shareholder value. The
opportunity that presents itself for Line Creek and Teck Coal is to increase the annual
output of saleable metallurgical clean coal. And as a result decrease the unit costs for
the Line Creek Operation and the shareholder value will be improved by an increase in
the unit cost margin for Line Creek and Teck Coal. The decrease of the unit operating
cost at Line Creek is what is directly in the control of the site employees, and is the
mechanism by which shareholder value is increased. Line Creek currently operates
three separate product streams that run in parallel. Two of which generally produce
metallurgical coal. The third footprint is solely dedicated to produce thermal coal. By
adding to the existing capacity of the two metallurgical streams, an increase in
metallurgical coal production will be realized with little increase to the total operating
costs. The total production which Teck Coal has achieved is currently at a ten year high
and has consistently increased over the last three years up to 27.8 Mmtcc in 2014.
For the purposes of analyzing the opportunity by the way of increasing the Line
Creek production, the subsequent totals for Teck Coal production achievable would
increase. For the purpose of this analysis, the assumption is that the Line Creek Mine
Operations department can supply the addition coal required, an increase matching the
increase of the clean coal output of 21% for the 4 Mmtcc scenario and 51% for the 5
Mmtcc scenario.
Table 3-1 Teck Coal Annual Production
Annual Production - MTCC LCO Total
2012 3,415,797 25,584,394
2013 3,426,156 26,636,935
2014 3,271,073 27,755,445
Source: Teck Coal Mine Comparison Report 2012-2014

14
Table 3-2 Teck Coal Adjusted Annual Production with Line Creek at 4 Mmtcc
Annual Production - MTCC (4Mmtcc) LCO Total
2012 4,000,000 26,168,597
2013 4,000,000 27,210,779
2014 4,000,000 28,484,372
Source: Teck Coal Mine Comparison Report 2012-2014
Table 3-3 Teck Coal Adjusted Annual Production with Line Creek at 5 Mmtcc
Annual Production - MTCC (5Mmtcc) LCO Total
2012 5,000,000 27,168,597
2013 5,000,000 28,210,779
2014 5,000,000 29,484,372
Source: Teck Coal Mine Comparison Report 2012-2014
As expected, the productivities of metric tonnes of clean coal per work shift
increased in both scenarios and are more in line with the other coal processing facilities
within Teck Coal. As a result of producing additional saleable coal, the generation of
additional refuse material is inevitable. A need is now created to transport the additional
material to the refuse dump. This would result in the need for two additional persons to
complete this task. The added work shift hours are reflected in the adjusted
productivities for Line Creek in both adjusted scenarios.

15
Table 3-4 Teck Coal Process Plant Productivities
Productivity - MTCC/WS FRO EVO GHO LCO CMO CRO
2012 30 18 31 27 34 12
2013 30 21 34 28 33 16
2014 27 27 35 24 34 20
Source: Teck Coal Mine Comparison Report 2012-2014
Table 3-5 Teck Coal Adjusted Process Plant Productivities with Line Creek at 4 Mmtcc
Productivity - MTCC/WS (4Mmtcc) FRO EVO GHO LCO CMO CRO
2012 30 18 31 31 34 12
2013 30 21 34 32 33 16
2014 27 27 35 29 34 20
Source: Teck Coal Mine Comparison Report 2012-2014
Table 3-6 Teck Coal Adjusted Process Plant Productivities with Line Creek at 5 Mmtcc
Productivity - MTCC/WS (5Mmtcc) FRO EVO GHO LCO CMO CRO
2012 30 18 31 38 34 12
2013 30 21 34 39 33 16
2014 27 27 35 35 34 20
Source: Teck Coal Mine Comparison Report 2012-2014
The percentage of total dollars spending of Line Creek in relation to Teck Coal
total dollars spending will increase. For the purposes of the analysis, a value of 20%
fixed costs was used for the Processing department and a value of 60% fixed costs was

16
used for the rest of Line Creek Operations. The remaining portion of the total costs are
variable and will increase accordingly as the production output increases in each case.
Table 3-7 Line Creek Percent of Total Spending for Teck Coal
% of Total Spending LCO
2012 8.9%
2013 14.1%
2014 12.2%
Source: Teck Coal Mine Comparison Report 2012-2014
Table 3-8 Line Creek Adjusted Percent of Total Spending with Line Creek at 4 Mmtcc for Teck Coal
% of Total Spending (4Mmtcc) LCO
2012 9.7%
2013 15.1%
2014 13.4%
Source: Teck Coal Mine Comparison Report 2012-2014
Table 3-9 Line Creek Adjusted Percent of Total Spending with Line Creek at 5 Mmtcc for Teck Coal
% of Total Spending (5Mmtcc) LCO
2012 10.9%
2013 16.8%
2014 14.9%
Source: Teck Coal Mine Comparison Report 2012-2014
17
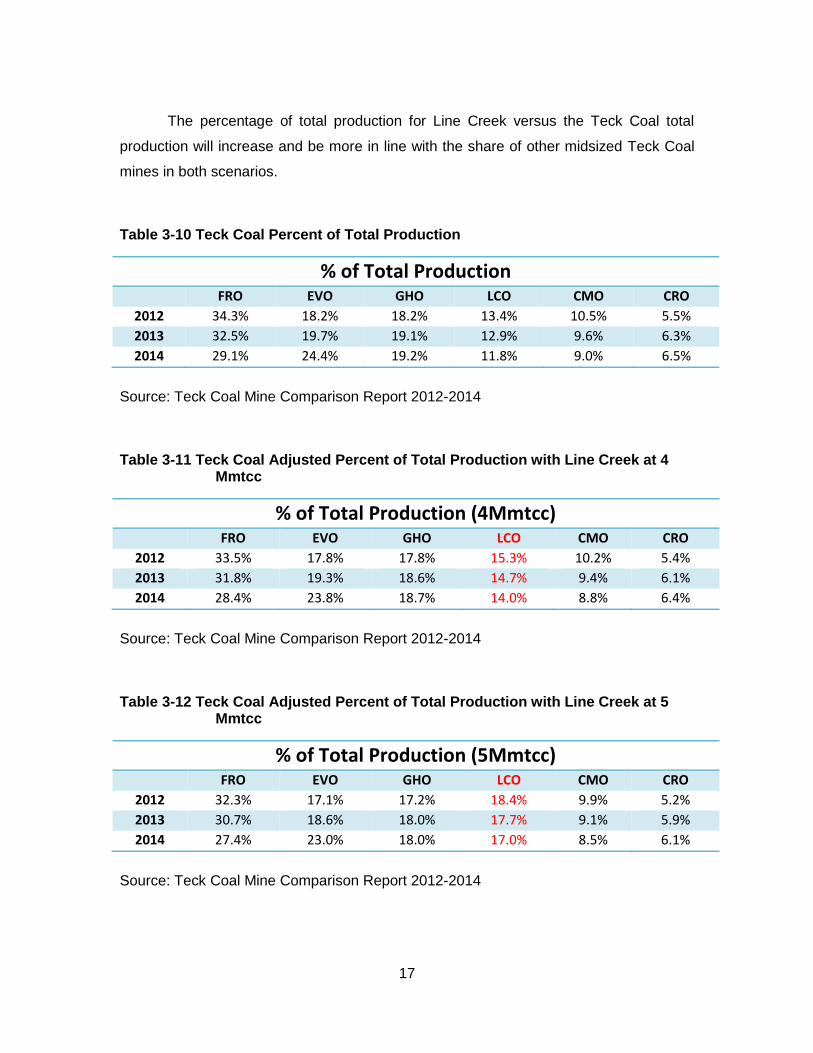
The percentage of total production for Line Creek versus the Teck Coal total
production will increase and be more in line with the share of other midsized Teck Coal
mines in both scenarios.
Table 3-10 Teck Coal Percent of Total Production
% of Total Production FRO EVO GHO LCO CMO CRO
2012 34.3% 18.2% 18.2% 13.4% 10.5% 5.5%
2013 32.5% 19.7% 19.1% 12.9% 9.6% 6.3%
2014 29.1% 24.4% 19.2% 11.8% 9.0% 6.5%
Source: Teck Coal Mine Comparison Report 2012-2014
Table 3-11 Teck Coal Adjusted Percent of Total Production with Line Creek at 4 Mmtcc
% of Total Production (4Mmtcc) FRO EVO GHO LCO CMO CRO
2012 33.5% 17.8% 17.8% 15.3% 10.2% 5.4%
2013 31.8% 19.3% 18.6% 14.7% 9.4% 6.1%
2014 28.4% 23.8% 18.7% 14.0% 8.8% 6.4%
Source: Teck Coal Mine Comparison Report 2012-2014
Table 3-12 Teck Coal Adjusted Percent of Total Production with Line Creek at 5 Mmtcc
% of Total Production (5Mmtcc) FRO EVO GHO LCO CMO CRO
2012 32.3% 17.1% 17.2% 18.4% 9.9% 5.2%
2013 30.7% 18.6% 18.0% 17.7% 9.1% 5.9%
2014 27.4% 23.0% 18.0% 17.0% 8.5% 6.1%
Source: Teck Coal Mine Comparison Report 2012-2014

18
A ratio of the percent of total spending and the percent of total production shows
that following an increase to 4 Mmtcc, Line Creek is spending less than would be
expected compared to the production output. This final ratio is indicative of a relative
decrease in operating costs and the ability to successfully increase the unit cost margin
compared to Teck Coal operations with similar production outputs. This metric highlights
the opportunity for Line Creek to produce more clean coal at a spending efficiency that is
comparable to other Teck Coal mines that have been at this annual saleable clean coal
output for over 10 years. Furthermore, when the adjusted production for Line Creek is
increased up to 5 Mmtcc, only CMO betters Line Creek in the spending share and
production share ratio.
Table 3-13 Teck Coal Ratio of Percent of Total Spending and Percent of Total Production
Cost Ratio of % of Total Spending and Production FRO EVO GHO LCO CMO CRO
2012 0.90 1.22 0.95 0.67 0.82 2.20
2013 0.94 1.08 0.85 1.10 0.71 1.76
2014 1.14 0.92 0.91 1.03 0.61 1.41
Source: Teck Coal Mine Comparison Report 2012-2014
Table 3-14 Teck Coal Adjusted Ratio of Percent of Total Spending and Percent of Total Production with Line Creek at 4 Mmtcc
Cost Ratio of % of Total Spending and Production (4Mmtcc) FRO EVO GHO LCO CMO CRO
2012 0.91 1.24 0.97 0.63 0.84 2.23
2013 0.95 1.09 0.86 1.03 0.72 1.77
2014 1.15 0.93 0.93 0.95 0.66 1.42
Source: Teck Coal Mine Comparison Report 2012-2014

19
Table 3-15 Teck Coal Adjusted Ratio of Percent of Total Spending and Percent of Total Production with Line Creek at 5 Mmtcc
Cost Ratio of % of Total Spending and Production (5Mmtcc) FRO EVO GHO LCO CMO CRO
2012 0.93 1.27 0.99 0.59 0.86 2.29
2013 0.96 1.11 0.87 0.95 0.73 1.80
2014 1.17 0.95 0.94 0.88 0.63 1.45
Source: Teck Coal Mine Comparison Report 2012-2014
Line Creek can realize an increase in annual production and a decrease in unit
costs by increasing the capacity of the metallurgical plant. In order for this transition to
be successful, there are several conditions that must be met.
By increasing the production of Line Creek, no other Teck Coal operation may
suffer a loss of production. Losses of production typically result for two reasons that are
affected by the other operations: either the additional metallurgical coal production
cannot be sold to a customer, or the additional metallurgical coal production cannot be
transported to the port facilities in a timely manner, which would effectively decrease the
total annual production. Not only does the total amount need to be delivered to the port,
but it also needs to be transported in a steady state flow in order to not disrupt the Teck
Coal production schedules.
Additional capital costs would be required for both the Mine Operations
requirements to generate raw coal at a greater rate and for the Processing facility to add
capacity to produce metallurgical coal using the existing infrastructure. These details
are explored in Chapter 4, Bottleneck Analysis.
Lastly and paramount to the success of the opportunity, by increasing the
production at Line Creek, there must be no acute or cumulative negative effects to the
environment or the communities of interest. The details of these items are outlined in
Chapter 6, Other Impacts on Line Creek Capacity Increases. Teck Coal operates with
core values that include the aforementioned topics.

20
Chapter 4. Bottleneck Analysis
Following a high mark in plant feed rate from 2012, the current and forecasted
plant feed rate is depressed in comparison. This is as a result of the increased need to
run thermal coal through our metallurgical processing plant. This need exists in order to
continue the steady state delivery of raw coal to the Processing Plant, originated by the
existing Mine Operations limitations in production. The short term focus will be on
optimizing our existing process to maximize the coal recovery. The long term
opportunity will be to incorporate further improvements to the current coarse circuit, fine
coal circuit, dryer circuit and the cable belt.
Two natural bottlenecks surface from the equipment capacity calculations. The
two bottlenecks are an annual production output of 4 Mmtcc and 5 Mmtcc.
4.0 Million mtcc Bottleneck
A major limitation to Line Creek is the 11 km cable belt. The cable belt is the life
line between the Mine Operations and the Processing Plant. The cable belt limits the
amount of saleable clean coal Line Creek can produce annually. Table 4.1 below
illustrates the capacity limitation of the cable belt and yields the first scenario to be
analyzed of an annual saleable clean coal production from Line Creek of 4 Mmtcc. The
calculation below assumes that the production ratio of standard coal (831) and eagle
coal (835) is 1:1 for future operating years. The annual thermal coal production is also
constant at 300,000 mtcc. Although the thermal production does not affect the
metallurgical plant, it does require cable belt operating time to maintain a thermal plant
feed inventory. The availability of the cable belt, the tonnes per hour, operating days,

21
yield by product and the breaker rejects value represents a historical level of sustainable
achievement for all metrics.
Table 4-1 Base Case Cable Belt Capacity
Base Case Cable Belt Capacity Product 831 835 Total
TPH 925 925
Availability 90% 90%
Op Days 165 165
Breaker Reject 6% 6%
Yield 71.8% 76.7%
Total Raw Tonnes 2,711,500 2,711,500 5,423,000
833 Raw Tonnes 428,500
Met Raw Tonnes 4,994,500
833 Clean Tonnes 300,000
Met Clean Tonnes 1,793,000 1,915,500 3,708,500
Total Clean Tonnes 4,008,500
In order to overcome the current 3.5 Mmtcc bottleneck in the Line Creek
Processing Plant, a 50% increase in capacity is required in the coarse circuit only. This
can be done by upgrading the deslime screens, adding two heavy media cyclones and
upgrading the associated heavy media pumps, sumps and piping. The new clean
tonnes per hour capacity and total capacity are illustrated below in Table 4-2. As shown
the new capacity exceeds the current cable belt capacity. Following the upgrade to the
coarse circuit, the new Processing bottleneck is the cable belt. In addition to the newly
created cable belt bottleneck, the pre-existing capacity issues of the fines circuit and the
dryer would begin to be operational issues when 4 Mmtcc annual production is
exceeded. The control of the total moisture for the saleable product is controllable in the
8.0-8.5% range when the clean coal tonnes per hour rate is at 550 ctph. This matches
the calculated scenario below. This calculation assumes that the fine circuit capacity
remains unchanged. Given the increase in the total feed rate and the assumption that
the coarse fraction of both standard (831) and eagle (835) coals remains constant

22
throughout the mine life, there will also be additional fine coal fed to the plant. The
ability to process the fine coal will hinge on the current flexibility in the process to either
keep the fine coal as product or transport the incremental fine coal to the refuse dump.
Table 4-2 Plant 4 Mmtcc Capacity
Plant 4 Mmtcc Capacity Product 831 835 Total
Coarse Amount 75% 70%
Current RTPH 662 528 595
Availability 92% 92%
Op Days 165 165 330
Current CTPH 437 373 405
Yield 71.8% 76.7%
New RTPH 910 713 812
New CTPH 601 503 552
833 Clean Tonnes 300,000
Met Clean Tonnes 2,381,000 1,991,500 4,372,500
Total Clean Tonnes 4,672,500
The 4 Mmtcc ceiling dictated by the existing cable belt infrastructure is one of
several limitations that must be overcome in order to produce more saleable clean coal
at Line Creek. For the purposes of this analysis, two fundamental boundary conditions
will be adhered to. The construction of additional building infrastructures will be avoided
as there currently exists ample floor space for equipment capacity increases. Secondly,
Line Creek possesses the most length of conveyors in the Teck Coal Business Unit.
The conveyor system is unique and complex, and already requires many hours to
maintain in good operating condition. The premise of decreasing the unit costs of the
operation would not be maintained if an additional conveyor maintenance burden was
added.

23
5.0 Million mtcc Bottleneck
Given the boundary conditions for the expansion, no additional building
infrastructure, the result is a second bottleneck capacity ceiling of 5 Mmtcc. The
calculation for the capacity increase to 5 Mmtcc is based on a 50% capacity increase in
the coarse and fine coal equipment. This can be done while maintaining the current
building and conveyor infrastructure at Line Creek. Table 4-3 displays the details under
similar assumptions as the cable belt capacity calculation. One notable difference is the
historic availability of the metallurgical processing plant is higher than that of the cable
belt. Also, the coarse to fine percentage varies by metallurgical product. This value is
75% coarse for standard coals and 70% coarse for eagle coals.
Table 4-3 Plant 5 Mmtcc Capacity
Plant 5 Mmtcc Capacity Product 831 835 Total
Coarse Amount 75% 70%
Current RTPH 662 528 595
Availability 92% 92%
Op Days 165 165 330
Current CTPH 437 373 405
Yield 71.8% 76.7%
New RTPH 993 792 893
New CTPH 656 559 607
833 Clean Tonnes 300,000
Met Clean Tonnes 2,597,500 2,213,000 4,810,500
Total Clean Tonnes 5,110,500
In order to achieve the 5 Mmtcc scenario, both the fine coal circuit and the
coarse coal circuit capacities must be increased by 50%. In addition, the existing drying
circuit will not successfully control the total moisture of the saleable product to the level
in the 4 Mmtcc scenario. Lastly, the system to deliver raw coal to the Processing Plant
must be upgraded.

24
The method by which to increase the fine coal circuit capacity by 50% is by
adding eight WOC’s, four FCC’s and all four conveyors on the clean coal side. The
clean coal conveyors are able to handle the average capacity of 550 ctph in the 4 Mmtcc
scenario, but not the average capacity of 600 ctph in the 5 Mmtcc scenario. The four
clean coal conveyors can be sped up by the 10% in order to accommodate the
additional load. This can be accomplished by an increase in the motor size for each
conveyor. In addition, work would be considered to increase the flowability to the
discharge and feed chutes in order to effectively transfer the coal from conveyor to
conveyor with minimum spillage. The existing flotation cells have the capacity to handle
the increase in the fine coal circuit. The froth crowders would be removed to maintain
the flotation cell retention time within the acceptable operating range for efficiency. The
increase will also cause a larger amount of material to flow through other unit operations.
The refuse thickener and clean coal thickener will experience changes in the daily
operating conditions. These changes in the thickener tanks can be managed with the
modification of settling agents like anionic and cationic flocculants. There is a need to
increase the pumps that output solids from both settling thickeners. The solids
generated will increase on the clean and refuse streams. The refuse solids can be
handled by the existing three belt press filters, as currently, one belt press filter is an on-
line spare. The belt press filter feed tank will need to be upsized to handle the additional
load. The increase in the fine clean coal will require upgrades to the drying circuit.
In order to continue to produce saleable clean coal to a total moisture of 8.0-
8.5%, a drying circuit upgrade all four screen bowl centrifuges is required. The existing
screen bowl centrifuges employs technology that is 30 years old. New, larger and more
efficient screen bowl centrifuges can be obtained that would allow the 5 Mmtcc capacity
plant to maintain the 8.0-8.5% total moisture. The distribution of material to the screen
bowl centrifuges would also be modified to allow the increase in flow. The last upgrade
required is the method by which to deliver the raw coal to the plant itself.
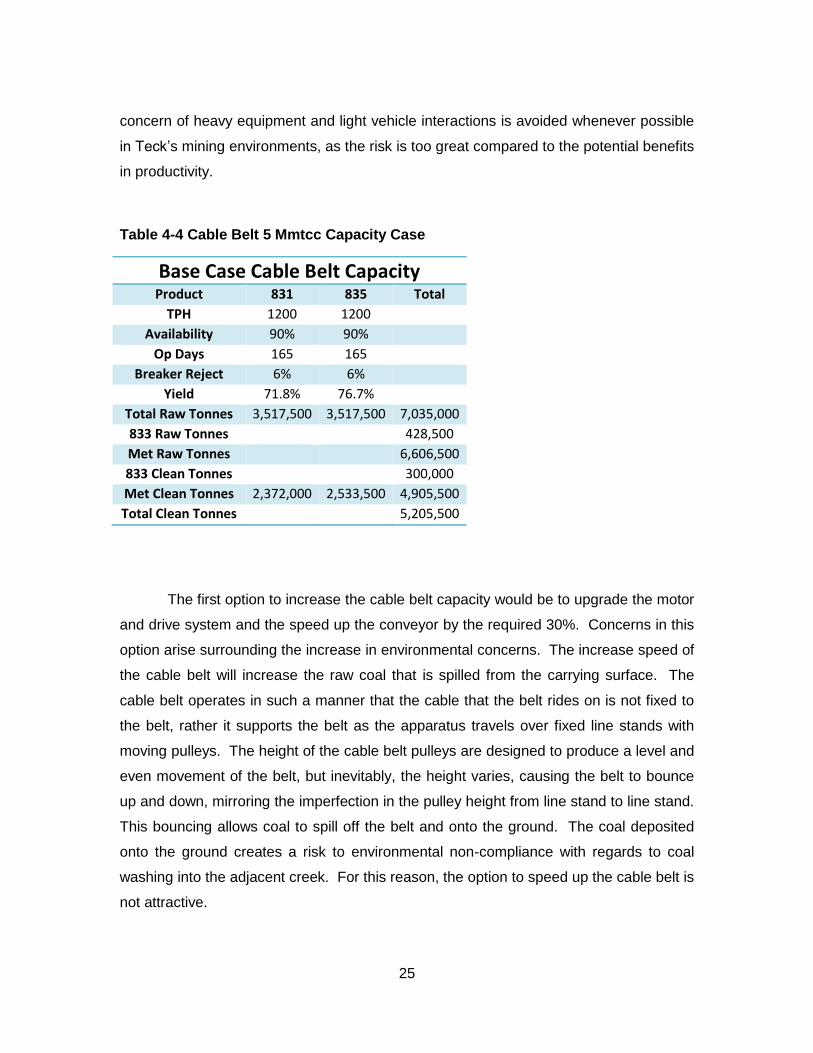
An increase of 30% is required to the capacity of the raw coal delivery system to
accommodate the 5 Mmtcc scenario, as displayed in Table 4-4. This can be
accomplished in several ways. For the purpose of this analysis, utilizing heavy
equipment will not be considered as it would introduce a significant concern. A safety
25
concern of heavy equipment and light vehicle interactions is avoided whenever possible
in Teck’s mining environments, as the risk is too great compared to the potential benefits
in productivity.
Table 4-4 Cable Belt 5 Mmtcc Capacity Case
Base Case Cable Belt Capacity Product 831 835 Total
TPH 1200 1200
Availability 90% 90%
Op Days 165 165
Breaker Reject 6% 6%
Yield 71.8% 76.7%
Total Raw Tonnes 3,517,500 3,517,500 7,035,000
833 Raw Tonnes 428,500
Met Raw Tonnes 6,606,500
833 Clean Tonnes 300,000
Met Clean Tonnes 2,372,000 2,533,500 4,905,500
Total Clean Tonnes 5,205,500
The first option to increase the cable belt capacity would be to upgrade the motor
and drive system and the speed up the conveyor by the required 30%. Concerns in this
option arise surrounding the increase in environmental concerns. The increase speed of
the cable belt will increase the raw coal that is spilled from the carrying surface. The
cable belt operates in such a manner that the cable that the belt rides on is not fixed to
the belt, rather it supports the belt as the apparatus travels over fixed line stands with
moving pulleys. The height of the cable belt pulleys are designed to produce a level and
even movement of the belt, but inevitably, the height varies, causing the belt to bounce
up and down, mirroring the imperfection in the pulley height from line stand to line stand.
This bouncing allows coal to spill off the belt and onto the ground. The coal deposited
onto the ground creates a risk to environmental non-compliance with regards to coal
washing into the adjacent creek. For this reason, the option to speed up the cable belt is
not attractive.

26
Figure 4-1 Line Creek Operations Cable Belt
A company called Railveyor has a technology that can be supplied for the same
operating costs as the current cable belt and can meet the raw coal supply needs of the
Processing Facility. The Railveyor technology is a process of small container cars that
travel on a fixed rail system. The new technology has less impact on the environment,
as the spillage of coal is less. The system is modular and scalable. This could provide
Line Creek with a flexible system to deliver raw coal to the Processing Facility. The
drawback of this system is that it is new to Teck and our experience and skillset is not
strong with this type of material moving technology. Also, there will be different
equipment required to load and off load the container cars. Lastly, there are issues that
could arise with weather and the amount of snow that the Elk Valley receives.
Removing the snow causes another new issue that needs to be maintained on a shift by
shift basis.

27
Regardless of the type of technology employed, the ability to increase the annual
production to 5 Mmtcc is not limited by a system to deliver raw coal to the Processing
Facility. The primary factor in the method of this decision revolves around the additional
impact to the environment and Line Creek, which travels adjacent to the current cable
belt.

28
Chapter 5. Economic Analysis of Capacity Options
The assumptions used for future financial predictions were taken from the Teck
Coal appropriation requisition assumptions for Q1 2015. These assumptions forecast
coal selling price excluding ocean freight, cash costs of production (including capital)
and transportation costs excluding ocean freight. Using these forecasts for 2015
onward, a base case NPV was calculated. With a 10 year useful life and an 8% interest
rate, the NPV calculated with the Q1 2015 predicted growth in selling price and without
making any Processing Plant capacity increases was $1,034M.
Considering the current state of the coal market, a second base case was
calculated. The second case predicts a static selling price for coal as predicted in the
Q1 2015 Teck Coal appropriation requisition assumptions. Again, a 10 year useful life
and an interest rate of 8% were utilized. The resulting NPV without making any
Processing Plant capacity increases was $261M.
These two base cases serve as the comparison by which the 4 Mmtcc scenario
and the 5 Mmtcc scenario will be evaluated. The details of the calculations are located
in the Appendix.
4.0 Million mtcc Scenario
The additional capital dollars required in order to achieve an annual production of
4 Mmtcc saleable clean coal is listed below in table 5-1. All of the upgrades needed in
this scenario are in the Processing Plant and the costs would be incurred in 2016.

29
Table 5-1 Capital Dollars for 4 Mmtcc Capacity ($000’s)
Capital Dollars for 4 Mmtcc Capacity ($000’s) Parts Install Total
Deslime Screen (4) 800 800 1,600
Heavy Media Cyclone (2) 150 450 600
HMC pump (2) 100 200 300
HMC sump (2) 600 600 1,200
HMC piping 300 500 800
Total 1,950 2,550 4,500
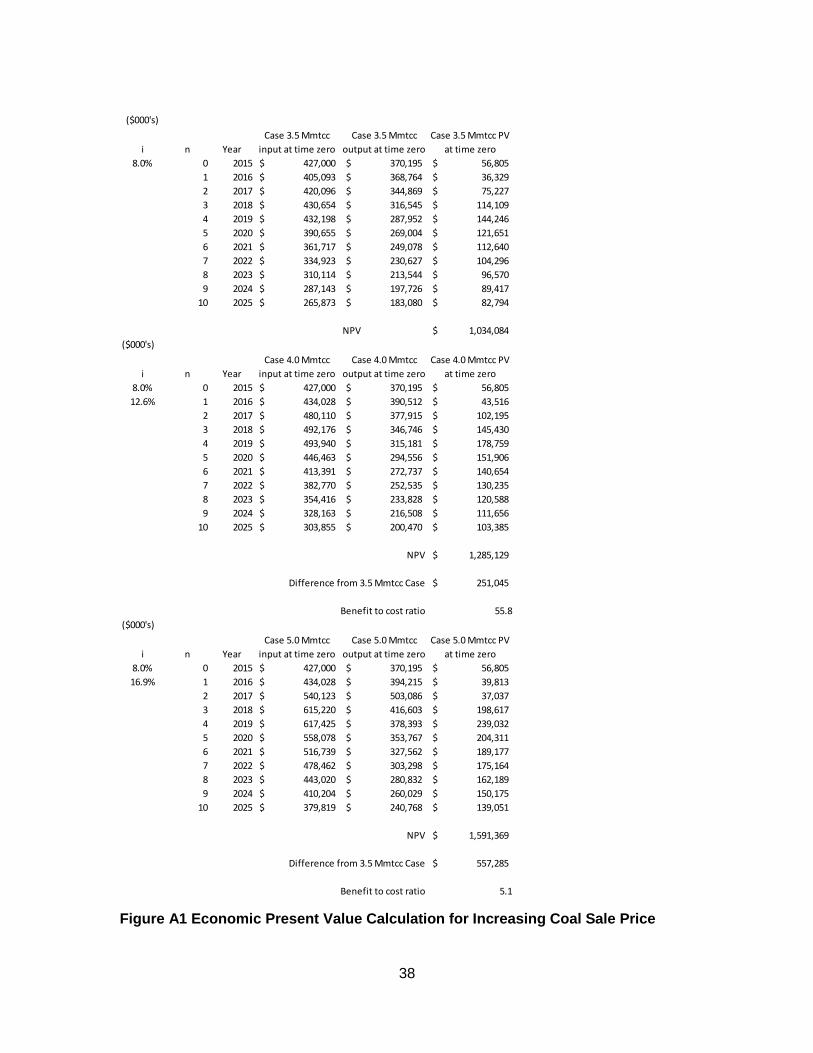
The NPV calculation for the 4 Mmtcc scenario when using the increasing
predicted coal selling price is $1,285M. This is an increase from the comparable 3.5
Mmtcc base case of $251M or 24% of the base case NPV. The IRR is 12.6% with a
BCR of 55.8.
When a static coal sale price is assumed over the next 10 years, the NPV for the
4 Mmtcc scenario becomes $402M compared to the parallel 3.5 Mmtcc case of $261M.
The difference in this case is $141M or a 54% increase from the base case NPV. For
the static coal sale price, the IRR is 20.7% with a BCR of 31.4.
Even during a period of volatile sales prices, the benefit of increasing the output
of the Line Creek Processing facility is evident based on the Q1 2015 Teck Coal
appropriation requisition assumptions.
5.0 Million mtcc Scenario
The additional capital dollars required in the Processing Plant in order to achieve
an annual production of 5 Mmtcc saleable clean coal is listed below in table 5-2. All of
the upgrades listed would be incurred in 2017. In order to achieve the objective of 5
Mmtcc, the upgrades outlined in the 4 Mmtcc scenario must also be accomplished as
previously outlined.

30
Table 5-2 Capital Dollars for 5 Mmtcc Capacity Plant ($000's)
Capital Dollars for 5 Mmtcc Capacity Plant ($000’s) Parts Install Total
Water Only Cyclone (8) 400 400 800
WOC discharge tub (2) 400 400 800
WOC pump (2) 100 500 600
WOC sump (1) 200 200 400
WOC piping 300 300 600
Fines Classifying Cyclone (4) 200 200 400
FCC discharge tub (2) 150 150 300
FCC pump (2) 200 200 400
FCC sump (1) 200 200 400
FCC piping 300 300 600
50 c/v motor 50 25 75
51 c/v motor 50 25 75
52 c/v motor 100 50 150
52 c/v motor cable 100 100 200
52 c/v discharge chute 100 100 200
53 c/v motor 50 25 75
Screen Bowl Centrifuge (4) 3,000 725 3,725
SBC Distributor (1) 100 300 400
CC Thickener U/F pump (2) 100 200 300
Ref Thickener U/F pump (2) 100 200 300
Belt Press Feed Tank (1) 100 100 200
Total 6,300 4,700 11,000
In addition to the significant Processing Plant upgrades, there is a need for
additional mining equipment to supply the raw coal required to produce 5 Mmtcc. The
mining equipment required would incur significant capital dollars in 2017 as listed in
Table 5-3. For the purposes of this analysis, it is assumed that the Mine Operations is
able to meet the requirements of the Processing Facility. There are too many factors
here to list or discuss in a meaningful detailed manner.

31
Table 5-3 Capital Dollars for 5 Mmtcc Capacity Mine ($000's)
Capital Dollars for 5 Mmtcc Capacity Mine ($000’s) 4 shovel 4,000
4 shovel replacement 28,000
Haul Truck (9) 49,500
Shop Upgrade 7,000
Drill 6,000
Total 94,500
The NPV calculation for the 5 Mmtcc scenario when using the increasing
predicted coal selling price is $1,591M. This is an increase from the comparable 3.5
Mmtcc base case of $557M or 54% of the base case NPV. The IRR is 16.9% with a
BCR of 5.1.
When a static coal sale price is assumed over the next 10 years, the NPV for the
5 Mmtcc scenario becomes $498M compared to the parallel 3.5 Mmtcc case of $261M.
The difference in this case is $237M or a 91% increase from the base case NPV. For
the static coal sale price, the IRR is 23.7% with a BCR of 2.2. A summary of the
calculated values are displayed below in table 5-4.
Table 5-4 Economic Analysis Summary
Economic Analysis Summary ($000’s) NPV IRR BCR
3.5 Mmtcc with price growth 1,034
4.0 Mmtcc with price growth 1,285 12.6% 55.8
5.0 Mmtcc with price growth 1,591 16.9% 5.1
3.5 Mmtcc static price 261
4.0 Mmtcc static price 402 20.7% 31.4
5.0 Mmtcc static price 498 23.7% 2.2

32
The 4 Mmtcc scenario possesses a strong BCR in cases of a coal price growth
market and a static coal price market. This speaks to the low economic risk associated
with this scenario. Conversely, the 5 Mmtcc scenario is not nearly as attractive when
you consider the possibility of static coal sale prices over the next ten years. An overall
capital investment of $110M that yields a ten year NPV value increase from the 3.5
Mmtcc base case of $237M is not nearly as lucrative compared to a NPV value increase
of $141M versus a $4.5M investment for the 4 Mmtcc scenario.
33
Chapter 6. Other Impacts on Line Creek Capacity Increases
As stated in the 2014 Line Creek Life of Mine Plan, the current mine life has
operations until 2036. By advancing the saleable clean coal output to 4 Mmtcc, an
annual rate increase of 14% will result in shortening the current end of mine life to 2033.
However, by increasing the annual production to 5 Mmtcc, the 43% increase would
shorten the mine life to 2025. Consider in the latter scenario a constant mining strip ratio
and a constant Processing Plant yield, the mining waste generated and the plant refuse
generated would also increase by 43% from 2017 until 2025. This additional rate of
waste and refuse deposition would create an additional burden to manage correctly to
ensure proper construction and water management. Also, the increase rate of waste
deposition has a potential to create a risk of geotechnical issues. Lastly, the increase
rate of production would cause issues in maintaining efficient shovel headings. Line
Creek possesses thin seams and adding a shovel to the production schedule would
make the planning and mining process more complex and as a result more volatile and
subject to unreliability. This result does not mesh with the current objective of Line
Creek to be leaders in operational excellence. The 5 Mmtcc scenario contains far more
uncertainty in the aforementioned aspects as does the 4 Mmtcc scenario.
The impact of more saleable clean coal production annually also has the
potential to affect Line Creek’s environmental reputation. Line Creek Operations has
worked tirelessly in order to create a working relationship with NGO’s, government
agencies and communities of interest. A clear example of this process is the recent
Phase II application. Consideration must be taken in order to assess the impact of either
the 4 Mmtcc or the 5 Mmtcc increase in this regard. The increase in mining activities
may impact the release of selenium, calcium deposition, nitrates or other undesired
constituents in the Line Creek tributary. Either an increase in the aqueous concentration

34
or an increase in the volumetric flow rate would require a clear management action plan
to mitigate or eliminate the hazard. Closer to home, the location of Grave Lake is within
2 km of the Line Creek Processing Plant. An increase in the generation of refuse would
accelerate the Processing Plant Refuse Dump. There is a permitted boundary limit and
a new location for dumping this material would be required to be sourced much sooner
with the 5 Mmtcc scenario.
Can the Teck Marketing group sell the additional coal? This is a big unknown.
The current market is experiencing an over-supply state with dropping prices. This is not
an attractive environment for large additions to Teck’s coal sales volume portfolio. The
shrinking GDP growth rate for China coupled with the move to use more domestic coal
and the newly developed tariff on coal imports complicates the situation to sell coal in
China. Australian coal producers continue to over-supply the market, and since their
market share is significantly greater than Teck’s, the power to control the selling price
lies firmly with the Australian producers. The over-supply would squeeze Teck and may
force a choice between sales volume and realized coal sale price. With the current
company objectives and projects, cash flow is an important factor to consider. This
makes the 5 Mmtcc scenario much less attractive than the 4 Mmtcc scenario.
Finally, can the additional saleable clean coal be transported to the vessel
loading facilities? Teck relies on Canadian Pacific Railways to provide a service to
transport our coal. Forecasting of the monthly production by mine is utilized in order to
determine the number of unit trains required on a daily basis to maintain the steady state
flow of saleable clean coal from the Elk Valley. Currently, Line Creek receives 220 unit
trains per year or 4.25 trains per week. By increasing the production rate to 4 Mmtcc,
Line Creek would require 31 additional trains each year to move the incremental
saleable clean coal, or 4.83 trains per week. By increasing the production rate to 5
Mmtcc, Line Creek would require 63 trains over the 4 Mmtcc scenario, or 6.04 trains per
week. Again, similar to the ability to sell the coal, the mine life length impact, the
potential environmental, social and community impacts, the 5 Mmtcc scenario contains
many more uncertainties and risks than the 4 Mmtcc scenario.

35
Chapter 7. Recommendations
The option to increase the annual production to 5 Mmtcc is not recommended to
be implemented. In comparison to the 4 Mmtcc option, the lower BCR for the 5 Mmtcc is
significant. Also, the current metallurgical coal price environment has squeezed the
margin realized for Teck Coal. This has produced the effect of a close focus on
quarterly cash flow for the Coal Business Unit. The request to spend an excess of
$100M in capital money in a two year period at Line Creek for a project that only results
in an increase of 1.5 Mmtcc is not ideal. The 5 Mmtcc production option is also not
attractive when considering the current supply and demand dynamics in the world
metallurgical coal market.
Line Creek can realize an increase in annual production, a decrease in total
operating unit costs, and an increase in the 10 year net present value of the operation
along with a strong benefit to capital cost ratio by upgrading the heavy media wash plant
circuit. The 4 Mmtcc option is represents the most stable low risk option to elevate the
value of the Line Creek Operation asset for Teck.
As outlined previously, the equipment required and the installation schedule to
increase the annual production to 4 Mmtcc can be accomplished as soon as the 2016
summer shut down. This will allow Teck to realize the benefits of the opportunity by the
third quarter of 2016. Furthermore, the installation can be accomplished during a routine
length shut down of no more than 10 days.
A full environment scan of the increase to 4 Mmtcc is required to ensure that
Teck maintains its social and environmental licence to operate in the Elk Valley. In order
for the full benefit to be realized, the scan must be completed by the end of the first
quarter 2016.

36
References
Higgins, Robert C., Analysis for Financial Management, Tenth Edition, McGraw-Hill Irwin, 2012, p. 247-266.
Porter, Michael E., The Five Competitive Forces That Shape Strategy, Harvard Business Review (January 2008), 2008.
Teck Coal Appropriation Requisition Assumptions, Q1 2015.
Teck Coal Mines Comparison Report, 2005-2014.
http://center.sustainability.duke.edu/resources/green-facts-consumers/what-largest-fuel-source-electricity-united-states

37
Appendix Calculations for Economic Analysis
38
($000's)
i n Year
Case 3.5 Mmtcc
input at time zero
Case 3.5 Mmtcc
output at time zero
Case 3.5 Mmtcc PV
at time zero
8.0% 0 2015 427,000$ 370,195$ 56,805$
1 2016 405,093$ 368,764$ 36,329$
2 2017 420,096$ 344,869$ 75,227$
3 2018 430,654$ 316,545$ 114,109$
4 2019 432,198$ 287,952$ 144,246$
5 2020 390,655$ 269,004$ 121,651$
6 2021 361,717$ 249,078$ 112,640$
7 2022 334,923$ 230,627$ 104,296$
8 2023 310,114$ 213,544$ 96,570$
9 2024 287,143$ 197,726$ 89,417$
10 2025 265,873$ 183,080$ 82,794$
NPV 1,034,084$
($000's)
i n Year
Case 4.0 Mmtcc
input at time zero
Case 4.0 Mmtcc
output at time zero
Case 4.0 Mmtcc PV
at time zero
8.0% 0 2015 427,000$ 370,195$ 56,805$
12.6% 1 2016 434,028$ 390,512$ 43,516$
2 2017 480,110$ 377,915$ 102,195$
3 2018 492,176$ 346,746$ 145,430$
4 2019 493,940$ 315,181$ 178,759$
5 2020 446,463$ 294,556$ 151,906$
6 2021 413,391$ 272,737$ 140,654$
7 2022 382,770$ 252,535$ 130,235$
8 2023 354,416$ 233,828$ 120,588$
9 2024 328,163$ 216,508$ 111,656$
10 2025 303,855$ 200,470$ 103,385$
NPV 1,285,129$
Difference from 3.5 Mmtcc Case 251,045$
Benefit to cost ratio 55.8
($000's)
i n Year
Case 5.0 Mmtcc
input at time zero
Case 5.0 Mmtcc
output at time zero
Case 5.0 Mmtcc PV
at time zero
8.0% 0 2015 427,000$ 370,195$ 56,805$
16.9% 1 2016 434,028$ 394,215$ 39,813$
2 2017 540,123$ 503,086$ 37,037$
3 2018 615,220$ 416,603$ 198,617$
4 2019 617,425$ 378,393$ 239,032$
5 2020 558,078$ 353,767$ 204,311$
6 2021 516,739$ 327,562$ 189,177$
7 2022 478,462$ 303,298$ 175,164$
8 2023 443,020$ 280,832$ 162,189$
9 2024 410,204$ 260,029$ 150,175$
10 2025 379,819$ 240,768$ 139,051$
NPV 1,591,369$
Difference from 3.5 Mmtcc Case 557,285$
Benefit to cost ratio 5.1
Figure A1 Economic Present Value Calculation for Increasing Coal Sale Price
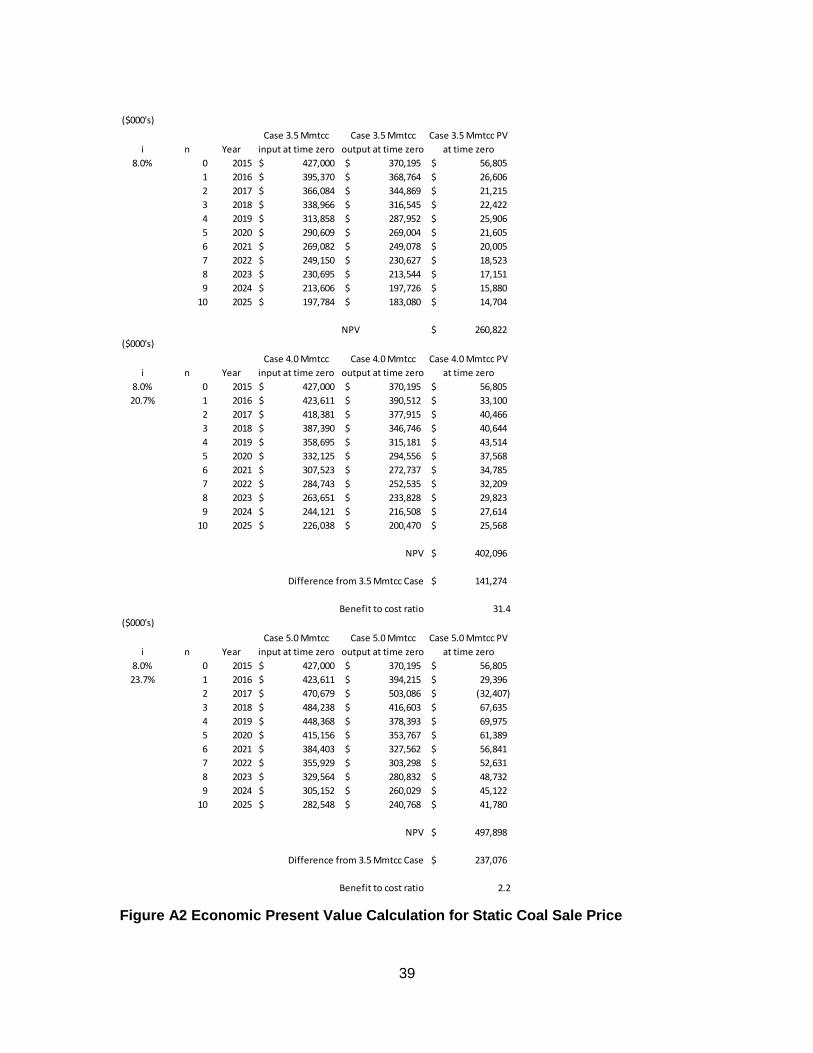
39
($000's)
i n Year
Case 3.5 Mmtcc
input at time zero
Case 3.5 Mmtcc
output at time zero
Case 3.5 Mmtcc PV
at time zero
8.0% 0 2015 427,000$ 370,195$ 56,805$
1 2016 395,370$ 368,764$ 26,606$
2 2017 366,084$ 344,869$ 21,215$
3 2018 338,966$ 316,545$ 22,422$
4 2019 313,858$ 287,952$ 25,906$
5 2020 290,609$ 269,004$ 21,605$
6 2021 269,082$ 249,078$ 20,005$
7 2022 249,150$ 230,627$ 18,523$
8 2023 230,695$ 213,544$ 17,151$
9 2024 213,606$ 197,726$ 15,880$
10 2025 197,784$ 183,080$ 14,704$
NPV 260,822$
($000's)
i n Year
Case 4.0 Mmtcc
input at time zero
Case 4.0 Mmtcc
output at time zero
Case 4.0 Mmtcc PV
at time zero
8.0% 0 2015 427,000$ 370,195$ 56,805$
20.7% 1 2016 423,611$ 390,512$ 33,100$
2 2017 418,381$ 377,915$ 40,466$
3 2018 387,390$ 346,746$ 40,644$
4 2019 358,695$ 315,181$ 43,514$
5 2020 332,125$ 294,556$ 37,568$
6 2021 307,523$ 272,737$ 34,785$
7 2022 284,743$ 252,535$ 32,209$
8 2023 263,651$ 233,828$ 29,823$
9 2024 244,121$ 216,508$ 27,614$
10 2025 226,038$ 200,470$ 25,568$
NPV 402,096$
Difference from 3.5 Mmtcc Case 141,274$
Benefit to cost ratio 31.4
($000's)
i n Year
Case 5.0 Mmtcc
input at time zero
Case 5.0 Mmtcc
output at time zero
Case 5.0 Mmtcc PV
at time zero
8.0% 0 2015 427,000$ 370,195$ 56,805$
23.7% 1 2016 423,611$ 394,215$ 29,396$
2 2017 470,679$ 503,086$ (32,407)$
3 2018 484,238$ 416,603$ 67,635$
4 2019 448,368$ 378,393$ 69,975$
5 2020 415,156$ 353,767$ 61,389$
6 2021 384,403$ 327,562$ 56,841$
7 2022 355,929$ 303,298$ 52,631$
8 2023 329,564$ 280,832$ 48,732$
9 2024 305,152$ 260,029$ 45,122$
10 2025 282,548$ 240,768$ 41,780$
NPV 497,898$
Difference from 3.5 Mmtcc Case 237,076$
Benefit to cost ratio 2.2
Figure A2 Economic Present Value Calculation for Static Coal Sale Price