analysis of the potential for cultivation of fruit and ...ime.bg/var/images/horticulturebg.pdf ·...
TRANSCRIPT

INSTITUTE FOR MARKET ECONOMICS
2012
Analysis of the potential
for cultivation of fruit
and vegetables in
Bulgaria
P U B L I S H E D W I T H T H E S U P P O R T O F “ A M E R I C A F O R B U L G A R I A ” F O U N D A T I O N

Purpose of the study
The purpose of this study is to identify the perspective crops in the vegetable- and fruit-growing
sectors from the viewpoint of domestic demand and export potential.
Methodology
To determine which crops hold the greatest potential, we use two main indicators:
1) Domestic demand – the quantity of domestic demand is based on data of household
consumption and the demand of food processing companies. To minimize the possible
weaknesses of such data compilation, we use information for aggregate demand (production
+ import - export),
2) Export demand – taking into account that the greater part of the export of fruit and
vegetables (84% in 2011) is to other EU member states’ markets, we use data on the import
of fruits and vegetables in EU
We observe the dynamics of household consumption, the demand of raw materials in the processing
industry and the import of fresh fruits and vegetables for 10-year period (2002-2011), while also
considering the compound annual growth rate (CAGR). We analyze the crops that mark a positive
growth, could be cultivated in Bulgaria (in accordance with the environmental and climate
conditions) and their produced quantity is more than 1000 tons or BGN 1 mil. in net value. To
determine whether the Bulgarian producers have competitive advantage in growing these crops, the
formula for revealed competitive advantage RCA1, is applied. The RCA refers to the foreign trade
position of the country for the particular goods in comparison to its general foreign trade standing.
The crops with growth potential are identified as such based on examined demand increase on
domestic and EU market and on competition coefficient greater than zero, derived through the RCA
formula. In the matrix below the crops with better perspectives are placed it the upper right part of
the graph, while those with low or none potential are in the bottom left corner. An exemplary matrix,
complied this way, would look like this:
1 The applied in the study formula for RCA is developed by CPAII, 1998 and used by ITC 2000, as well as in the research project “Are the Mediterranean countries competitive in fresh fruit and vegetable exports?”, Nilsson, Fredrik O.L. Lindberg, Emma Surry, Yves R, Department of Economics, Swedish University of Agricultural Sciences, 2006.
-80,0%
-60,0%
-40,0%
-20,0%
0,0%
20,0%
40,0%
-10,0% -5,0% 0,0% 5,0% 10,0%

Introduction
The vegetable- and fruit-growing industries are going through a severe crisis in the last decade. For
the 2002-2011 period the production value of these two sectors has plummeted by more than 60%
at base prices. Their share in crop production and in agriculture as a whole decreases by 76% and
73% respectively. For the same time period, the land cultivated with vegetables dropped down by
61% and the land with perennial crops (fruit trees without vineyards) decreased by 30%. The
domestic production is insufficient to meet demand and this has turned the country from net
exporter to net importer of fruits and vegetables.
The neighbouring Turkey and Greece, where the warm weather lasts much longer, allows the import
of particular crops at lower prices for longer time periods during the year. This possibility, however,
pressures the Bulgarian production to either expand or to specialise in the areas of competitive
advantage.
In the last couple of years we observe retention in the land, used for some. We also observe
investment in new fruit plantations and slight increase in output. Although it is too soon to discuss
breaking the negative trend, the sector is at an important crossroad. In this context, this study might
be valuable in determining the crops with greater development perspective in the country.
Traditionally cultivated crops
Among the most widespread vegetables today, most of them are relatively recently brought to
Bulgaria’s market. Potatoes, tomatoes, pepper, beans and spinach have started to be cultivated on a
large scale less than 150 years ago. Cultures such as turnip, carrot, onion, garlic, cabbage, lentils,
peas, broad beans and cucumber have been grown for thousands of years on Bulgarian soils.
From the traditionally cultivated fruits most popular is the cultivation of plums, apples, peaches,
cherries, and in the past – mulberries.
The weather conditions in the country are suitable for cultivation of some unconventional fruits, such
as the kiwi for instance.
Domestic market
Three main factors influence the demand for fruits and vegetables for direct consumption or for
processing:
Seasonal – related to quantity and quality of the crop
Economic – related to the real disposable income of the population
Consumer habits – they change rather slowly but could considerably alter the structure of
the food demand.

Fruits
Household consumption
According to National Statistical Institute (NSI), the household consumption of fruits and vegetables
has increased for the 2002-2011 period. Despite the weaknesses in the household budgets research
study, it still provides a picture of the general tendencies in consumers’ attitudes.
The main conclusions to be drawn in relation to the fruit consumption are the following (see Graph
1):
The traditional for Bulgaria fruits such as grapes, pears, watermelons give way to the
southern and citrus fruits
Among the traditional fruits in the country, only apples score steady growth
If we check the information on household consumption with the data for production and
import, we observe an increase in the consumption of peaches, cherries, strawberries, kiwi
and some sorts of nuts (walnuts and almonds)
Regarding the preserved goods, the consumption of fruit juices has increased more than two
times for the last ten years. However, the consumption of jam and marmalade decreases.
Graph 1 – Household consumption of fruits
Source: NSI
An explanation of the results might be found in the increase of the purchasing power of the
population in the last ten years and in the widening accessibility to fruits and nuts, which in the past
were missing from the Bulgarian market or were too expensive.
Apples, cherries, peaches, nuts (walnuts, almonds) and kiwi are outlined as perspective for the
Bulgarian producers.
123,1% 117,6%
64,1%
50,0%
0,0% -14,3% -15,0% -23,9% -26,7% -31,3% -33,3%
Sou
ther
n fr
uit
s
Juic
es a
nd
syr
op
s
Ap
ple
s
Oth
er f
ruit
s
Nu
ts
Pe
ars
Mel
lon
s an
d w
ater
mel
lon
s
Can
ned
fru
its
Gra
pes
Pu
mp
kin
s
Jam
s an
d m
arm
alad
es
Household consumption change, 2002 - 2011
The data on household consumption does not reflect the factor of “private production”. Hence, the
increased consumption of some fruits might be attributed to deliveries by someone different from
industrial production (like family gardening).
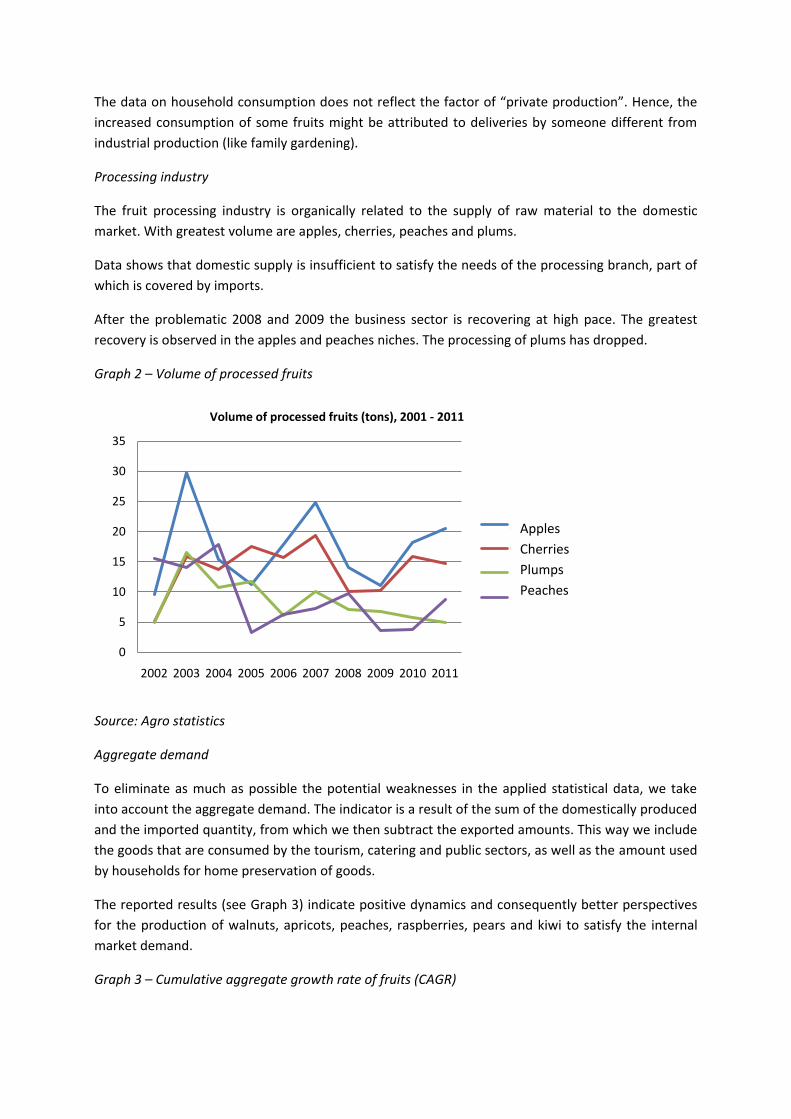
Processing industry
The fruit processing industry is organically related to the supply of raw material to the domestic
market. With greatest volume are apples, cherries, peaches and plums.
Data shows that domestic supply is insufficient to satisfy the needs of the processing branch, part of
which is covered by imports.
After the problematic 2008 and 2009 the business sector is recovering at high pace. The greatest
recovery is observed in the apples and peaches niches. The processing of plums has dropped.
Graph 2 – Volume of processed fruits
Source: Agro statistics
Aggregate demand
To eliminate as much as possible the potential weaknesses in the applied statistical data, we take
into account the aggregate demand. The indicator is a result of the sum of the domestically produced
and the imported quantity, from which we then subtract the exported amounts. This way we include
the goods that are consumed by the tourism, catering and public sectors, as well as the amount used
by households for home preservation of goods.
The reported results (see Graph 3) indicate positive dynamics and consequently better perspectives
for the production of walnuts, apricots, peaches, raspberries, pears and kiwi to satisfy the internal
market demand.
Graph 3 – Cumulative aggregate growth rate of fruits (CAGR)
0
5
10
15
20
25
30
35
2002 2003 2004 2005 2006 2007 2008 2009 2010 2011
Volume of processed fruits (tons), 2001 - 2011
ябълки
череши
сливи
праскови
Apples
Cherries
Plumps
Peaches

Vegetables
Looking at the vegetables consumption, the consumption of the following goods appears to be
greater (see Table 4):
Mushrooms – with 75%
Cabbage – with 29%
Frozen vegetables, cucumbers and to a lesser degree - tomatoes
Growth is observed in niche crops such as cauliflower and broccoli if the household budgets
is compared to the export accounts
Decline is examined only in the preserved vegetables – pickled vegetables/pickles and juices
Table 4 – Household consumption of vegetables
Source: NSI
11,8
10,9
8,9
6,3
3,7
2,5
-0,5
-1,1
-4,3
-7,1
-10 -5 0 5 10 15
walnuts
apricots
peaches
raspberries
cherries
kiwi
apples
almonds
plums
strawberries
Rate of increase of total demand for fruit, 2002-2011, GACR
75,0%68,8%
29,3% 25,6% 24,4% 21,2%14,9%
9,2% 8,6%
-1,2% -4,8% -24,1% -44,4%
Mu
shro
om
s
Len
s
Cab
bag
e
Be
ans
Cu
cum
ber
s
Oth
er
Tom
ato
es
Po
tato
es
On
ion
s
Pep
pe
rs
Can
ne
d v
ege
tab
les
Pic
kles
Juic
es
Chnage of households' vegetable consumption, 2002-2011 г.

The shifts of beans and lentils consumption should not be considered as long term tendencies. Their
growth is concentrated in the last two years of the crisis. This focus is a disadvantage of the
household budgets study because a big portion of the interviewees belong to low income
households. Obviously, a considerable part of the population has increased the consumption of such
basic foods. However, there is enough evidence to assume as perspective for production
mushrooms, cucumbers, cabbage, tomatoes and onion, as long as they are cultivated and marketed
at (highly) competitive prices.
Processing industry
The key vegetable crops in demand of processing are pepper and tomatoes. From significance for the
processing branch are also aubergine, peas and gherkin, although their importance is declining in the
last couple of years. It should be noted here that potatoes and mushrooms have completely vanished
as goods in the processing sector.
Table 5 – Processed vegetables quantity
Source: Agro statistics
Aggregate demand
The data on the total quantity of vegetables delivered/imported to the domestic market differ from
the household consumption statistics. It signals for positive dynamics only in the peas, carrots and
mushrooms values.
0
5
10
15
20
25
30
35
40
2002 2003 2004 2005 2006 2007 2008 2009 2010 2011
Processed vegetables quantity (t), 2002 - 2011
домати
пипер
патладжан
грах
Tomatoes
Peppers
Eggplant
Peas

-Table 6 – Cumulative aggregate growth rate of vegetables
External market
We apply the information on export in the EU for the last ten years to analyze the export potential.
The focus is on this particular market because a considerable part of Bulgarian exports of fruits and
vegetables goes to other countries of the Community. Moreover, the EU market due to its mere size
provides great opportunities for the Bulgarian farmers.
Table 7 – Growth of fruit imports in EU
Source: Eurostat
17,2
9
7,5
-2,8
-3,4
-6,4
-6,8
-7,3
-9,6
-15 -10 -5 0 5 10 15 20
peas
carrots
mushrooms
cucumbers
onions
tomatoes
peppers
cabbage
potatoes
CAGR of vegetables, 2002-2011
3,1% 2,9%2,4% 2,3% 2,2%
1,5% 1,4%1,0%
0,4%
-2,0%
Annual growth of fruit import in EU, 202 - 2011
Ras
pb
erri
es
Kiw
i
Ap
ple
s
Gra
pes
Wal
nu
ts
Stra
wb
erri
es
Pea
ches
Ch
erri
es
Ap
rico
ts
Plu
ms

The table identifies a significant growth in the demand of raspberries, kiwi, apples, desert grapes and
walnuts in EU.
Regarding the demand of vegetables, onion, mushrooms, cucumbers, pepper, cabbage and tomatoes
appear as the most popular goods in the EU for the last ten years.
Table 8 – Growth of vegetables imports in EU
Source: Eurostat
Bulgaria’s competitive advantages
In order to identify the competitive advantages of particular crops, we apply the Revealed
Competitive Advantage method (RCA) and we get the following results for fruit and vegetables:
Конкурентоспособност на отделните култури / Competitiveness of particular crops
Fruits RCA Vegetables RCA
Walnuts 14,0% Mushrooms 29,3%
Raspberries 5,0% Cucumbers 21,5%
Strawberries 2,2% Peas 3,2%
Plums 1,4% Cabbage -1,4%
Cherries 1,2% Carrots -3,8%
Apricots -0,2% Onion -4,5%
Peaches -1,8% Potatoes -5,7%
Grapes -2,5% Peppers -10,2%
Apples -11,1% Tomatoes -59,7%
Source: Own calculations
8,0%
5,2%3,9% 3,8% 3,2% 2,7%
1,7%0,7%
-8,9%
Annual growth of vegetables import in EU, 2002 - 2011
on
ion
s
mu
shro
om
s
cucm
ber
s
pep
per
cab
bag
e
tom
ato
es
carr
ots
pea
s
po
tato
es

Domestic market
In relation to meeting the internal market demand, walnuts, raspberries and cherries appear to hold
the greatest potential. Apricots, as well as peaches, also have market potential that needs to be
further developed.
Table 9 – Perspectives for the fruit-tree crops on domestic market
Source: Own calculations
With respect to vegetables, as most perspective are outlined mushrooms and peas, and to some
extend carrots and cucumbers.
Table 10 – Perspectives for vegetable crops on domestic market
Source: Own calculations
-15%
-10%
-5%
0%
5%
10%
15%
20%
-10% -5% 0% 5% 10% 15%
RC
A
динамика на вътрешния пазар
Оценка на конкурентните предимства при овощните култури за вътрешния пазар
малини
орехи
черешикайсии
праскови
сливиягоди
ябълки
-80%
-60%
-40%
-20%
0%
20%
40%
-15% -10% -5% 0% 5% 10% 15% 20%
RC
A
Internal market dynamics
Assessment of competitive advantages of vegetable crops on internal market
mushrooms
peascarrots
tomatoes
cucumbers
onions
cabbage
peppers
potatoes
Assessment of the competitive advantages of fruit-tree crops on
domestic market
walnuts
raspberries
cherries
peaches apricots
apples
plums
strawberries
Internal market dynamics

External market
Cultivation of walnuts, raspberries, strawberries, cherries and apricots stands out as one holding the
greatest potential for export to the EU.
Table 11 – Perspectives for fruit-tree crops on EU market
Source: own calculations
The crops with potential for export to the EU are mushrooms, cucumbers, peas and with some
reservations, cabbage, carrots and onion.
Source: own calculations
Summary of findings
As a result of our analysis, the examined crops can be divided into three groups:
-15%
-10%
-5%
0%
5%
10%
15%
20%
-3% -2% -1% 0% 1% 2% 3% 4%
RC
A
EU import dynamics
Assessment of competitive advantages of fruit-tree crops on EU market
walnuts
raspberriesstrawberries
cherriesapricots
peachesgrapes
apples
plums
-80%
-60%
-40%
-20%
0%
20%
40%
-10% -5% 0% 5% 10%
RC
A
EU import dynamics
Assessment of competitive advanatges of vegetable crops on EU market
mushroomscucumbers
peascabbage
carrotspeppers onions
tomatoes
potatoes

1. Most perspective crops – i.e. crops in the cultivation of which Bulgaria has competitive
advantage after its accession to the EU
2. Crops with certain potential – crops that require additional efforts and investments to
improve their production effectiveness; and/or that experience stable or increasing demand
on EU level, despite declining demand in Bulgaria
3. Crops with no potential - crops that need to undergo drastic improvement of effectiveness
(related to enormous investments, production optimization and cost reduction) and/or face
permanent decrease in demand.
Fruit
Most perspective With potential With no potential
1. Walnuts 1. Apricots Plums
2. Raspberries 2. Peaches Apples
3. Cherries 3. Grapes
4. Strawberries 4. Kiwi
*for which there is insufficient information to assess its competitiveness; yet, it is included because its
cultivation is possible and it enjoys strong demand
Vegetables
Most perspective With potential With no potential
1. Mushrooms 1. Carrots 1. Tomatoes
2. Cucumbers 2. Cabbage 2. Pepper
3. Peas 3. Onion 3. Potatoes

Note: The findings of the study should be considered in the context of the applied methodology and
not as absolute facts.
Contacts:
Nikolay Valkanov
Institute for Market Economics
Sofia, 10 „Patriarh Evtimii“ blvd, fl. 2
tel.: (2) 952 62 66
e-mail: [email protected]