analysis of the relationship between casualty risk per
TRANSCRIPT

LBNL-5697E
An Analysis of the Relationship between Casualty Risk Per Crash and Vehicle Mass and Footprint for Model Year 2000-2007 Light-Duty
Vehicles
Final report prepared for the Office of Energy Efficiency and Renewable Energy, US Department of Energy
Prepared by
Tom Wenzel Building Technology and Urban Systems Department
Environmental Energy Technologies Division Lawrence Berkeley National Laboratory
Berkeley, CA 94720
August 2012
This work was supported by the Vehicle Technologies Program, Office of Energy Efficiency and Renewable Energy of the U.S. Department of Energy
under Contract No. DE-AC02-05CH11231.

DISCLAIMER
This document was prepared as an account of work sponsored by the United States Government. While this document is believed to contain correct information, neither the United States Government nor any agency thereof, nor The Regents of the University of California, nor any of their employees, makes any warranty, express or implied, or assumes any legal responsibility for the accuracy, completeness, or usefulness of any information, apparatus, product, or process disclosed, or represents that its use would not infringe privately owned rights. Reference herein to any specific commercial product, process, or service by its trade name, trademark, manufacturer, or otherwise, does not necessarily constitute or imply its endorsement, recommendation, or favoring by the United States Government or any agency thereof, or The Regents of the University of California. The views and opinions of authors expressed herein do not necessarily state or reflect those of the United States Government or any agency thereof, or The Regents of the University of California.
Ernest Orlando Lawrence Berkeley National Laboratory is an equal opportunity employer.

i
Acknowledgements We would like to thank those who reviewed earlier drafts of this report, and provided helpful comments and insights: Tom White and Peter Whitman, Office of Policy, U.S. Department of Energy; Chi Li, Office of Transportation and Air Quality, U.S. Environmental Protection Agency; Chuck Kahane, National Highway Transportation Safety Administration, U.S. Department of Transportation; and Phil Price, Lawrence Berkeley National Laboratory. We also would like to thank the formal peer reviewers of the preliminary version of this report: Charles Farmer, Insurance Institute for Highway Safety; David Greene, Oak Ridge National Laboratory; Kara Kockelman and Donna Chen, University of Texas; and Michael Van Auken, Dynamic Research, Inc. The report was funded by Carol Schutte of the Vehicle Technologies Program in the Office of Energy Efficiency and Renewable Energy of the U.S. Department of Energy. We are grateful for her support of this research. This work was supported by the Assistant Secretary for Energy Efficiency and Renewable Energy, of the U.S. Department of Energy under Contract No. DE-AC02-05CH11231.

ii

iii
Executive Summary NHTSA recently completed a logistic regression analysis (Kahane 2012) updating its 2003 and 2010 studies of the relationship between vehicle mass and US fatality risk per vehicle mile traveled (VMT). The new study updates the previous analyses in several ways: updated FARS data for 2002 to 2008 involving MY00 to MY07 vehicles are used; induced exposure data from police reported crashes in several additional states are added; a new vehicle category for car-based crossover utility vehicles (CUVs) and minivans is created; crashes with other light-duty vehicles are divided into two groups based on the crash partner vehicle’s weight, and a category for all other fatal crashes is added; and new control variables for new safety technologies and designs, such as electronic stability controls (ESC), side airbags, and methods to meet voluntary agreement to improve light truck compatibility with cars, are included. In a companion report (Wenzel 2012b), we use the updated databases NHTSA has created to replicate their findings on the relationship between vehicle weight, size (actually footprint, or vehicle wheelbase times track width), and US fatality risk per vehicle miles traveled (VMT), for model year 2000 to 2007 light-duty vehicles involved in fatal crashes between 2002 and 2008. The data are examined in slightly different ways, to get a deeper understanding of the relationship between reductions in vehicle mass and footprint, and overall safety. This report compares the logistic regression results of the NHTSA analysis of US fatality risk per VMT with an analysis of 13-state fatality risk and casualty risk per crash. This final report incorporates revisions from the preliminary report released in November 2011, including revised estimates of national weights for vehicle miles traveled, inclusion of 2008 police-reported crash data from eight additional states, and responses to reviewers’ comments. Our analysis differs from the NHTSA analysis in two respects: first, it analyzes risk per crash, using data on all police-reported crashes from thirteen states, rather than risk per estimated VMT; and second, it analyzes casualty (fatality plus serious injury) risk, as opposed to just fatality risk. There are several good reasons to investigate the effect of mass and footprint reduction on casualty risk per crash. First, risk per VMT, includes two effects that influence whether a person is killed or seriously injured in a crash: how well a vehicle can be, or actually is, driven (based on its handling, acceleration, and braking capabilities) to avoid being involved in a serious crash (crash avoidance), and, once a serious crash has occurred, how well a vehicle protects its occupants from fatality or serious injury (crashworthiness) as well as the occupants of any crash partner (compatibility). By encompassing both of these aspects of vehicle design, risk per VMT gives a complete picture of how vehicle design can promote, or reduce, road user safety. On the other hand, risk per crash isolates the second of these two safety effects, crashworthiness/compatibility, by examining the effect of mass and footprint reduction on how well a vehicle protects its occupants once a crash occurs. Second, estimating risk on a per crash basis only requires using data on police-reported crashes from states, and does not require combining them with data from other sources, such as vehicle registration data and VMT information, as in NHTSA 2011. Because only sixteen states currently record the vehicle identification number of vehicles involved in police-reported crashes, which is necessary to determine vehicle characteristics, and only thirteen states also

iv
report the posted speed limit of the roadway on which the crash occurred, extending the analysis to casualties (fatalities plus serious/incapacitating injuries; i.e. level “K” and “A” injuries in police reports) reduces the statistical uncertainty of analyzing just fatalities per crash. Finally, a serious incapacitating injury can be just as traumatic to the victim and her family, and costly from an economic perspective, as a fatality. Limiting the analysis to the risk of fatality, which is an extremely rare event, ignores the effect vehicle design may have on reducing the large number of incapacitating injuries that occur each year on the nation’s roadways. All risks in this report are societal risk, including fatalities and serious injuries in the case vehicle and any crash partners, and include not only driver casualties but passenger and non-occupant casualties as well. However, the frequency of police-reported crashes per VMT and of casualties per police-reported crash can both be influenced, in opposite directions, by the probability that a collision event becomes a police-reported crash. If collisions of certain vehicles are slightly less likely to be reported, because these vehicles are either somewhat less damage-prone or are uninsured, this would tend to increase the observed detrimental effect of mass reduction on reported crashes per VMT and conversely decrease its detrimental effect on casualties per reported crash. By contrast, fatalities or casualties per VMT would be not be affected by crash-reporting rates, because the crash-reporting rate is not part of the formula for calculating risk. The extent to which any reporting bias of non-injury crashes exists, the observed effects for police-reported crashes per VMT might not correspond exactly to the “effect of mass reduction on crash avoidance” and the observed effects for casualties per police-reported crash might not correspond exactly to the “effect of mass reduction on crashworthiness/compatibility.” We suspect that large pickups are less likely to suffer damage in non-injury crashes than other vehicle types; and that older, less expensive, or uninsured vehicles are less likely to report crash damage to police. In addition, one vehicle crashes are more likely to suffer from this reporting bias, as there is no crash partner who may file an insurance claim. Table ES.1 summarizes the results of our analysis of the effect of vehicle mass or footprint reduction on the two components of risk per VMT, crash frequency (number of crashes per VMT) and crashworthiness/compatibility (risk per crash), for both fatality and casualty risk, using data from 13 states. We convert the percent change in the log-odds of casualty or fatality per crash output from the SAS LOGIST procedure to the percent change in the probability of casualty or fatality per crash. This conversion has no effect on the output regression coefficients when the change in the log-odds of casualty is small, but substantially increases the percent change for explanatory variables that have a large effect on the log-odds of casualty. Effects that are statistically significant are shown in red in the table; significance is based on the 95% confidence interval derived from the standard error of the output of the SAS LOGIST procedure, converted to a percent probability interval. Table ES.1 indicates that for cars and light trucks, the effects from the two components, crash frequency and crashworthiness/compatibility, roughly add together to result in the overall effect on fatality risk per VMT. For example, the models estimate that 100-lb lower mass in lighter-than-average cars is associated with a 2.00% increase in crash frequency (column B), while lower mass is associated with a 0.54% decrease in the number of fatalities per crash (column C); the net effect is only a 1.42% increase in the risk of fatality per VMT (column D), which is

v
roughly the sum of the crash frequency and crashworthiness/compatibility effects (2.00% - 0.54% = 1.45%). For CUVs/minivans, the relationship is different; lower mass is associated with a 0.95% increase in crash frequency, as well as a 0.98% increase in the number of fatalities per crash; however, the net result, an estimated 1.60% increase in the number of fatalities per VMT, is less than the sum of the two components (0.95% + 0.98% = 1.92%). Solving the three equations (crashes per VMT, risk per crash, and risk per VMT) simultaneously, as DRI has done (Van Auken and Zellner 2012b), forces the estimates for the first two-stages of the regression (crashes per VMT and risk per crash) to equal that of the third state of the regression (risk per VMT). The regression results in Table ES.1 estimate that mass reduction increases crash frequency (columns B and E) in all five vehicle types, with larger estimated increases in lighter-than-average cars and light-duty trucks. As a result, mass reduction is estimated to have a more beneficial effect on crashworthiness/compatibility, or casualty risk per crash (column F), than on casualty risk per VMT (column G), and on fatality risk per crash (column C) than on fatality risk per VMT (column D). Mass reduction is associated with decreases in casualty risk per crash (column F) in all vehicles except lighter cars; in two of the four cases these estimated reductions are statistically significant, albeit small. Footprint reduction is associated with increases in crash frequency (columns B and E) in cars and light trucks, but with a small decrease in crash frequency in CUVs/minivans; footprint reduction does not have a statistically-significant effect on fatality risk per crash (column C), and only for casualty risk per crash (column F) for light trucks. For cars and light trucks, lower mass is associated with a more beneficial effect on fatality risk per crash (column C) than on casualty risk per crash (column F), while lower footprint is associated with slightly more detrimental effects. For CUVs/minivans Table ES.1 shows the opposite: lower mass is associated with a more beneficial effect, while lower footprint is associated with a more detrimental effect, on casualty than fatality risk per crash. It is unclear why lower vehicle mass is associated with higher crash frequency, but lower risk per crash, in the regression models. It is possible that including variables that more accurately account for important differences among vehicles and driver behavior would reverse this relationship. For example, adding vehicle purchase price substantially reduces the estimated increase in crash frequency as vehicle mass decreases, for all vehicle types; in the case of heavier-than-average cars, mass reduction is estimated to slightly decrease crash frequency. On the other hand, it is also possible that over thirty years of improvements in vehicle design to achieve high crash test ratings have enabled manufacturers to design vehicles to mitigate some of the safety penalty of low mass vehicles. The association of mass reduction with 13-state casualty risk per VMT (column G) is quite consistent with that NHTSA estimated for US fatality risk per VMT (column A), although we estimate the effects on casualty risk to be more detrimental than the effects on fatality risk, for all vehicle types. The association of footprint reduction also is similar, with 13-state casualty risk per VMT slightly more beneficial than US fatality risk per VMT for cars and CUVs/minivans, while 13-state casualty risk is substantially more detrimental than US casualty risk for light-duty trucks.

vi
Table ES.1. Estimated effect of mass or footprint reduction on two components of 13- state fatality and casualty risk per VMT: crash frequency (crashes per VMT) and crashworthiness/compatibility (risk per crash)
Variable Case vehicle type A
. NH
TSA
US
fata
litie
s per
VM
T
B. 1
3-st
ate
cras
hes
per V
MT
C. 1
3-st
ate
fata
litie
s pe
r cra
sh
D. 1
3-st
ate
fata
litie
s pe
r VM
T
E. 1
3-st
ate
cras
hes
per
VM
T
F. 1
3-st
ate
casu
altie
s pe
r cra
sh
G. 1
3-st
ate
casu
altie
s pe
r VM
T
Mass reduction
Cars < 3106 lbs 1.55%* 2.00% -0.54% 1.42% 2.00% 0.09% 1.86% Cars > 3106 lbs 0.51% 1.50% -2.39% -1.07% 1.50% -0.77% 0.73% LTs < 4594 lbs 0.52% 1.44% -1.61% -0.13% 1.44% -0.11% 1.55% LTs > 4594 lbs -0.34% 0.94% -1.25% -0.34% 0.94% -0.62% -0.04% CUV/ minivan -0.38% 0.95% 0.98% 1.60% 0.95% -0.16% 0.10%
Footprint reduction
Cars 1.87% 0.64% 0.92% 2.11% 0.64% 0.23% 1.54% LTs -0.07% 1.04% 0.48% 1.64% 1.04% -0.25% 0.94% CUV/ minivan 1.72% -0.55% -1.67% -1.24% -0.55% 0.56% 1.54%
* Based on NHTSA’s estimation of uncertainty using a jack-knife method, only mass reduction in cars less than 3,106 lbs has a statistically significant effect on US fatality risk. Estimates that are statistically significant at the 95% level are shown in red. In contrast with NHTSA’s estimates on US fatality risk per VMT (column A), mass reduction is estimated to reduce casualty risk per crash (column F) for four of the five vehicle types, with two of these four reductions estimated to be statistically significant. Mass reduction is associated with a small but insignificant increase in casualty risk per crash for lighter cars. And footprint reduction is associated with much smaller, and not statistically significant, estimated increases in casualty risk per crash (column F) than in US fatality risk per VMT (column A). Many of the control variables included in the logistic regressions are statistically significant, and have a large effect on fatality or casualty risk per crash, in some cases one to two orders of magnitude larger. However, the estimated association of these variables with risks per crash are not as large as their estimated association with fatality risk per VMT. While the estimated effect of mass reduction may result in a statistically-significant increase in risk in certain cases, the increase is small and is overwhelmed by other known vehicle, driver, and crash factors. ABS and ESC in cars are estimated to reduce crash frequency more than risk per crash, as expected, while AWD in light trucks and CUVs/minivans is estimated to increase crash frequency more than risk per crash. Two-door cars and the side airbag variables in cars have a larger effect on risk given a crash than on crash frequency; two-door cars increase risks per crash, while side airbags decrease risks per crash. The driver age variables estimate that crash frequency consistently increases for the youngest and oldest drivers, and that risk per crash consistently increases for the two oldest groups of drivers (over 50 years old). All of these results are expected. On the other hand, there are several unexpected results: side airbags in light trucks and CUVs/minivans are estimated to reduce crash frequency; ESC and ABS are estimated to reduce risk once a crash has occurred; and AWD and brand new vehicles are estimated to increase risk

vii
once a crash has occurred. In addition, male drivers are estimated to have essentially no effect on crash frequency, but are associated with a statistically significant increase in fatality risk once a crash occurs. And driving at night, on high-speed or rural roads, are associated with higher increases in risk per crash than on crash frequency. These unexpected results suggest that important control variables are not being included in the regression models. For example, crashes involving male drivers, in vehicles equipped with AWD, or that occur at night on rural or high-speed roads, may not be more frequent but rather more severe than other crashes, and thus lead to greater fatality or casualty risk. And drivers who select vehicles with certain safety features may tend to drive more carefully, resulting in vehicle safety features designed to improve crashworthiness or compatibility, such as side airbags, being also associated with lower crash frequency. In contrast with NHTSA’s results for US fatalities per VMT, allowing footprint to vary along with weight results in little change in the estimated effect of mass reduction on casualty risk per crash than when footprint is held constant; however, the estimated detrimental effect of mass reduction on casualty risk per crash in lighter cars is increased just enough to make it statistically significant. When mass is allowed to vary along with footprint, footprint reduction is estimated to be slightly more beneficial for cars and light trucks (Alternative 3 in Table ES.2; further addressed in Section 3 of this report). As with NHTSA’s analysis of fatality risk per VMT, lower mass is not consistently associated with increased casualty risk per crash across all footprint deciles for any combination of vehicle type and crash type. Lower mass is associated with increased casualty risk per crash in a majority of footprint deciles for 9 of the 27 crash and vehicle combinations, but few of these increases are statistically significant. On the other hand, lower mass is associated with decreased risk in a majority of footprint deciles for 12 of the 27 crash and vehicle combinations. Similar to our findings on US fatality risk per VMT, after accounting for all of the control variables in the logistic regression model, except for vehicle mass and footprint, we find that the correlation between mass and the casualty risk per crash by vehicle model is very low. There also is no significant correlation between the residual, unexplained risk and vehicle weight. These results corroborate our earlier finding that, even after accounting for many vehicle, driver, and crash factors, the variation in risk by vehicle model is quite large and unrelated to vehicle weight (addressed in more detail in Section 4). The large remaining unexplained variation in risk by vehicle model could be attributable to other differences in vehicle design, or how drivers who select certain vehicles drive them. It is possible that including variables that account for these factors in the regression models would change the estimated relationship between mass or footprint and risk. Other changes in the data and variables used in the regression models result in changes in the estimated effect of mass or footprint reductions on casualty risk per crash, as summarized in Tables ES.2 and ES.3. For example:
• Regression analyses using police-reported crash data from states must use control variables
to account for differences in definitions of “serious” or “incapacitating” injuries, and reporting requirements, across states. Removing the 12 state control variables results in a large reduction in estimated casualty risk per crash from mass reduction in all five vehicle

viii
types, a large increase in estimated risk from footprint reduction in cars and CUVs/minivans, and a small reduction in estimated risk from footprint reduction in light trucks (Alternative 4 in Table ES.2). Including only two variables to control for states with high and low casualty risk per crash substantially reduces the estimated effect of mass and footprint reduction on casualty risk (Alternative 5 in Table ES.2), while including the 12 control variables for individual states reduces the estimated effect a little bit more. These results indicate that excluding control variables for the state in which a crash occurred from a regression model using state police-reported crash data can give inaccurate estimates of the effect of mass or footprint reduction on casualty risk per crash (addressed in Section 5.1).
• Calculating risk as casualty crashes, rather than total casualties, per crash results in little
change in the association between mass or footprint and risk, but does increase the small estimated detrimental effect of footprint reduction in cars on risk, and makes it statistically significant (Alternative 6 in Table ES.2; addressed in Section 5.2).
• Adding control variables for vehicle manufacturer estimates that lower mass is associated
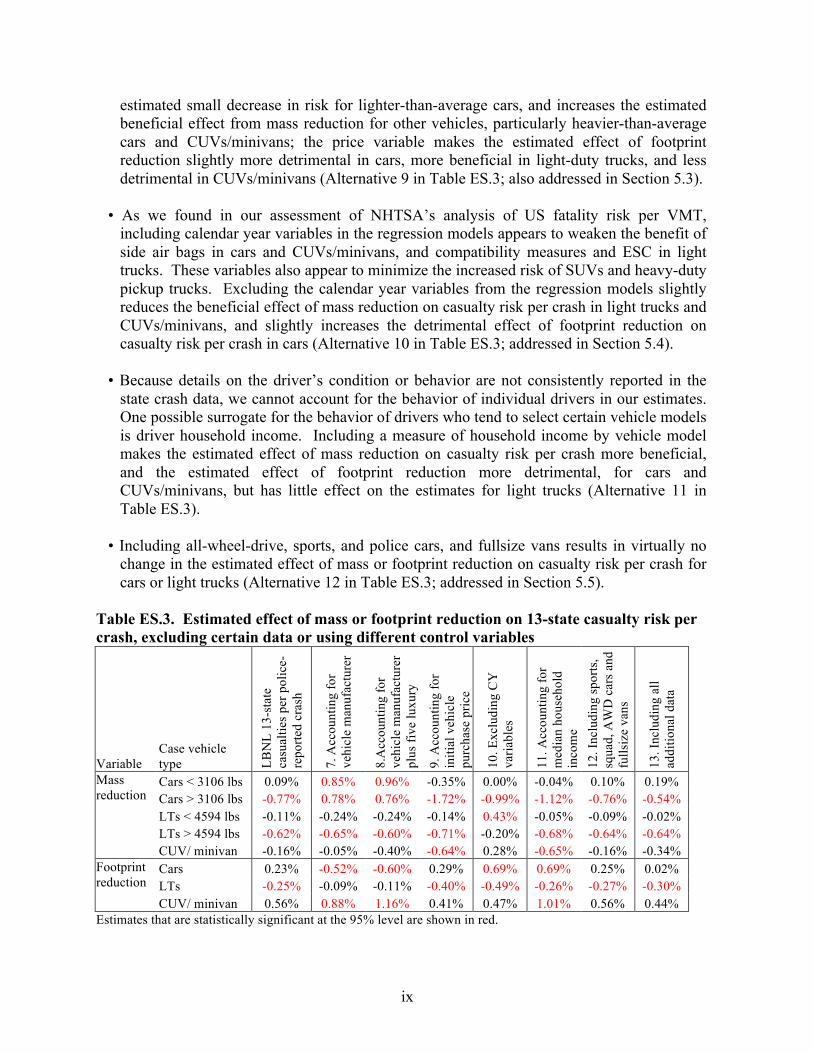
with higher casualty risk per crash for cars, with little effect on the estimates for light trucks and CUVs/minivans. Accounting for vehicle manufacturer turns the small estimated increase in casualty risk per crash from footprint reduction in cars to a small decrease in risk, and slightly increases the estimated casualty risk per crash in light trucks and CUVs/minivans (Alternative 7 in Table ES.3). Also including control variables for five luxury vehicle makes has little effect on the estimated relationships between mass or footprint and casualty risk per crash (Alternative 8 in Table ES.3; addressed in Section 5.3).
Table ES.2. Estimated effect of mass or footprint reduction on 13-state casualty risk per crash, under alternative regression model specifications
Variable Case vehicle type LB
NL
13-s
tate
ca
sual
ties p
er p
olic
e-re
porte
d cr
ash
1. S
ingl
e re
gres
sion
m
odel
for a
ll cr
ash
type
s
2. W
eigh
ted
by
curr
ent d
istri
butio
n
of fa
talit
ies
3. E
xclu
ding
fo
otpr
int
or w
eigh
t
4. E
xclu
ding
stat
e co
ntro
l var
iabl
es
5. In
clud
ing
only
tw
o st
ate
cont
rol
varia
bles
6. C
asua
lty c
rash
es
per c
rash
Mass reduction
Cars < 3106 lbs 0.09% 0.07% 0.08% 0.25% -0.64% -0.13% 0.30% Cars > 3106 lbs -0.77% -0.87% -0.86% -0.61% -1.68% -1.19% -0.63% LTs < 4594 lbs -0.11% -0.11% -0.09% -0.38% -0.21% -0.15% -0.04% LTs > 4594 lbs -0.62% -0.74% -0.67% -0.78% -1.84% -0.75% -0.61% CUV/ minivan -0.16% -0.31% -0.26% 0.13% -2.09% -0.47% -0.21%
Footprint reduction
Cars 0.23% 0.50% 0.41% -0.10% 1.52% 0.45% 0.34% LTs -0.25% 0.05% -0.13% -0.49% -1.05% -0.30% -0.05% CUV/ minivan 0.56% 0.68% 0.75% 0.56% 3.79% 0.69% 0.80%
Estimates that are statistically significant at the 95% level are shown in red.
• An alternative to control variables for vehicle manufacturers is a single continuous variable for the vehicle’s initial purchase price; purchase price may better account for other differences in vehicle design that may influence traffic safety. Adding this single variable turns the estimated small increase in casualty risk per crash from mass reduction into an
ix
estimated small decrease in risk for lighter-than-average cars, and increases the estimated beneficial effect from mass reduction for other vehicles, particularly heavier-than-average cars and CUVs/minivans; the price variable makes the estimated effect of footprint reduction slightly more detrimental in cars, more beneficial in light-duty trucks, and less detrimental in CUVs/minivans (Alternative 9 in Table ES.3; also addressed in Section 5.3).
• As we found in our assessment of NHTSA’s analysis of US fatality risk per VMT,
including calendar year variables in the regression models appears to weaken the benefit of side air bags in cars and CUVs/minivans, and compatibility measures and ESC in light trucks. These variables also appear to minimize the increased risk of SUVs and heavy-duty pickup trucks. Excluding the calendar year variables from the regression models slightly reduces the beneficial effect of mass reduction on casualty risk per crash in light trucks and CUVs/minivans, and slightly increases the detrimental effect of footprint reduction on casualty risk per crash in cars (Alternative 10 in Table ES.3; addressed in Section 5.4).
• Because details on the driver’s condition or behavior are not consistently reported in the
state crash data, we cannot account for the behavior of individual drivers in our estimates. One possible surrogate for the behavior of drivers who tend to select certain vehicle models is driver household income. Including a measure of household income by vehicle model makes the estimated effect of mass reduction on casualty risk per crash more beneficial, and the estimated effect of footprint reduction more detrimental, for cars and CUVs/minivans, but has little effect on the estimates for light trucks (Alternative 11 in Table ES.3).
• Including all-wheel-drive, sports, and police cars, and fullsize vans results in virtually no
change in the estimated effect of mass or footprint reduction on casualty risk per crash for cars or light trucks (Alternative 12 in Table ES.3; addressed in Section 5.5).
Table ES.3. Estimated effect of mass or footprint reduction on 13-state casualty risk per crash, excluding certain data or using different control variables
Variable Case vehicle type LB
NL
13-s
tate
ca
sual
ties p
er p
olic
e-re
porte
d cr
ash
7. A
ccou
ntin
g fo
r ve
hicl
e m
anuf
actu
rer
8.A
ccou
ntin
g fo
r ve
hicl
e m
anuf
actu
rer
plus
five
luxu
ry
bran
ds
9. A
ccou
ntin
g fo
r in
itial
veh
icle
pu
rcha
se p
rice
10. E
xclu
ding
CY
va
riabl
es
11. A
ccou
ntin
g fo
r m
edia
n ho
useh
old
inco
me
12. I
nclu
ding
spor
ts,
squa
d, A
WD
car
s and
fu
llsiz
e va
ns
13. I
nclu
ding
all
addi
tiona
l dat
a
Mass reduction
Cars < 3106 lbs 0.09% 0.85% 0.96% -0.35% 0.00% -0.04% 0.10% 0.19% Cars > 3106 lbs -0.77% 0.78% 0.76% -1.72% -0.99% -1.12% -0.76% -0.54% LTs < 4594 lbs -0.11% -0.24% -0.24% -0.14% 0.43% -0.05% -0.09% -0.02% LTs > 4594 lbs -0.62% -0.65% -0.60% -0.71% -0.20% -0.68% -0.64% -0.64% CUV/ minivan -0.16% -0.05% -0.40% -0.64% 0.28% -0.65% -0.16% -0.34%
Footprint reduction
Cars 0.23% -0.52% -0.60% 0.29% 0.69% 0.69% 0.25% 0.02% LTs -0.25% -0.09% -0.11% -0.40% -0.49% -0.26% -0.27% -0.30% CUV/ minivan 0.56% 0.88% 1.16% 0.41% 0.47% 1.01% 0.56% 0.44%
Estimates that are statistically significant at the 95% level are shown in red.

x
• Adding data from three additional states, including vehicles with unreported model year, correcting VIN transcription errors, and expanding the analysis to calendar years 2000, 2001, and 2008, increases the number of state crash records by about 40 percent. Including these data in the regression analyses makes the estimated effect of mass reduction in cars and lighter light trucks more detrimental, and in CUVs/minivans more beneficial. Including these data slightly reduces the estimated detrimental effect of footprint reduction on casualty risk per crash in cars and CUVs/minivans. However, increasing the sample size included in the regression analysis by 40% does not noticeably reduce the confidence intervals around the point estimates (Alternative 13 in Table ES.3; addressed in Section 5.6).
Table ES.4 shows the results of additional sensitivity tests NHTSA conducted in response to comments from peer reviewers of its preliminary 2011 report. Replacing vehicle footprint with its two components, track width and wheelbase, increases the estimated beneficial effect of mass reduction on casualty risk per crash, making it statistically significant for four of the five vehicle types, as shown in Alternative 14. Decreasing track width is associated with a significant increase in casualty risk per crash, while decreasing wheelbase is associated with a small decrease in risk. Weighting the distribution of fatalities in CUVs and minivans by their respective shares of sales in 2010 (which reflects more CUVs and fewer minivans) has little effect on the estimated effects (Alternative 15). Alternative 16 removes non-significant control variables from each of the regression models, which results in only small changes in the estimated effects. Table ES.4. Estimated effect of mass or footprint reduction on 13-state casualty risk per crash, alternative regression model specifications suggested by NHTSA peer reviewers
Variable Case vehicle type LB
NL
13-s
tate
cas
ualti
es
per p
olic
e-re
porte
d cr
ash
14. I
nclu
ding
trac
k
wid
th a
nd w
heel
base
in
stea
d of
foot
prin
t
15. R
ewei
ghtin
g C
UV
s an
d m
iniv
ans b
y 20
10
sale
s
16. E
xclu
ding
non
-si
gnifi
cant
con
trol
varia
bles
Mass reduction
Cars < 3106 lbs 0.09% -0.37% 0.09% 0.17% Cars > 3106 lbs -0.77% -1.05% -0.77% -0.58% LTs < 4594 lbs -0.11% -0.40% -0.11% -0.24% LTs > 4594 lbs -0.62% -0.75% -0.62% -0.68% CUV/ minivan -0.16% -0.34% -0.24% -0.03%
Footprint reduction
Cars 0.23% — 0.23% 0.11% LTs -0.25% — -0.25% -0.15% CUV/ minivan 0.56% — 0.53% 0.64%
Track width reduction
Cars — 2.58% — — LTs — 0.40% — — CUV/ minivan — 2.10% — —
Wheel base reduction
Cars — -0.59% — — LTs — -0.15% — — CUV/ minivan — -0.33% — —
Estimates that are statistically significant at the 95% level are shown in red.

xi
In conclusion, casualty risk per crash is not necessarily a better metric than fatality risk per VMT for evaluating the effect of mass or footprint reduction on risk; rather, it provides a different perspective in assessing the benefits or drawbacks of mass and footprint reduction on safety in vehicles. However, it does allow the risk per VMT to be separated into its two components, crash frequency and risk per crash. Our analysis indicates that much of the estimated detrimental effect of mass or footprint reduction on risk can be attributed to the tendency for crash frequency, rather than crashworthiness/compatibility (risk once a crash has occurred), to increase as vehicle mass or footprint decreases. As with our analysis of US fatalities per VMT, this report concludes that the estimated effect of mass reduction on casualty risk per crash is small, and is overwhelmed by other control variables, such as vehicle type, specific safety technologies, and crash conditions such as whether the crash occurred at night, in a rural county, or on a high-speed road. This report indicates that the effects are sensitive to what variables and data are included in the regression analysis. Finally, as in our analysis of US fatality risk per VMT, this report shows that after accounting for many vehicle, driver, and crash variables there remains a wide variation in casualty risk per crash by vehicle make and model, and this variation is unrelated to vehicle mass. Although the purpose of the NHTSA and LBNL reports is to estimate the effect of vehicle mass reduction on societal risk, this is not exactly what the regression models are estimating. Rather, they are estimating the recent historical relationship between mass and risk, after accounting for most measurable differences between vehicles, drivers, and crash times and locations. In essence, the regression models are comparing the risk of a 2600-lb Dodge Neon with that of a 2500-lb Honda Civic, after attempting to account for all other differences between the two vehicles. The models are not estimating the effect of literally removing 100 lbs from the Neon, leaving everything else unchanged. In addition, the analyses are based on the relationship of vehicle mass and footprint on risk for recent vehicle designs (model year 2000 to 2007). These relationships may or may not continue into the future as manufacturers utilize new vehicle designs and incorporate new technologies, such as more extensive use of strong lightweight materials and specific safety technologies. Therefore, throughout this report we use the phrase “the estimated effect of mass (or footprint) reduction on risk” as shorthand for “the estimated change in risk as a function of its relationship to mass (or footprint) for vehicle models of recent design.”

xii

xiii
Table of Contents
Acknowledgements .......................................................................................................................... i Executive Summary ....................................................................................................................... iii Table of Contents ........................................................................................................................ xiii List of Tables and Figures ........................................................................................................... xiii 1. Introduction ................................................................................................................................. 1
1.1. Expected relationships between vehicle mass, size and fatality risk .................................... 3 2. 13-state fatality and casualty risk per crash ................................................................................. 4
2.1. Data and methods ................................................................................................................. 5 2.2. Accounting for the state in which the crash occurred ........................................................ 11 2.3. Effect of mass and footprint reduction on fatality and casualty risk per crash .................. 13
3. Multi-collinearity between vehicle mass and footprint ............................................................. 33 4. Casualty risk by vehicle model .................................................................................................. 40 5. Sensitivity of 13-state casualty risk per crash results to data used and model specification ..... 52
5.1. State control variables ........................................................................................................ 52 5.2. Alternative measure of risk ................................................................................................ 53 5.3. Vehicle manufacturer ......................................................................................................... 53 5.4. Calendar year variables ...................................................................................................... 56 5.5. Effect of household income ................................................................................................ 60 5.6. Effect of including sports, police, and all-wheel drive cars, and fullsize vans .................. 61 5.7. Effect of adding additional data ......................................................................................... 62 5.8. Effect of changes suggested by NHTSA peer reviewers .................................................... 64
6. Conclusions ............................................................................................................................... 66 7. References ................................................................................................................................. 75
List of Tables and Figures Table ES.1. Estimated effect of mass or footprint reduction on two components of 13- state fatality and casualty risk per VMT: crash frequency (crashes per VMT) and crashworthiness/compatibility (risk per crash) ............................................................................... vi Table ES.2. Estimated effect of mass or footprint reduction on 13-state casualty risk per crash,
under alternative regression model specifications ............................................................... viii Table ES.3. Estimated effect of mass or footprint reduction on 13-state casualty risk per crash,
excluding certain data or using different control variables .................................................... ix Table ES.4. Estimated effect of mass or footprint reduction on 13-state casualty risk per crash,
alternative regression model specifications suggested by NHTSA peer reviewers ................ x Table 2.1. Control variables used in regression models, by subject vehicle type ........................... 7 Table 2.2. Fatal and casualty crash involvements for model year 2000 to 2007 passenger cars in
2002 to 2008 ............................................................................................................................ 8 Figure 2.1. Distribution of crash-involved vehicles, by vehicle and crash type .............................. 9 Figure 2.2. Driver fatality risk per 100,000 crashes in 16 states ................................................... 12 Figure 2.3. Driver casualty risk per 10,000 crashes in 16 states ................................................... 12 Figure 2.4. Percent of police-reported crashes that are non-injury crashes, in 16 states ............... 13
xiv
Figure 2.5. Estimated effect of mass or footprint reduction on three types of risk, by vehicle type ............................................................................................................................................... 15
Figure 2.6. Estimated effect of mass or footprint reduction on three types of risk per VMT, by vehicle type ............................................................................................................................ 17
Figure 2.7. Estimated effect of mass or footprint reduction on crashes per VMT (vehicle crash frequency), fatalities per crash (vehicle crashworthiness/compatibility), and fatalities per VMT, by vehicle type ............................................................................................................ 18
Figure 2.8. Estimated effect of mass or footprint reduction on crashes per VMT (vehicle crash frequency), casualties per crash (vehicle crashworthiness/compatibility), and casualties per VMT, by vehicle type ............................................................................................................ 19
Figure 2.9. One-vehicle, non-injury crashes and all crashes per VMT, by vehicle type ............... 20 Figure 2.10. Estimated effect of mass or footprint reduction on fatalities per crash and per serious
crash, by vehicle type ............................................................................................................ 21 Figure 2.11. Estimated effect of mass or footprint reduction on 13-state casualty risk per crash by
vehicle type, across all crash types and weighted average effect in each type of crash ........ 22 Figure 2.12. Estimated effect of mass or footprint reduction on 13-state casualty risk per crash in
cars, by type of crash ............................................................................................................. 23 Figure 2.13. Estimated effect of mass or footprint reduction on 13-state casualty risk per crash in
light trucks, by type of crash ................................................................................................. 24 Figure 2.14. Estimated effect of mass or footprint reduction on 13-state casualty risk per crash in
CUVs/minivans, by type of crash .......................................................................................... 25 Table 2.3. Estimated effect of mass or footprint reduction on 13-state casualty risk per crash, by
type of crash .......................................................................................................................... 25 Table 2.4. Estimated effect of variables on US fatality risk, 13-state fatality risk, and 13-state
casualty risk per VMT ........................................................................................................... 27 Table 2.5. Estimated effect of variables on US fatality risk per VMT, and 13-state fatality risk
and 13-state casualty risk per crash ....................................................................................... 28 Table 2.6. Estimated effect of variables on crashes per VMT, fatalities per crash, and casualties
per crash, using data from 13 states ....................................................................................... 31 Figure 3.1. Correlation between vehicle curb weight and footprint, by vehicle model and three
vehicle types .......................................................................................................................... 34 Figure 3.2. Correlation between vehicle curb weight and footprint, by vehicle model and seven
vehicle types .......................................................................................................................... 34 Table 3.1. Correlation coefficients and variance inflation factors of curb weight with footprint,
by vehicle type ....................................................................................................................... 35 Figure 3.3. Estimated effect of reduction in mass or footprint on 13-state casualty risk per crash,
by vehicle type: holding footprint constant, allowing footprint to vary with mass, and allowing mass to vary with footprint ..................................................................................... 36
Figure 3.4. Range in curb weight for the footprint deciles, by vehicle type ................................. 37 Table 3.2. Number of footprint deciles in which lower mass is associated with increasing or
decreasing 13-state casualty risk per crash, by vehicle and crash type ................................. 38 Figure 3.5. Estimated effect of car mass reduction on 13-state casualty risk per crash, by
footprint decile and crash type .............................................................................................. 39 Figure 3.6. Estimated effect of light truck mass reduction on 13-state casualty risk per crash, by
footprint decile and crash type .............................................................................................. 39

xv
Figure 3.7. Estimated effect of CUV/minivan mass reduction on 13-state casualty risk per crash, by footprint decile and crash type ......................................................................................... 40
Figure 4.1. Relationship between 13-state casualty risk per crash and curb weight, with vehicles grouped into 100-lb increments of curb weight, by vehicle type .......................................... 41
Figure 4.2. Relationship between 13-state casualty risk per crash and curb weight, with vehicles grouped into 100-lb increments of curb weight, passenger cars ........................................... 41
Figure 4.3. Relationship between 13-state casualty risk per crash and curb weight, with vehicles grouped into 100-lb increments of curb weight, light trucks ................................................ 42
Figure 4.4. Relationship between 13-state casualty risk per crash and curb weight, with vehicles grouped into 100-lb increments of curb weight, CUVs and minivans .................................. 42
Figure 4.5. Relationship between 13-state casualty risk per crash and curb weight for minivans, by average risk for 100-lb increments of curb weight and individual models ...................... 43
Figure 4.6. Relationship between 13-state casualty risk per crash in crashes with stationary objects and curb weight, by vehicle type ............................................................................... 44
Table 4.1. Correlation between risk and a decrease in curb weight, for vehicles grouped in 100-lb curb weight bins .................................................................................................................... 44
Figure 4.7. 13-state casualty risk per crash and curb weight, by vehicle model ........................... 45 Figure 4.8. Predicted 13-state casualty risk per crash after accounting for all driver, crash, and
vehicle variables except mass and footprint, vs. curb weight ............................................... 46 Figure 4.9. Residual 13-state casualty risk per crash after accounting for all driver, crash, and
vehicle variables except mass and footprint, vs. curb weight ............................................... 47 Table 4.2. Relationship between actual, predicted, and residual 13-state casualty risk per crash,
and vehicle mass reduction, after accounting for all driver, crash, and vehicle variables except mass and footprint, by vehicle type and model .......................................................... 48
Table 4.3. Relationship between actual, predicted, and residual 13-state casualty risk per crash, and vehicle footprint reduction, after accounting for all driver, crash, and vehicle variables except mass and footprint, by vehicle type and model .......................................................... 48
Table 4.4. Relationship between frequency of one-vehicle non-rollover crashes and household income, vehicle mass, and initial vehicle purchase price, by vehicle type and model .......... 50
Figure 4.10. Estimated effect of mass or footprint reduction on 13-state crashes per VMT, after accounting for vehicle purchase price or median household income, by vehicle type ......... 51
Figure 5.1. Estimated effect of mass or footprint reduction on 13-state casualty risk per crash by vehicle type, under two methods of controlling for the state in which the crash occurred ... 52
Figure 5.2. Estimated effect of mass or footprint reduction on 13-state casualties and casualty crashes per crash, by vehicle type ......................................................................................... 53
Figure 5.3. Estimated effect of mass or footprint reduction on 13-state casualty risk per crash by vehicle type, after controlling for vehicle manufacturer ....................................................... 54
Figure 5.4. Estimated effect of mass or footprint reduction on US fatalities per VMT, after controlling for vehicle manufacturer or for initial vehicle purchase price, by vehicle type .. 55
Figure 5.5. Estimated effect of calendar year variables on 13-state casualty risk per crash, by vehicle type ............................................................................................................................ 57
Figure 5.6. Estimated effect of calendar year variables on light truck risk, by crash type ............ 57 Figure 5.7. Estimated effect of mass or footprint reduction on 13-state casualty risk per crash by
vehicle type, including and excluding calendar year variables ............................................. 58 Figure 5.8. Estimated effect of selected control variables on car risk, including and excluding
calendar year variables .......................................................................................................... 59

xvi
Figure 5.9. Estimated effect of selected control variables on light truck risk, including and excluding calendar year variables .......................................................................................... 59
Figure 5.10. Estimated effect of selected control variables on CUV/minivan risk, including and excluding calendar year variables .......................................................................................... 60
Figure 5.11. Estimated effect of mass or footprint reduction on 13-state casualties per crash, after controlling for median household income, by vehicle type .................................................. 61
Figure 5.12. Estimated effect of mass and footprint reduction on 13-state casualty risk per crash by vehicle type, after including sports, police, and all-wheel drive cars, and fullsize passenger and cargo vans ...................................................................................................... 62
Figure 5.13. Number of vehicles involved in casualty crashes by vehicle type, using additional state crash data ....................................................................................................................... 63
Figure 5.14. Estimated effect of mass or footprint reduction on casualty risk per crash by vehicle type, using additional state crash data ................................................................................... 64
Figure 5.15. Estimated effect of mass or footprint reduction on casualty risk per crash by vehicle type, replacing footprint with track width and wheelbase ..................................................... 65
Figure 5.16. Estimated effect of mass and footprint reduction on casualty risk per crash, after reweighting CUV/minivan fatalities to 2010 sales and excluding non-significant control variables, by vehicle type ...................................................................................................... 65
Table 6.1. Estimated effect of mass or footprint reduction on two components of 13- state fatality and casualty risk per VMT: crash frequency (crashes per VMT) and crashworthiness/compatibility (risk per crash) ...................................................................... 68
Table 6.2. Estimated effect of mass or footprint reduction on 13-state casualty risk per crash, under alternative regression model specifications ................................................................. 71
Table 6.3. Estimated effect of mass or footprint reduction on 13-state casualty risk per crash, excluding certain data or using different control variables ................................................... 72
Table 6.4. Estimated effect of mass or footprint reduction on 13-state casualty risk per crash, alternative regression model specifications suggested by NHTSA peer reviewers .............. 73
1
1. Introduction NHTSA recently completed a logistic regression analysis updating its 2003 and 2010 studies of the relationship between vehicle mass and US fatality risk per vehicle mile traveled (VMT; Kahane, 2012). The new study updates the previous analyses in several ways: updated FARS data for 2002 to 2008 involving MY00 to MY07 vehicles are used; induced exposure data from police reported crashes in several additional states are added; a new vehicle category for car-based crossover utility vehicles (CUVs) and minivans is created; crashes with other light-duty vehicles are divided into two groups based on the crash partner vehicle’s weight, and a category for all other fatal crashes is added; and new control variables for new safety technologies and designs, such as electronic stability controls (ESC), side airbags, and methods to meet voluntary agreement to improve light truck compatibility with cars, are included. In a companion report (Wenzel, 2012b), we use the updated databases NHTSA has created to replicate their findings on the relationship between vehicle weight, size (actually footprint, or vehicle wheelbase times track width), and US fatality risk per vehicle miles traveled (VMT), for model year 2000 to 2007 light-duty vehicles involved in fatal crashes between 2002 and 2008. The data are examined in slightly different ways, to get a deeper understanding of the relationship between reductions in vehicle mass and footprint, and overall safety. This report compares the logistic regression results of the NHTSA analysis of US fatality risk per VMT with an analysis of 13-state casualty risk per crash. This analysis differs from the NHTSA analysis in two respects: first, it analyzes risk per crash, using data on all police-reported crashes from thirteen states, rather than risk per estimated VMT; and second, it analyzes casualty (fatality plus serious injury) risk, as opposed to fatality risk. There are several good reasons to investigate the effect of mass and footprint reduction on casualty risk per crash. First, risk per VMT, which NHTSA has studied extensively, includes two effects that influence whether a person is killed or seriously injured in a crash: how well a vehicle can be driven (based on its handling, acceleration, and braking capabilities) to avoid being involved in a serious crash (crash avoidance), and, once a serious crash has occurred, how well a vehicle protects its occupants from fatality or serious injury (crashworthiness) as well as the occupants of any crash partner (compatibility). By encompassing both of these aspects of vehicle design, risk per VMT gives a complete picture of how vehicle design can promote, or reduce, road user safety. On the other hand, risk per crash isolates the second of these two safety effects, crashworthiness/compatibility, by examining the effect of mass and footprint reduction on how well a vehicle protects its occupants once a crash occurs. In general, NHTSA safety regulations focus on crashworthiness (e.g. crash test requirements and NCAP star ratings, seatbelt and airbag requirements, and roof crush standards), although some standards require the installation of technologies, such as automated braking systems (ABS) and electronic stability control (ESC), that improve a vehicle’s crash avoidance. Second, estimating risk on a per crash basis requires using data on police-reported crashes from states. Although NHTSA generates a national sample of police-reported crashes, the National Automotive Sampling System, General Estimates System (NASS GES), that can be used to estimate per crash risks on a national basis, the database is relatively small and may be biased

2
towards crashes that occur in relatively urban areas. Only sixteen states currently record the vehicle identification number of all vehicles involved in police-reported crashes, which is necessary to determine the model year, make, and model of each vehicle, in order to assign its correct curb weight, footprint, type, and installed safety features (such as side airbags, ABS, ESC, and all-wheel drive). The sixteen states that report VIN information represent about one-third of the country, so estimating fatality risk per crash from these sixteen states increases the statistical uncertainty of the analysis, relative to that from estimating fatality risk per VMT using all US fatalities.1 Extending the analysis to casualties (fatalities plus serious/incapacitating injuries) reduces the statistical uncertainty of analyzing just fatalities per crash. In addition, a serious incapacitating injury can be just as traumatic to the victim and her family, and costly from an economic perspective, as a fatality. Limiting the analysis to the risk of fatality, which is an extremely rare event, ignores the effect vehicle design may have on reducing the large number of incapacitating injuries that occur each year on the nation’s roadways. In an earlier report LBNL compared fatality risk per vehicle registration-year and casualty risk per crash, using the same database of all police-reported crashes in five states (Wenzel, 2012a). For the most part, the trend in casualty risk by vehicle type is quite similar to that of fatality risk, when vehicle registration-years are used as the measure of exposure, although casualty risks are substantially lower than fatality risks for sports cars and for pickups. The trend in casualty risk by vehicle type is similar regardless of whether vehicle registration years or police-reported crashes are used as the measure of exposure. Casualty risks for subcompact and compact cars are relatively lower per crash than per vehicle, while casualty risks for large and import luxury cars, minivans, large SUVs, and pickups are relatively higher per crash than per vehicle. We accounted for miles driven by vehicle make and model using odometer readings from vehicle emission inspection and maintenance programs in four of the five states. For most vehicle types, adjusting casualty risk per vehicle registration-year for miles driven has little to no effect (although the adjustment does substantially increase casualty risk for sports cars, which are driven many fewer miles than other vehicles, by 30%, and slightly reduces casualty risk for fullsize vans and ¾-ton pickups, which are driven more miles than the average vehicle). In summary, casualty risk per crash is not necessarily a better metric than fatality risk per VMT; rather, it provides a different perspective in assessing the benefits or drawbacks of mass and footprint reduction on safety in vehicles. Unless noted otherwise, all casualty risks in this report are societal risk, including fatalities and serious injuries in the case vehicle and any crash partners, and include not only driver casualties but passenger casualties as well. The section below summarizes the expected relationships between vehicle mass, size and fatality risk. In Section 2 we reproduce the logistic regression models NHTSA used in its analysis of US fatality risk per VMT, and compare the estimated effect of mass and footprint reduction on US fatality risk per VMT, 13-state fatality risk per crash, and 13-state casualty risk per crash. Section 3 examines in more detail the multi-collinearity between vehicle mass and footprint, and
1 This report further limits the analysis to the thirteen states that provide the posted speed limit of the roadway on which the crash occurred, an important variable NHTSA uses in its regression models that approximates the travel speed of the vehicles involved in the crash. In Section 5 we run a sensitivity analysis using data from the three additional states that report VIN but not posted speed limit, using a technique developed by NHTSA to impute the posted speed limit based on the type of roadway on which the crash occurred (NHTSA, 2003).
3
methods to address that multi-collinearity when assessing their effect on casualty risk per crash. In Section 4 we examine the relationship between vehicle mass and casualty risk per crash by vehicle model, before and after accounting for the differences in driver characteristics, crash locations, and other vehicle attributes included in the NHTSA regression models. In Section 5 we test alternative specifications of the regression models, in order to examine the sensitivity of our results to different model specifications, and using additional data. 1.1. Expected relationships between vehicle mass, size and fatality risk In Section 1.5 of its 2011 report, NHTSA describes the hypothetical physical factors of vehicle design that could explain the historical relationship between vehicle mass and societal fatality risk. One would expect lighter vehicles to have higher fatality rates for their own occupants, all else being equal, for several reasons:
• in frontal or rear crashes, light vehicles tend to be smaller than heavy vehicles, and therefore do not have the crush space which protects occupants;
• in two-vehicle crashes, as the mass differential between the two vehicles increases, the delta V (change in velocity) for the lighter vehicle, and therefore the risk to its occupants, increases relative to that of the heavier vehicle.
• in crashes with a stationary object additional mass may be sufficient to knock the object, such as a tree or pole, down, allowing the vehicle to continue moving and reducing its delta V than if it was completely stopped by the object. In a previous study NHTSA estimated that the object is knocked down in about 25% of frontal collisions with stationary objects (Partyka, 1995).
• in crashes with a medium- or heavy-duty truck, additional mass in the light-duty vehicle would transfer more of its momentum to the truck, reducing the delta V of, and fatality risk in, the light vehicle without increasing the risk in the heavier vehicle.
NHTSA notes that accounting for vehicle size in the regression analysis may reduce or eliminate the estimated benefit of additional vehicle mass correlated with additional crush space. And that accounting for societal risks, that is risk of fatality both to the occupants of the subject vehicle and its crash partner, may reduce or eliminate the effect of mass differential in two-vehicle crashes, as increased fatalities in the lighter vehicle may be offset by reduced fatalities in the heavier vehicle. On the other hand, there are situations where lower mass is expected to reduce fatality risk:
• in crashes with an immovable stationary object, reducing the mass of a vehicle while maintaining its crush space and structural strength would lower the kinetic energy of the crash, reducing the amount of energy for the vehicle’s structure to absorb, and likely reducing occupant fatality risk;
• in rollovers, reducing mass without changing the vehicle’s roof structure would reduce the force applied on the roof once a vehicle turns over.
• lower-mass vehicles should respond more quickly to steering, braking, or acceleration, thereby reducing their crash frequency.

4
Changing the size of a vehicle is expected to reduce risk in several ways. Increasing wheelbase or track width, or better yet frontal or side overhang, can increase crush space and reduce risk in all types of crashes. Adding to a vehicle’s track width also increases a vehicle’s static stability, and reduces its propensity to rollover. Changing other vehicle dimensions also can reduce risk. Lowering bumpers or the “average height of force” in larger, heavier vehicles such as pickups and SUVs can make them more compatible with cars, and reduce risk to occupants in crash partner vehicles. Similarly, raising the door sill of a car provides more structure to engage with a bumper of a taller vehicle, such as a pickup or SUV, striking the car in the side. And lowering the center of gravity also is important in increasing stability and preventing rollovers. Finally, strengthening a vehicle’s frontal or side structure can increase the amount of energy it can absorb in all types of crashes; however, increasing frontal stiffness will likely have negative impacts on the occupants of a crash partner in a frontal collision. All of these hypothetical effects of the changes in vehicle mass, footprint, or other dimensions assume no other changes to the vehicle. However, this is rarely the case, as often the source of the additional mass is the installation of a particular safety feature (such as 4-wheel drive or ESC), and manufacturers often make other changes to a vehicle design at the same time they change its mass or footprint. In short, it is possible that other changes in vehicle design, as well as introduction of safety technologies, can mitigate the increase in risk from reducing vehicle mass or footprint. In Section 1.6 NHTSA discusses the issue that, despite their theoretical advantage in terms of handling, braking, and accelerating, small and light vehicles historically have had higher crash and insurance claim frequency per vehicle mile traveled. This discrepancy suggests that small and light vehicles have not been driven as well as larger, heavier ones. NHTSA provides two hypotheses for why this would be the case: that less capable drivers tend to chose smaller and lighter vehicles; and that drivers of more maneuverable smaller and lighter vehicles tend to drive them more recklessly. As an example of the latter, NHTSA cites the high crash rates in vehicles with large engines, which in theory should reduce crash frequency because they allow a vehicle to accelerate out of dangerous situations. In summary, the complexity of the factors in vehicle design and operation makes it extremely difficult to isolate their effect on occupant and societal risk. As NHTSA concludes, “although [the 2010 NHTSA] report and this one both concentrate on the effects of mass and footprint, because that is their purpose, these effects are indeed small relative to design and engineering, which shape a vehicle’s intrinsic safety and also bear indirectly on its fatality rates by influencing what types of drivers choose the vehicle.” 2. 13-state fatality and casualty risk per crash For its analysis of the effect of changes in vehicle mass on US fatality risk per VMT, NHTSA used information on all US traffic fatalities, from the Fatality Analysis Reporting System (FARS). For the measure of exposure, NHTSA used a subset of non-culpable vehicles involved in two-vehicle crashes from police-reported crash data from thirteen states; NHTSA refers to this

5
subset of vehicles as “induced exposure” cases. The induced exposure cases provide information on driver and crash characteristics for vehicles that are not involved in fatal crashes, as in the FARS data. NHTSA developed weighting factors to scale the induced exposure vehicles up to national level vehicle registrations. NHTSA then multiplied the vehicle registration-years by annual vehicle miles traveled (VMT) factors it developed by vehicle type and age, from odometer data provided by RL Polk. For more details on NHTSA’s data and methodology, refer to Kahane, 2011. In this section we use basically the same logistic regression models NHTSA developed for their analysis of US fatality risk per VMT to assess the effect of mass and footprint reduction on 13-state fatality and casualty risk per crash, using data from all police-reported crashes in thirteen states. We also examine in detail the effect mass and footprint reduction have on 13-state casualty risk per crash in each type of crash, as well as the effects the various other vehicle, driver, and crash condition variables have on casualty risk per crash. 2.1. Data and methods For its analysis NHTSA used FARS data on fatal crashes, and police-reported crash data from 13 states, for MY00 to MY07 light-duty vehicles between calendar years 2002 and 2008. NHTSA used a subset of non-culpable vehicles in two-vehicle crashes as a measure of what it calls “induced exposure”; these records provide distributions of on-road vehicles by vehicle year, make, and model, driver age and gender, and crash time and location (day vs. night, rural vs. urban counties, and high-speed roads). Each induced exposure record is then given a registered vehicle weighting factor, so that each induced exposure record represents a number of national vehicle registrations; the sum of the weighting factors equals the number of vehicles registered in the country. Each record is also given a VMT weighting factor, based on vehicle year, make/model, and age, using odometer data provided by R.L. Polk. The data can be used to estimate US fatality risk per registered vehicle or VMT. Please refer to Sections 2.3 through 2.6 of NHTSA 2012 for a more thorough discussion of how the vehicle and VMT weighting factors were derived. NHTSA compiled a database of the following vehicle attributes, by model year, make and model: curb weight and footprint (wheelbase times track width), as well as the presence of all-wheel drive and automated braking systems. NHTSA added several new variables for new safety technologies and designs: electronic stability controls (ESC), four types of side airbags, and two methods to comply with the voluntary manufacturer agreement to better align light truck bumpers to make them more compatible with other types of vehicles. To reflect changes in the vehicle mix since the 2003 study, NHTSA added a third vehicle category, car-based crossover utility vehicles (CUVs) and minivans. It also added two new crash types, for a total of nine: crashes with other light-duty vehicles are divided into two groups based on the crash partner vehicle’s weight, and all other fatal crashes (involving more than two vehicles, etc.). The analysis involves running a logistic regression model with total crash fatalities as the dependent variable for each of the nine crash types and the three vehicle types, for a total of 27 regressions. Because all fatalities in the crash are used, the risks reflect societal risk, rather than just the risk to the occupants of the case vehicle. The induced exposure cases

6
are weighted by the number of vehicle registrations and the annual mileage, so that the models are estimating the effect of changes in the control variables on US fatalities per vehicle mile traveled (VMT). Table 2.1 shows the control variables NHTSA used in its regression models, for each of the case vehicle types. For cars and trucks, NHTSA uses two variables (UNDRWT00, OVERWT00) for vehicle weight, allowing the effect of weight on risk to vary for lighter and heavier cars and trucks. The determination of the two weight classes is based on the average weight for each vehicle type: 3,106 lbs for cars and 4,594 lbs for light-duty trucks. Because there are fewer CUVs and minivans in the database, NHTSA uses a single variable, LBS100, for CUV/minivan weight. As in the 2003 and 2010 analyses, eight variables for driver age and gender are used. In the 2003 analysis, NHTSA excluded the driver airbag control variables in the regressions for rollovers and crashes with pedestrians. In the 2011 analysis, NHTSA includes the control variable ROLLCURT airbags only in the regression models for rollover crashes involving cars or CUVs/minivans; regression models of pedestrian crashes do not include any control variables for airbags; and the control variables for CURTAIN, COMBO, and TORSO airbags are included in regression models for all other crashes involving cars or CUVs/minivans. No airbag variables were included in the regression models for light trucks. Rather than reporting coefficients for the variables of interest (curb weight and footprint) from a single regression model across all crash types, NHTSA reports a weighted average of the coefficients from the nine regression models run for each of the nine crash types. NHTSA uses a “baseline” distribution of fatalities across the crash types, to represent the expected distribution of fatalities in the 2017 to 2025 timeframe of the new CAFE and GHG emission standards. Similar to the 2003 study, NHTSA derives the baseline fatalities from MY04-09 vehicles in crashes between 2004 and 2008. NHTSA then adjusts this baseline distribution downward to account for the assumption that all vehicles in the 2017-2025 timeframe will have ESC installed. The assumptions used for this adjustment are taken from a NHTSA analysis that found that ESC reduces fatal rollovers by 56% in cars and 74% in light trucks; fixed-object impacts by 47% in cars and 45% in light trucks; and other non-pedestrian crashes by 8% in both cars and light trucks.2 These assumptions treat crossover SUVs and minivans as light trucks rather than cars. This “post-ESC” distribution of fatalities by crash type is then multiplied by the regression coefficients for each crash type to create the weighted average effect of each control variable on risk. Table 2.2 shows the baseline distribution of fatalities, by case vehicle type and crash type, which are used to create the overall coefficient estimates weighted by the results from the regressions for each crash type. For our analysis of fatality and casualty risk per crash, we divided all crashes in the 13-state databases into the nine crash categories, and three vehicle types, used by NHTSA in its 2011 study, for the most part using the same criteria. One important difference is that NHTSA considered only “first-events” in classifying one-vehicle crashes as rollovers; vehicles that struck an object (or another vehicle) prior to rolling over are not included in NHTSA’s “rollover” category. However, since all thirteen states do not consistently code “first” vs. “most harmful” 2 Sivinski R. (2011). Update of NHTSA’s 2007 Evaluation of the Effectiveness of Light Vehicle Electronic Stability Control (ESC) in Crash Prevention, NHTSA Technical Report No. DOT HS 811 486. Washington, DC: National Highway Traffic Safety Administration. http://www-nrd.nhtsa.dot.gov/Pubs/811486.pdf.

7
events in the same manner, as is done in FARS, we included all vehicles involved in single-vehicle rollover crashes in our “rollover” category, regardless of whether they struck an object prior to rolling over. Table 2.1. Control variables used in regression models, by subject vehicle type Control variable Cars LTVs CUVs/minivans UNDRWT00 C C OVERWT00 C C LBS100
C
FOOTPRINT C C C TWODOOR D
SUV
D HD_PKP
D
BLOCKER1
D BLOCKER2
D
MINIVAN
D ROLLCURT * C # C # CURTAIN * C # C # COMBO * C # C # TORSO * C # C # ABS C # C # ESC C # C # C # AWD
C # C #
DRVMALE D D D M14_30 C C C M30_50 C C C M50_70 C C C M70_96 C C C F14_30 C C C F30_50 C C C F50_70 C C C F70_96 C C C NITE D D D RURAL D D D SPDLIM55 D D D HIFAT_ST D D D VEHAGE C C C BRANDNEW D D D CY2002 D D D CY2003 D D D CY2004 D D D CY2005 D D D CY2007 D D D CY2008 D D D
C: continuous variable C #: for some models the VIN does not indicate whether a particular vehicle is equipped with that option or not. In
these cases the fraction of that model that is equipped with the particular feature is used. D: dummy variable, coded as either 1 or 0 * The control variable for ROLLCURT airbags is only used in regression models of rollover crashes involving cars
or CUVs/minivans; regression models of pedestrian crashes do not include any control variables for airbags; the control variables for CURTAIN, COMBO, and TORSO airbags are included in regression models for all other crashes involving cars or CUVs/minivans.

8
Table 2.2 and Figure 2.1 compare the distribution of light-duty vehicle crashes in the U.S. from the NHTSA 2011 report with those from the 13 states. Note that there are higher fractions of “other” crashes (that is, crashes involving more than two vehicles, or for which not all information was available) in the 13-state data; for example, 22% of U.S. fatal car crash involvements in FARS are in the “other” category, while 29% of fatality crash involvements, and 32% of casualty crash involvements, in the thirteen states are in the “other” category. The distributions of vehicles involved in crashes in Figure 2.1 exclude the “other” crash category, so that the fractions of all other types of crashes equal 100% for each vehicle type. Table 2.2. Fatal and casualty crash involvements for model year 2000 to 2007 light-duty vehicles in 2002 to 2008, by vehicle type
Crash type
Fatal crash involvements (FARS)
Fatal crash involvements (13 states)
Casualty crash involvements (13 states)
Cars LTVs CUVs/
minivans Cars LTVs CUVs/
minivans Cars LTVs CUVs/
minivans 1: Rollovers 2,709 6,269 660 592 1,271 150 4,106 6,813 832 2: w/object 9,373 7,272 1,319 1,862 1,343 248 13,525 9,699 1,934 3: Ped etc. 6,514 6,493 1,904 2,114 1,751 601 11,430 7,501 3,150 4: w/HDT 3,346 2,371 680 1,005 606 235 4,976 2,973 1,106 5: w/lgt car 4,258 5,667 1,245 1,229 1,328 375 17,064 11,906 4,211 6: w/hvy car 4,746 4,928 1,211 1,063 1,041 324 14,159 9,433 3,380 7: w/lgt LT 3,149 2,670 622 1,153 868 267 13,565 8,667 3,095 8: w/hvy LT 3,622 2,196 685 1,047 526 202 9,025 5,221 2,149 9: Other 10,487 9,407 2,810 4,177 3,364 1,068 41,791 28,304 10,568 Total 48,204 47,273 11,136 14,242 12,098 3,470 129,641 90,517 30,425
1: Rollovers 5.6% 13.3% 5.9% 4.2% 10.5% 4.3% 3.2% 7.5% 2.7% 2: w/object 19.4% 15.4% 11.8% 13.1% 11.1% 7.1% 10.4% 10.7% 6.4% 3: Ped etc. 13.5% 13.7% 17.1% 14.8% 14.5% 17.3% 8.8% 8.3% 10.4% 4: w/HDT 6.9% 5.0% 6.1% 7.1% 5.0% 6.8% 3.8% 3.3% 3.6% 5: w/lgt car 8.8% 12.0% 11.2% 8.6% 11.0% 10.8% 13.2% 13.2% 13.8% 6: w/hvy car 9.8% 10.4% 10.9% 7.5% 8.6% 9.3% 10.9% 10.4% 11.1% 7: w/lgt LT 6.5% 5.6% 5.6% 8.1% 7.2% 7.7% 10.5% 9.6% 10.2% 8: w/hvy LT 7.5% 4.6% 6.2% 7.4% 4.3% 5.8% 7.0% 5.8% 7.1% 9: Other 21.8% 19.9% 25.2% 29.3% 27.8% 30.8% 32.2% 31.3% 34.7% Total 100% 100% 100% 100% 100% 100% 100% 100% 100%
Figure 2.1 shows the same data as Table 2.2 but the percentages are calculated excluding “other” crashes. Figure 2.1 indicates that there is a smaller portion of fatal car crashes with stationary objects, heavy cars, and rollover crashes in the thirteen states (18.5%, 10.6%, and 5.9%, respectively) than in the entire US (24.9%, 12.6%, and 7.2%, respectively). On the other hand, there are more fatal car crashes in crashes with pedestrians/pedalcycles, light cars, light and heavy light-duty trucks, and heavy-duty trucks in the thirteen states (21.0%, 12.2%, 11.5%, 10.4%, and 10.0%, respectively) than in the US (17.3%, 11.3%, 8.3%, 9.6%, and 8.9%, respectively). These trends hold for light trucks and CUVs/minivans as well. In the thirteen states, there are higher fractions of crashes involving rollovers, stationary objects, pedestrians/pedalcycles, and heavy trucks, and fewer crashes with other light-duty vehicles, when the crashes result in a fatality rather than a casualty. This suggests that rollovers and crashes with stationary objects, pedestrians/pedalcycles, and heavy-duty trucks are more likely to

9
result in fatalities, as opposed to incapacitating injuries, than crashes with another light-duty vehicle. The distributions of fatal and casualty crashes involving cars in the thirteen states are quite similar to those involving CUVs and minivans; however, CUVs and minivans tend to be involved in fewer crashes with stationary objects (10.3% of all fatal crashes) than cars (18.5% of all fatal crashes). Light trucks tend to have more fatal/casualty crashes in rollovers and crashes with lighter cars (14.6% and 15.2% of all fatal crashes, respectively) than cars do (5.9%, and 12.2% of all fatal crashes, respectively), but relatively fewer crashes with stationary objects (15.4%, vs. 18.5% for cars) and heavier light trucks (6.9%, vs. 10.0% for cars). Figure 2.1. Distribution of crash-involved vehicles, by vehicle and crash type
Note in Table 2.2 that there are many fewer fatal crash involvements in the thirteen states (e.g., 14,242 cars) than in the US FARS (48,204 cars). Extending the analysis to include incapacitating injuries substantially increases the number of casualty crash involvements in the thirteen states (to 129,641 cars). The focus of this report is on the estimated effect of mass and footprint reduction on casualty risk using data from the thirteen states, although we do compare the effect on fatality risk in the next section. And in Section 5 we analyze the effect of extending the analysis to sixteen states, and adding other crashes to the analysis. To the extent possible, we used the same assumptions as in the NHTSA analysis, in many cases using the same SAS programs. For example, we used the VIN decoder programs developed by NHTSA to determine model year, make, and model of each vehicle in the state crash data, and added detailed vehicle characteristics such as body style, curb weight, footprint, ABS, AWD, passive restraint systems, etc. And we used the NHTSA definitions to classify vehicles into five
7.2% 5.9% 4.7%
16.6% 14.6% 11.0% 7.9% 6.2% 4.2%
24.9% 18.5%
15.4%
19.2% 15.4%
15.6% 15.8%
10.3% 9.7%
17.3%
21.0%
13.0%
17.1% 20.0%
12.1% 22.9%
25.0%
15.9%
8.9% 10.0%
5.7%
6.3% 6.9%
4.8%
8.2% 9.8%
5.6%
11.3% 12.2%
19.4%
15.0% 15.2%
19.1%
15.0% 15.6%
21.2%
12.6% 10.6%
16.1%
13.0% 11.9%
15.2%
14.5% 13.5%
17.0%
8.3% 11.5% 15.4%
7.1% 9.9% 13.9%
7.5% 11.1% 15.6%
9.6% 10.4% 10.3% 5.8% 6.0% 8.4% 8.2% 8.4% 10.8%
0%
10%
20%
30%
40%
50%
60%
70%
80%
90%
100%
Fatality (FARS)
Fatality (13 states)
Casualty (13 states)
Fatality (FARS)
Fatality (13 states)
Casualty (13 states)
Fatality (FARS)
Fatality (13 states)
Casualty (13 states)
Dis
tribu
tion
of c
rash
-invo
lved
veh
icle
s
Distribution of crash-involved vehicles, by crash type
9: Other 8: w/hvy LT 7: w/lgt LT 6: w/hvy car 5: w/lgt car 4: w/HDT 3: Ped etc. 2: w/object 1: Rollovers
Cars Light Trucks CUVs/Minivans

10
types (light cars, heavy cars, light light-duty trucks, heavy light-duty trucks, and CUVs/minivans), as well as the nine types of crashes described above. This was done in order to allow for a more direct comparison of the results from the two studies, as well as with other studies using very similar databases and approaches. However, it was necessary to diverge from the NHTSA analysis in several respects. First, as discussed above, in analyzing the relationship between vehicle mass and US fatality risk per VMT, NHTSA used all US fatalities from FARS, and a subset of non-culpable vehicles in two-vehicle crashes from police-reported crash data from the thirteen states to assign driver and environment control variables to national vehicle registration years (from Polk). NHTSA selected non-culpable vehicles in two-vehicle crashes to determine induced exposure crash involvements. Each of these vehicles was assigned a weight representing the national registration-years for each particular year, make and model. NHTSA developed other weights for total VMT based on a database of vehicle odometer readings by vehicle year, make and model, also obtained from Polk. For a more thorough discussion of how NHTSA derived the vehicle and VMT weighting factors, refer to Sections 2.3 through 2.6 of NHTSA 2012. For our analysis of risk per crash, we use all vehicles in the state databases, including those involved in one-vehicle crashes and the vehicle NHTSA determined to be responsible for the crash in two-vehicle crashes. Therefore both the number of fatalities or casualties, and the number of crashes, come from the same datasets. For our analysis of risk per VMT, we again use the number of fatalities or crashes from the thirteen state databases, coupled with the VMT weights that NHTSA derived from the induced exposure crash involvements, national vehicle registrations, and average vehicle odometer readings. Because NHTSA apparently included all induced exposure involvements in creating their VMT weights, and did not exclude those that resulted in a fatality, we are able to use NHTSA’s VMT weights in our regression models of 13-state risk per VMT. However, NHTSA used national Polk registration data to scale the induced exposure crashes from the thirteen states to the national level. Since we only include casualties occurring in the thirteen states, this scaling is not necessary for our analysis. In the future we hope to obtain VMT weights adjusted to total registration-years in the thirteen states, rather than in the entire US, for our analyses of risk per VMT. Second, as noted above, NHTSA included fatal crash involvements from FARS for 2008, even though 2008 data were available from only six of the thirteen states NHTSA used to develop the induced exposure records. For the remaining seven states, NHTSA assumed the distribution of induced exposure crashes in 2008 were identical to those in 2007.4 2008 crash data for 12 of the 13 states have subsequently become available, so NHTSA has revised its vehicle registration year and miles traveled weights based on actual induced exposure crashes in 12 of the 13 states; however, NHTSA continues to use replicated data for Wyoming crashes in 2008, Pennsylvania crashes in 2002, and Michigan crashes in 2002 and 2003. In our analyses we exclude the vehicle registration-year and miles traveled for these five years with missing data.
4 NHTSA made similar assumptions for years of state crash data that were not available, such as 2002 data from Pennsylvania and 2002 and 2003 data from Michigan.
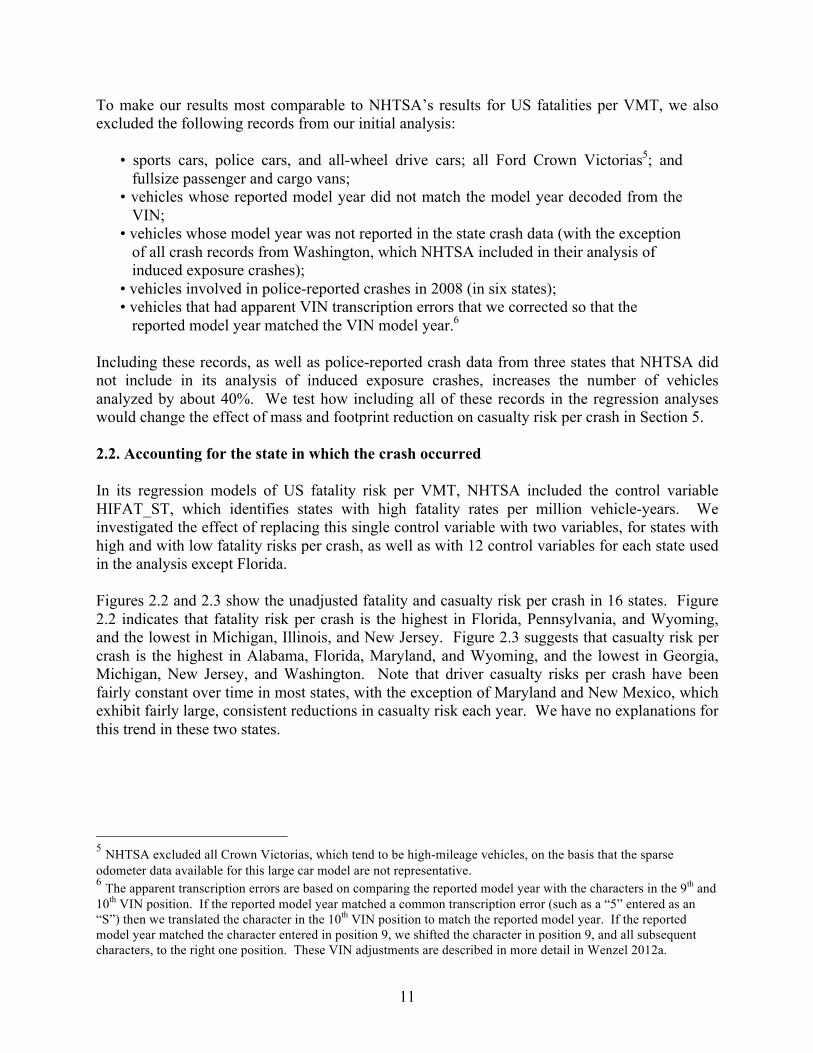
11
To make our results most comparable to NHTSA’s results for US fatalities per VMT, we also excluded the following records from our initial analysis:
• sports cars, police cars, and all-wheel drive cars; all Ford Crown Victorias5; and fullsize passenger and cargo vans;
• vehicles whose reported model year did not match the model year decoded from the VIN;
• vehicles whose model year was not reported in the state crash data (with the exception of all crash records from Washington, which NHTSA included in their analysis of induced exposure crashes);
• vehicles involved in police-reported crashes in 2008 (in six states); • vehicles that had apparent VIN transcription errors that we corrected so that the
reported model year matched the VIN model year.6
Including these records, as well as police-reported crash data from three states that NHTSA did not include in its analysis of induced exposure crashes, increases the number of vehicles analyzed by about 40%. We test how including all of these records in the regression analyses would change the effect of mass and footprint reduction on casualty risk per crash in Section 5. 2.2. Accounting for the state in which the crash occurred In its regression models of US fatality risk per VMT, NHTSA included the control variable HIFAT_ST, which identifies states with high fatality rates per million vehicle-years. We investigated the effect of replacing this single control variable with two variables, for states with high and with low fatality risks per crash, as well as with 12 control variables for each state used in the analysis except Florida. Figures 2.2 and 2.3 show the unadjusted fatality and casualty risk per crash in 16 states. Figure 2.2 indicates that fatality risk per crash is the highest in Florida, Pennsylvania, and Wyoming, and the lowest in Michigan, Illinois, and New Jersey. Figure 2.3 suggests that casualty risk per crash is the highest in Alabama, Florida, Maryland, and Wyoming, and the lowest in Georgia, Michigan, New Jersey, and Washington. Note that driver casualty risks per crash have been fairly constant over time in most states, with the exception of Maryland and New Mexico, which exhibit fairly large, consistent reductions in casualty risk each year. We have no explanations for this trend in these two states.
5 NHTSA excluded all Crown Victorias, which tend to be high-mileage vehicles, on the basis that the sparse odometer data available for this large car model are not representative. 6 The apparent transcription errors are based on comparing the reported model year with the characters in the 9th and 10th VIN position. If the reported model year matched a common transcription error (such as a “5” entered as an “S”) then we translated the character in the 10th VIN position to match the reported model year. If the reported model year matched the character entered in position 9, we shifted the character in position 9, and all subsequent characters, to the right one position. These VIN adjustments are described in more detail in Wenzel 2012a.
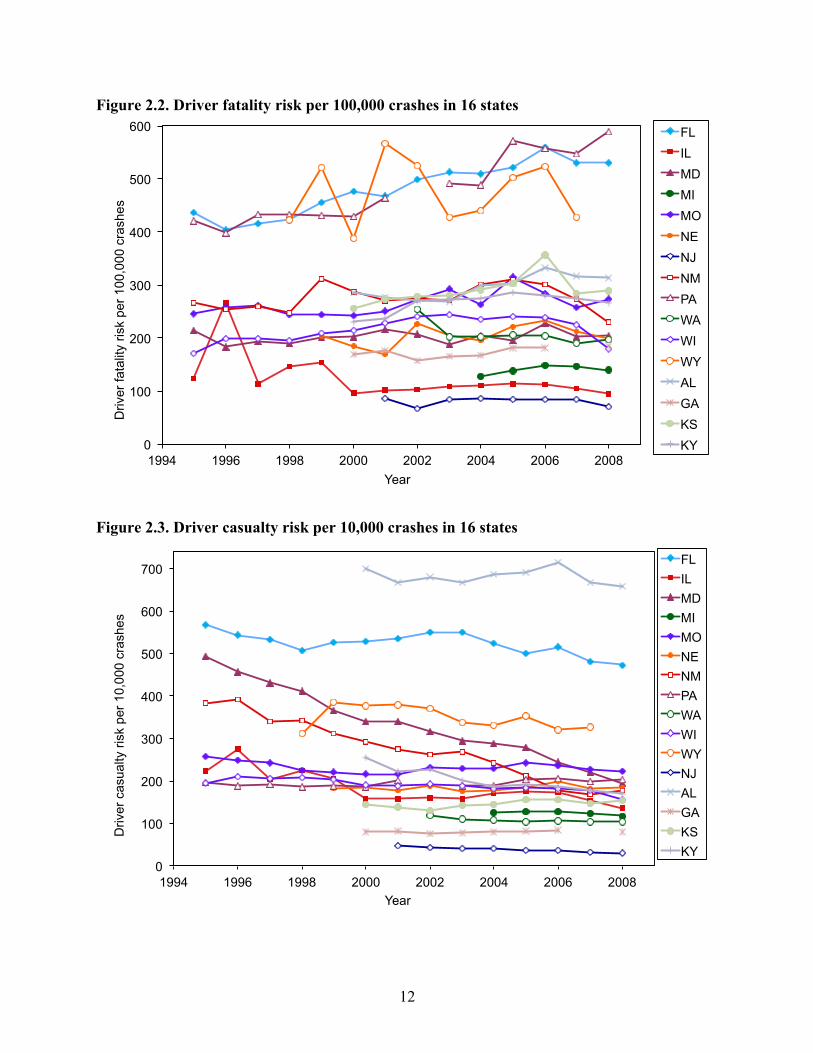
12
Figure 2.2. Driver fatality risk per 100,000 crashes in 16 states
Figure 2.3. Driver casualty risk per 10,000 crashes in 16 states
0
100
200
300
400
500
600
1994 1996 1998 2000 2002 2004 2006 2008
Driv
er fa
talit
y ris
k pe
r 100
,000
cra
shes
Year
Driver fatality risk per 100,000 crashes
FL IL MD MI MO NE NJ NM PA WA WI WY AL GA KS KY
0
100
200
300
400
500
600
700
1994 1996 1998 2000 2002 2004 2006 2008
Driv
er c
asua
lty ri
sk p
er 1
0,00
0 cr
ashe
s
Year
Driver casualty risk per 10,000 crashes
FL IL MD MI MO NE NM PA WA WI WY NJ AL GA KS KY

13
The relatively high or low risks shown for some states in Figures 2.2 and 2.3 do not necessarily reflect more dangerous driving conditions in those states; rather, they reflect either different definitions of “incapacitating”, “serious”, or “major” injuries, or different reporting requirements or reporting bias in those states. For example, Pennsylvania is unique in that it reports “moderate” injuries in addition to “major” and “minor” injury; as a result, there are relatively few “major” injuries reported in Pennsylvania, which increases its casualty risk per crash relative to other states. In Florida, there is no property damage threshold over which a crash is required to be included in the state crash database; in most other states crashes resulting in property damage in excess of $500 must be reported. In Figure 2.4, only about 60% of all crashes in the Florida database are non-injury crashes, whereas 80% to 90% of the crashes in most other states are non-injury crashes. As a result, risks per crash are higher in Florida than in almost any other state. Figure 2.4. Percent of police-reported crashes that are non-injury crashes, in 16 states
Based on Figures 2.2 through 2.4, we replaced the HIFAT_ST variable NHTSA used for analysis of US fatalities per VMT with 12 variables identifying each state except Florida for our analysis of fatality and casualty risks per crash. We examine how replacing the 12 state control variables with only two variables for high- and low-injury states would change the effect of mass and footprint reduction on risk in Section 5. 2.3. Effect of mass and footprint reduction on fatality and casualty risk per crash All of the regression coefficients presented in the NHTSA 2011 report are the direct output from the SAS LOGIST procedure (with the exception of those for the mass and footprint variables UNDRWT00, OVERWT00, LBS100, and FOOTPRNT, which NHTSA often multiplies by -1 so
60%
65%
70%
75%
80%
85%
90%
1994 1996 1998 2000 2002 2004 2006 2008
Per
cent
of a
ll po
lice-
repo
rted
cras
hes
with
no
inju
ries
Year
Percent of police-reported crashes that are non-injury crashes
FL IL MD MI MO NE NM PA WA WI WY NJ AL GA KS KY

14
that they reflect the effect of a reduction in vehicle mass or footprint; we use the same convention throughout this report). The output from the SAS LOGIST procedure reflects the percent change in the log-odds of casualty (or fatality) per crash for a one-unit increase in the explanatory variable. In order to obtain the percent change in the probability of casualty (or fatality) per crash, the SAS outputs need to be converted from log-space to linear space, and from odds to probabilities. We use the conversion factor ex – 1, where x is the logistic regression coefficient from the SAS output, to make this conversion. This conversion has no effect on the output regression coefficients when the change in the log-odds of casualty is small; however it substantially increases the percent change for explanatory variables that have a large effect on the log-odds of casualty (such as the crash location variables). For example, the casualty risk per crash from a lighter-than-average car involved in a rollover crash has a 1.64 times higher log-odds of casualty if it occurs in a rural county; after conversion, this crash has a 416 percent higher probability of casualty if it occurs in a rural county (EXP(1.64) - 1 = 4.16). Unless noted otherwise, the confidence intervals shown in this report are calculated the same way; that is, using the standard error of the log-odds output of the SAS LOGIST procedure to derive the 95% confidence interval of the log-odds coefficient, and to display it as a percent probability interval. Figure 2.5 presents the regression coefficients of the effect of reductions in mass and footprint on US fatality risk per ten billion VMT, from the NHTSA 2011 analysis (in light blue). The coefficients for each of the nine crash types are weighted by the distribution of NHTSA’s estimated 2016 baseline fatal crash involvements, after adjustment for full ESC penetration. The figure indicates that mass reduction is estimated to increase societal7 fatality risk by about one percent for cars and lighter-than-average light trucks, while mass reduction leads to a slight reduction in fatality risk for the heavier light trucks and CUV/minivans. The 95% confidence intervals in the figure indicate that the changes in risk for lighter cars, and both categories of light-duty trucks, are statistically significant. The confidence intervals shown in the figure, and all figures in this report, represent the weighted average standard error from the SAS output, times 1.96. NHTSA does not report these confidence intervals in its 2011 report; rather it uses a jack-knife technique to estimate the range in uncertainty around the point estimates. The resulting confidence intervals are larger than those shown in this report. Figure 2.5 compares the estimated effect of mass and footprint reduction on US fatalities per billion VMT (from NHTSA 2011, in blue) with that on 13-state fatality risk (in red), and 13-state casualty risk (in green), per police-reported crash. The effect for each of the nine crash types is weighted by the expected distribution of fatal or casualty crashes in 2016, after full adoption of ESC, just as in the NHTSA 2011 report. Lower mass in cars and light trucks, while holding footprint constant, is associated with a consistent reduction in state fatality risk per crash; the estimated reductions are statistically significant for all but the lighter cars. Lower mass in CUVs and minivans is associated with a statistically non-significant increase in state fatality risk per crash. Smaller footprint in cars and light trucks is associated with increases in state fatality risk
7 All of the fatality risks reported in the 2011 NHTSA report are societal risk, that is fatalities to all vehicle occupants and non-occupants involved in the crash are included. Unless specified otherwise (i.e. in Section 6, when we examine the effect of side impact airbags on risk to car occupants, and steps manufacturers have taken to improve light truck compatibility on the risk light trucks impose on other vehicle occupants, in two-vehicle crashes), all risks in this report also are societal risk.
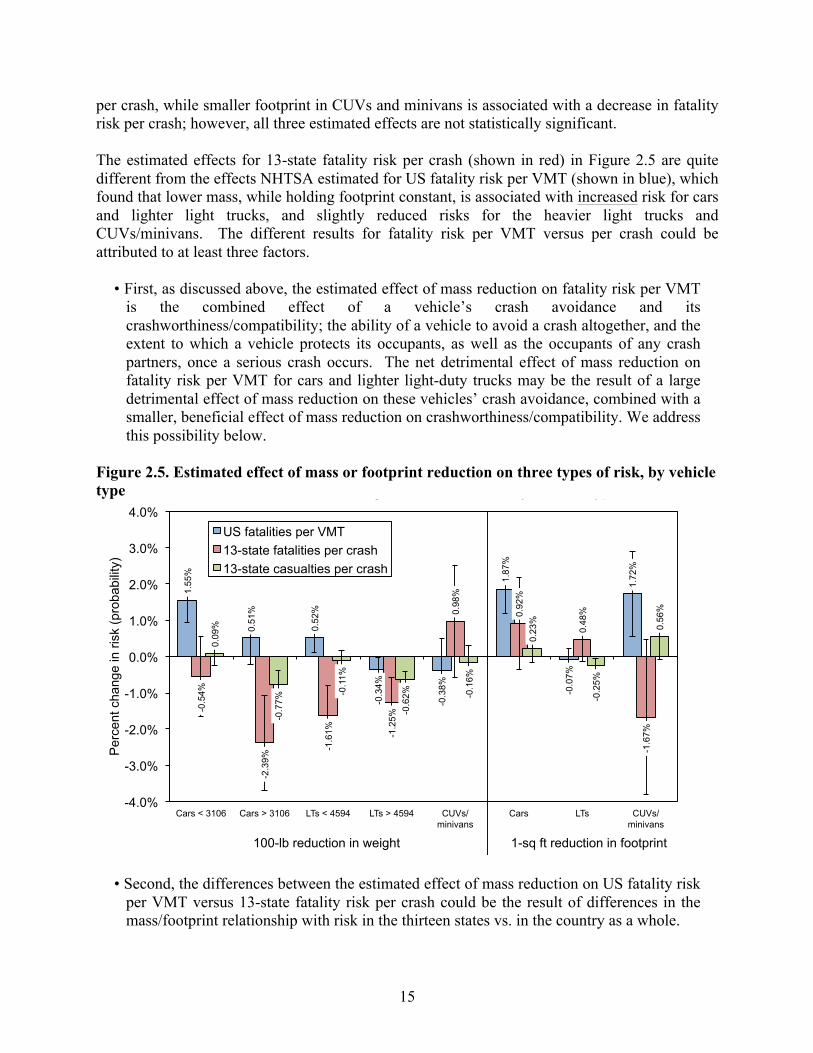
15
per crash, while smaller footprint in CUVs and minivans is associated with a decrease in fatality risk per crash; however, all three estimated effects are not statistically significant. The estimated effects for 13-state fatality risk per crash (shown in red) in Figure 2.5 are quite different from the effects NHTSA estimated for US fatality risk per VMT (shown in blue), which found that lower mass, while holding footprint constant, is associated with increased risk for cars and lighter light trucks, and slightly reduced risks for the heavier light trucks and CUVs/minivans. The different results for fatality risk per VMT versus per crash could be attributed to at least three factors.
• First, as discussed above, the estimated effect of mass reduction on fatality risk per VMT is the combined effect of a vehicle’s crash avoidance and its crashworthiness/compatibility; the ability of a vehicle to avoid a crash altogether, and the extent to which a vehicle protects its occupants, as well as the occupants of any crash partners, once a serious crash occurs. The net detrimental effect of mass reduction on fatality risk per VMT for cars and lighter light-duty trucks may be the result of a large detrimental effect of mass reduction on these vehicles’ crash avoidance, combined with a smaller, beneficial effect of mass reduction on crashworthiness/compatibility. We address this possibility below.
Figure 2.5. Estimated effect of mass or footprint reduction on three types of risk, by vehicle type
• Second, the differences between the estimated effect of mass reduction on US fatality risk per VMT versus 13-state fatality risk per crash could be the result of differences in the mass/footprint relationship with risk in the thirteen states vs. in the country as a whole.
1.55
%
0.51
%
0.52
%
-0.3
4%
-0.3
8%
1.87
%
-0.0
7%
1.72
%
-0.5
4%
-2.3
9% -1
.61%
-1.2
5%
0.98
%
0.92
%
0.48
%
-1.6
7%
0.09
%
-0.7
7% -0.1
1%
-0.6
2%
-0.1
6%
0.23
%
-0.2
5%
0.56
%
-4.0%
-3.0%
-2.0%
-1.0%
0.0%
1.0%
2.0%
3.0%
4.0%
Cars < 3106 Cars > 3106 LTs < 4594 LTs > 4594 CUVs/ minivans
Cars LTs CUVs/ minivans
Per
cent
cha
nge
in ri
sk (p
roba
bilit
y)
Effect of reduction in weight or size on risk, by vehicle type
US fatalities per VMT 13-state fatalities per crash 13-state casualties per crash
100-lb reduction in weight 1-sq ft reduction in footprint

16
• Finally, the differences between fatality risk per VMT and casualty risk per crash could indicate that casualties are much less sensitive to mass reductions than fatalities, and that vehicle mass reduction somehow reduces casualties but not fatalities.
Figure 2.5 indicates that lower vehicle mass is associated with in smaller effects on casualty risk per crash than on fatality risk per crash. Lower mass is associated with small statistically significant reductions in casualty risk per crash for heavier cars and all light trucks, a small but not statistically significant reduction in risk for CUVs/minivans, and a small but not statistically significant increase in risk for lighter cars. Lower footprint also is associated with a smaller effect on casualty risk per crash than on fatality risk per crash, for all three types of vehicles. Figure 2.6 shows the same data as Figure 2.5, but for 13-state fatality and casualty risk per VMT, not per crash, using the VMT weights developed by NHTSA using national registration data and induced exposure crashes in the thirteen states. Comparing Figure 2.6 with Figure 2.5, one sees that the estimated effects of mass and footprint reduction on risk per VMT are quite a bit more detrimental than the estimated effects on risk per crash. The difference is so large that a reduction in risk per crash becomes an increase in risk per VMT, for mass reduction in lighter cars in terms of fatality risk (shown in red, -0.54% in Figure 2.5 to 1.42% in Figure 2.6), and for mass reduction in heavier cars and lighter light-duty trucks in terms of casualty risk (shown in green, -0.77% in Figure 2.5 to 0.73% in Figure 2.6 for heavier cars, and -0.11% in Figure 25 to 1.55% in Figure 2.6 for lighter light-duty trucks). Figure 2.6 also indicates that the estimated effects of mass reduction on fatality risk per VMT from the 13-state data (shown in red) are comparable to NHTSA’s estimated effects on national fatality risk per VMT (shown in blue) for only lighter-than-average cars and heavier-than-average light-duty trucks. For heavier-than-average cars and lighter-than-average light trucks mass reduction is associated with a reduction in fatality risk per VMT using the 13-state data, but with an increase in risk using the US data; for CUVs/minivans mass reduction is associated with an increase in risk using the 13-state data but a decrease in risk using the US data. The estimated effects on casualty risk per VMT from the thirteen states (shown in green) are comparable to the estimated effects on US fatality risk per VMT (shown in blue) for mass reduction in lighter and heavier cars, and heavier light-duty trucks, and for footprint reduction in cars and CUVs/minivans. The estimated increase in fatality risk per VMT from mass reduction in the lighter light trucks is much larger using the 13-state data (1.55%) than NHTSA’s estimate for the US (0.52%). Similarly, the estimated increase in fatality risk from footprint reduction is similar for cars and CUVs/minivans using the 13-state or national data, while the estimate for light trucks is much higher using the 13-state data (0.94%) than NHTSA’s national estimate (-0.07%). The improved similarity in the US and 13-state risks expressed in terms of VMT exposure in Figure 2.6 suggests that the large differences between US fatality risk per VMT and 13-state fatality risk per crash in Figure 2.5 are more the result of changing the measure of exposure from per VMT to per crash, and less because the relationships between mass and footprint reductions and risk in the thirteen states are different from those relationships in the entire US (the second

17
possible explanation for the differences in fatality risk per VMT vs. per crash, summarized above). Figure 2.6. Estimated effect of mass or footprint reduction on three types of risk per VMT, by vehicle type
Figure 2.7 compares the estimated effect of mass and footprint reduction on the two components of risk, the number of crashes per VMT (crash frequency, the inverse of crash avoidance, shown in orange) and the fatality risk per crash (crashworthiness/compatibility, shown in light red), with the estimated effect on fatality risk per VMT (shown in dark red), from the 13-state crash data. The estimates in Figure 2.7 for crash frequency and crashworthiness/compatibility were obtained using the same regression models, with the dependent variable changed from fatalities per VMT to crashes per VMT (for crash frequency) or fatalities per crash (for crashworthiness/compatibility). For cars and light trucks, mass reduction is estimated to increase crash frequency, but reduce fatality risk per crash; the effects from the two components roughly add together to result in the overall estimated effect on fatality risk per VMT. For example, a 100-lb reduction in the mass of lighter cars is correlated with a 2.00% increase in crash frequency (the number of crashes per VMT), while mass reduction is correlated with a 0.54% decrease in the number of fatalities per crash (or a 0.54% increase in crashworthiness/compatibility); the net effect is an estimated 1.42% increase in the risk of fatality per VMT. For CUVs/minivans, the relationship is different; mass reduction is correlated with an increase in both crash frequency (0.95%) and fatality risk per crash (0.98%), and the net result, an estimated 1.60% increase in the number of fatalities per VMT, is less than the sum of the two components. In its previous studies DRI solved the three equations, crashes per VMT, fatalities per crash, and fatalities per VMT, simultaneously, which forces the estimated effects on fatalities per VMT to equal the sum of the estimated effects on crashes per VMT and fatalities per crash.
1.55
%
0.51
%
0.52
%
-0.3
4%
-0.3
8%
1.87
%
-0.0
7%
1.72
%
1.42
%
-1.0
7% -0
.13%
-0.3
4%
1.60
%
2.11
%
1.64
%
-1.2
4%
1.86
%
0.73
% 1.
55%
-0.0
4%
0.10
%
1.54
%
0.94
% 1.54
%
-4.0%
-3.0%
-2.0%
-1.0%
0.0%
1.0%
2.0%
3.0%
4.0%
Cars < 3106 Cars > 3106 LTs < 4594 LTs > 4594 CUVs/ minivans
Cars LTs CUVs/ minivans
Per
cent
cha
nge
in ri
sk (p
roba
bilit
y)
Effect of reduction in weight or size on risk, by vehicle type
US fatalities per VMT 13-state fatalities per VMT 13-state casualties per VMT
100-lb reduction in weight 1-sq ft reduction in footprint

18
Figure 2.7. Estimated effect of mass or footprint reduction on crashes per VMT (vehicle crash frequency), fatalities per crash (vehicle crashworthiness/compatibility), and fatalities per VMT, by vehicle type
Figure 2.7 indicates that a reduction in car and light truck footprint is estimated to increase both the number of crashes per VMT and the number of fatalities per crash, while lower footprint in CUVs/minivans is associated with a decrease in both the number of crashes per VMT and the number of fatalities per crash. Figure 2.8 shows similar estimates for the two components of casualty risk per VMT. It is unclear why lower vehicle mass is associated with higher crash frequency, but lower risk per crash, in the regression models. It is possible that including variables that more accurately account for important differences among vehicles and driver behavior would reverse this relationship. We examine what effect adding a variable to account for driver behavior, a measure of household income, to the regression models has on the estimated relationship between increased crash frequency for lighter vehicles, in Section 4. On the other hand, it is also possible that over thirty years of improvements in vehicle design to achieve high crash test ratings have enabled manufacturers to design vehicles to mitigate some of the safety penalty of low mass vehicles.
1.55
%
0.51
%
0.52
%
-0.3
4%
-0.3
8%
1.87
%
-0.0
7%
1.72
%
2.00
%
1.50
%
1.44
%
0.94
%
0.95
%
0.64
%
1.04
%
-0.5
5%
-0.5
4%
-2.3
9%
-1.6
1%
-1.2
5%
0.98
%
0.92
%
0.48
%
-1.6
7%
1.42
%
-1.0
7%
-0.1
3%
-0.3
4%
1.60
% 2.11
%
1.64
%
-1.2
4%
-4.0%
-3.0%
-2.0%
-1.0%
0.0%
1.0%
2.0%
3.0%
4.0%
Cars < 3106 Cars > 3106 LTs < 4594 LTs > 4594 CUVs/ minivans
Cars LTs CUVs/ minivans
Per
cent
cha
nge
Effect of reduction in weight or size on risk, by vehicle type
US fatalities per VMT 13-state crashes per VMT 13-state fatalities per crash 13-state fatalities per VMT
100-lb reduction in weight 1-sq ft reduction in footprint

19
Figure 2.8. Estimated effect of mass or footprint reduction on crashes per VMT (vehicle crash frequency), casualties per crash (vehicle crashworthiness/compatibility), and casualties per VMT, by vehicle type
There is a possibility that reporting bias in the state police-reported crash data may influence the estimates of crash frequency and casualty risk per crash. Non-injury crashes may be under-reported for certain vehicle and crash types, such as large pickups that are less likely to suffer damage, and that older, less expensive, uninsured vehicles that are less likely to report crash damage to police, or one vehicle crashes in which there is no crash partner that requires a police-report in order to file an insurance claim. If collisions of certain vehicles or crashes are slightly less likely to be reported, this would tend to increase the observed detrimental effect of mass reduction on reported crashes per VMT and conversely decrease its detrimental effect on casualties per reported crash. (By contrast, fatalities or casualties per VMT would be not be affected by crash-reporting rates, because the crash-reporting rate is not part of the formula for calculating risk.) The extent to which any reporting bias of non-injury crashes exists, the observed effects for police-reported crashes per VMT might not correspond exactly to the “effect of mass reduction on crash avoidance” and the observed effects for casualties per police-reported crash might not correspond exactly to the “effect of mass reduction on crashworthiness/compatibility.” We suspect that one-vehicle, non-rollover, non-injury crashes by pickup trucks are under-reported in the state crash data. Two-vehicle crashes are more likely to be reported, because two parties are involved, while rollover and injury crashes are more likely to be reported because they tend to be more severe. If pickup truck owners were not reporting one-vehicle non-injury crashes, we would expect the crash rate per registered vehicle for pickup trucks in one-vehicle non-injury crashes to be lower relative to that of other vehicles than in all crashes. Figure 2.9
1.55
%
0.51
%
0.52
%
-0.3
4%
-0.3
8%
1.87
%
-0.0
7%
1.72
%
2.00
%
1.50
%
1.44
%
0.94
%
0.95
%
0.64
%
1.04
%
-0.5
5%
0.09
%
-0.7
7% -0
.11%
-0.6
2%
-0.1
6%
0.23
%
-0.2
5%
0.56
%
1.86
%
0.73
%
1.55
%
-0.0
4%
0.10
%
1.54
%
0.94
% 1.
54%
-4.0%
-3.0%
-2.0%
-1.0%
0.0%
1.0%
2.0%
3.0%
4.0%
Cars < 3106 Cars > 3106 LTs < 4594 LTs > 4594 CUVs/ minivans
Cars LTs CUVs/ minivans
Per
cent
cha
nge
Effect of reduction in weight or size on risk, by vehicle type
US fatalities per VMT 13-state crashes per VMT 13-state casualties per crash 13-state casualties per VMT
100-lb reduction in weight 1-sq ft reduction in footprint

20
compares the crash frequency per VMT of all crashes and non-injury crashes, for one-vehicle, non-rollover crashes with a stationary object; crash rates for each type of crash are indexed to that for heavy four-door cars. For the most part the relative crash frequencies are quite similar for all crashes (in blue) and for non-injury crashes (in green), for all types of vehicles. Lighter two-door cars, and to a lesser extent lighter four-door cars, do have a slightly lower crash frequency for non-injury crashes than for all crashes, suggesting that there may be a small reporting bias for these vehicles. On the other hand, heavier pickups have slightly higher crash frequency for non-injury crashes than for all crashes. This suggests that pickup truck owners are not under-reporting the type of crash least likely to be reported, one-vehicle, non-injury crashes, in the state crash databases. Figure 2.9. One-vehicle, non-injury crashes and all crashes per VMT, by vehicle type
Another type of bias in the state crash data is inaccurate reporting of injury outcomes by police officers at the scene of a crash. Using detailed NASS CDS records, in which a crash investigator tracks hospital records of victims in a small sample of police-reported crashes, Farmer (2003) found that 41% of injuries that police responders coded as “serious” or “incapacitating” received Modified Abbreviated Injury Scale (MAIS) ratings of “minor injury” by health care professionals. An updated analysis using NASS CDS from 2000 to 2008 finds that 59% of injuries police reported as “incapacitating” received eventual MAIS ratings of “minor” or “no injury”; 39% of injuries eventually receiving MAIS “serious” rating, and 27% that received a MAIS “severe” or “critical” rating, were initially coded as non-incapacitating injuries by the initial police responder.8 The possibility that these injury reporting errors are not consistent 8 The percentages are calculated using the national weights assigned to each crash in the NASS CDS sample. Using unweighted data, 41% of injuries reported as “incapacitating” by initial police responders received an eventual
0.0
0.2
0.4
0.6
0.8
1.0
1.2
1.4
1.6
1.8
2-dr
car
s, li
ght
2-dr
car
s, h
eavy
4-dr
car
s, li
ght
4-dr
car
s, h
eavy
Min
ivan
s
Full
vans
SU
Vs,
ligh
t
SU
Vs,
hea
vy
CS
UV
s
Sm
all P
Us,
ligh
t
Sm
all P
Us,
hea
vy
Larg
e P
Us,
hea
vy
Cra
shes
per
VM
T, in
dexe
d to
hea
vy 4
-doo
r car
s
Crash frequency per vehicle miles traveled, non-injury crashes
All 1-veh w/obj crashes
Non-injury 1-veh w/obj crashes

21
across states is another reason to include a control variable for the state in which the crash occurred. Recall that the risks and crashes per VMT in Figures 2.6 through 2.8 use the VMT weights developed by NHTSA using national registration data and induced exposure crashes in the thirteen states. To more accurately calculate fatality risk per VMT for the thirteen states, we need to obtain vehicle registration data, by calendar year, and vehicle model year and model, for the thirteen states, and develop new VMT weights to represent total VMT in the thirteen states, as opposed to the national VMT weights NHTSA used in their analysis and here. Figure 2.5 shows the estimated effect of mass or footprint reduction on risk per police-reported crash; Figure 2.10 shows the estimated effect on fatality risk per serious crash (shown in brown), with “serious crashes” defined as any police-reported crash that resulted in a casualty to a vehicle occupant or non-occupant. The figure suggests that using serious, or casualty, crashes, rather than all police-reported crashes, as the measure of exposure has only a slight change in the estimated effect of mass or footprint reduction on risk. Figure 2.10. Estimated effect of mass or footprint reduction on fatalities per crash and per serious crash, by vehicle type
Figure 2.11 compares the estimated effect of mass or footprint reduction on 13-state casualty risk per crash, after accounting for full adoption of ESC by 2017 (in green, from Figure 2.5) with the results from the nine regression models by crash type weighted by the current distribution of
MAIS rating of “minor” or “no injury”, and 16% of injuries eventually receiving MAIS “serious” rating, and 10% receiving a MAIS “severe” or “critical” rating, were initially coded as non-incapacitating by the initial police responder.
1.55
%
0.51
%
0.52
%
-0.3
4%
-0.3
8%
1.87
%
-0.0
7%
1.72
%
-0.5
4%
-2.3
9% -1
.61%
-1.2
5%
0.98
%
0.92
%
0.48
%
-1.6
7%
-1.0
5%
-1.7
4%
-1.6
0%
-0.6
2%
1.20
%
0.47
%
0.31
%
-2.9
2%
-4.0%
-3.0%
-2.0%
-1.0%
0.0%
1.0%
2.0%
3.0%
4.0%
Cars < 3106 Cars > 3106 LTs < 4594 LTs > 4594 CUVs/ minivans
Cars LTs CUVs/ minivans
Per
cent
cha
nge
in ri
sk (p
roba
bilit
y)
Effect of reduction in weight or size on risk, by vehicle type
US fatalities per VMT 13-state fatalities per crash 13-state fatalities per serious crash
100-lb reduction in weight 1-sq ft reduction in footprint
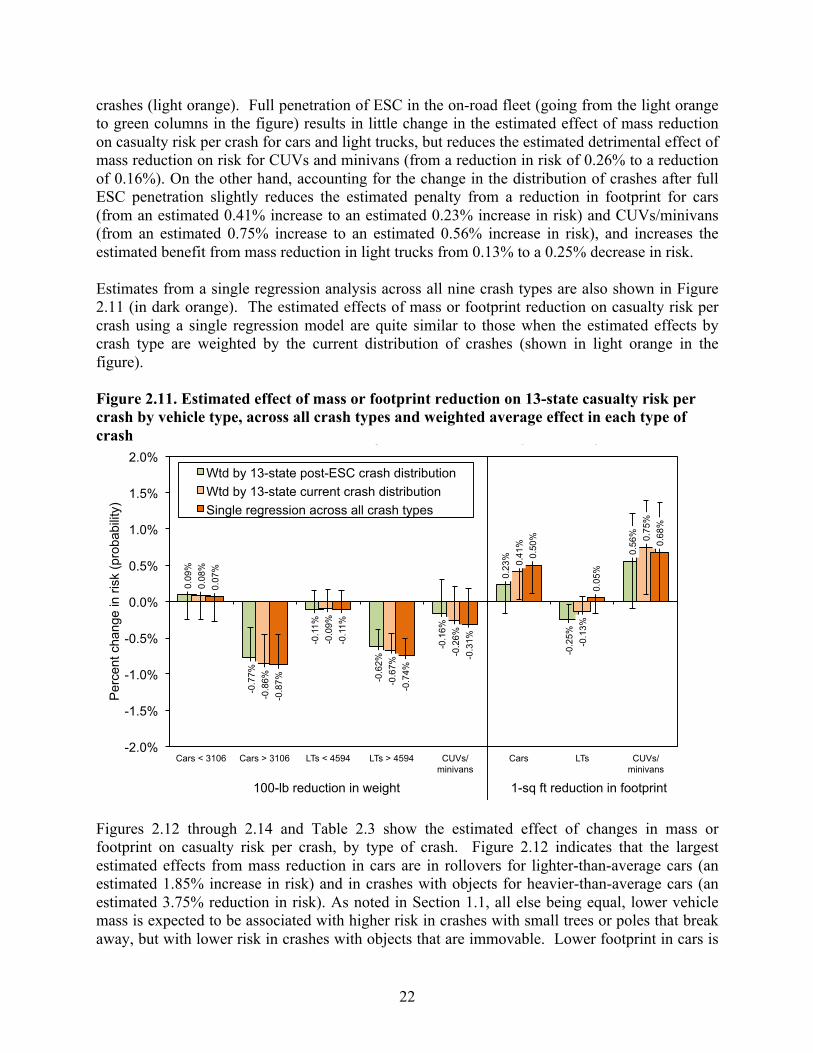
22
crashes (light orange). Full penetration of ESC in the on-road fleet (going from the light orange to green columns in the figure) results in little change in the estimated effect of mass reduction on casualty risk per crash for cars and light trucks, but reduces the estimated detrimental effect of mass reduction on risk for CUVs and minivans (from a reduction in risk of 0.26% to a reduction of 0.16%). On the other hand, accounting for the change in the distribution of crashes after full ESC penetration slightly reduces the estimated penalty from a reduction in footprint for cars (from an estimated 0.41% increase to an estimated 0.23% increase in risk) and CUVs/minivans (from an estimated 0.75% increase to an estimated 0.56% increase in risk), and increases the estimated benefit from mass reduction in light trucks from 0.13% to a 0.25% decrease in risk. Estimates from a single regression analysis across all nine crash types are also shown in Figure 2.11 (in dark orange). The estimated effects of mass or footprint reduction on casualty risk per crash using a single regression model are quite similar to those when the estimated effects by crash type are weighted by the current distribution of crashes (shown in light orange in the figure). Figure 2.11. Estimated effect of mass or footprint reduction on 13-state casualty risk per crash by vehicle type, across all crash types and weighted average effect in each type of crash
Figures 2.12 through 2.14 and Table 2.3 show the estimated effect of changes in mass or footprint on casualty risk per crash, by type of crash. Figure 2.12 indicates that the largest estimated effects from mass reduction in cars are in rollovers for lighter-than-average cars (an estimated 1.85% increase in risk) and in crashes with objects for heavier-than-average cars (an estimated 3.75% reduction in risk). As noted in Section 1.1, all else being equal, lower vehicle mass is expected to be associated with higher risk in crashes with small trees or poles that break away, but with lower risk in crashes with objects that are immovable. Lower footprint in cars is
0.09
%
-0.7
7%
-0.1
1%
-0.6
2% -0
.16%
0.23
%
-0.2
5%
0.56
%
0.08
%
-0.8
6%
-0.0
9%
-0.6
7% -0
.26%
0.41
%
-0.1
3%
0.75
%
0.07
%
-0.8
7%
-0.1
1%
-0.7
4% -0
.31%
0.50
%
0.05
%
0.68
%
-2.0%
-1.5%
-1.0%
-0.5%
0.0%
0.5%
1.0%
1.5%
2.0%
Cars < 3106 Cars > 3106 LTs < 4594 LTs > 4594 CUVs/ minivans
Cars LTs CUVs/ minivans
Per
cent
cha
nge
in ri
sk (p
roba
bilit
y)
Effect of reduction in weight or size on risk, by vehicle type
Wtd by 13-state post-ESC crash distribution Wtd by 13-state current crash distribution Single regression across all crash types
100-lb reduction in weight 1-sq ft reduction in footprint
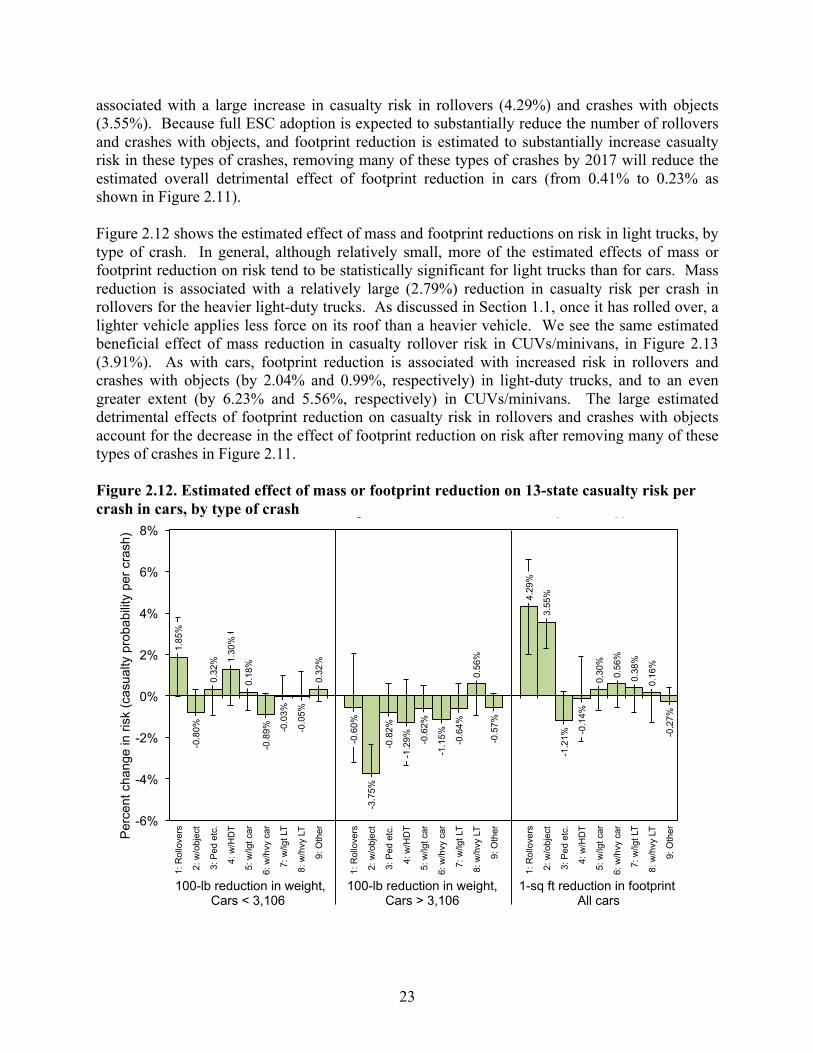
23
associated with a large increase in casualty risk in rollovers (4.29%) and crashes with objects (3.55%). Because full ESC adoption is expected to substantially reduce the number of rollovers and crashes with objects, and footprint reduction is estimated to substantially increase casualty risk in these types of crashes, removing many of these types of crashes by 2017 will reduce the estimated overall detrimental effect of footprint reduction in cars (from 0.41% to 0.23% as shown in Figure 2.11). Figure 2.12 shows the estimated effect of mass and footprint reductions on risk in light trucks, by type of crash. In general, although relatively small, more of the estimated effects of mass or footprint reduction on risk tend to be statistically significant for light trucks than for cars. Mass reduction is associated with a relatively large (2.79%) reduction in casualty risk per crash in rollovers for the heavier light-duty trucks. As discussed in Section 1.1, once it has rolled over, a lighter vehicle applies less force on its roof than a heavier vehicle. We see the same estimated beneficial effect of mass reduction in casualty rollover risk in CUVs/minivans, in Figure 2.13 (3.91%). As with cars, footprint reduction is associated with increased risk in rollovers and crashes with objects (by 2.04% and 0.99%, respectively) in light-duty trucks, and to an even greater extent (by 6.23% and 5.56%, respectively) in CUVs/minivans. The large estimated detrimental effects of footprint reduction on casualty risk in rollovers and crashes with objects account for the decrease in the effect of footprint reduction on risk after removing many of these types of crashes in Figure 2.11. Figure 2.12. Estimated effect of mass or footprint reduction on 13-state casualty risk per crash in cars, by type of crash
1.85
%
-0.8
0%
0.32
% 1.30
%
0.18
%
-0.8
9%
-0.0
3%
-0.0
5%
0.32
%
-0.6
0%
-3.7
5%
-0.8
2%
-1.2
9%
-0.6
2%
-1.1
5%
-0.6
4%
0.56
%
-0.5
7%
4.29
%
3.55
%
-1.2
1%
-0.1
4%
0.30
%
0.56
%
0.38
%
0.16
%
-0.2
7%
-6%
-4%
-2%
0%
2%
4%
6%
8%
1: R
ollo
vers
2: w
/obj
ect
3: P
ed e
tc.
4: w
/HD
T
5: w
/lgt c
ar
6: w
/hvy
car
7: w
/lgt L
T
8: w
/hvy
LT
9: O
ther
1: R
ollo
vers
2: w
/obj
ect
3: P
ed e
tc.
4: w
/HD
T
5: w
/lgt c
ar
6: w
/hvy
car
7: w
/lgt L
T
8: w
/hvy
LT
9: O
ther
1: R
ollo
vers
2: w
/obj
ect
3: P
ed e
tc.
4: w
/HD
T
5: w
/lgt c
ar
6: w
/hvy
car
7: w
/lgt L
T
8: w
/hvy
LT
9: O
ther
Per
cent
cha
nge
in ri
sk (c
asua
lty p
roba
bilit
y pe
r cra
sh)
Effect of reduction in weight or size on risk in cars, by crash type
100-lb reduction in weight, 100-lb reduction in weight, 1-sq ft reduction in footprint Cars < 3,106 Cars > 3,106 All cars

24
Lower mass in light trucks is also associated with statistically significant reductions in casualty risks in crashes with pedestrians/cyclists, lighter light-duty trucks, and, for the heavier-than-average light-duty trucks, in crashes with heavier cars and lighter trucks. For light trucks, as well as CUVs/minivans, lower mass is associated with statistically significant increases, while lower footprint is associated with decreases, in casualty risk in crashes with heavy-duty trucks. Lower mass in CUVs/minivans is associated with an increase in casualty risk (1.19%) in crashes with lighter light-duty trucks, but a large decrease in risk (2.73%) in crashes with heavier light-duty trucks, as shown in Figure 2.14. Footprint reduction in CUVs/minivans leads to a large increase in casualty risk (3.90%) in crashes with heavier light-duty trucks. Figure 2.13. Estimated effect of mass or footprint reduction on 13-state casualty risk per crash in light trucks, by type of crash
0.65
%
-0.7
8%
-1.2
6%
1.86
%
-0.1
7%
-0.1
4%
-1.1
7%
0.66
%
0.18
%
-2.7
9%
0.04
%
-1.1
6%
1.16
%
-0.8
1%
-1.0
7%
-1.3
2%
0.77
%
-0.4
8%
2.04
%
0.99
%
-0.0
3%
-1.3
3% -0.1
7%
-0.2
5%
0.67
%
-1.0
0%
-0.6
6%
-6%
-4%
-2%
0%
2%
4%
6%
8%
1: R
ollo
vers
2: w
/obj
ect
3: P
ed e
tc.
4: w
/HD
T
5: w
/lgt c
ar
6: w
/hvy
car
7: w
/lgt L
T
8: w
/hvy
LT
9: O
ther
1: R
ollo
vers
2: w
/obj
ect
3: P
ed e
tc.
4: w
/HD
T
5: w
/lgt c
ar
6: w
/hvy
car
7: w
/lgt L
T
8: w
/hvy
LT
9: O
ther
1: R
ollo
vers
2: w
/obj
ect
3: P
ed e
tc.
4: w
/HD
T
5: w
/lgt c
ar
6: w
/hvy
car
7: w
/lgt L
T
8: w
/hvy
LT
9: O
ther
Per
cent
cha
nge
in ri
sk (c
asua
lty p
roba
bilit
y pe
r cra
sh)
Effect of reduction in weight or size on risk in LTs, by crash type
100-lb reduction in weight, 100-lb reduction in weight, 1-sq ft reduction in footprint LTs < 4,594 LTs > 4,594 All LTs

25
Figure 2.14. Estimated effect of mass or footprint reduction on 13-state casualty risk per crash in CUVs/minivans, by type of crash
Table 2.3. Estimated effect of mass or footprint reduction on 13-state casualty risk per crash, by type of crash
Type of crash
Mass reduction Footprint reduction Cars <
3106 lbs Cars >
3106 lbs LTs <
4594 lbs LTs >
4594 lbs CUVs/
minivans Cars LTs CUVs/
minivans 1: Rollovers 1.85% -0.60% 0.65% -2.79% -3.91% 4.29% 2.04% 6.23% 2: w/object -0.80% -3.75% -0.78% 0.04% -2.60% 3.55% 0.99% 5.56% 3: Ped etc. 0.32% -0.82% -1.26% -1.16% -0.48% -1.21% -0.03% 0.06% 4: w/HDT 1.30% -1.29% 1.86% 1.16% 4.14% -0.14% -1.33% -2.44% 5: w/lgt car 0.18% -0.62% -0.17% -0.81% -0.66% 0.30% -0.17% 0.94% 6: w/hvy car -0.89% -1.15% -0.14% -1.07% -0.06% 0.56% -0.25% 0.11% 7: w/lgt LT -0.03% -0.64% -1.17% -1.32% 1.19% 0.38% 0.67% -0.07% 8: w/hvy LT -0.05% 0.56% 0.66% 0.77% -2.73% 0.16% -1.00% 3.90% 9: Other 0.32% -0.57% 0.18% -0.48% 0.14% -0.27% -0.66% -0.26% All 0.09% -0.77% -0.11% -0.62% -0.16% 0.23% -0.25% 0.56%
Estimates that are statistically significant at the 95% level are shown in red. Table 2.4 compares the estimated effect of changes in the other vehicle, driver, and crash control variables on US fatality risk, 13-state fatality risk, and 13-state casualty risk, per VMT, by vehicle type. In general, the estimates for the control variables on the three types of risk per VMT are quite similar. Two-door cars are estimated to have higher risk than four-door sedans for each type of risk, while SUVs are estimated to have higher risk per VMT using US fatalities and 13-state casualties, but lower risk using 13-state fatalities. Torso side airbags consistently
-3.9
1% -2
.60%
-0.4
8%
4.14
%
-0.6
6%
-0.0
6%
1.19
%
-2.7
3%
0.14
%
6.23
%
5.56
%
0.06
%
-2.4
4%
0.94
%
0.11
%
-0.0
7%
3.90
%
-0.2
6%
-6%
-4%
-2%
0%
2%
4%
6%
8%
1: R
ollo
vers
2: w
/obj
ect
3: P
ed e
tc.
4: w
/HD
T
5: w
/lgt c
ar
6: w
/hvy
car
7: w
/lgt L
T
8: w
/hvy
LT
9: O
ther
1: R
ollo
vers
2: w
/obj
ect
3: P
ed e
tc.
4: w
/HD
T
5: w
/lgt c
ar
6: w
/hvy
car
7: w
/lgt L
T
8: w
/hvy
LT
9: O
ther
Per
cent
cha
nge
in ri
sk (c
asua
lty p
roba
bilit
y pe
r cra
sh)
Effect of reduction in weight or size on risk in CUVs, by crash type
100-lb reduction in weight 1-sq ft reduction in footprint

26
reduce risk for cars but not always for CUVs/minivans; ABS is estimated to consistently reduce risk for cars, and to a greater degree for CUVs/minivans. Similarly, ESC is estimated to consistently reduce risk in cars, and even more so in light trucks; the models estimated smaller and non-significant reductions in risk from ESC in CUVs/minivans. Each additional year of vehicle age is estimated to increase risk about 2% to 5%, while a brand new vehicle is estimated to increase risk by up to 10%, presumably because the driver is unfamiliar with its controls, handling, and/or braking capabilities. The estimated effect of a male driver on risk generally is highest for US fatality risk, followed by 13-state fatality risk and 13-state casualty risk, and generally is higher in cars and CUVs/minivans than in light trucks. For each type of risk, the youngest and oldest drivers have higher risk (around 5% and 8% respectively) than other drivers, for all three vehicle types. The estimated effects of driving at night, on high-speed or rural roads are higher for US fatality risk, followed by 13-state fatality and 13-state casualty risk for all three types of vehicles. In general the calendar year variables are estimated to have a decreasing effect on risk over time, and tend to be highest for US fatality risk per VMT in light trucks. Note that the four vehicle variables of interest, UNDRWT, OVERWT, LBS100 and FOOTPRINT, all have a much lower effect on risk than almost all of the control variables in Table 2.4. The estimated effects of vehicle type, other vehicle attributes (such as side airbags, ABS, ESC, or AWD), or male drivers on risk per VMT are nearly an order of magnitude larger than those estimated for lower mass or footprint, while driving at night, on rural or high-speed roads, are estimated to have an effect several hundred times that of vehicle mass or footprint reduction. The estimated effects of the crash time and location variables are much higher on US or 13-state fatality risk per VMT than on 13-state casualty risk per VMT. Table 2.5 compares the estimated effect of changes in the other vehicle, driver, and crash control variables on 13-state fatality or casualty risk per crash. While 2-door cars continue to have a much higher estimated fatality risk per crash than 4-door sedans (11.2%), this effect essentially disappears in terms of casualty risk per crash (1.14%). Curtain side airbags are associated with a larger safety benefit in terms of casualties per crash than in terms of fatalities per crash or US fatalities per VMT, while combo side airbags are associated with a larger safety benefit for cars but not for CUVs/minivans. The estimated beneficial effects of torso side airbags, ABS, and ESC are similar among the three types of risk, with the exception of ABS in fatality risk per crash. The estimated effects of vehicle age and brand new vehicles on the risks per crash are much smaller than on US fatality risk per VMT. The driver age and gender variables have a smaller estimated effect on fatality risk per crash, and a much smaller estimated effect on casualty risk per crash, than on US fatality risk per VMT; this suggest that much of the driver effect on risk contributes to the occurrence of a serious crash, and not the crashworthiness/compatibility of the vehicle once a crash has occurred. Nevertheless, risk increases for the oldest drivers, even in terms of casualty risk per crash. Likewise, driving at night, on rural or high-speed roads, has a bigger effect on US fatality risk per VMT than on 13-state fatality or casualty risk per crash. Even so, these three variables do substantially increase the likelihood of fatality or casualty once a crash occurs. The estimated effects of the calendar year variables also tend to be smaller on risks per crash, and

27
Table 2.4. Estimated effect of variables on US fatality risk, 13-state fatality risk, and 13-state casualty risk per VMT
Variable US fatality risk per VMT 13-state fatality risk per VMT 13-state casualty risk per VMT
Cars LTs CUVs Cars LTs CUVs Cars LTs CUVs UNDERWT 1.55% 0.52% —— 1.42% -0.13% — 1.86% 1.55% — OVERWT 0.51% -0.34% -1.07% -0.34% — 0.73% -0.04% — LBS100 — — -0.38% — — 1.60% — — 0.10% FOOTPRINT 1.87% -0.07% 1.72% 2.11% 1.64% -1.24% 1.54% — 1.54% TWODOOR 8.45% — — 19.7% — 8.13% — — SUV — 8.94% — — -8.50% — — 3.35% — HD — 1.73% — — 4.73% — — -6.06% — BLOCKER1 — -1.41% — — -0.35% — — 2.42% — BLOCKER2 — -2.32% — — -3.70% — — -1.75% — MINIVAN — — -0.94% — — 12.0% — — 19.2% ROLLCURT -0.73% — -1.67% -19.3% — -0.61% -2.33% — -0.92% CURTAIN 1.00% — -2.85% 5.52% — -2.20% -1.37% — -5.69% COMBO -1.10% — -6.43% -4.21% — 1.36% 1.82% — 1.67% TORSO -8.77% — 0.86% -16.3% — -2.33% -14.8% — -6.70% ABS -7.87% — -16.5% -7.18% — -34.8% -12.7% — -26.9% ESC -11.9% -18.8% -3.89% -19.5% -26.7% -9.51% -14.5% -23.4% -1.32% AWD — -14.5% -14.0% — 33.9% 9.01% — 25.2% -4.86% VEHAGE 2.54% 3.57% 5.50% 1.74% 3.39% 2.01% 2.28% 3.44% 3.82% BRANDNEW 10.2% 3.62% 8.76% 12.4% 5.36% -7.50% 10.4% 2.87% 2.07% DRVMALE 39.2% 19.3% 37.1% 20.5% 16.0% 46.9% 3.10% -2.97% 9.61% M14_30 4.63% 3.54% 3.92% 5.22% 3.77% 5.62% 4.67% 4.05% 4.91% M30_50 1.40% 1.25% 0.84% 1.13% 0.46% -0.66% 0.23% 0.37% -0.01% M50_70 2.20% 1.24% 1.82% 2.90% 1.42% 2.20% 1.11% 0.99% 1.21% M70_96 8.08% 7.65% 7.10% 8.74% 8.13% 6.36% 5.87% 5.71% 4.99% F14_30 2.81% 3.64% 4.77% 3.38% 2.51% 3.23% 3.28% 3.66% 4.04% F30_50 0.09% 0.22% -0.47% -0.79% -0.55% 0.10% -0.46% -0.06% -0.20% F50_70 3.21% 3.10% 3.22% 3.14% 2.55% 4.33% 1.42% 1.67% 2.34% F70_96 8.00% 6.36% 7.69% 8.82% 0.39% 6.61% 5.76% 3.41% 3.99% NITE 194% 192% 160% 155% 179.8% 126% 45.5% 64.2% 38.3% RURAL 223% 207% 215% 117% 98.7% 113% 50.4% 50.6% 49.8% SPDLIM55 414% 409% 405% 387% 379% 381% 158% 164% 152% CY2002 5.56% 22.4% 7.59% 1.52% 10.4% 11.3% 10.4% 11.7% 15.4% CY2003 3.60% 18.2% 4.97% 2.80% 10.3% 18.7% 10.7% 9.67% 16.9% CY2004 1.69% 14.1% -3.28% -6.50% 5.80% -8.19% 7.20% 7.73% 3.16% CY2005 -0.60% 7.86% 0.02% -1.44% 10.7% 4.05% 5.56% 7.19% 5.45% CY2007 -1.42% -1.19% -4.99% -4.50% -3.94% -7.58% -5.59% -6.40% -3.73% CY2008 -13.3% -15.0% -19.7% -8.43% -10.8% -10.8% -10.1% -13.9% -10.8% HIFAT_ST 29.5% 24.6% 33.8% — — — — — — AL — — — -6.69% -28.3% -22.0% 158% 97.5% 143% KS — — — -36.5% -38.1% -27.1% -68.8% -67.4% -65.7% KY — — — -12.6% -23.8% -19.4% -28.4% -32.7% -17.1% MD — — — -45.3% -44.5% -61.1% -28.4% -33.3% -29.2% MI — — — -51.7% -52.8% -47.8% -59.0% -61.1% -60.5% MO — — — -12.9% -28.5% -16.0% -31.4% -33.3% -27.2% NE — — — -36.6% -34.5% -44.2% -41.2% -34.6% -40.4% NJ — — — -44.7% -68.8% -50.7% -84.5% -85.2% -85.0% PA — — — -36.5% -33.6% -31.8% -82.9% -76.5% -79.5% WA — — — -50.9% -46.4% -46.7% -77.6% -72.2% -74.3% WI — — — -35.8% -39.3% -45.4% -54.5% -49.0% -54.1% WY — — — -1.73% -30.4% -56.1% -23.4% -40.6% -13.2%
* Values in red are statistically significant at the 95% level.

28
Table 2.5. Estimated effect of variables on US fatality risk per VMT, and 13-state fatality risk and 13-state casualty risk per crash
Variable US fatality risk per VMT 13-state fatality risk per crash 13-state casualty risk per crash
Cars LTs CUVs Cars LTs CUVs Cars LTs CUVs UNDERWT 1.55% 0.52% — -0.54% -1.61% — 0.09% -0.11% — OVERWT 0.51% -0.34% — -2.39% -1.25% — -0.77% -0.62% — LBS100 — — -0.38% — — 0.98% — — -0.16% FOOTPRINT 1.87% -0.07% 1.72% 0.92% 0.48% -1.67% 0.23% -0.25% 0.56% TWODOOR 8.45% — — 11.2% — — 1.14% — — SUV — 8.94% — — -6.44% — — 2.84% — HD — 1.73% — — 11.7% — — 0.17% — BLOCKER1 — -1.41% — — 0.21% — — 1.29% — BLOCKER2 — -2.32% — — -3.02% — — -3.32% — MINIVAN — — -0.94% — — 9.06% — — 15.9% ROLLCURT -0.73% — -1.67% -21.3% — -0.58% -1.98% — -0.91% CURTAIN 1.00% — -2.85% 4.48% — -1.39% -2.79% — -4.84% COMBO -1.10% — -6.43% -6.33% — 1.61% -1.79% — 4.97% TORSO -8.77% — 0.86% -10.2% — 1.52% -9.69% — -3.00% ABS -7.87% — -16.5% -0.20% — -18.1% -3.26% — -9.16% ESC -11.9% -18.8% -3.89% -8.75% -12.0% -11.4% -8.78% -13.8% -7.08% AWD — -14.5% -14.0% — 6.05% 5.63% — 2.56% -3.28% VEHAGE 2.54% 3.57% 5.50% 0.99% 2.54% -0.68% 1.53% 2.19% 0.64% BRANDNEW 10.2% 3.62% 8.76% 5.35% 6.42% -5.74% 2.99% 3.20% 1.08% DRVMALE 39.2% 19.3% 37.1% 14.4% 21.6% 42.5% -2.40% -1.43% 6.96% M14_30 4.63% 3.54% 3.92% 1.02% 0.20% 0.79% 0.53% 0.45% 0.18% M30_50 1.40% 1.25% 0.84% 0.50% -0.24% -0.92% -0.22% -0.19% -0.23% M50_70 2.20% 1.24% 1.82% 3.04% 1.52% 2.04% 1.14% 1.05% 1.06% M70_96 8.08% 7.65% 7.10% 4.85% 4.28% 3.05% 2.11% 1.62% 1.57% F14_30 2.81% 3.64% 4.77% 0.16% -0.70% 0.03% 0.17% 0.32% 0.82% F30_50 0.09% 0.22% -0.47% -0.93% -0.61% -0.04% -0.56% -0.16% -0.30% F50_70 3.21% 3.10% 3.22% 2.66% 2.27% 3.64% 0.86% 1.13% 1.67% F70_96 8.00% 6.36% 7.69% 4.49% -3.54% 2.86% 1.57% 0.15% 0.42% NITE 194% 192% 160% 96.4% 88.7% 70.2% 22.7% 23.6% 15.8% RURAL 223% 207% 215% 78.7% 59.3% 76.1% 37.3% 34.6% 36.7% SPDLIM55 414% 409% 405% 214% 216% 235% 79.9% 93.5% 90.7% CY2002 5.56% 22.4% 7.59% 4.72% 15.5% 17.1% 11.8% 16.7% 19.5% CY2003 3.60% 18.2% 4.97% 5.88% 9.83% 21.5% 11.5% 9.74% 15.6% CY2004 1.69% 14.1% -3.28% -5.56% 5.28% -7.72% 6.31% 5.78% 0.36% CY2005 -0.60% 7.86% 0.02% 0.08% 10.2% 4.54% 3.84% 4.56% 1.67% CY2007 -1.42% -1.19% -4.99% -6.94% -6.20% -9.23% -8.22% -7.59% -5.29% CY2008 -13.3% -15.0% -19.7% -10.1% -12.5% -11.4% -10.5% -12.2% -9.88% HIFAT_ST 29.5% 24.6% 33.8% — — — — — — AL — — — -69.1% -71.5% -75.3% -11.8% -21.6% -22.1% KS — — — -76.7% -80.2% -79.2% -87.2% -88.6% -88.8% KY — — — -74.4% -77.5% -81.6% -79.8% -82.3% -82.4% MD — — — -60.8% -55.5% -71.8% -47.0% -46.0% -43.6% MI — — — -86.9% -88.4% -86.7% -87.4% -89.3% -88.6% MO — — — -67.0% -71.2% -69.9% -74.1% -74.1% -74.6% NE — — — -76.7% -77.1% -81.6% -76.6% -75.8% -78.1% NJ — — — -78.6% -88.8% -81.6% -94.0% -94.6% -94.5% PA — — — -24.1% -36.0% -27.8% -79.7% -78.5% -79.2% WA — — — -71.5% -73.9% -74.8% -87.1% -86.5% -87.9% WI — — — -69.9% -75.2% -74.7% -77.2% -78.5% -78.2% WY — — — -77.2% -78.7% -91.6% -78.6% -80.1% -77.7%
* Values in red are statistically significant at the 95% level.
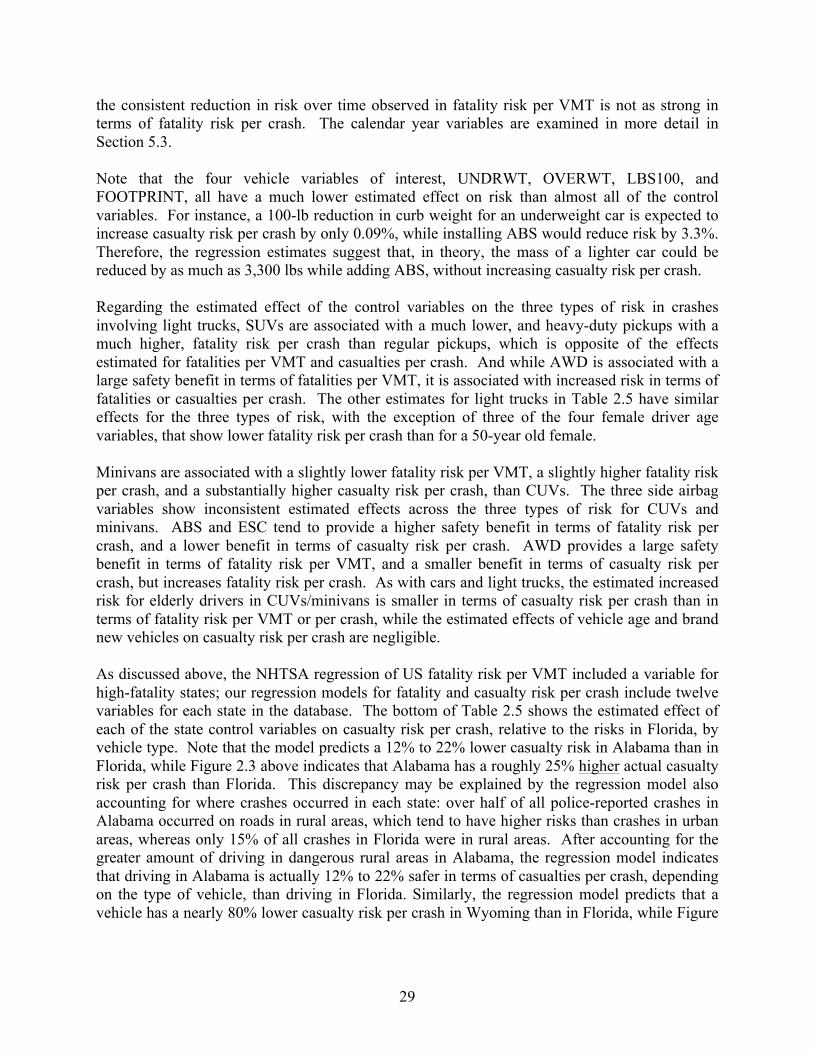
29
the consistent reduction in risk over time observed in fatality risk per VMT is not as strong in terms of fatality risk per crash. The calendar year variables are examined in more detail in Section 5.3. Note that the four vehicle variables of interest, UNDRWT, OVERWT, LBS100, and FOOTPRINT, all have a much lower estimated effect on risk than almost all of the control variables. For instance, a 100-lb reduction in curb weight for an underweight car is expected to increase casualty risk per crash by only 0.09%, while installing ABS would reduce risk by 3.3%. Therefore, the regression estimates suggest that, in theory, the mass of a lighter car could be reduced by as much as 3,300 lbs while adding ABS, without increasing casualty risk per crash. Regarding the estimated effect of the control variables on the three types of risk in crashes involving light trucks, SUVs are associated with a much lower, and heavy-duty pickups with a much higher, fatality risk per crash than regular pickups, which is opposite of the effects estimated for fatalities per VMT and casualties per crash. And while AWD is associated with a large safety benefit in terms of fatalities per VMT, it is associated with increased risk in terms of fatalities or casualties per crash. The other estimates for light trucks in Table 2.5 have similar effects for the three types of risk, with the exception of three of the four female driver age variables, that show lower fatality risk per crash than for a 50-year old female. Minivans are associated with a slightly lower fatality risk per VMT, a slightly higher fatality risk per crash, and a substantially higher casualty risk per crash, than CUVs. The three side airbag variables show inconsistent estimated effects across the three types of risk for CUVs and minivans. ABS and ESC tend to provide a higher safety benefit in terms of fatality risk per crash, and a lower benefit in terms of casualty risk per crash. AWD provides a large safety benefit in terms of fatality risk per VMT, and a smaller benefit in terms of casualty risk per crash, but increases fatality risk per crash. As with cars and light trucks, the estimated increased risk for elderly drivers in CUVs/minivans is smaller in terms of casualty risk per crash than in terms of fatality risk per VMT or per crash, while the estimated effects of vehicle age and brand new vehicles on casualty risk per crash are negligible. As discussed above, the NHTSA regression of US fatality risk per VMT included a variable for high-fatality states; our regression models for fatality and casualty risk per crash include twelve variables for each state in the database. The bottom of Table 2.5 shows the estimated effect of each of the state control variables on casualty risk per crash, relative to the risks in Florida, by vehicle type. Note that the model predicts a 12% to 22% lower casualty risk in Alabama than in Florida, while Figure 2.3 above indicates that Alabama has a roughly 25% higher actual casualty risk per crash than Florida. This discrepancy may be explained by the regression model also accounting for where crashes occurred in each state: over half of all police-reported crashes in Alabama occurred on roads in rural areas, which tend to have higher risks than crashes in urban areas, whereas only 15% of all crashes in Florida were in rural areas. After accounting for the greater amount of driving in dangerous rural areas in Alabama, the regression model indicates that driving in Alabama is actually 12% to 22% safer in terms of casualties per crash, depending on the type of vehicle, than driving in Florida. Similarly, the regression model predicts that a vehicle has a nearly 80% lower casualty risk per crash in Wyoming than in Florida, while Figure

30
2.3 above indicates that the actual casualty risk per crash in Wyoming is only about 40% lower than that in Florida. All driving in Wyoming is in rural areas. Table 2.6 shows the estimated effect of the vehicle, driver, and calendar year control variables on the two components of fatality risk per VMT: crashes per VMT (or crash frequency) and fatality or casualty risk per crash. ABS and ESC in cars are estimated to reduce crash frequency more than risk per crash, as expected, while AWD in light trucks and CUVs/minivans is estimated to increase crash frequency more than risk per crash. Two-door cars, SUVs, heavy-duty pickups, and the side airbag variables in cars have a smaller effect on crash frequency than risk given a crash. Surprisingly, for CUVs/minivans, the side airbag variables are estimated to reduce crash frequency but have little effect on fatality risk per crash, ABS has the same benefit in reducing crash frequency as fatality risk, and ESC has essentially no effect on crash frequency but a large estimated benefit in reducing fatality risk per crash. For light trucks, ESC has about the same estimated benefit in reducing crash frequency as in reducing fatality risk given a crash. Male drivers are estimated to have essentially no effect on crash frequency, but are associated with a statistically significant increase in fatality risk once a crash occurs; a possible explanation is that male drivers are not involved in more crashes than female drivers, but the crashes they are involved in are more severe. The driver age variables estimate that crash frequency consistently increases for the youngest and oldest drivers, and that risk consistently increases for the two oldest groups of drivers (over 50 years old). The crash circumstance variables estimate that driving on high-speed roads increases crash frequency the most, followed by night driving, followed by driving in rural counties. Of the three variables for crash circumstances, driving on high-speed roads also has the highest estimated increase in risk per crash. Driving on high-speed or rural roads are associated with much higher increases in risk per crash than on crash frequency, while driving at night is associated with only a slightly higher increase in risk per crash than on crash frequency. Again, the crashes that occur under these conditions may be more severe than other crashes, and thus lead to greater fatality or casualty risk. All three crash variables are associated with a much higher increase in fatality risk per crash than in casualty risk per crash. The control variables for CY2002 and CY2003 show a large reduction in crash frequency, but a large increase in risk given a crash, for all three types of vehicles. As summarized above, Florida and Pennsylvania substantially under-report non-injury crashes; after accounting for other control variables, all of the states have a higher crash frequency than Florida, except Pennsylvania (and Maryland, for light trucks and CUVs/minivans). Kentucky and Alabama have the highest crash frequencies for all three types of vehicles; Pennsylvania, Maryland, Wisconsin, and Washington have the lowest crash frequency. Wyoming has a low crash frequency for light trucks, but relatively high crash frequencies for cars and CUVs/minivans. All states have a lower fatality or casualty risk per crash than Florida, for each type of vehicle. Pennsylvania has a much higher fatality risk relative to its casualty risk per crash (the estimate for fatality risk is much higher than the estimate for casualty risk), while Alabama has a much lower fatality risk relative to its casualty risk per crash (the fatality risk estimate is much lower).

31
Table 2.6. Estimated effect of variables on crashes per VMT, fatalities per crash, and casualties per crash, using data from 13 states
Variable
Cars Light trucks CUVs/minivans Crash/ VMT
Fatality/ crash
Casualty/ crash
Crash/ VMT
Fatality/ crash
Casualty/ crash
Crash/ VMT
Fatality/ crash
Casualty/ crash
UNDERWT 2.00% -0.54% 0.09% 1.44% -1.61% -0.11% — — — OVERWT 1.50% -2.39% -0.77% 0.94% -1.25% -0.62% — — — LBS100 — — — — — — 0.95% 0.98% -0.16% FOOTPRINT 0.64% 0.92% 0.23% 1.04% 0.48% -0.25% -0.55% -1.67% 0.56% TWODOOR 4.19% 11.2% 1.14% — — — SUV — — — -0.59% -6.44% 2.84% — — — HD — — — -3.86% 11.7% 0.17% — — — BLOCKER1 — — — 0.52% 0.21% 1.29% — — — BLOCKER2 — — — -0.05% -3.02% -3.32% — — — MINIVAN — — — 3.81% 9.06% 15.9% ROLLCURT -0.98% -21.3% -1.98% — — — -0.69% -0.58% -0.91% CURTAIN -0.05% 4.48% -2.79% — — — -3.51% -1.39% -4.84% COMBO 2.84% -6.33% -1.79% — — — -0.49% 1.61% 4.97% TORSO -5.14% -10.2% -9.69% — — — -5.18% 1.52% -3.00% ABS -7.21% -0.20% -3.26% — — — -20.0% -18.1% -9.16% ESC -15.1% -8.75% -8.78% -13.8% -12.0% -13.8% 0.15% -11.4% -7.08% AWD — — — 46.1% 6.05% 2.56% 11.3% 5.63% -3.28% VEHAGE 0.44% 0.99% 1.53% -0.01% 2.54% 2.19% 1.38% -0.68% 0.64% BRANDNEW 6.04% 5.35% 2.99% 0.88% 6.42% 3.20% 0.51% -5.74% 1.08% DRVMALE 6.53% 14.4% -2.40% -0.46% 21.6% -1.43% 2.03% 42.5% 6.96% M14_30 4.23% 1.02% 0.53% 3.81% 0.20% 0.45% 5.01% 0.79% 0.18% M30_50 0.31% 0.50% -0.22% 0.36% -0.24% -0.19% 0.18% -0.92% -0.23% M50_70 0.21% 3.04% 1.14% 0.33% 1.52% 1.05% 0.62% 2.04% 1.06% M70_96 3.98% 4.85% 2.11% 4.42% 4.28% 1.62% 3.39% 3.05% 1.57% F14_30 3.35% 0.16% 0.17% 3.53% -0.70% 0.32% 3.58% 0.03% 0.82% F30_50 -0.03% -0.93% -0.56% 0.02% -0.61% -0.16% 0.00% -0.04% -0.30% F50_70 0.76% 2.66% 0.86% 0.93% 2.27% 1.13% 1.10% 3.64% 1.67% F70_96 4.27% 4.49% 1.57% 3.36% -3.54% 0.15% 3.50% 2.86% 0.42% NITE 22.5% 96.4% 22.7% 32.8% 88.7% 23.6% 17.8% 70.2% 15.8% RURAL 11.4% 78.7% 37.3% 14.7% 59.3% 34.6% 10.5% 76.1% 36.7% SPDLIM55 51.1% 214% 79.9% 36.8% 216% 93.5% 29.4% 235% 90.7% CY2002 -5.40% 4.72% 11.8% -7.63% 15.5% 16.7% -9.09% 17.1% 19.5% CY2003 -4.05% 5.88% 11.5% -1.43% 9.83% 9.74% -3.48% 21.5% 15.6% CY2004 -2.39% -5.56% 6.31% -0.72% 5.28% 5.78% -2.05% -7.72% 0.36% CY2005 -0.26% 0.08% 3.84% 0.90% 10.2% 4.56% 0.83% 4.54% 1.67% CY2007 3.17% -6.94% -8.22% 2.34% -6.20% -7.59% 3.15% -9.23% -5.29% CY2008 3.70% -10.1% -10.5% 1.82% -12.5% -12.2% 4.61% -11.4% -9.88% AL 120% -69.1% -11.8% 79.7% -71.5% -21.6% 123% -75.3% -22.1% KS 37.0% -76.7% -87.2% 21.4% -80.2% -88.6% 46.6% -79.2% -88.8% KY 131% -74.4% -79.8% 118% -77.5% -82.3% 187% -81.6% -82.4% MD 2.32% -60.8% -47.0% -12.9% -55.5% -46.0% -3.90% -71.8% -43.6% MI 83.8% -86.9% -87.4% 60.3% -88.4% -89.3% 68.4% -86.7% -88.6% MO 76.3% -67.0% -74.1% 46.8% -71.2% -74.1% 80.9% -69.9% -74.6% NE 59.3% -76.7% -76.6% 38.7% -77.1% -75.8% 52.6% -81.6% -78.1% NJ 78.1% -78.6% -94.0% 64.3% -88.8% -94.6% 77.2% -81.6% -94.5% PA -38.1% -24.1% -79.7% -31.9% -36.0% -78.5% -30.4% -27.8% -79.2% WA 22.5% -71.5% -87.1% 29.9% -73.9% -86.5% 44.9% -74.8% -87.9% WI 27.1% -69.9% -77.2% 18.8% -75.2% -78.5% 26.8% -74.7% -78.2% WY 100% -77.2% -78.6% 15.2% -78.7% -80.1% 79.9% -91.6% -77.7%
* Values in red are statistically significant at the 95% level.
32
In summary, the strong and consistent relationship in Tables 2.4 through 2.6 between the control variables for vehicle attributes, driver gender and age, crash circumstances, and crash frequency and risk, is encouraging. However, the tables show several unexpected results:
• side airbags are estimated to reduce crash frequency; • AWD is estimated to increase crash frequency; • ESC and ABS are estimated to reduce risk once a crash has occurred; and • AWD, brand new vehicles, and male drivers are estimated to increase risk once a crash has
occurred. In some cases these unexpected results apply to all three vehicle types, in other cases to only one or two of the three vehicle types. These unexpected results suggest that the regression models may not fully account for all the variables that influence crash frequency or risk per crash. In particular, they may not account for why risky or unskilled drivers select certain vehicle types, or even particular makes and models. Not accounting for these associations may be biasing the relationships the models estimate between vehicle mass or footprint and crash frequency and risk per crash.

33
3. Multi-collinearity between vehicle mass and footprint In its 2003 analysis NHTSA resisted including vehicle mass and size (in that case, wheelbase and track width) in the same regression model, because the two variables were strongly correlated with each other. Including two or more highly-correlated variables in the same regression model can lead to biased or incorrect results. DRI showed that regression analyses that included both mass and size (i.e. wheelbase and track width) in the same regression model (i.e. that estimated the effect of mass while holding size constant, and vice versa) estimated smaller effects for changes in mass or size on US fatality risk per VMT (Van Auken and Zellner, 2002, 2003, 2004, 2005a, 2005b). In its 2010 and 2011 analyses, NHTSA included both mass and size (i.e. footprint, or wheelbase times track width) in the same regression model, in part because the model year 2012 to 2016 light truck standards adopted in 2010, and the proposed 2017 to 2025 standards for all light-duty vehicles, assign a target fuel economy/greenhouse gas emission level based on a vehicle’s footprint (Kahane 2010 and 2011). Using two or more variables that are strongly correlated in the same regression model (referred to as multi-collinearity) can lead to biased results. Allison9 “begins to get concerned” with VIF values greater than 2.5, while Menard10 suggests that a VIF greater than 5 is a “cause for concern”, while a VIF greater than 10 “almost certainly indicates a serious collinearity problem”; however, O’Brien11 suggests that “values of VIF of 10, 20, 40 or even higher do not, by themselves, discount the results of regression analyses.” . Figure 3.1 shows the correlation between curb weight and footprint by vehicle model in the NHTSA database; only the most popular 275 models, with at least 10 billion VMT or 100 fatalities, are included in the figure (106 car models, 131 light truck models, and 38 CUV/minivan models). The figure indicates that curb weight and footprint are more highly correlated for cars (Pearson correlation coefficient, or r, of 0.90) than for light trucks (r of 0.75) or CUVs/minivans (r of 0.78). Figure 3.2 shows the same data as Figure 3.1, but uses seven vehicle types. Here the correlation ranges from over 0.80 for 4-door cars, SUVs, small pickups, and CUVs to less than 0.80 for large pickups and 2-door cars, to only 0.49 for minivans. The correlation of 0.75 for all light trucks (pickups and SUVs) combined in Figure 3.1 is improved when the types of trucks are analyzed separately in Figure 3.2: 0.90 for SUVs and 0.86 for small pickups, but only 0.67 for large pickups. On the other hand, separating CUVs from minivans improves the correlation between curb weight and footprint for CUVs (0.86) but not for minivans (0.49). The correlation is so poor for minivans in part because of the Kia Sedona, which has a much higher weight (4,730 lbs) for its footprint (51.3 sq ft) than other minivans; removing this model improves the correlation for minivans to 0.63.
9 Allison, P.D.. Logistic Regression Using SAS, Theory and Application. SAS Institute Inc., Cary NC, 1999. 10 Menard, S. Applied Logistic Regression Analysis, Second Edition. Sage Publications, Thousand Oaks CA, 2002. 11 O’Brien, R.M. “A Caution Regarding Rules of Thumb for Variance Inflation Factors,” Quality and Quantitiy, (41) 673-690, 2007.
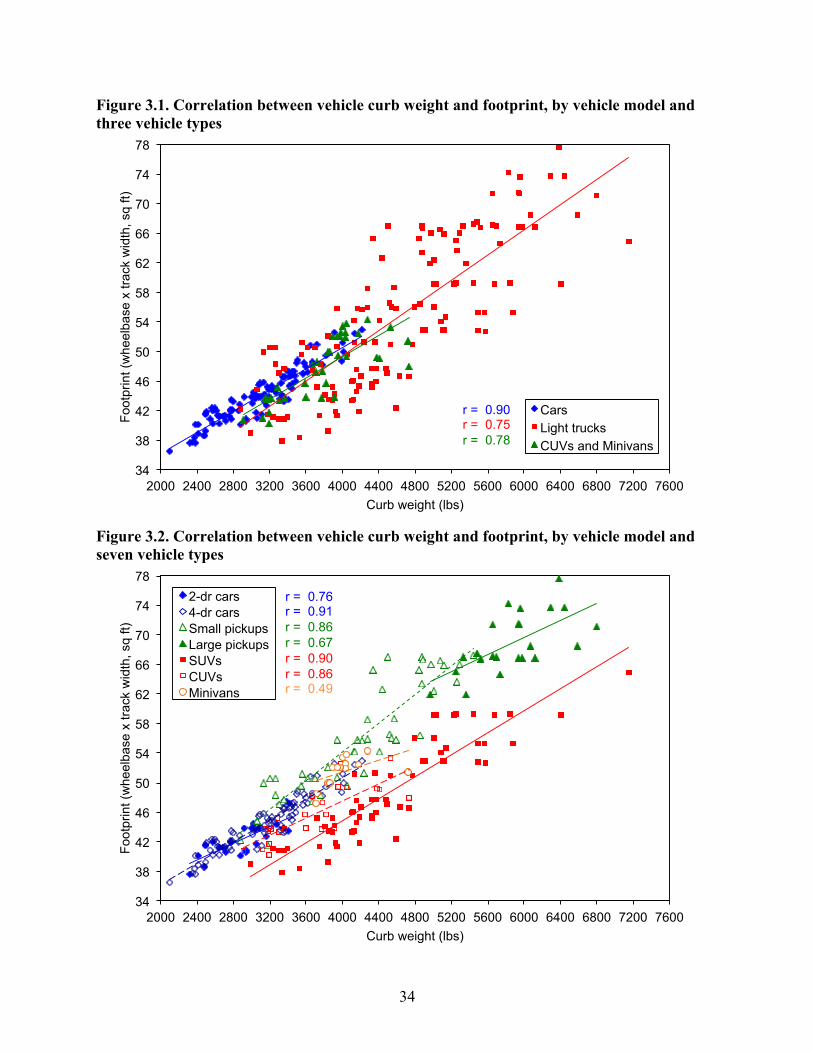
34
Figure 3.1. Correlation between vehicle curb weight and footprint, by vehicle model and three vehicle types
Figure 3.2. Correlation between vehicle curb weight and footprint, by vehicle model and seven vehicle types
R! = 0.87 R! = 0.65 R! = 0.60
34
38
42
46
50
54
58
62
66
70
74
78
2000 2400 2800 3200 3600 4000 4400 4800 5200 5600 6000 6400 6800 7200 7600
Foot
prin
t (w
heel
base
x tr
ack
wid
th, s
q ft)
Curb weight (lbs)
Average footprint and curb weight, by vehicle type and model
Cars Light trucks CUVs and Minivans
r = 0.90 r = 0.75 r = 0.78
R! = 0.65 R! = 0.89 R! = 0.81 R! = 0.43 R! = 0.81 R! = 0.66 R! = 0.26
34
38
42
46
50
54
58
62
66
70
74
78
2000 2400 2800 3200 3600 4000 4400 4800 5200 5600 6000 6400 6800 7200 7600
Foot
prin
t (w
heel
base
x tr
ack
wid
th, s
q ft)
Curb weight (lbs)
Average footprint and curb weight, by vehicle type and model
2-dr cars 4-dr cars Small pickups Large pickups SUVs CUVs Minivans
r = 0.76 r = 0.91 r = 0.86 r = 0.67 r = 0.90 r = 0.86 r = 0.49
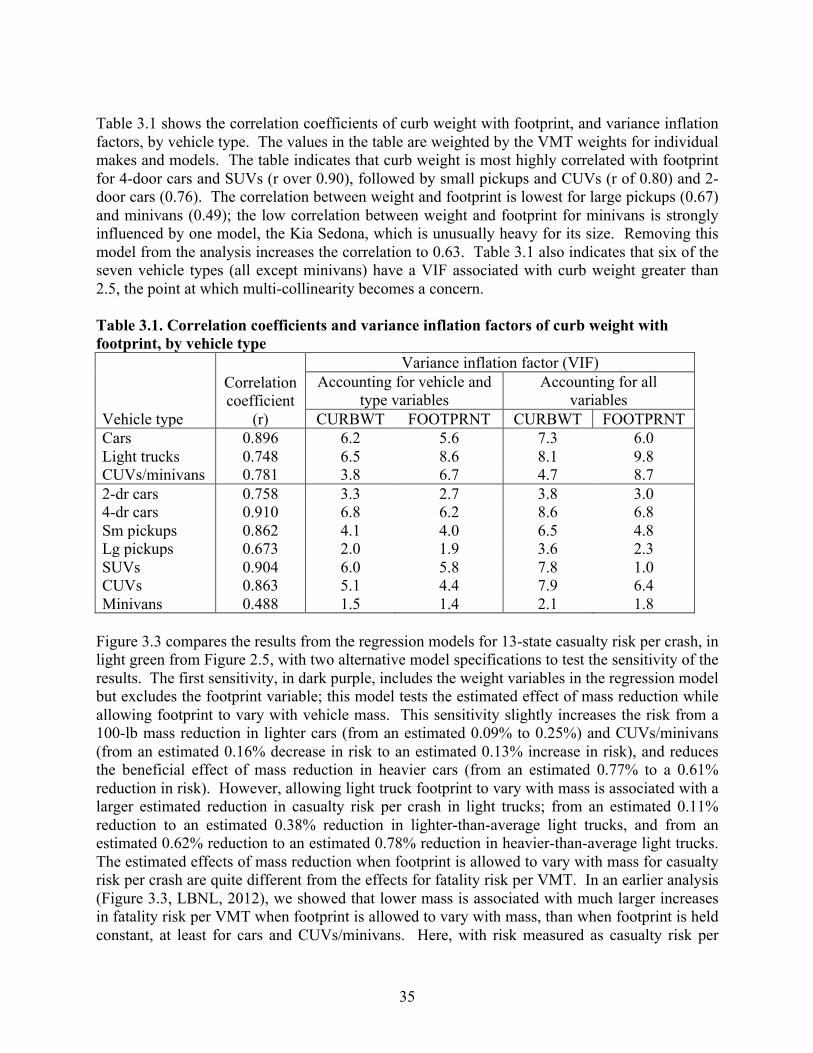
35
Table 3.1 shows the correlation coefficients of curb weight with footprint, and variance inflation factors, by vehicle type. The values in the table are weighted by the VMT weights for individual makes and models. The table indicates that curb weight is most highly correlated with footprint for 4-door cars and SUVs (r over 0.90), followed by small pickups and CUVs (r of 0.80) and 2-door cars (0.76). The correlation between weight and footprint is lowest for large pickups (0.67) and minivans (0.49); the low correlation between weight and footprint for minivans is strongly influenced by one model, the Kia Sedona, which is unusually heavy for its size. Removing this model from the analysis increases the correlation to 0.63. Table 3.1 also indicates that six of the seven vehicle types (all except minivans) have a VIF associated with curb weight greater than 2.5, the point at which multi-collinearity becomes a concern. Table 3.1. Correlation coefficients and variance inflation factors of curb weight with footprint, by vehicle type
Vehicle type
Correlation coefficient
(r)
Variance inflation factor (VIF) Accounting for vehicle and
type variables Accounting for all
variables CURBWT FOOTPRNT CURBWT FOOTPRNT
Cars 0.896 6.2 5.6 7.3 6.0 Light trucks 0.748 6.5 8.6 8.1 9.8 CUVs/minivans 0.781 3.8 6.7 4.7 8.7 2-dr cars 0.758 3.3 2.7 3.8 3.0 4-dr cars 0.910 6.8 6.2 8.6 6.8 Sm pickups 0.862 4.1 4.0 6.5 4.8 Lg pickups 0.673 2.0 1.9 3.6 2.3 SUVs 0.904 6.0 5.8 7.8 1.0 CUVs 0.863 5.1 4.4 7.9 6.4 Minivans 0.488 1.5 1.4 2.1 1.8
Figure 3.3 compares the results from the regression models for 13-state casualty risk per crash, in light green from Figure 2.5, with two alternative model specifications to test the sensitivity of the results. The first sensitivity, in dark purple, includes the weight variables in the regression model but excludes the footprint variable; this model tests the estimated effect of mass reduction while allowing footprint to vary with vehicle mass. This sensitivity slightly increases the risk from a 100-lb mass reduction in lighter cars (from an estimated 0.09% to 0.25%) and CUVs/minivans (from an estimated 0.16% decrease in risk to an estimated 0.13% increase in risk), and reduces the beneficial effect of mass reduction in heavier cars (from an estimated 0.77% to a 0.61% reduction in risk). However, allowing light truck footprint to vary with mass is associated with a larger estimated reduction in casualty risk per crash in light trucks; from an estimated 0.11% reduction to an estimated 0.38% reduction in lighter-than-average light trucks, and from an estimated 0.62% reduction to an estimated 0.78% reduction in heavier-than-average light trucks. The estimated effects of mass reduction when footprint is allowed to vary with mass for casualty risk per crash are quite different from the effects for fatality risk per VMT. In an earlier analysis (Figure 3.3, LBNL, 2012), we showed that lower mass is associated with much larger increases in fatality risk per VMT when footprint is allowed to vary with mass, than when footprint is held constant, at least for cars and CUVs/minivans. Here, with risk measured as casualty risk per

36
crash, lower mass is associated with only slightly larger increases in risk when car or CUV/minivan footprint is allowed to vary with mass (shown in dark purple), than when footprint is held constant (shown in green). Figure 3.3. Estimated effect of reduction in mass or footprint on 13-state casualty risk per crash, by vehicle type: holding footprint constant, allowing footprint to vary with mass, and allowing mass to vary with footprint
The second sensitivity keeps footprint in the regression model, but removes mass, and is shown in light purple in Figure 3.3. Allowing vehicle mass to be reduced with footprint reduces the estimated effect of footprint reduction on casualty risk per crash in cars (from an estimated 0.23% increase to an estimated 0.10% decrease) and light trucks (from an estimated 0.25% decrease to an estimated 0.49% decrease); allowing CUV/minivan mass to vary with footprint has no effect on casualty risk per crash for CUVs/minivans. Figure 3.3 suggests that including both mass and footprint in the same regression model results in only slight changes in the effect of mass and footprint reductions on casualty risk per crash. In its 2012 analysis NHTSA examined the relationship between curb weight and fatality risk for deciles of vehicles with roughly the same footprint. Figure 3.4 shows the range in curb weights for the footprint deciles NHTSA used for the three vehicle types. The figure shows that there is a large degree of overlap in the curb weights of vehicles with roughly the same footprint; this is an indication that the correlation between curb weight and footprint may be strong but is not absolute. NHTSA ran a new regression model with all of the control variables except footprint, for each crash and vehicle type, and footprint decile, a total of 270 regression models; the two mass variables, UNDERWT00 and OVERWT00, originally used for cars and light trucks were
0.09
%
-0.7
7%
-0.1
1%
-0.6
2% -0
.16%
0.23
%
-0.2
5%
0.56
%
0.25
%
-0.6
1%
-0.3
8%
-0.7
8%
0.13
%
-0.1
0%
-0.4
9%
0.56
%
-2.0%
-1.0%
0.0%
1.0%
2.0%
Cars < 3106 Cars > 3106 LTs < 4594 LTs > 4594 CUVs/ minivans
Cars LTs CUVs/ minivans
Per
cent
cha
nge
in ri
sk (c
asua
lty p
roba
bilit
y pe
r cra
sh)
Effect of reduction in weight or size on risk, by vehicle type
13-state casualties per crash Effect of mass reduction, allowing footprint to vary with mass Effect of footprint reduction, allowing mass to vary with footprint
100-lb reduction in weight 1-sq ft reduction in footprint

37
replaced by a single mass variable LBS100. NHTSA listed the number of the regression models for the ten footprint deciles in which the regression coefficient on vehicle mass was positive; that is, where lower mass is associated with an increase in fatality risk. Figure 3.4. Range in curb weight for the footprint deciles, by vehicle type
We replicate this analysis for 13-state casualty risk in Table 3.2, which includes the number of footprint deciles in which the coefficient on vehicle mass is statistically significant. There are four columns for each vehicle type in Table 3.2; the first two indicate the number of footprint deciles in which lower vehicle mass is associated with higher casualty risk per crash, and the number that are statistically significant. Red print indicates cases in which three or more footprint deciles have significant coefficients. The second two columns for each vehicle type indicate the number of footprint deciles in which lower vehicle mass is associated with lower casualty risk per crash, and the number that are statistically significant. For example, in car rollover crashes, mass reduction is associated with higher casualty risk in five footprint deciles, but only two of those associations are statistically significant. On the other hand, lower mass in light trucks is associated with higher casualty risk in rollover crashes in six footprint deciles, and four of those six are statistically significant. Table 3.2 indicates that lower mass is not consistently associated with increased casualty risk for vehicles with similar footprint. Lower mass is associated with higher casualty risk in a majority of footprint deciles for 9 of the 27 crash and vehicle combinations, but few of these increases are statistically significant. On the other hand, lower mass is associated with lower risk in a majority of footprint deciles for 12 of the 27 crash and vehicle combinations, although few of these reductions are statistically significant.
1600 2600 3600 4600 5600 6600 7600
Foot
prin
t dec
ile
Curb weight (lbs)
Range in curb weight for footprint deciles, by vehicle type
Cars
Light trucks
CUVs/minivans

38
Table 3.2. Number of footprint deciles in which lower mass is associated with increasing or decreasing 13-state casualty risk per crash, by vehicle and crash type
Crash type
Cars Light trucks CUVs/Minivans
Num
ber o
f dec
iles w
ith
incr
easi
ng ri
sk
Num
ber o
f dec
iles w
ith
estim
ates
that
are
stat
istic
ally
si
gnifi
cant
N
umbe
r of d
ecile
s with
de
crea
sing
risk
Num
ber o
f dec
iles w
ith
estim
ates
that
are
stat
istic
ally
si
gnifi
cant
Num
ber o
f dec
iles w
ith
incr
easi
ng ri
sk
Num
ber o
f dec
iles w
ith
estim
ates
that
are
stat
istic
ally
si
gnifi
cant
N
umbe
r of d
ecile
s with
de
crea
sing
risk
Num
ber o
f dec
iles w
ith
estim
ates
that
are
stat
istic
ally
si
gnifi
cant
Num
ber o
f dec
iles w
ith
incr
easi
ng ri
sk
Num
ber o
f dec
iles w
ith
estim
ates
that
are
stat
istic
ally
si
gnifi
cant
Num
ber o
f dec
iles w
ith
decr
easi
ng ri
sk
Num
ber o
f dec
iles w
ith
estim
ates
th
at a
re st
atis
tical
ly si
gnifi
cant
1: Rollovers 5 2 5 2 6 4 4 2 5 0 5 2 2: w/object 2 1 8 2 6 2 4 0 5 0 5 0 3: w/ped etc. 4 0 6 1 3 0 7 1 4 1 6 2 4: w/HDT 2 2 8 1 6 2 4 0 6 1 4 0 5: w/lgt car 7 1 3 2 6 3 4 2 4 0 6 1 6: w/hvy car 4 0 6 3 3 1 7 3 7 1 3 0 7: w/lgt LT 5 1 5 2 1 0 9 3 8 0 2 1 8: w/hvy LT 5 1 5 2 8 3 2 2 3 2 7 2 9: Other 3 2 7 3 5 3 5 1 4 3 6 3 The data in Table 3.2 give no information on the size of the effect of mass reduction on casualty risk per crash in the footprint deciles. Figures 3.5 through 3.7 show the percent change in estimated casualty risk from mass reduction for each footprint decile, by vehicle type, for six of the nine crash types (rollovers, and crashes with stationary objects, cars, and light trucks). Figure 3.5 indicates that lower mass is associated with a larger than 5% increase in casualty risk in car rollover in deciles one, nine, and ten, but is associated with a larger than 25% decrease in casualty risk in decile eight. Figure 3.7 indicates that lower mass in CUVs/minivans is associated with reduced casualty risk in rollovers in five of the footprint deciles, and that these reductions are quite large (over 20%) for footprint deciles four, nine and ten. Figures 3.5 through 3.7 suggest that there are no consistent trends in the estimated effect of mass reduction on risk when vehicles are grouped by footprint decile.

39
Figure 3.5. Estimated effect of car mass reduction on 13-state casualty risk per crash, by footprint decile and crash type
Figure 3.6. Estimated effect of light truck mass reduction on 13-state casualty risk per crash, by footprint decile and crash type
-35%
-25%
-15%
-5%
5%
15%
0 1 2 3 4 5 6 7 8 9 10
Per
cent
cha
nge
in c
asua
lty ri
sk p
er c
rash
fro
m m
ass
redu
ctio
n
Footprint decile (lowest to highest)
Effect of mass reduction on car risk, by footprint decile and crash type
Rollovers w/object w/lgt car w/hvy car w/lgt LT w/hvy LT
-10%
-5%
0%
5%
10%
15%
0 1 2 3 4 5 6 7 8 9 10
Per
cent
cha
nge
in c
asua
lty ri
sk p
er c
rash
fro
m m
ass
redu
ctio
n
Footprint decile (lowest to highest)
Effect of mass reduction on LT risk, by footprint decile and crash type
Rollovers w/object w/lgt car w/hvy car w/lgt LT w/hvy LT

40
Figure 3.7. Estimated effect of CUV/minivan mass reduction on 13-state casualty risk per crash, by footprint decile and crash type
4. Casualty risk by vehicle model In this section we examine the variation in societal casualty risk by average vehicle mass and by vehicle model, both before and after accounting for the vehicle, driver and crash variables NHTSA includes in its regression models of US fatality risk per VMT. Figure 4.1 plots unadjusted 13-state casualty risk per crash against average curb weight, with vehicles grouped into 100-lb increments of vehicle curb weight. Figure 4.1 indicates that casualty risk per crash increases slightly for cars, and decreases for light trucks and CUVs/minivans, as curb weight increases. There also is a large degree of variability for cars and light trucks, as indicated by the Pearson correlation coefficient (r) values below 0.20. Figures 4.2 through 4.4 show the relationship between unadjusted casualty risk per crash and mass by more detailed vehicle type. Figure 4.2 indicates that the relationship between curb weight and casualty risk per crash is weaker for 4-door cars than for 2-door cars, with risk actually increasing with increasing mass for 4-door cars between 3,700 and 4,100 lbs. Figure 4.3 suggests that, while casualty risk decreases as the curb weight of small pickups and truck-based SUVs increases, for large pickups (3/4- and 1-ton pickups) casualty risk increases slightly as curb weight increases. And Figure 4.4 indicates that the relationship between casualty risk and curb weight is strong, with a dramatic reduction in casualty risk as mass increases and a high degree of correlation, for CUVs, and especially minivans.
-65%
-45%
-25%
-5%
15%
35%
0 1 2 3 4 5 6 7 8 9 10
Per
cent
cha
nge
in c
asua
lty ri
sk p
er c
rash
fro
m m
ass
redu
ctio
n
Footprint decile (lowest to highest)
Effect of mass reduction on CUV risk, by footprint decile and crash type
Rollovers w/object w/lgt car w/hvy car w/lgt LT w/hvy LT

41
Figure 4.1. Relationship between 13-state casualty risk per crash and curb weight, with vehicles grouped into 100-lb increments of curb weight, by vehicle type
Figure 4.2. Relationship between 13-state casualty risk per crash and curb weight, with vehicles grouped into 100-lb increments of curb weight, passenger cars
R! = 0.03 R! = 0.02 R! = 0.14
0
20
40
60
80
100
120
20 24 28 32 36 40 44 48 52 56 60 64 68 72
13-s
tate
cas
ualty
risk
(cas
ualti
es p
er 1
,000
cra
shes
)
Curb weight (lbs/100)
Casualty risk per crash, by curb weight andvehicle type
Cars Light trucks CUVs and Minivans
r = -0.17 r = 0.16 r = 0.38
R! = 0.38 R! = 0.00
0
20
40
60
80
100
120
20 24 28 32 36 40 44 48 52 56 60 64 68 72
13-s
tate
cas
ualty
risk
(cas
ualti
es p
er 1
,000
cra
shes
)
Curb weight (lbs/100)
Fatality risk per curb weight, passenger cars
2-dr cars 4-dr cars
r = 0.61 r = -0.04

42
Figure 4.3. Relationship between 13-state casualty risk per crash and curb weight, with vehicles grouped into 100-lb increments of curb weight, light trucks
Figure 4.4. Relationship between 13-state casualty risk per crash and curb weight, with vehicles grouped into 100-lb increments of curb weight, CUVs and minivans
R! = 0.06 R! = 0.01 R! = 0.13
0
20
40
60
80
100
120
20 24 28 32 36 40 44 48 52 56 60 64 68 72
13-s
tate
cas
ualty
risk
(cas
ualti
es p
er 1
,000
cra
shes
)
Curb weight (lbs/100)
Fatality risk per curb weight, light trucks
Small pickups Large pickups Truck-based SUVs
r = 0.24 r = -0.10 r = 0.36
R! = 0.34 R! = 0.96
0
20
40
60
80
100
120
20 24 28 32 36 40 44 48 52 56 60 64 68 72
13-s
tate
cas
ualty
risk
(cas
ualti
es p
er 1
,000
cra
shes
)
Curb weight (lbs/100)
Fatality risk per curb weight, CUVs and minivans
Crossover SUVs
Minivans r = 0.58 r = 0.98

43
Figure 4.5 shows the danger of using the average risks of groups of individual models, such as by curb weight bins. The filled symbols in the figure represent the relationship between minivan casualty risk and curb weight when the data are grouped into bins of curb weight, from Figure 4.4; this analysis shows a high correlation between risk and curb weight (R2 of 0.96). However, if the relationship between risk and curb weight of the 13 most popular individual minivan models, which represent over 90% of the minivan casualties and crashes, are plotted, the correlation is much lower, with the R2 dropping to 0.39.12 Figure 4.5. Relationship between 13-state casualty risk per crash and curb weight for minivans, by average risk for 100-lb increments of curb weight and individual models
It is possible that the relationship between vehicle mass and casualty risk is stronger in certain types of crashes. Figure 4.6 presents the relationship between 100-lb increments in curb weight and casualty risk in one-vehicle crashes with a stationary object, the type of crash in which vehicle mass is thought to provide occupants the most protection. For all three types of vehicles, casualty risk per crash in crashes with stationary objects does decline as mass increases; the strength of this relationship is much greater in crashes with stationary objects than in all types of crashes (Figure 4.1). Note that, for a given vehicle weight, light trucks have a higher casualty risk per crash in crashes with stationary objects than cars or CUVs/minivans. Since there are no crash partner casualties in crashes with stationary objects, we suspect that light trucks have a higher risk than cars in Figure
12 Figure 4.5 actually excludes one additional popular minivan model, which has the highest casualty risk (67 per 1,000 crashes) and weight (4,728 lbs) of the minivan models shown; including this model would make the correlation between casualty risk and curb weight even lower.
R! = 0.96
R! = 0.39
0
10
20
30
40
50
60
70
80
20 24 28 32 36 40 44 48 52 56 60 64 68 72
13-s
tate
cas
ualty
risk
(cas
ualti
es p
er 1
,000
cra
shes
)
Curb weight (lbs)
Casualty risk per crash, minivans
Curb weight bins
Individual models

44
4.6 because of their tendency to roll over, their increased use on more dangerous rural roads, and perhaps more passenger casualties in light trucks than in cars. Figure 4.6. Relationship between 13-state casualty risk per crash in crashes with stationary objects and curb weight, by vehicle type
Table 4.1 summarizes the correlations between risk and a decrease in curb weight by 100-lb weight bins, by vehicle type, presented in Figures 4.1 through 4.6. Table 4.1. Correlation between risk and a decrease in curb weight, for vehicles grouped in 100-lb curb weight bins
Vehicle type US fatality risk, all crashes
US fatality risk, crashes with stationary objects
Estimate r R2 Estimate r R2 Cars -0.13% -0.17 0.03 0.09% * 0.70 0.49 Light trucks 0.23% 0.16 0.02 0.09% * 0.53 0.28 CUVs/minivans 0.84% 0.38 0.14 0.13% * 0.63 0.40 2-dr cars 0.59% * 0.61 0.38 0.12% 0.40 0.16 4-dr cars -0.04% -0.04 0.00 0.04% * 0.49 0.24 Sm pickups 0.40% 0.24 0.06 0.14% * 0.63 0.39 Lg pickups -0.17% -0.10 0.01 0.01% 0.04 0.00 SUVs 1.25% 0.36 0.13 0.23% * 0.59 0.35 CUVs 1.77% * 0.58 0.34 0.23% * 0.78 0.61 Minivans 2.75% * 0.98 0.96 0.18% * 0.90 0.80
R! = 0.49 R! = 0.28 R! = 0.40
0
2
4
6
8
10
12
20 24 28 32 36 40 44 48 52 56 60 64 68 72
13-s
tate
cas
ualty
risk
(cas
ualti
es p
er 1
,000
cra
shes
)
Curb weight (lbs/100)
Fatality risk in crashes with objects per curb weight, by vehicle type
Cars Light trucks CUVs and Minivans
r = 0.70 r = 0.53 r = 0.63

45
Figures 4.1 through 4.6 and Table 4.1 show that grouping vehicles into 100-lb mass increments indicates that, for some vehicle types, casualty risk per crash decreases as mass increases. Figure 4.7 shows the relationship between vehicle mass and casualty risk by individual vehicle model. Only 275 models with at least 12 billion VMT, or at least 100 fatalities, based on the NHTSA 2011 analysis, are included (106 car models, 131 light truck models, and 38 CUV/minivan models); these models represent over 90% of all casualties and crashes. Here we see that casualty risk declines slightly with increasing mass for cars, light trucks, and CUVs/minivans. Although casualty risk gradually declines with increasing mass, the extremely low R2 values (all less than 0.10) indicate that there is essentially no relationship between mass and casualty risk per crash, for any of the three types of vehicles, and that there is a very large range in casualty risk for individual vehicle models at a given weight. For example, the vehicle model labeled A in the figure, which weighs 2,579 lbs, has a casualty risk of 86 per 1,000 crashes, while model B, which weighs slightly less (2,500 lbs), has a casualty risk of only 44. Figure 4.7. 13-state casualty risk per crash and curb weight, by vehicle model
Of course, differences in vehicles (footprint, two- vs. four-doors, and presence of side impact air bags, automated braking systems, or electronic stability controls), drivers (age and gender), and crash characteristics (at night, on high-speed roads, or in rural vs. urban areas or high-casualty risk states) by vehicle model may explain some of the large range in casualty risk by vehicle weight. To account for these various variables, we reran the logistic regression models including all of the driver, crash, and vehicle control variables except vehicle mass and footprint, across all types of crashes for each of the three vehicle types. We then calculated the predicted casualty
R! = 0.02
R! = 0.00 R! = 0.08
0
20
40
60
80
100
120
140
160
2000 2400 2800 3200 3600 4000 4400 4800 5200 5600 6000 6400 6800 7200
13-s
tate
cas
ualty
risk
(cas
ualti
es p
er 1
,000
cra
shes
)
Curb weight (lbs)
Unadjusted US fatality risk per VMT and curb weight, by vehicle type
Cars Light trucks CUVs and Minivans
A
B
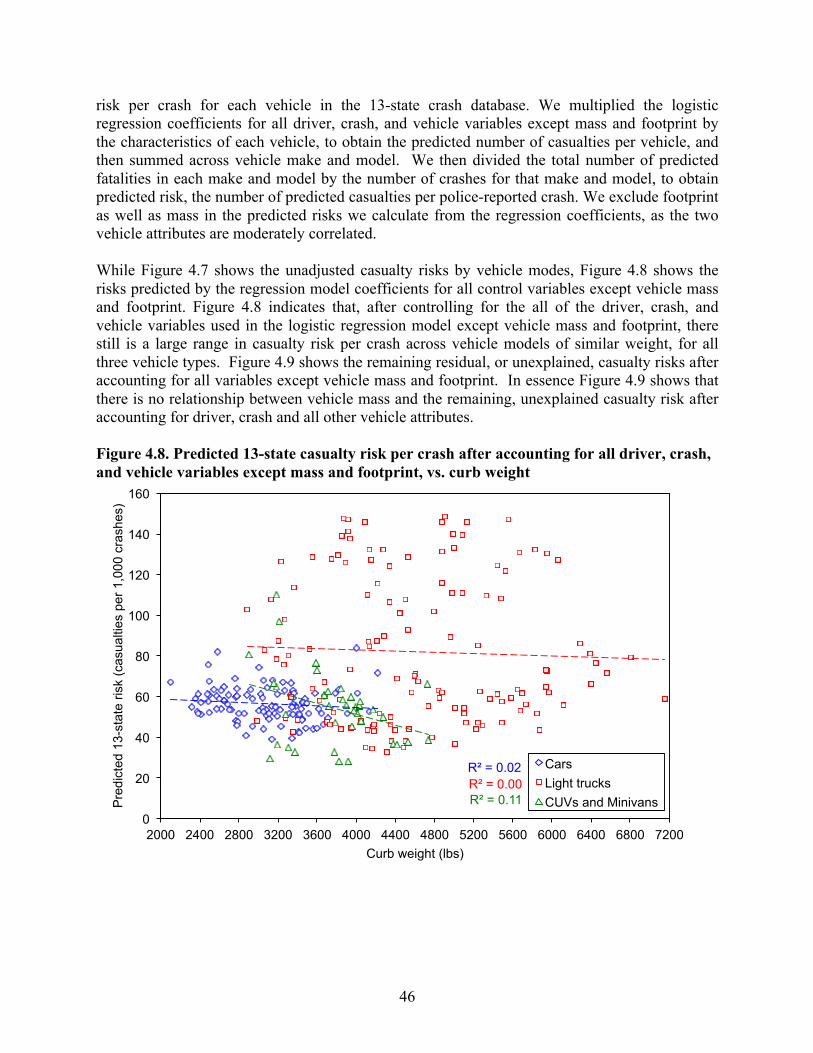
46
risk per crash for each vehicle in the 13-state crash database. We multiplied the logistic regression coefficients for all driver, crash, and vehicle variables except mass and footprint by the characteristics of each vehicle, to obtain the predicted number of casualties per vehicle, and then summed across vehicle make and model. We then divided the total number of predicted fatalities in each make and model by the number of crashes for that make and model, to obtain predicted risk, the number of predicted casualties per police-reported crash. We exclude footprint as well as mass in the predicted risks we calculate from the regression coefficients, as the two vehicle attributes are moderately correlated. While Figure 4.7 shows the unadjusted casualty risks by vehicle modes, Figure 4.8 shows the risks predicted by the regression model coefficients for all control variables except vehicle mass and footprint. Figure 4.8 indicates that, after controlling for the all of the driver, crash, and vehicle variables used in the logistic regression model except vehicle mass and footprint, there still is a large range in casualty risk per crash across vehicle models of similar weight, for all three vehicle types. Figure 4.9 shows the remaining residual, or unexplained, casualty risks after accounting for all variables except vehicle mass and footprint. In essence Figure 4.9 shows that there is no relationship between vehicle mass and the remaining, unexplained casualty risk after accounting for driver, crash and all other vehicle attributes. Figure 4.8. Predicted 13-state casualty risk per crash after accounting for all driver, crash, and vehicle variables except mass and footprint, vs. curb weight
R! = 0.02 R! = 0.00 R! = 0.11
0
20
40
60
80
100
120
140
160
2000 2400 2800 3200 3600 4000 4400 4800 5200 5600 6000 6400 6800 7200
Pre
dict
ed 1
3-st
ate
risk
(cas
ualti
es p
er 1
,000
cra
shes
)
Curb weight (lbs)
Predicted risk, accntg for all variables except weight and footprint
Cars Light trucks CUVs and Minivans
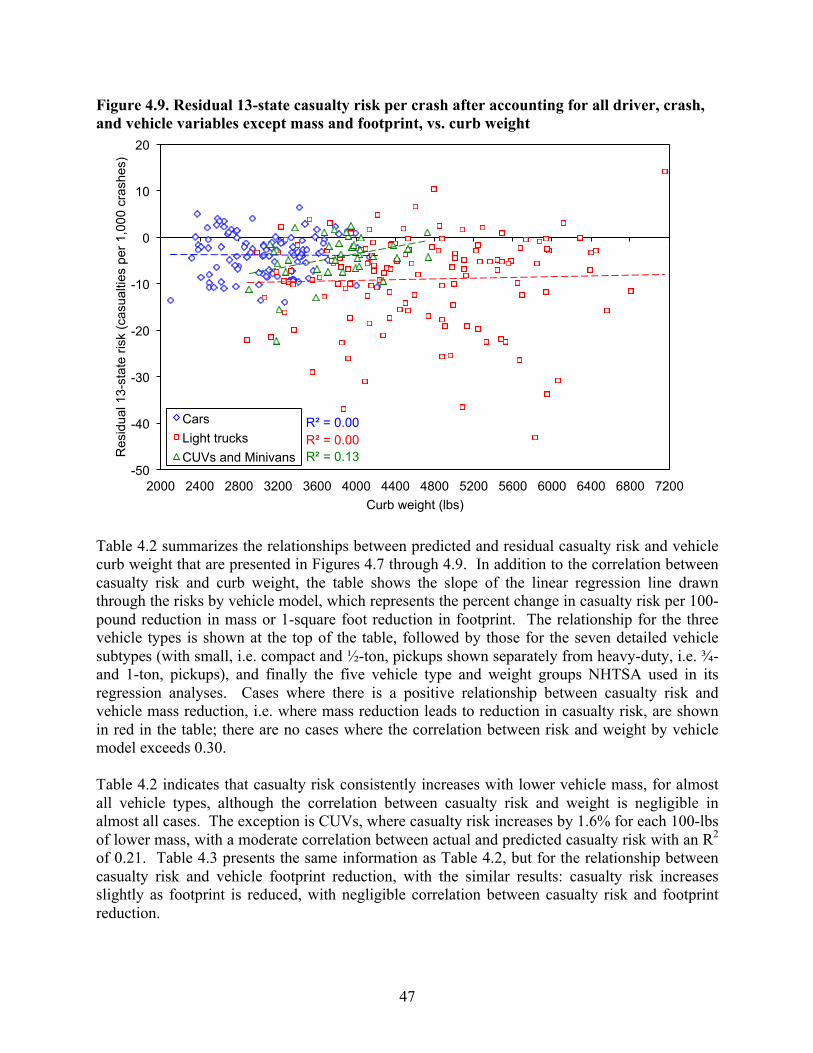
47
Figure 4.9. Residual 13-state casualty risk per crash after accounting for all driver, crash, and vehicle variables except mass and footprint, vs. curb weight
Table 4.2 summarizes the relationships between predicted and residual casualty risk and vehicle curb weight that are presented in Figures 4.7 through 4.9. In addition to the correlation between casualty risk and curb weight, the table shows the slope of the linear regression line drawn through the risks by vehicle model, which represents the percent change in casualty risk per 100-pound reduction in mass or 1-square foot reduction in footprint. The relationship for the three vehicle types is shown at the top of the table, followed by those for the seven detailed vehicle subtypes (with small, i.e. compact and ½-ton, pickups shown separately from heavy-duty, i.e. ¾- and 1-ton, pickups), and finally the five vehicle type and weight groups NHTSA used in its regression analyses. Cases where there is a positive relationship between casualty risk and vehicle mass reduction, i.e. where mass reduction leads to reduction in casualty risk, are shown in red in the table; there are no cases where the correlation between risk and weight by vehicle model exceeds 0.30. Table 4.2 indicates that casualty risk consistently increases with lower vehicle mass, for almost all vehicle types, although the correlation between casualty risk and weight is negligible in almost all cases. The exception is CUVs, where casualty risk increases by 1.6% for each 100-lbs of lower mass, with a moderate correlation between actual and predicted casualty risk with an R2 of 0.21. Table 4.3 presents the same information as Table 4.2, but for the relationship between casualty risk and vehicle footprint reduction, with the similar results: casualty risk increases slightly as footprint is reduced, with negligible correlation between casualty risk and footprint reduction.
R! = 0.00 R! = 0.00 R! = 0.13
-50
-40
-30
-20
-10
0
10
20
2000 2400 2800 3200 3600 4000 4400 4800 5200 5600 6000 6400 6800 7200
Res
idua
l 13-
stat
e ris
k (c
asua
lties
per
1,0
00 c
rash
es)
Curb weight (lbs)
Residual risk accounting for all variables except weight and footprint
Cars Light trucks CUVs and Minivans
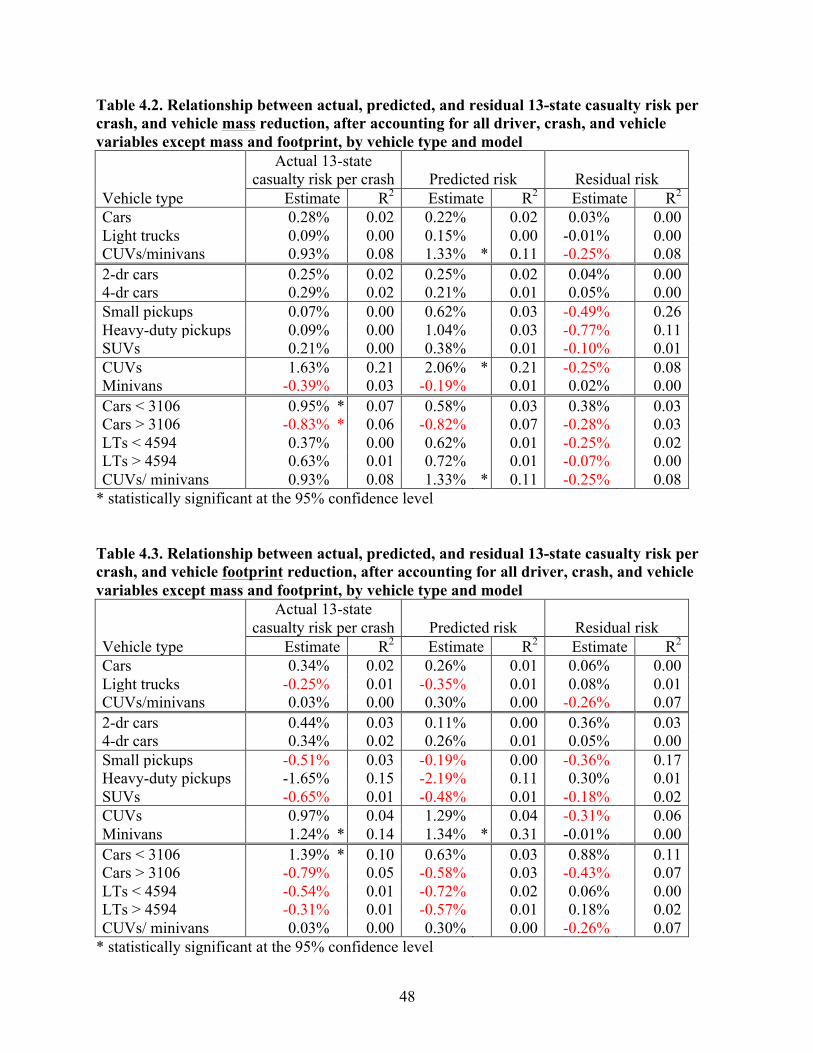
48
Table 4.2. Relationship between actual, predicted, and residual 13-state casualty risk per crash, and vehicle mass reduction, after accounting for all driver, crash, and vehicle variables except mass and footprint, by vehicle type and model
Vehicle type
Actual 13-state casualty risk per crash Predicted risk Residual risk
Estimate R2 Estimate R2 Estimate R2 Cars 0.28% 0.02 0.22% 0.02 0.03% 0.00 Light trucks 0.09% 0.00 0.15% 0.00 -0.01% 0.00 CUVs/minivans 0.93% 0.08 1.33% * 0.11 -0.25% 0.08 2-dr cars 0.25% 0.02 0.25% 0.02 0.04% 0.00 4-dr cars 0.29% 0.02 0.21% 0.01 0.05% 0.00 Small pickups 0.07% 0.00 0.62% 0.03 -0.49% 0.26 Heavy-duty pickups 0.09% 0.00 1.04% 0.03 -0.77% 0.11 SUVs 0.21% 0.00 0.38% 0.01 -0.10% 0.01 CUVs 1.63% 0.21 2.06% * 0.21 -0.25% 0.08 Minivans -0.39% 0.03 -0.19% 0.01 0.02% 0.00 Cars < 3106 0.95% * 0.07 0.58% 0.03 0.38% 0.03 Cars > 3106 -0.83% * 0.06 -0.82% 0.07 -0.28% 0.03 LTs < 4594 0.37% 0.00 0.62% 0.01 -0.25% 0.02 LTs > 4594 0.63% 0.01 0.72% 0.01 -0.07% 0.00 CUVs/ minivans 0.93% 0.08 1.33% * 0.11 -0.25% 0.08
* statistically significant at the 95% confidence level Table 4.3. Relationship between actual, predicted, and residual 13-state casualty risk per crash, and vehicle footprint reduction, after accounting for all driver, crash, and vehicle variables except mass and footprint, by vehicle type and model
Vehicle type
Actual 13-state casualty risk per crash Predicted risk Residual risk
Estimate R2 Estimate R2 Estimate R2 Cars 0.34% 0.02 0.26% 0.01 0.06% 0.00 Light trucks -0.25% 0.01 -0.35% 0.01 0.08% 0.01 CUVs/minivans 0.03% 0.00 0.30% 0.00 -0.26% 0.07 2-dr cars 0.44% 0.03 0.11% 0.00 0.36% 0.03 4-dr cars 0.34% 0.02 0.26% 0.01 0.05% 0.00 Small pickups -0.51% 0.03 -0.19% 0.00 -0.36% 0.17 Heavy-duty pickups -1.65% 0.15 -2.19% 0.11 0.30% 0.01 SUVs -0.65% 0.01 -0.48% 0.01 -0.18% 0.02 CUVs 0.97% 0.04 1.29% 0.04 -0.31% 0.06 Minivans 1.24% * 0.14 1.34% * 0.31 -0.01% 0.00 Cars < 3106 1.39% * 0.10 0.63% 0.03 0.88% 0.11 Cars > 3106 -0.79% 0.05 -0.58% 0.03 -0.43% 0.07 LTs < 4594 -0.54% 0.01 -0.72% 0.02 0.06% 0.00 LTs > 4594 -0.31% 0.01 -0.57% 0.01 0.18% 0.02 CUVs/ minivans 0.03% 0.00 0.30% 0.00 -0.26% 0.07
* statistically significant at the 95% confidence level

49
In its 2012 report NHTSA notes that, despite their theoretical advantage in terms of handling, braking, and accelerating, small and light vehicles historically have had higher crash and insurance claim frequency per vehicle mile traveled. This discrepancy suggests that small and light vehicles have not been driven as well as larger, heavier ones, perhaps because less capable drivers tend to choose smaller and lighter vehicles. In their peer review, Kockelman and Chen (University of Texas) noted that low-income drivers tend to drive poorly, or in environments that are more dangerous than higher income drivers (SRA 2012). One indication of driving behavior is the frequency of one-vehicle, non-rollover crashes per VMT: one-vehicle crashes are most likely the fault of the driver of the crash-involved vehicle, while it is more difficult to assign fault to drivers in multi-vehicle crashes. The relationship between crash frequency in one-vehicle non-rollover crashes and household income, vehicle mass, and initial vehicle purchase price by vehicle make and model is shown in Table 4.4 by vehicle type. The first columns of the table indicate that the frequency of one-vehicle crashes decreases as household income increases, for all vehicle types, and that the frequency of one-vehicle crashes in cars, and to a lesser extent in CUVs and minivans, is somewhat correlated with driver income, with an R2 of over 0.30. The middle columns of the table indicate that, while the frequency of one-vehicle crashes tends to decrease with increasing vehicle mass for most vehicle types, it is not strongly correlated with vehicle mass. The frequency of one-vehicle crashes involving full size pickups actually increases (by 2.3%) as full size pickup mass increases. NHTSA infers from its analysis of crash culpability that “small, light vehicles have not been driven as well as large, heavier ones;” Table 4.4 suggests that the higher frequency of one-vehicle crashes involving lighter cars is a function of poor driving behavior of the lower income households that tend to own these vehicles, and is unrelated to vehicle mass. The ability of a vehicle to avoid a crash altogether may account for some of the correlation between car crash frequency and driver income; low-income drivers may not be able to afford vehicles that tend to have higher crash avoidance capabilities, such as improved handling and reduced braking distance. We use the initial purchase price by vehicle model as a proxy for the general quality of vehicle design; clearly other measures of vehicle handling and braking distance, such as vehicle tests conducted by Consumer’s Union, would be preferable measures of a vehicle’s crash avoidance capabilities. The last columns in Table 4.4 suggest that the frequency of one-vehicle non-rollover crashes does decline as initial purchase price increases for most vehicle types, but the relationship is not strong. However, crash frequency increases as the purchase price of fullsize pickups and minivans increases.

50
Table 4.4. Relationship between frequency of one-vehicle non-rollover crashes and household income, vehicle mass, and initial vehicle purchase price, by vehicle type and model
Vehicle type
1-vehicle crash frequency and
household income 1-vehicle crash
frequency and mass
1-vehicle crash frequency and initial
purchase price Estimate R2 Estimate R2 Estimate R2
Cars -6.0% * 0.36 -3.6% * 0.12 -2.3% * 0.23 Light trucks -3.0% 0.03 -1.3% * 0.06 -1.7% * 0.07 CUVs/minivans -4.0% * 0.40 0.0% 0.00 -1.0% 0.03 2-dr cars -10.6% * 0.42 -2.3% 0.02 -4.9% * 0.18 4-dr cars -5.1% * 0.52 -2.7% * 0.13 -1.8% * 0.30 Small pickups -7.0% 0.04 0.0% 0.00 0.3% 0.00 Heavy-duty pickups -4.4% 0.03 2.3% 0.09 5.3% * 0.28 SUVs -1.2% 0.01 -2.4% * 0.14 -2.2% * 0.14 CUVs -3.4% * 0.38 -0.6% 0.01 -1.8% * 0.17 Minivans -5.0% * 0.32 -2.7% 0.03 4.8% 0.19 Cars < 3106 -5.2% * 0.13 1.2% 0.00 -1.5% 0.01 Cars > 3106 -5.5% * 0.58 -4.0% * 0.07 -2.1% * 0.31 LTs < 4594 -3.5% 0.03 -1.7% 0.02 -1.0% 0.01 LTs > 4594 -1.8% 0.02 -0.1% 0.00 -1.4% 0.04 CUVs/ minivans -4.0% * 0.40 0.0% 0.00 -1.0% 0.03
* statistically significant at the 95% confidence level We tested whether accounting for vehicle purchase price or household income in the regression models might change the unexpected relationship that crash frequency increases as vehicle mass decreases. For every $1,000 increase in purchase price, crash frequency is estimated to decline 0.85% +/- 0.05% for cars, 1.18% +/- 0.07% for light trucks, and 1.22% +/- 0.13% for CUVs/minivans; similarly, for every $1,000 increase in driver household income, crash frequency is estimated to decline 0.80% +/- 0.06% for cars, 0.20% +/- 0.10% for light trucks, and 0.94% +/- 0.11% for CUVs/minivans. Figure 4.10 compares the estimates for mass or footprint reduction on 13-state crash frequency per VMT, before and after adding the vehicle price and household income control variables to the regression models. Adding vehicle purchase price substantially reduces the estimated increase in crash frequency as vehicle mass decreases for all vehicle types; in the case of heavier-than-average cars, mass reduction is estimated to slightly decrease crash frequency. Adding household income has virtually no effect on the estimated relationship between vehicle mass and crash frequency for cars and light trucks, but reduces the estimated increase in crash frequency for CUVs/minivans.

51
Figure 4.10. Estimated effect of mass or footprint reduction on 13-state crashes per VMT, after accounting for vehicle purchase price or median household income, by vehicle type
We examine the estimated effect of mass or footprint reductions on casualty risk per crash after accounting for initial vehicle purchase price and median household income in Sections 5.3 and Section 5.5, respectively.
2.00
%
1.50
%
1.44
%
0.94
%
0.95
%
0.64
% 1.04
%
-0.5
5%
1.41
%
-0.0
6%
0.85
%
0.20
%
0.14
%
0.73
%
0.83
%
-0.8
7%
1.95
%
1.33
%
1.52
%
0.94
%
0.59
%
0.92
%
1.03
%
-0.2
3%
-2.0%
-1.0%
0.0%
1.0%
2.0%
3.0%
Cars < 3106 Cars > 3106 LTs < 4594 LTs > 4594 CUVs/ minivans
Cars LTs CUVs/ minivans P
erce
nt c
hang
e in
cra
sh fr
eque
ncy
(cra
shes
per
VM
T)
Effect of reduction in weight or size on risk, by vehicle type
13-state crashes per VMT Including vehicle purchase price Including median household income
100-lb reduction in weight 1-sq ft reduction in footprint

52
5. Sensitivity of 13-state casualty risk per crash results to data used and model specification In this section we examine the sensitivity of our results on the estimated effect of mass or footprint reduction on 13-state casualty risk per crash. We examine the effect of different methods of accounting for the state in which the crash occurred, and how the effect of mass or footprint reduction changes after accounting for vehicle manufacturer, after excluding the calendar year control variables, and after adding additional data to the analysis. 5.1. State control variables As discussed above, we included 12 control variables to account for the different reporting requirements in each state, as well as other differences in risk per crash among states. Figure 5.1 compares the effect of this approach with two other approaches: not accounting for state at all in the analysis, and using only two control variables, HIINJ and LOINJ, to identify states with relatively high (Alabama, Florida, Maryland, and Wyoming,) and relatively low (Michigan, New Jersey, and Washington) casualty risk per crash (see Figure 2.3, above). Figure 5.1 indicates that mass reduction has a much larger estimated beneficial effect, and footprint reduction a much more detrimental effect in cars and CUVs/minivans, when one excludes the state in which the crash occurred from the regression models (shown in blue). Including only the two variables to control for state, HIINJ and LOINJ, substantially reduces the estimated effect of mass and footprint reduction on casualty risk per crash (shown in red); including the 12 control variables for individual states reduces the estimated effect a little bit more (shown in green). Figure 5.1. Estimated effect of mass or footprint reduction on 13-state casualty risk per crash by vehicle type, under two methods of controlling for the state in which the crash occurred
-0.6
4%
-1.6
8%
-0.2
1%
-1.8
4%
-2.0
9%
1.52
%
-1.0
5%
3.79
%
-0.1
3%
-1.1
9%
-0.1
5%
-0.7
5%
-0.4
7%
0.45
%
-0.3
0%
0.69
%
0.09
%
-0.7
7% -0.1
1%
-0.6
2%
-0.1
6%
0.23
%
-0.2
5%
0.56
%
-3.0%
-2.0%
-1.0%
0.0%
1.0%
2.0%
3.0%
4.0%
5.0%
Cars < 3106 Cars > 3106 LTs < 4594 LTs > 4594 CUVs/ minivans
Cars LTs CUVs/ minivans
Per
cent
cha
nge
in ri
sk (c
asua
lty p
roba
bilit
y)
Effect of reduction in weight or size on risk, by vehicle type
No state variables Including HIINJ and LOINJ Including 12 state variables
100-lb reduction in weight 1-sq ft reduction in footprint
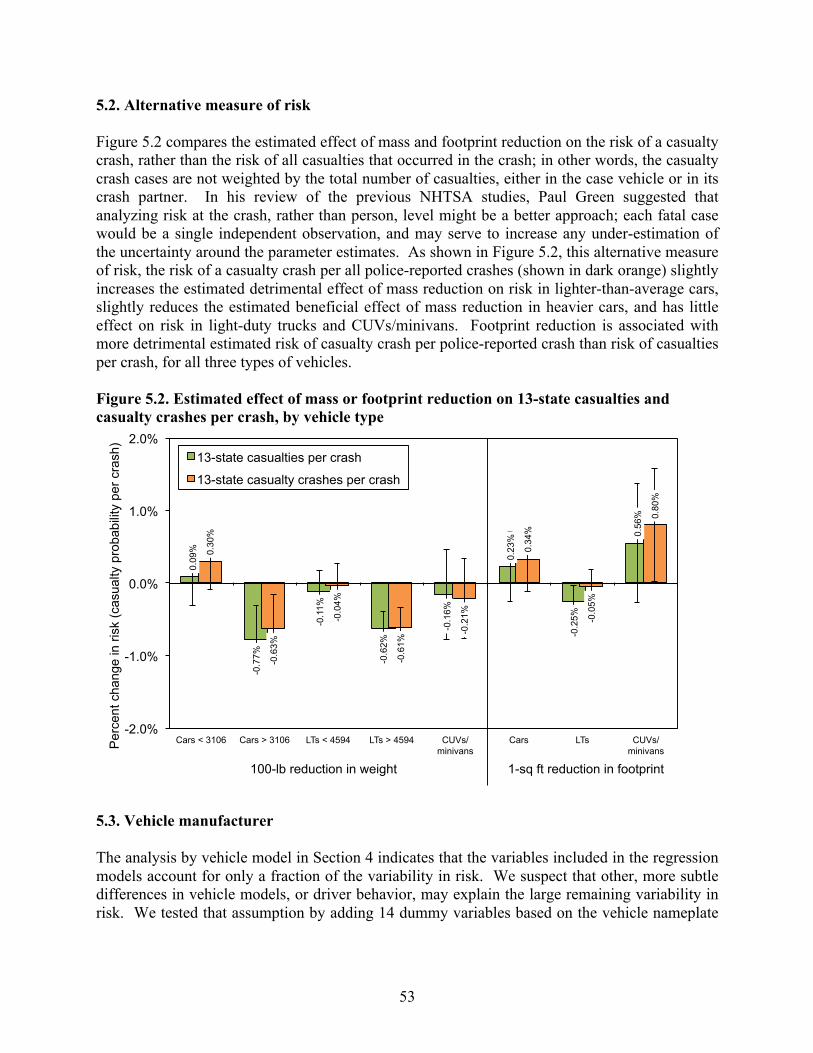
53
5.2. Alternative measure of risk Figure 5.2 compares the estimated effect of mass and footprint reduction on the risk of a casualty crash, rather than the risk of all casualties that occurred in the crash; in other words, the casualty crash cases are not weighted by the total number of casualties, either in the case vehicle or in its crash partner. In his review of the previous NHTSA studies, Paul Green suggested that analyzing risk at the crash, rather than person, level might be a better approach; each fatal case would be a single independent observation, and may serve to increase any under-estimation of the uncertainty around the parameter estimates. As shown in Figure 5.2, this alternative measure of risk, the risk of a casualty crash per all police-reported crashes (shown in dark orange) slightly increases the estimated detrimental effect of mass reduction on risk in lighter-than-average cars, slightly reduces the estimated beneficial effect of mass reduction in heavier cars, and has little effect on risk in light-duty trucks and CUVs/minivans. Footprint reduction is associated with more detrimental estimated risk of casualty crash per police-reported crash than risk of casualties per crash, for all three types of vehicles. Figure 5.2. Estimated effect of mass or footprint reduction on 13-state casualties and casualty crashes per crash, by vehicle type
5.3. Vehicle manufacturer The analysis by vehicle model in Section 4 indicates that the variables included in the regression models account for only a fraction of the variability in risk. We suspect that other, more subtle differences in vehicle models, or driver behavior, may explain the large remaining variability in risk. We tested that assumption by adding 14 dummy variables based on the vehicle nameplate
0.09
%
-0.7
7%
-0.1
1%
-0.6
2% -0
.16%
0.23
%
-0.2
5%
0.56
%
0.30
%
-0.6
3%
-0.0
4%
-0.6
1% -0
.21%
0.34
%
-0.0
5%
0.80
%
-2.0%
-1.0%
0.0%
1.0%
2.0%
Cars < 3106 Cars > 3106 LTs < 4594 LTs > 4594 CUVs/ minivans
Cars LTs CUVs/ minivans P
erce
nt c
hang
e in
risk
(cas
ualty
pro
babi
lity
per c
rash
)
Effect of increase in weight or size on risk, by vehicle type
13-state casualties per crash
13-state casualty crashes per crash
100-lb reduction in weight 1-sq ft reduction in footprint

54
manufacturer. 13 GM brands (Buick, Cadillac, Chevrolet, GMC, Oldsmobile, Pontiac, and Saturn) are treated as the default value, since combined they represent the most vehicles by manufacturer, in terms of both casualties and police-reported crashes. The five Chrysler brands (Jeep, Chrysler, Dodge, Plymouth, and Sprinter) were combined in a single Chrysler category, while the three Ford brands (Ford, Lincoln, Mercury) were combined in a single Ford category. Ten low-volume manufacturers were grouped into a separate Other manufacturer category. 14 Figure 5.3 compares the effect of adding variables for each of the 14 manufacturers (shown in red) to the regression models estimating casualty risk per crash from the thirteen states in Figure 2.5 above (shown in light green). Accounting for vehicle manufacturer results in a large estimated increase in the harmful effect of mass reduction for cars, slightly increases the estimated beneficial effect of mass reduction in light trucks, and slightly decreases the estimated beneficial effect in CUVs/minivans. Accounting for vehicle manufacturer has the opposite result on the effect of footprint reduction on risk: the estimated effect of footprint reduction becomes beneficial for cars, less beneficial for light trucks, and more detrimental for CUVs/minivans. Figure 5.3. Estimated effect of mass or footprint reduction on 13-state casualty risk per crash by vehicle type, after controlling for vehicle manufacturer
Figure 5.3 also shows a second case in which five additional control variables are included for five luxury brands (Cadillac, Lincoln, Acura, Infiniti, and Lexus). Including the five luxury brands in the regression models (shown in light orange) results in little change in the estimated
13 The 14 manufacturers are: Chrysler, Ford, BMW, Honda, Hyundai, Kia, Mazda, Mercedes-Benz, Mitsubishi, Nissan, Subaru, Toyota, Volkswagen, and Volvo. 14 The manufacturers included in the Other category are: AM General, Audi, Daewoo, Isuzu, Jaguar, Land Rover, Mini, Porsche, Saab, and Suzuki.
0.09
%
-0.7
7%
-0.1
1%
-0.6
2% -0
.16%
0.23
%
-0.2
5%
0.56
% 0.85
%
0.78
%
-0.2
4%
-0.6
5%
-0.0
5%
-0.5
2% -0
.09%
0.88
%
0.96
%
0.76
%
-0.2
4%
-0.6
0%
-0.4
0%
-0.6
0%
-0.1
1%
1.16
%
-2.0%
-1.0%
0.0%
1.0%
2.0%
Cars < 3106 Cars > 3106 LTs < 4594 LTs > 4594 CUVs/ minivans
Cars LTs CUVs/ minivans P
erce
nt c
hang
e in
risk
(fat
ality
pro
babi
lity
per 1
010
VM
T)
Effect of increase in weight or size on risk, by vehicle type
13-state casualties per crash Including 14 vehicle makes Plus 5 luxury brands
100-lb reduction in weight 1-sq ft reduction in footprint

55
effect of mass or footprint reduction on risk in cars and light trucks, but increases the estimated beneficial effect of mass reduction, and increases the estimated detrimental effect of footprint reduction, in CUVs/minivans. Initial vehicle purchase price, rather than manufacturer nameplate, is another proxy for the general quality of vehicle design. We obtained the initial purchase price from the Polk VIN decoder, using 2010 California registration data from the state Department of Motor Vehicles. Every $1,000 increase in initial purchase price is estimated to reduce casualty risk per crash in all three types of vehicles: by 0.52% +/- 0.13% in cars, 0.28% +/- 0.15% in light trucks, and 0.52% +/- 0.31% in CUVs/minivans. Figure 5.4 shows how accounting for vehicle purchase price changes the estimated effect of mass or footprint reduction on casualty risk per crash, compared to the control variables for vehicle manufacturer. In contrast with the manufacturer variables, including vehicle purchase price increases the estimated beneficial effect of mass reduction, especially in cars and CUVs/minivans. Accounting for initial vehicle purchase price makes the estimated effect of footprint reduction slightly more detrimental in cars, more beneficial in light-duty trucks, and less detrimental in CUVs/minivans. Figure 5.4. Estimated effect of mass or footprint reduction on US fatalities per VMT, after controlling for vehicle manufacturer or for initial vehicle purchase price, by vehicle type
The control variables for vehicle manufacturer and initial purchase price attempt to account for differences in vehicle models not controlled for in the NHTSA regression models. Other vehicle attributes which could explain the remaining unexplained risk include:
• relatively low bumper height, which increases the extent to which a vehicle’s front bumper overlaps the bumper or door sill of a crash partner, may reduce risk in two-vehicle crashes;
0.09
%
-0.7
7%
-0.1
1%
-0.6
2% -0
.16%
0.23
%
-0.2
5%
0.56
% 0.85
%
0.78
%
-0.2
4%
-0.6
5%
-0.0
5%
-0.5
2% -0
.09%
0.88
%
0.96
%
0.76
%
-0.2
4%
-0.6
0%
-0.4
0%
-0.6
0%
-0.1
1%
1.16
%
-0.3
5%
-1.7
2%
-0.1
4%
-0.7
1%
-0.6
4%
0.29
%
-0.4
0%
0.41
%
-2.0%
-1.0%
0.0%
1.0%
2.0%
Cars < 3106 Cars > 3106 LTs < 4594 LTs > 4594 CUVs/ minivans
Cars LTs CUVs/ minivans P
erce
nt c
hang
e in
risk
(fat
ality
pro
babi
lity
per 1
010
VM
T)
Effect of increase in weight or size on risk, by vehicle type
13-state casualties per crash Including 14 vehicle makes Plus 5 luxury brands Initial purchase price
100-lb reduction in weight 1-sq ft reduction in footprint

56
• lower center of gravity, or static stability factor, may reduce the tendency of a vehicle to roll over;
• high engine power-to-weight ratio may increase crash frequency, and • measures of braking distance and handling capabilities which may affect the ability of
vehicles to avoid crashes; LBNL may estimate the effect of accounting for these vehicle attributes in future analyses. 5.4. Calendar year variables One interesting effect of the regression models is the reduction in casualty risk per crash over time, as indicated by the coefficients for the calendar year control variables. The reduction is consistent, and of roughly the same magnitude, for each vehicle type, as shown in Figure 5.5. The calendar year variables account for changes in both case vehicles and their crash partners, as well as the crash environment, over time, changes that are not explicitly included as other control variables in the regression models. In its 2011 report NHTSA interprets the trend of reduced risk over time as a reflection of general improvements in vehicle and roadway safety, increase in curb weight of crash partners, and, in particular, improvement in light truck design to reduce their tendency to rollover. Figure 5.6 shows the estimated effect on light truck casualty risk per crash, by type of crash, over time; for the most part, these results are consistent with fatality risk per VMT over time, reported in LBNL 2012. The figure indicates that the estimated effect of the calendar year variables on light truck risk is strong for crashes with lighter-than-average cars and lighter-than-average light-duty trucks. NHTSA believes that this may be the result of the removal over time of very light and unsafe cars and light trucks as potential crash partners for light trucks. However, there also are consistent decreases over time in light truck risk in crashes with heavy-duty trucks, and other (mostly multi-vehicle) crashes, as well as in crashes with heavier cars, although the effect is not as large. NHTSA suspects that the risk associated with light trucks involved in crashes with heavy-duty trucks has decreased over time because heavy-duty truck activity decreases as the economy has faltered; the economic recession in 2008 may have reduced the number of heavy-duty trucks traveling roadways, and thus available as potential crash partners with light-duty vehicles. Note that there is a fairly consistent trend in light truck casualty risk per crash in rollover crashes in Figure 5.6; NHTSA believes that the decline in light truck rollover fatality risk per VMT over time (reported in LBNL 2012) may be the result of manufacturers increasing static stability factor or other aspects of light truck design to reduce their likelihood to rollover. These changes would not be expected to reduce risk of casualty (or fatality) in light trucks once a rollover has occurred, however Figure 5.6 does suggest that a consistent reduction in rollover risk per crash.

57
Figure 5.5. Estimated effect of calendar year variables on 13-state casualty risk per crash, by vehicle type
Figure 5.6. Estimated effect of calendar year variables on light truck risk, by crash type
-20%
-15%
-10%
-5%
0%
5%
10%
15%
20%
CY
2002
CY
2003
CY
2004
CY
2005
CY
2007
CY
2008
CY
2002
CY
2003
CY
2004
CY
2005
CY
2007
CY
2008
CY
2002
CY
2003
CY
2004
CY
2005
CY
2007
CY
2008
Per
cent
cha
nge
in ri
sk (c
asua
ltyy
prob
abili
ty p
er c
rash
)
Effect of control variables on risk, CUVs and minivans
Cars Light Trucks CUVs/Minivans
-40%
-30%
-20%
-10%
0%
10%
20%
30%
40%
CY
2002
C
Y20
03
CY
2004
C
Y20
05
CY
2007
C
Y20
08
CY
2002
C
Y20
03
CY
2004
C
Y20
05
CY
2007
C
Y20
08
CY
2002
C
Y20
03
CY
2004
C
Y20
05
CY
2007
C
Y20
08
CY
2002
C
Y20
03
CY
2004
C
Y20
05
CY
2007
C
Y20
08
CY
2002
C
Y20
03
CY
2004
C
Y20
05
CY
2007
C
Y20
08
CY
2002
C
Y20
03
CY
2004
C
Y20
05
CY
2007
C
Y20
08
CY
2002
C
Y20
03
CY
2004
C
Y20
05
CY
2007
C
Y20
08
CY
2002
C
Y20
03
CY
2004
C
Y20
05
CY
2007
C
Y20
08
CY
2002
C
Y20
03
CY
2004
C
Y20
05
CY
2007
C
Y20
08
Per
cent
cha
nge
in ri
sk (c
asua
lty p
roba
bilit
y pe
r cra
sh)
Effect of control variables on risk, light trucks
Rollover w/obj w/ped w/HDT w/lgt car w/hvy car w/lgt LT w/hvy LT Other

58
Figures 5.7 through 5.10 show the effect of removing the calendar year variables from the regression model of 13-state casualty risk per crash (shown in white). Figure 5.7 indicates that excluding the calendar year variables has little impact on the estimated effect of mass reduction in cars, or for footprint reduction in CUVs/minivans. However, removing the calendar year variables reduces the estimated beneficial effect of mass reduction in trucks and CUVs/minivans; and increases the estimated detrimental effect of footprint reduction in cars but increases the estimated beneficial effect of footprint reduction in light trucks. Figure 5.7. Estimated effect of mass or footprint reduction on 13-state casualty risk per crash by vehicle type, including and excluding calendar year variables
Figures 5.8 through 5.10 show what effect removing the calendar year variables has on the vehicle control variables; there is little to no effect on the driver or crash control variables (not shown). Figures 5.8 through 5.10 indicate that removing the calendar year variables has a large effect on the curtain airbag variable in cars and CUVs/minivans, the SUV, HD pickup, BLOCKER2, and ESC variables in light trucks, and the minivan variable in CUVs/minivans. In addition, the figures indicate that removing the calendar year variables reduces the estimated detrimental effect of vehicle age, and whether a vehicle is brand new, on casualty risk per crash in all three vehicle types. Figures 5.7 through 5.10 suggest that inclusion of the calendar year variables in the regression models dilutes the effect of airbag technologies in cars and CUVs and minivans, the added risk in SUVs and heavy-duty pickups, and the beneficial effect of ESC in light trucks in general, while over-stating the effect of vehicle age in all three vehicle types.
0.09
%
-0.7
7%
-0.1
1%
-0.6
2% -0
.16%
0.23
%
-0.2
5%
0.56
%
0.00
%
-0.9
9%
0.43
%
-0.2
0%
0.28
% 0.
69%
-0.4
9%
0.47
%
-2.0%
-1.0%
0.0%
1.0%
2.0%
Cars < 3106 Cars > 3106 LTs < 4594 LTs > 4594 CUVs/ minivans
Cars LTs CUVs/ minivans P
erce
nt c
hang
e in
risk
(cas
ualty
pro
babi
lity
per c
rash
)
Effect of increase in weight or size on risk, by vehicle type
13-state casualties per crash
Excluding CY variables
100-lb reduction in weight 1-sq ft reduction in footprint

59
Figure 5.8. Estimated effect of selected control variables on car risk, including and excluding calendar year variables
Figure 5.9. Estimated effect of selected control variables on light truck risk, including and excluding calendar year variables
-25%
-20%
-15%
-10%
-5%
0%
5%
10%
15%
20%
25%
TWO
DO
OR
RO
LLC
UR
T
CU
RTA
IN
CO
MB
O
TOR
SO
AB
S
ES
C
VE
HA
GE
BR
AN
DN
EW
Per
cent
cha
nge
in ri
sk (c
asua
lty p
roba
bilit
y pe
r cra
sh)
Effect of control variables on risk, passenger cars
13-state casualties per crash Excluding CY variables
-25%
-20%
-15%
-10%
-5%
0%
5%
10%
15%
20%
25%
SU
V
HD
_PK
P
BLO
CK
ER
1
BLO
CK
ER
2
ES
C
AWD
VE
HA
GE
BR
AN
DN
EW
Per
cent
cha
nge
in ri
sk (c
asua
lty p
roba
bilit
y pe
r cra
sh)
Effect of control variables on risk, light trucks
13-state casualties per crash
Excluding CY variables

60
Figure 5.10. Estimated effect of selected control variables on CUV/minivan risk, including and excluding calendar year variables
5.5. Effect of household income Unlike in FARS, details on the driver’s condition or behavior are not consistently reported in the state crash data; therefore, we cannot account for the behavior of individual drivers in our estimates of the effect of mass or footprint reduction on casualty risk per crash. One possible surrogate for the behavior of drivers who tend to select certain vehicle models is driver household income. There is a fairly strong correlation between household income and predicted fatality risk, with risk decreasing as income increases. And crash frequency decreases as household income increases, particularly for cars and CUVs/minivans, as discussed in Section 4. Every $1,000 increase in household income is estimated to reduce 13-state casualty risk per crash in all three types of vehicles: by 1.51% +/- 0.15% in cars, 0.99% +/- 0.21% in light trucks, and 1.34% +/- 0.31% in CUVs/minivans. Figure 5.11 shows the effect of including household income on the relationship between lower mass or footprint and casualty risk per crash (shown in light violet). Accounting for household income substantially increases the estimated beneficial effect of mass reduction in heavier-than-average cars and CUVs/minivans, but has little effect on other types of vehicles. Adding household income to the regression models substantially increases the estimated detrimental effect of footprint reduction in cars and CUVs/minivans, but has little effect on the estimated effect of footprint reduction in light trucks.
-25%
-20%
-15%
-10%
-5%
0%
5%
10%
15%
20%
25%
MIN
IVA
N
RO
LLC
UR
T
CU
RTA
IN
CO
MB
O
TOR
SO
AB
S
ES
C
AWD
VE
HA
GE
BR
AN
DN
EW
Per
cent
cha
nge
in ri
sk (c
asua
lty p
roba
bilit
y pe
r cra
sh)
Effect of control variables on risk, CUVs and minivans
13-state casualties per crash
Excluding CY variables

61
Figure 5.11. Estimated effect of mass or footprint reduction on 13-state casualties per crash, after controlling for median household income, by vehicle type
5.6. Effect of including sports, police, and all-wheel drive cars, and fullsize vans In its analysis of US fatality risk per VMT, NHTSA excluded three types of cars (models used as sports cars, police cars, and models with all-wheel drive), all Ford Crown Victorias, and fullsize passenger and cargo vans. Including these vehicles in the analysis, and adding control variables for the four additional vehicle types, has essentially no effect on the relationship between lower mass and 13-state casualty risk per crash in either cars or light trucks, as shown in Figure 5.12.
0.09
%
-0.7
7%
-0.1
1%
-0.6
2% -0
.16%
0.23
%
-0.2
5%
0.56
%
-0.0
4%
-1.1
2%
-0.0
5%
-0.6
8%
-0.6
5%
0.69
%
-0.2
6%
1.01
%
-2.0%
-1.0%
0.0%
1.0%
2.0%
Cars < 3106 Cars > 3106 LTs < 4594 LTs > 4594 CUVs/ minivans
Cars LTs CUVs/ minivans P
erce
nt c
hang
e in
risk
(fat
ality
pro
babi
lity
per 1
010
VM
T)
Effect of increase in weight or size on risk, by vehicle type
13-state casualties per crash
Including household income
100-lb reduction in weight 1-sq ft reduction in footprint

62
Figure 5.12. Estimated effect of mass and footprint reduction on 13-state casualty risk per crash by vehicle type, after including sports, police, and all-wheel drive cars, and fullsize passenger and cargo vans
5.7. Effect of adding additional data As mentioned above, we excluded certain data that NHTSA did not include in their regression analyses:
• vehicles from 2000 to 2008 for three states (Georgia, Illinois, and New Mexico) that NHTSA did not include in its analysis because those states did not report the posted speed limit at the crash site (Georgia data are available only through 2007). NHTSA included IL in its 2003 and 2010 analyses, using the fraction of FARS crashes occurring on roads with a posted limit 55 mph or over, by roadway classification; we used this same method to assign posted speed limits to these three states in this analysis;
• vehicles whose model year was not reported in the state crash data (except all crash records from Washington, which were included in the above analysis);
• vehicles involved in police-reported crashes in 2000 and 2001, from all states but Michigan, New Jersey, and Washington);
• vehicles that had apparent VIN transcription errors that we corrected so that the model year reported in the state crash data matched the VIN model year. The method to make these corrections for VIN errors is described in LBNL 2011a.
We analyzed the effect of adding all of these data on the regression coefficients for vehicle mass and footprint; we added five new control variables for the additional calendar years 2000 and 2001, and for the three additional states, GA, IL, and NM. Figure 5.13 shows that including all of the additional data increases the number of vehicle records by nearly 40%.
0.09
%
-0.7
7%
-0.1
1%
-0.6
2% -0
.16%
0.23
%
-0.2
5%
0.56
%
0.10
%
-0.7
6%
-0.0
9%
-0.6
4%
-0.1
6%
0.25
%
-0.2
7%
0.56
%
-2.0%
-1.0%
0.0%
1.0%
2.0%
Cars < 3106 Cars > 3106 LTs < 4594 LTs > 4594 CUVs/ minivans
Cars LTs CUVs/ minivans
Per
cent
cha
nge
in ri
sk (c
asua
lty p
roba
bilit
y pe
r cra
sh)
Effect of increase in weight or size on risk, by vehicle type
13-state casualties per crash
Including all cars and fullsize vans
100-lb reduction in weight 1-sq ft reduction in footprint

63
Figure 5.13. Number of vehicles involved in casualty crashes by vehicle type, using additional state crash data
Figure 5.14 indicates that adding the data results in little change in the estimated effect of mass or footprint reduction on casualty risk per crash, for all vehicle types. Note in Figure 5.14 that the last column (in light orange), which represents the effect from increasing the sample size by about 40%, reduces the uncertainty of the estimates of the effect of mass or footprint on risk by only a small amount. This suggests that the uncertainty is a function of the variability in the effect of mass or footprint reduction on risk by vehicle, and not a function of relatively small sample sizes.
0
20,000
40,000
60,000
80,000
100,000
120,000
140,000
160,000
180,000
200,000
Cars Light trucks CUVs/minivans
Num
ber o
f veh
icle
s in
volv
ed in
cas
ualty
cra
shes
Effect of increase in weight or size on risk, by vehicle type
13-states 16-states plus missing MY, corrected VINs, and CY00, CY01

64
Figure 5.14. Estimated effect of mass or footprint reduction on casualty risk per crash by vehicle type, using additional state crash data
5.8. Effect of changes suggested by NHTSA peer reviewers In its review of the preliminary NHTSA 2011 study, DRI suggested that NHTSA account for the two components of vehicle footprint, wheelbase and track width, separately in the regression models; in previous analyses DRI found that these two changes to the regression models tended to reduce the estimated detrimental effect of mass reduction on risk (Van Auken and Zellner, 2005b). Figure 5.15 shows that replacing vehicle footprint with track width and wheelbase increases the estimated beneficial effect of mass reduction on casualties per crash (shown in olive); in addition, a one-inch reduction in track width is associated with a large increase in casualty risk per crash, particularly for cars and CUVs/minivans, while a one-inch reduction in wheelbase is associated with a small reduction in risk for all three types of vehicles. Other reviewers suggested that NHTSA conduct two additional sensitivities: reweighting the casualties of CUVs and minivans by their market shares in 2010 (Paul Green); and removing the non-significant control variables from the 27 regression models for the three vehicle types and nine crash types (Charles Farmer). Figure 5.16 shows the sensitivity of our estimates to these changes. Weighting the distribution of casualties in CUVs and minivans by their respective shares of sales in 2010 (which reflects more CUVs and fewer minivans) has very little effect on the relationship between lower mass or footprint and casualty risk per crash in CUVs and minivans (shown in orange). Removing non-significant control variables from each of the regression models results in slightly more detrimental effects of reduced mass estimated for cars and CUVs/minivans, and slightly more beneficial effects estimated for light trucks.
0.09
%
-0.7
7%
-0.1
1%
-0.6
2% -0
.16%
0.23
%
-0.2
5%
0.56
%
0.19
%
-0.5
4%
-0.0
2%
-0.6
4%
-0.3
4%
0.02
%
-0.3
0%
0.44
%
-2.0%
-1.0%
0.0%
1.0%
2.0%
Cars < 3106 Cars > 3106 LTs < 4594 LTs > 4594 CUVs/ minivans
Cars LTs CUVs/ minivans
Per
cent
cha
nge
in ri
sk (c
asua
lty p
roba
bilit
y pe
r cra
sh)
Effect of increase in weight or size on risk, by vehicle type
13-states 16-states plus missing MY, corrected VINs, and CY00, CY01
100-lb reduction in weight 1-sq ft reduction in footprint
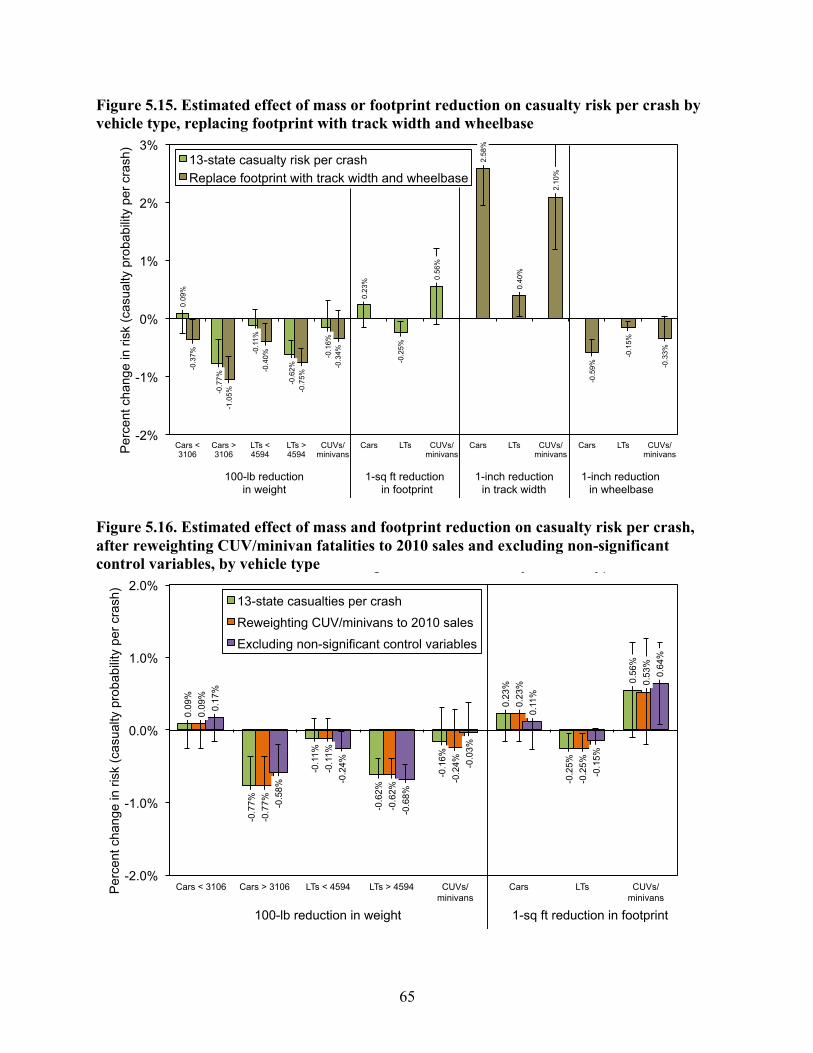
65
Figure 5.15. Estimated effect of mass or footprint reduction on casualty risk per crash by vehicle type, replacing footprint with track width and wheelbase
Figure 5.16. Estimated effect of mass and footprint reduction on casualty risk per crash, after reweighting CUV/minivan fatalities to 2010 sales and excluding non-significant control variables, by vehicle type
0.09
%
-0.7
7%
-0.1
1%
-0.6
2% -0
.16%
0.23
%
-0.2
5%
0.56
%
-0.3
7%
-1.0
5%
-0.4
0%
-0.7
5% -0
.34%
2.58
%
0.40
%
2.10
%
-0.5
9% -0
.15%
-0.3
3%
-2%
-1%
0%
1%
2%
3%
Cars < 3106
Cars > 3106
LTs < 4594
LTs > 4594
CUVs/ minivans
Cars LTs CUVs/ minivans
Cars LTs CUVs/ minivans
Cars LTs CUVs/ minivans P
erce
nt c
hang
e in
risk
(cas
ualty
pro
babi
lity
per c
rash
)
13-state casualty risk per crash Replace footprint with track width and wheelbase
100-lb reduction 1-sq ft reduction 1-inch reduction 1-inch reduction in weight in footprint in track width in wheelbase
0.09
%
-0.7
7%
-0.1
1%
-0.6
2% -0
.16%
0.23
%
-0.2
5%
0.56
%
0.09
%
-0.7
7%
-0.1
1%
-0.6
2% -0
.24%
0.23
%
-0.2
5%
0.53
%
0.17
%
-0.5
8% -0.2
4%
-0.6
8%
-0.0
3%
0.11
%
-0.1
5%
0.64
%
-2.0%
-1.0%
0.0%
1.0%
2.0%
Cars < 3106 Cars > 3106 LTs < 4594 LTs > 4594 CUVs/ minivans
Cars LTs CUVs/ minivans
Per
cent
cha
nge
in ri
sk (c
asua
lty p
roba
bilit
y pe
r cra
sh)
Effect of reduction in weight or size on risk, by vehicle type
13-state casualties per crash
Reweighting CUV/minivans to 2010 sales
Excluding non-significant control variables
100-lb reduction in weight 1-sq ft reduction in footprint
66
6. Conclusions NHTSA recently completed a logistic regression analysis (Kahane 2012) updating its 2003 and 2010 studies of the relationship between vehicle mass and US fatality risk per vehicle mile traveled (VMT). The new study updates the previous analyses in several ways: updated FARS data for 2002 to 2008 involving MY00 to MY07 vehicles are used; induced exposure data from police reported crashes in several additional states are added; a new vehicle category for car-based crossover utility vehicles (CUVs) and minivans is created; crashes with other light-duty vehicles are divided into two groups based on the crash partner vehicle’s weight, and a category for all other fatal crashes is added; and new control variables for new safety technologies and designs, such as electronic stability controls (ESC), side airbags, and methods to meet voluntary agreement to improve light truck compatibility with cars, are included. In a companion report (Wenzel 2012b), we use the updated databases NHTSA has created to replicate their findings on the relationship between vehicle weight, size (actually footprint, or vehicle wheelbase times track width), and US fatality risk per vehicle miles traveled (VMT), for model year 2000 to 2007 light-duty vehicles involved in fatal crashes between 2002 and 2008. The data are examined in slightly different ways, to get a deeper understanding of the relationship between reductions in vehicle mass and footprint, and overall safety. This report compares the logistic regression results of the NHTSA analysis of US fatality risk per VMT with an analysis of 13-state fatality risk and casualty risk per crash. This final report incorporates revisions from the preliminary report released in November 2011, including revised estimates of national weights for vehicle miles traveled, inclusion of 2008 police-reported crash data from eight additional states, and responses to reviewers’ comments. Our analysis differs from the NHTSA analysis in two respects: first, it analyzes risk per crash, using data on all police-reported crashes from thirteen states, rather than risk per estimated VMT; and second, it analyzes casualty (fatality plus serious injury) risk, as opposed to just fatality risk. There are several good reasons to investigate the effect of mass and footprint reduction on casualty risk per crash. First, risk per VMT, includes two effects that influence whether a person is killed or seriously injured in a crash: how well a vehicle can be, or actually is, driven (based on its handling, acceleration, and braking capabilities) to avoid being involved in a serious crash (crash avoidance), and, once a serious crash has occurred, how well a vehicle protects its occupants from fatality or serious injury (crashworthiness) as well as the occupants of any crash partner (compatibility). By encompassing both of these aspects of vehicle design, risk per VMT gives a complete picture of how vehicle design can promote, or reduce, road user safety. On the other hand, risk per crash isolates the second of these two safety effects, crashworthiness/compatibility, by examining the effect of mass and footprint reduction on how well a vehicle protects its occupants once a crash occurs. Second, estimating risk on a per crash basis only requires using data on police-reported crashes from states, and does not require combining them with data from other sources, such as vehicle registration data and VMT information, as in NHTSA 2012. Because only sixteen states currently record the vehicle identification number of vehicles involved in police-reported crashes, which is necessary to determine vehicle characteristics, and only thirteen states also

67
report the posted speed limit of the roadway on which the crash occurred, extending the analysis to casualties (fatalities plus serious/incapacitating injuries; i.e. level “K” and “A” injuries in police reports) reduces the statistical uncertainty of analyzing just fatalities per crash. Finally, a serious incapacitating injury can be just as traumatic to the victim and her family, and costly from an economic perspective, as a fatality. Limiting the analysis to the risk of fatality, which is an extremely rare event, ignores the effect vehicle design may have on reducing the large number of incapacitating injuries that occur each year on the nation’s roadways. All risks in this report are societal risk, including fatalities and serious injuries in the case vehicle and any crash partners, and include not only driver casualties but passenger and non-occupant casualties as well. However, the frequency of police-reported crashes per VMT and of casualties per police-reported crash can both be influenced, in opposite directions, by the probability that a collision event becomes a police-reported crash. If collisions of certain vehicles are slightly less likely to be reported, because these vehicles are either somewhat less damage-prone or are uninsured, this would tend to increase the observed detrimental effect of mass reduction on reported crashes per VMT and conversely decrease its detrimental effect on casualties per reported crash. By contrast, fatalities or casualties per VMT would be not be affected by crash-reporting rates, because the crash-reporting rate is not part of the formula for calculating risk. The extent to which any reporting bias of non-injury crashes exists, the observed effects for police-reported crashes per VMT might not correspond exactly to the “effect of mass reduction on crash avoidance” and the observed effects for casualties per police-reported crash might not correspond exactly to the “effect of mass reduction on crashworthiness/compatibility.” We suspect that large pickups are less likely to suffer damage in non-injury crashes than other vehicle types; and that older, less expensive, or uninsured vehicles are less likely to report crash damage to police. In addition, one vehicle crashes are more likely to suffer from this reporting bias, as there is no crash partner who may file an insurance claim. Table 6.1 summarizes the results of our analysis of the effect of vehicle mass or footprint reduction on the two components of risk per VMT, crash frequency (number of crashes per VMT) and crashworthiness/compatibility (risk per crash), for both fatality and casualty risk, using data from 13 states. We convert the percent change in the log-odds of casualty or fatality per crash output from the SAS LOGIST procedure to the percent change in the probability of casualty or fatality per crash. This conversion has no effect on the output regression coefficients when the change in the log-odds of casualty is small, but substantially increases the percent change for explanatory variables that have a large effect on the log-odds of casualty. Effects that are statistically significant are shown in red in the table; significance is based on the 95% confidence interval derived from the standard error of the output of the SAS LOGIST procedure, converted to a percent probability interval. Table 6.1 indicates that for cars and light trucks, the effects from the two components, crash frequency and crashworthiness/compatibility, roughly add together to result in the overall effect on fatality risk per VMT. For example, the models estimate that 100-lb lower mass in lighter-than-average cars is associated with a 2.00% increase in crash frequency (column B), while lower mass is associated with a 0.54% decrease in the number of fatalities per crash (column C); the net effect is only a 1.42% increase in the risk of fatality per VMT (column D), which is
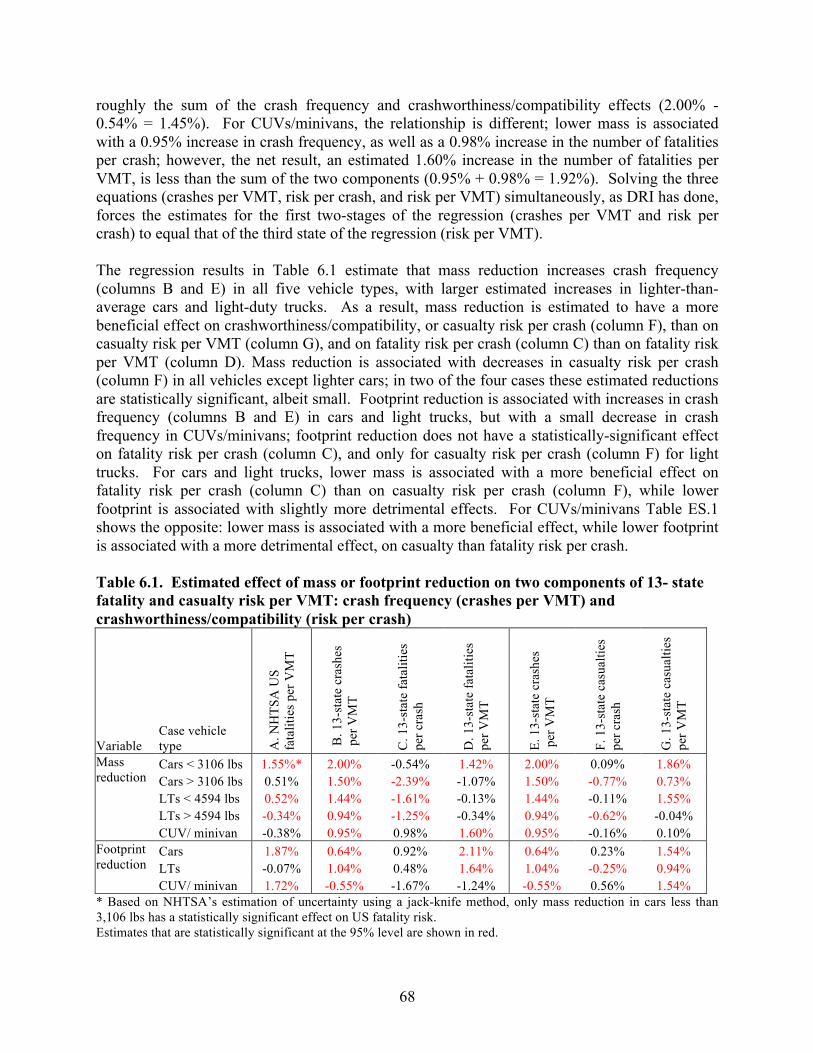
68
roughly the sum of the crash frequency and crashworthiness/compatibility effects (2.00% - 0.54% = 1.45%). For CUVs/minivans, the relationship is different; lower mass is associated with a 0.95% increase in crash frequency, as well as a 0.98% increase in the number of fatalities per crash; however, the net result, an estimated 1.60% increase in the number of fatalities per VMT, is less than the sum of the two components (0.95% + 0.98% = 1.92%). Solving the three equations (crashes per VMT, risk per crash, and risk per VMT) simultaneously, as DRI has done, forces the estimates for the first two-stages of the regression (crashes per VMT and risk per crash) to equal that of the third state of the regression (risk per VMT). The regression results in Table 6.1 estimate that mass reduction increases crash frequency (columns B and E) in all five vehicle types, with larger estimated increases in lighter-than-average cars and light-duty trucks. As a result, mass reduction is estimated to have a more beneficial effect on crashworthiness/compatibility, or casualty risk per crash (column F), than on casualty risk per VMT (column G), and on fatality risk per crash (column C) than on fatality risk per VMT (column D). Mass reduction is associated with decreases in casualty risk per crash (column F) in all vehicles except lighter cars; in two of the four cases these estimated reductions are statistically significant, albeit small. Footprint reduction is associated with increases in crash frequency (columns B and E) in cars and light trucks, but with a small decrease in crash frequency in CUVs/minivans; footprint reduction does not have a statistically-significant effect on fatality risk per crash (column C), and only for casualty risk per crash (column F) for light trucks. For cars and light trucks, lower mass is associated with a more beneficial effect on fatality risk per crash (column C) than on casualty risk per crash (column F), while lower footprint is associated with slightly more detrimental effects. For CUVs/minivans Table ES.1 shows the opposite: lower mass is associated with a more beneficial effect, while lower footprint is associated with a more detrimental effect, on casualty than fatality risk per crash. Table 6.1. Estimated effect of mass or footprint reduction on two components of 13- state fatality and casualty risk per VMT: crash frequency (crashes per VMT) and crashworthiness/compatibility (risk per crash)
Variable Case vehicle type A
. NH
TSA
US
fata
litie
s per
VM
T
B. 1
3-st
ate
cras
hes
per V
MT
C. 1
3-st
ate
fata
litie
s pe
r cra
sh
D. 1
3-st
ate
fata
litie
s pe
r VM
T
E. 1
3-st
ate
cras
hes
per
VM
T
F. 1
3-st
ate
casu
altie
s pe
r cra
sh
G. 1
3-st
ate
casu
altie
s pe
r VM
T
Mass reduction
Cars < 3106 lbs 1.55%* 2.00% -0.54% 1.42% 2.00% 0.09% 1.86% Cars > 3106 lbs 0.51% 1.50% -2.39% -1.07% 1.50% -0.77% 0.73% LTs < 4594 lbs 0.52% 1.44% -1.61% -0.13% 1.44% -0.11% 1.55% LTs > 4594 lbs -0.34% 0.94% -1.25% -0.34% 0.94% -0.62% -0.04% CUV/ minivan -0.38% 0.95% 0.98% 1.60% 0.95% -0.16% 0.10%
Footprint reduction
Cars 1.87% 0.64% 0.92% 2.11% 0.64% 0.23% 1.54% LTs -0.07% 1.04% 0.48% 1.64% 1.04% -0.25% 0.94% CUV/ minivan 1.72% -0.55% -1.67% -1.24% -0.55% 0.56% 1.54%
* Based on NHTSA’s estimation of uncertainty using a jack-knife method, only mass reduction in cars less than 3,106 lbs has a statistically significant effect on US fatality risk. Estimates that are statistically significant at the 95% level are shown in red.

69
It is unclear why lower vehicle mass is associated with higher crash frequency, but lower risk per crash, in the regression models. It is possible that including variables that more accurately account for important differences among vehicles and driver behavior would reverse this relationship. For example, adding vehicle purchase price substantially reduces the estimated increase in crash frequency as vehicle mass decreases, for all vehicle types; in the case of heavier-than-average cars, mass reduction is estimated to slightly decrease crash frequency. On the other hand, it is also possible that over thirty years of improvements in vehicle design to achieve high crash test ratings have enabled manufacturers to design vehicles to mitigate some of the safety penalty of low mass vehicles. The association of mass reduction with 13-state casualty risk per VMT (column G) is quite consistent with that NHTSA estimated for US fatality risk per VMT (column A), although we estimate the effects on casualty risk to be more detrimental than the effects on fatality risk, for all vehicle types. The association of footprint reduction also is similar, with 13-state casualty risk per VMT slightly more beneficial than US fatality risk per VMT for cars and CUVs/minivans, while 13-state casualty risk is substantially more detrimental than US casualty risk for light-duty trucks. In contrast with NHTSA’s estimates on US fatality risk per VMT (column A), mass reduction is estimated to reduce casualty risk per crash (column F) for four of the five vehicle types, with two of these four reductions estimated to be statistically significant. Mass reduction is associated with a small but insignificant increase in casualty risk per crash for lighter cars. And footprint reduction is associated with much smaller, and not statistically significant, estimated increases in casualty risk per crash (column F) than in US fatality risk per VMT (column A). Many of the control variables included in the logistic regressions are statistically significant, and have a large effect on fatality or casualty risk per crash, in some cases one to two orders of magnitude larger. However, the estimated association of these variables with risks per crash are not as large as their estimated association with fatality risk per VMT. While the estimated effect of mass reduction may result in a statistically-significant increase in risk in certain cases, the increase is small and is overwhelmed by other known vehicle, driver, and crash factors. ABS and ESC in cars are estimated to reduce crash frequency more than risk per crash, as expected, while AWD in light trucks and CUVs/minivans is estimated to increase crash frequency more than risk per crash. Two-door cars and the side airbag variables in cars have a larger effect on risk given a crash than on crash frequency; two-door cars increase risks per crash, while side airbags decrease risks per crash. The driver age variables estimate that crash frequency consistently increases for the youngest and oldest drivers, and that risk per crash consistently increases for the two oldest groups of drivers (over 50 years old). All of these results are expected. On the other hand, there are several unexpected results: side airbags in light trucks and CUVs/minivans are estimated to reduce crash frequency; ESC and ABS are estimated to reduce risk once a crash has occurred; and AWD and brand new vehicles are estimated to increase risk once a crash has occurred. In addition, male drivers are estimated to have essentially no effect on crash frequency, but are associated with a statistically significant increase in fatality risk once a

70
crash occurs. And driving at night, on high-speed or rural roads, are associated with higher increases in risk per crash than on crash frequency. These unexpected results suggest that important control variables are not being included in the regression models. For example, crashes involving male drivers, in vehicles equipped with AWD, or that occur at night on rural or high-speed roads, may not be more frequent but rather more severe than other crashes, and thus lead to greater fatality or casualty risk. And drivers who select vehicles with certain safety features may tend to drive more carefully, resulting in vehicle safety features designed to improve crashworthiness or compatibility, such as side airbags, being also associated with lower crash frequency. In contrast with NHTSA’s results for US fatalities per VMT, allowing footprint to vary along with weight results in little change in the estimated effect of mass reduction on casualty risk per crash than when footprint is held constant; however, the estimated detrimental effect of mass reduction on casualty risk per crash in lighter cars is increased just enough to make it statistically significant. When mass is allowed to vary along with footprint, footprint reduction is estimated to be slightly more beneficial for cars and light trucks (Alternative 3 in Table 6.2; further addressed in Section 3 of this report). As with NHTSA’s analysis of fatality risk per VMT, mass reduction is not consistently associated with increased casualty risk per crash across all footprint deciles for any combination of vehicle type and crash type. Lower mass is associated with increased casualty risk per crash in a majority of footprint deciles for 9 of the 27 crash and vehicle combinations, but few of these increases are statistically significant. On the other hand, lower mass is associated with decreased risk in a majority of footprint deciles for 12 of the 27 crash and vehicle combinations. Similar to our findings on US fatality risk per VMT, after accounting for all of the control variables in the logistic regression model, except for vehicle mass and footprint, we find that the correlation between mass and the casualty risk per crash by vehicle model is very low. There also is no significant correlation between the residual, unexplained risk and vehicle weight. These results corroborate our earlier finding that, even after accounting for many vehicle, driver, and crash factors, the variation in risk by vehicle model is quite large and unrelated to vehicle weight (addressed in more detail in Section 4). The large remaining unexplained variation in risk by vehicle model could be attributable to other differences in vehicle design, or how drivers who select certain vehicles drive them. It is possible that including variables that account for these factors in the regression models would change the estimated relationship between mass or footprint and risk. Other changes in the data and variables used in the regression models result in changes in the estimated effect of mass or footprint reductions on casualty risk per crash, as summarized in Tables 6.2 and 6.3. For example:
• Regression analyses using police-reported crash data from states must use control variables
to account for differences in definitions of “serious” or “incapacitating” injuries, and reporting requirements, across states. Removing the 12 state control variables results in a large reduction in estimated casualty risk per crash from mass reduction in all five vehicle types, a large increase in estimated risk from footprint reduction in cars and CUVs/minivans, and a small reduction in estimated risk from footprint reduction in light

71
trucks (Alternative 4 in Table 6.2). Including only two variables to control for states with high and low casualty risk per crash substantially reduces the estimated effect of mass and footprint reduction on casualty risk (Alternative 5 in Table 6.2), while including the 12 control variables for individual states reduces the estimated effect a little bit more. These results indicate that excluding control variables for the state in which a crash occurred from a regression model using state police-reported crash data can give inaccurate estimates of the effect of mass or footprint reduction on casualty risk per crash (addressed in Section 5.1).
• Calculating risk as casualty crashes, rather than total casualties, per crash results in little
change in the association between mass or footprint and risk, but does increase the small estimated detrimental effect of footprint reduction in cars on risk, and makes it statistically significant (Alternative 6 in Table 6.2; addressed in Section 5.2).
• Adding control variables for vehicle manufacturer estimates that lower mass is associated
with higher casualty risk per crash for cars, with little effect on the estimates for light trucks and CUVs/minivans. Accounting for vehicle manufacturer turns the small estimated increase in casualty risk per crash from footprint reduction in cars to a small decrease in risk, and slightly increases the estimated casualty risk per crash in light trucks and CUVs/minivans (Alternative 7 in Table 6.3). Also including control variables for five luxury vehicle makes has little effect on the estimated relationships between mass or footprint and casualty risk per crash (Alternative 8 in Table 6.3; addressed in Section 5.3).
Table 6.2. Estimated effect of mass or footprint reduction on 13-state casualty risk per crash, under alternative regression model specifications
Variable Case vehicle type LB
NL
13-s
tate
ca
sual
ties p
er p
olic
e-re
porte
d cr
ash
1. S
ingl
e re
gres
sion
m
odel
for a
ll cr
ash
type
s
2. W
eigh
ted
by
curr
ent d
istri
butio
n
of fa
talit
ies
3. E
xclu
ding
fo
otpr
int
or w
eigh
t
4. E
xclu
ding
stat
e co
ntro
l var
iabl
es
5. In
clud
ing
only
tw
o st
ate
cont
rol
varia
bles
6. C
asua
lty c
rash
es
per c
rash
Mass reduction
Cars < 3106 lbs 0.09% 0.07% 0.08% 0.25% -0.64% -0.13% 0.30% Cars > 3106 lbs -0.77% -0.87% -0.86% -0.61% -1.68% -1.19% -0.63% LTs < 4594 lbs -0.11% -0.11% -0.09% -0.38% -0.21% -0.15% -0.04% LTs > 4594 lbs -0.62% -0.74% -0.67% -0.78% -1.84% -0.75% -0.61% CUV/ minivan -0.16% -0.31% -0.26% 0.13% -2.09% -0.47% -0.21%
Footprint reduction
Cars 0.23% 0.50% 0.41% -0.10% 1.52% 0.45% 0.34% LTs -0.25% 0.05% -0.13% -0.49% -1.05% -0.30% -0.05% CUV/ minivan 0.56% 0.68% 0.75% 0.56% 3.79% 0.69% 0.80%
Estimates that are statistically significant at the 95% level are shown in red.
• An alternative to control variables for vehicle manufacturers is a single continuous variable for the vehicle’s initial purchase price; purchase price may better account for other differences in vehicle design that may influence traffic safety. Adding this single variable turns the estimated small increase in casualty risk per crash from mass reduction into an estimated small decrease in risk for lighter-than-average cars, and increases the estimated beneficial effect from mass reduction for other vehicles, particularly heavier-than-average

72
cars and CUVs/minivans; the price variable makes the estimated effect of footprint reduction slightly more detrimental in cars, more beneficial in light-duty trucks, and less detrimental in CUVs/minivans (Alternative 9 in Table 6.3; also addressed in Section 5.3).
• As we found in our assessment of NHTSA’s analysis of US fatality risk per VMT,
including calendar year variables in the regression models appears to weaken the benefit of side air bags in cars and CUVs/minivans, and compatibility measures and ESC in light trucks. These variables also appear to minimize the increased risk of SUVs and heavy-duty pickup trucks. Excluding the calendar year variables from the regression models slightly reduces the beneficial effect of mass reduction on casualty risk per crash in light trucks and CUVs/minivans, and slightly increases the detrimental effect of footprint reduction on casualty risk per crash in cars (Alternative 10 in Table 6.3; addressed in Section 5.4).
• Because details on the driver’s condition or behavior are not consistently reported in the
state crash data, we cannot account for the behavior of individual drivers in our estimates. One possible surrogate for the behavior of drivers who tend to select certain vehicle models is driver household income. Including a measure of household income by vehicle model makes the estimated effect of mass reduction on casualty risk per crash more beneficial, and the estimated effect of footprint reduction more detrimental, for cars and CUVs/minivans, but has little effect on the estimates for light trucks (Alternative 11 in Table 6.3).
• Including all-wheel-drive, sports, and police cars, and fullsize vans results in virtually no
change in the estimated effect of mass or footprint reduction on casualty risk per crash for cars or light trucks (Alternative 12 in Table 6.3; addressed in Section 5.5).
Table 6.3. Estimated effect of mass or footprint reduction on 13-state casualty risk per crash, excluding certain data or using different control variables
Variable Case vehicle type LB
NL
13-s
tate
ca
sual
ties p
er p
olic
e-re
porte
d cr
ash
7. A
ccou
ntin
g fo
r ve
hicl
e m
anuf
actu
rer
8.A
ccou
ntin
g fo
r ve
hicl
e m
anuf
actu
rer
plus
five
luxu
ry
bran
ds
9. A
ccou
ntin
g fo
r in
itial
veh
icle
pu
rcha
se p
rice
10. E
xclu
ding
CY
va
riabl
es
11. A
ccou
ntin
g fo
r m
edia
n ho
useh
old
inco
me
12. I
nclu
ding
spor
ts,
squa
d, A
WD
car
s and
fu
llsiz
e va
ns
13. I
nclu
ding
all
addi
tiona
l dat
a
Mass reduction
Cars < 3106 lbs 0.09% 0.85% 0.96% -0.35% 0.00% -0.04% 0.10% 0.19% Cars > 3106 lbs -0.77% 0.78% 0.76% -1.72% -0.99% -1.12% -0.76% -0.54% LTs < 4594 lbs -0.11% -0.24% -0.24% -0.14% 0.43% -0.05% -0.09% -0.02% LTs > 4594 lbs -0.62% -0.65% -0.60% -0.71% -0.20% -0.68% -0.64% -0.64% CUV/ minivan -0.16% -0.05% -0.40% -0.64% 0.28% -0.65% -0.16% -0.34%
Footprint reduction
Cars 0.23% -0.52% -0.60% 0.29% 0.69% 0.69% 0.25% 0.02% LTs -0.25% -0.09% -0.11% -0.40% -0.49% -0.26% -0.27% -0.30% CUV/ minivan 0.56% 0.88% 1.16% 0.41% 0.47% 1.01% 0.56% 0.44%
Estimates that are statistically significant at the 95% level are shown in red.
• Adding data from three additional states, including vehicles with unreported model year, correcting VIN transcription errors, and expanding the analysis to calendar years 2000,

73
2001, and 2008, increases the number of state crash records by about 40 percent. Including these data in the regression analyses makes the estimated effect of mass reduction in cars and lighter light trucks more detrimental, and in CUVs/minivans more beneficial. Including these data slightly reduces the estimated detrimental effect of footprint reduction on casualty risk per crash in cars and CUVs/minivans. However, increasing the sample size included in the regression analysis by 40% does not noticeably reduce the confidence intervals around the point estimates (Alternative 13 in Table 6.3; addressed in Section 5.6).
Table 6.4 shows the results of additional sensitivity tests NHTSA conducted in response to comments from peer reviewers of its preliminary 2011 report. Replacing vehicle footprint with its two components, track width and wheelbase, increases the estimated beneficial effect of mass reduction on casualty risk per crash, making it statistically significant for four of the five vehicle types, as shown in Alternative 14. Decreasing track width is associated with a significant increase in casualty risk per crash, while decreasing wheelbase is associated with a small decrease in risk. Weighting the distribution of fatalities in CUVs and minivans by their respective shares of sales in 2010 (which reflects more CUVs and fewer minivans) has little effect on the estimated effects (Alternative 15). Alternative 16 removes non-significant control variables from each of the regression models, which results in only small changes in the estimated effects. Table 6.4. Estimated effect of mass or footprint reduction on 13-state casualty risk per crash, alternative regression model specifications suggested by NHTSA peer reviewers
Variable Case vehicle type LB
NL
13-s
tate
cas
ualti
es
per p
olic
e-re
porte
d cr
ash
14. I
nclu
ding
trac
k
wid
th a
nd w
heel
base
in
stea
d of
foot
prin
t
15. R
ewei
ghtin
g C
UV
s an
d m
iniv
ans b
y 20
10
sale
s
16. E
xclu
ding
non
-si
gnifi
cant
con
trol
varia
bles
Mass reduction
Cars < 3106 lbs 0.09% -0.37% 0.09% 0.17% Cars > 3106 lbs -0.77% -1.05% -0.77% -0.58% LTs < 4594 lbs -0.11% -0.40% -0.11% -0.24% LTs > 4594 lbs -0.62% -0.75% -0.62% -0.68% CUV/ minivan -0.16% -0.34% -0.24% -0.03%
Footprint reduction
Cars 0.23% — 0.23% 0.11% LTs -0.25% — -0.25% -0.15% CUV/ minivan 0.56% — 0.53% 0.64%
Track width reduction
Cars — 2.58% — — LTs — 0.40% — — CUV/ minivan — 2.10% — —
Wheel base reduction
Cars — -0.59% — — LTs — -0.15% — — CUV/ minivan — -0.33% — —
Estimates that are statistically significant at the 95% level are shown in red. In conclusion, casualty risk per crash is not necessarily a better metric than fatality risk per VMT for evaluating the effect of mass or footprint reduction on risk; rather, it provides a different

74
perspective in assessing the benefits or drawbacks of mass and footprint reduction on safety in vehicles. However, it does allow the risk per VMT to be separated into its two components, crash frequency and risk per crash. Our analysis indicates that much of the estimated detrimental effect of mass or footprint reduction on risk can be attributed to the tendency for crash frequency, rather than crashworthiness/compatibility (risk once a crash has occurred), to increase as vehicle mass or footprint decreases. As with our analysis of US fatalities per VMT, this report concludes that the estimated effect of mass reduction on casualty risk per crash is small, and is overwhelmed by other control variables, such as vehicle type, specific safety technologies, and crash conditions such as whether the crash occurred at night, in a rural county, or on a high-speed road. This report indicates that the effects are sensitive to what variables and data are included in the regression analysis. Finally, as in our analysis of US fatality risk per VMT, this report shows that after accounting for many vehicle, driver, and crash variables there remains a wide variation in casualty risk per crash by vehicle make and model, and this variation is unrelated to vehicle mass. Although the purpose of the NHTSA and LBNL reports is to estimate the effect of vehicle mass reduction on societal risk, this is not exactly what the regression models are estimating. Rather, they are estimating the recent historical relationship between mass and risk, after accounting for most measurable differences between vehicles, drivers, and crash times and locations. In essence, the regression models are comparing the risk of a 2600-lb Dodge Neon with that of a 2500-lb Honda Civic, after attempting to account for all other differences between the two vehicles. The models are not estimating the effect of literally removing 100 lbs from the Neon, leaving everything else unchanged. In addition, the analyses are based on the relationship of vehicle mass and footprint on risk for recent vehicle designs (model year 2000 to 2007). These relationships may or may not continue into the future as manufacturers utilize new vehicle designs and incorporate new technologies, such as more extensive use of strong lightweight materials and specific safety technologies. Therefore, throughout this report we use the phrase “the estimated effect of mass (or footprint) reduction on risk” as shorthand for “the estimated change in risk as a function of its relationship to mass (or footprint) for vehicle models of recent design.”

75
7. References Allison, P.D., 1999. Logistic Regression Using the SAS System. Cary, NC: SAS Institute Inc., pp. 48-51. Farmer, Charles M. 2003. “Reliability of Police-Reported Information for Determining Crash and Injury Severity.” Traffic Injury Prevention, 4:1, 38-44. Farmer, Charles M. 2012. Review of “Relationships Between Fatality Risk, Mass, and Footprint in Model Year 2000-2007 Passenger Cars and LTVs” by Charles J. Kahane, National Highway Traffic Safety Administration. Insurance Institute for Highway Safety. January 6. Green, Paul E. 2012. Review of “Relationships Between Fatality Risk, Mass, and Footprint in Model Year 2000-2007 Passenger Cars and LTVs” by Charles J. Kahane, National Highway Traffic Safety Administration. University of Michigan Transportation Research Institute. February 15. Green, Paul E., Lidia Kostyniuk, Tim Gordon, Matt Reed. 2011. Independent Review: Statistical Analyses of Relationship between Vehicle Curb Weight, Track Width, Wheelbase and Fatality Rates. University of Michigan Transportation Research Institute. March. UMTRI-2011-12. Kahane, C.J. 2003. Vehicle Weight, Fatality Risk and Crash Compatibility of Model Year 1991-99 Passenger Cars and Light Trucks. National Highway Traffic Safety Administration Technical Report, Washington, D.C. DOT HS 809-662, October. Kahane C.J. 2010. Relationships Between Fatality Risk, Mass, and Footprint in Model Year 1991-1999 and Other Passenger Cars and LTVs. Final report included in the Corporate Average Fuel Economy for MY 2012-MY2016 Passenger Cars and Light Trucks Final Regulatory Impact Analysis, NHTSA, March. Kahane, C.J. 2011. Relationships Between Fatality Risk, Mass, and Footprint in Model Year 2000-2007 Passenger Cars and LTVs. Preliminary report prepared for the National Center for Statistics and Analysis, National Highway Traffic Safety Administration, Washington, D.C. July. Kahane, C.J. 2012. Relationships Between Fatality Risk, Mass, and Footprint in Model Year 2000-2007 Passenger Cars and LTVs. Final report prepared for the National Center for Statistics and Analysis, National Highway Traffic Safety Administration, Washington, D.C. August. Menard, S. 2002. Applied Logistic Regression Analysis, Second Edition. Sage Publications, Thousand Oaks CA. O’Brien, R.M. 2007. “A Caution Regarding Rules of Thumb for Variance Inflation Factors,” Quality and Quantity, (41) 673-690.
76
Partyka, S.C., 1995. Impacts with Yielding Fixed Objects by Vehicle Weight. NHTSA Technical Report. DOT HS 808 574. U.S. Department of Transportation, National Highway Traffic Safety Administration, Washington, D.C. Sivinski R. 2011. Update of NHTSA’s 2007 Evaluation of the Effectiveness of Light Vehicle Electronic Stability Control (ESC) in Crash Prevention, NHTSA Technical Report No. DOT HS 811 486. National Highway Traffic Safety Administration, Washington, DC. Systems Research and Application Corporation. 2012. Peer Review of LBNL Statistical Analysis of the Effect of Vehicle Mass & Footprint Reduction on Safety (LBNL Phase 1 and 2 Reports). Prepared for Office of Transportation and Air Quality, US Environmental Protection Agency, EPA contract number EP-C-11-007. February. Van Auken, R.M., Zellner, J.W., 2002. An Assessment of the Effects of Vehicle Weight on Fatality Risk in Model Year 1985-98 Passenger Cars and 1985-97 Light Trucks. DRI-TR02-02. Dynamic Research, Inc., Torrance, California. Van Auken, R.M., Zellner, J.W., Boughton, J.P., Brubacher, J.M., 2003. A Further Assessment of the Effects of Vehicle Weight and Size Parameters on Fatality Risk in Model Year 1985-98 Passenger Cars and 1985-97 Light Trucks. DRI-TR03-01. Dynamic Research, Inc., Torrance, California Van Auken, R.M., Zellner, J.W., 2004. A Review of the Results in the 1997 Kahane, 2002 DRI, 2003 DRI, and 2003 Kahane Reports on the Effects of Passenger Car and Light Truck Weight and Size on Fatality Risk. DRI-TR-04-02. Dynamic Research, Inc., Torrance, California. Van Auken, R.M., Zellner, J.W., 2005a. An Assessment of the Effects of Vehicle Weight and Size on Fatality Risk in 1985 to 1998 Model Year Passenger Cars and 1985 to 1997 Model Year Light Trucks and Vans. SAE Technical Paper Series, 2005-01-1354. Society of Automotive Engineers, Warrendale, PA. Van Auken, R.M., Zellner, J.W., 2005b. Supplemental Results on the Independent Effects of Curb Weight, Wheelbase, and Track on Fatality Risk in 1985-1998 Model Year Passenger Cars and 1986-1997 Model Year LTVs. DRI-TR05-01. Dynamic Research, Inc., Torrance, California. Van Auken, R.M., and Zellner, J. W. 2012a. Updated Analysis of the Effects of Passenger Vehicle Size and Weight on Safety, Phase II; Preliminary Analysis Based on 2002 to 2008 Calendar Year Data for 2000 to 2007 Model Year Light Passenger Vehicles to Induced-Exposure and Vehicle Size Variables. Report No. DRI-TR-12-01. Torrance, CA: Dynamic Research, Inc. January. Van Auken, R.M., and Zellner, J. W. 2012b. Updated Analysis of the Effects of Passenger Vehicle Size and Weight on Safety; Sensitivity of the Estimates for 2002 to 2008 Calendar Year Data for 2000 to 2007 Model Year Light Passenger Vehicles to Induced-Exposure and Vehicle Size Variables. Report No. DRI-TR-12-03. Torrance, CA: Dynamic Research, Inc. February.

77
Wenzel, Tom P. 2011. An Analysis of the Relationship between Casualty Risk Per Crash and Vehicle Mass and Footprint for Model Year 2000-2007 Light-Duty Vehicles. Preliminary report prepared for the Office of Energy Efficiency and Renewable Energy, US Department of Energy, Berkeley, California. December. LBNL-5695E. Wenzel, Tom P. 2012a. Analysis of Casualty Risk per Police-Reported Crash for Model Year 2000 to 2004 Vehicles, using Crash Data from Five States. Final report prepared for the Office of Energy Efficiency and Renewable Energy, US Department of Energy, Berkeley, California. March. LBNL-4897E. Wenzel, Tom P. 2012b. Assessment of NHTSA’s Report “Relationships Between Fatality Risk, Mass, and Footprint in Model Year 2000-2007 Passenger Cars and LTVs”. Final report prepared for the Office of Energy Efficiency and Renewable Energy, US Department of Energy, Berkeley, California. August. LBNL-5698E.