analysis of the spectacular gold and silver from the …giovanni.gigante/lavori/xrs2680.pdfanalysis...
TRANSCRIPT

Research article
Received: 20 November 2015 Revised: 11 December 2015 Accepted: 13 December 2015 Published online in Wiley Online Library
(wileyonlinelibrary.com) DOI 10.1002/xrs.2680
Analysis of the spectacular gold and silver fromthe Moche tomb ‘Señora de Cao’R. Cesareo,a,e* R. Franco Jordan,b A. Fernandez,b A. Bustamante,c J. Fabian,c
S. del Pilar Zambrano,c S. Azeredo,d R. T. Lopes,d G. M. Ingo,e C. Riccucci,e
G. Di Carloe and G. E. Gigantef
On the north coast of present-day Peru, between the Andes and the Pacific Ocean, approximately between 100 and 600AD, theMoche civilization prospered. TheMoche were very sophisticated artisans andmetal smiths, so that they are considered the finestproducers of jewels and artifacts of the region. Their metalworking ability was impressively demonstrated by the excavations ofthe tomb of the ‘Lady of Cao’ (dated around third–fourth century AD) discovered by Regulo Franco in 2005. Impressive is thebeauty of the artifacts, and also the variety ofmetallurgical solutions, demonstrated by not only the presence of objects composedof gold and silver alloys but also of gilded copper, gilded silver, and tumbaga, a poor gold Cu-Au alloy subject to depletion gilding.
About 100 metal artifacts from the tomb of the Lady of Cao, never before analyzed, were studied by using various portableequipments based on following non-destructive and non-invasive methods:
• energy-dispersive X-ray fluorescence with completely portable equipments;• transmission of monenergetic X-rays;• radiographic techniques; and• optical microscopy.
Gold objects and gold areas of nose decorations are characterized by approximately the same composition, that is, Au= (79.5±2.5) %, Ag= (16±3)%, and Cu= (4.5 ±1.5) %, while silver objects and silver areas of the same nose decorations show completelyerratic results, and a systematic high gold concentration. Many gilded copper and tumbaga artifacts were identified and analyzed.Further, soldering gold–silver was specifically studied by radiographs.
Additional measurements are needed, particularly because of the suspect that depletion gilding was systematically employedalso in the case of some nose decorations. Copyright © 2016 John Wiley & Sons, Ltd.
* Correspondence to: Roberto Cesareo, Istituto di Matematica e Fisica, Università diSassari; via Nulauro 3, 07041 Alghero, Italy. E-mail: [email protected]
a Dipartimento di Matematica e Fisica, Università di Sassari, Sassari, Italy
b PACEB Museo Cao (Fundación Wiese), Trujillo, Peru
c Universidad Nacional Mayor de San Marcos, Lima, Perù
d COPPE, Universidade Federal do Rio de Janeiro, Rio de Janeiro, Brasil
e Istituto per lo studio dei materiali nano strutturati, CNR-Montelibretti, Rome, Italy
f Dipartimento di Scienze di base ed applicate per l’ingegneria, Università di Roma‘La Sapienza’, Rome, Italy
Introduction
Historical and geographic introduction
On the north coast of present-day Peru (Fig. 1) approximaterlybetween 1200 BC and 1375 AD, various relevant civilizationsflourished: Cupisnique (1200–200 BC) Chavín (1000–200 BC),Vicús and Frías (200 BC–300 AD), Moche (100–600 AD), and Sicán(700–1375 AD).
Among them, themost important, from the point of view ofmet-allurgical ability, was the Moche civilization (also called Mochica).
The Moche civilization flourished in areas south of the Vicús, inthe Moche and Chicama valleys, where its great ceremonial centershave been discovered, producing painted pottery, monuments,and gold ornaments. The Vicús and Moche cultures thrived withina relatively short distance of each other. The Moche were knownas sophisticated metal smiths, both in terms of their technology,and the beauty of their jewels.
The Moche metalworking ability was impressively demonstratedwhen Walter Alva and coworkers discovered in 1987 the ‘TumbasReales de Sipán[1,2] and, more recently, when Regulo Franco Jordandiscovered the tomb of the ‘Lady of Cao’ in 2005 (Fig. 2).[3–6] Spec-tacular gold and silver funerary ornaments were excavated and arenow exposed in the Museum ‘Tumbas Reales de Sipán’ inLambayeque, close to Chiclayo and in the site Museum of Cao,about 60 km north to Trujillo.
X-Ray Spectrom. (2016)
Previously, in the late 1960, tombs rich of metals attributed tothe Moche were discovered and looted in an area that came tobe known as Loma Negra, in the Vicús region. Hundreds ofobjects attributed to Loma Negra were sold to US collectorsand finally partially transferred to the Metropolitan Museum ofNew York.[7,8] The site of Loma Negra was dated aboutsecond–third century AD,possibly before the tombs of the Ladyof Cao (~300 AD) and of the lord of Sipán (~350 AD). However,these dates are uncertain.
Copyright © 2016 John Wiley & Sons, Ltd.
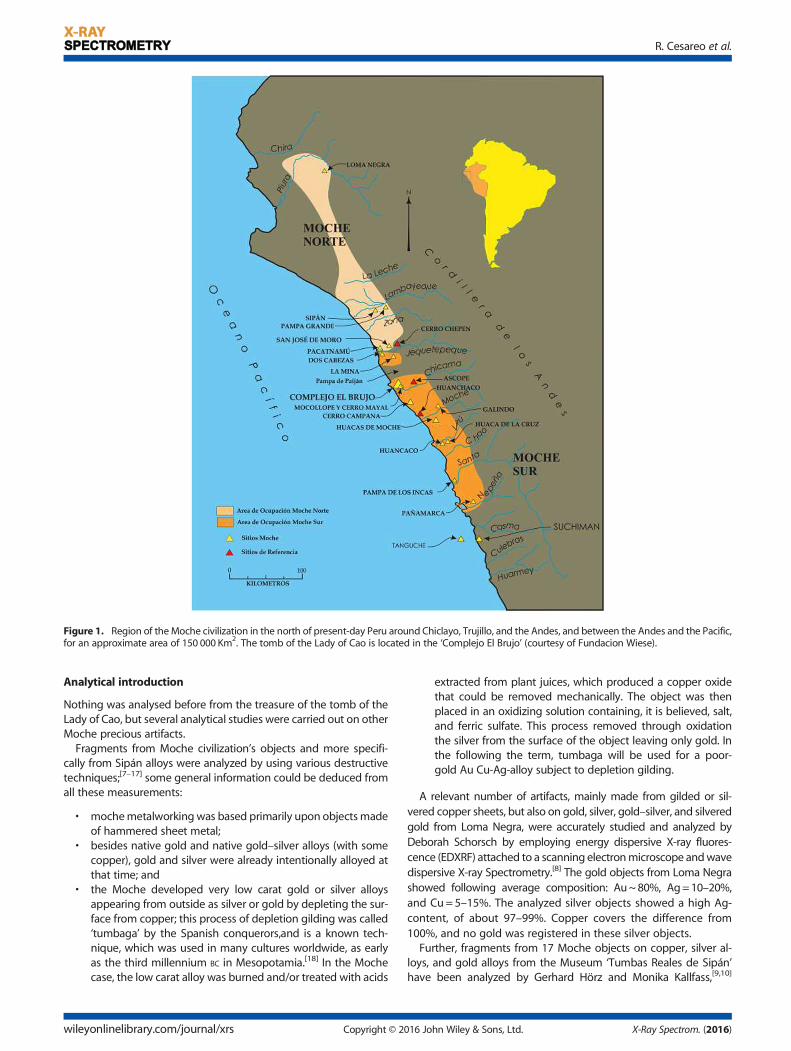
Figure 1. Region of theMoche civilization in the north of present-day Peru around Chiclayo, Trujillo, and the Andes, and between the Andes and the Pacific,for an approximate area of 150 000 Km2. The tomb of the Lady of Cao is located in the ‘Complejo El Brujo’ (courtesy of Fundacion Wiese).
R. Cesareo et al.
Analytical introduction
Nothing was analysed before from the treasure of the tomb of theLady of Cao, but several analytical studies were carried out on otherMoche precious artifacts.Fragments from Moche civilization’s objects and more specifi-
cally from Sipán alloys were analyzed by using various destructivetechniques;[7–17] some general information could be deduced fromall these measurements:
• mochemetalworking was based primarily upon objectsmadeof hammered sheet metal;
• besides native gold and native gold–silver alloys (with somecopper), gold and silver were already intentionally alloyed atthat time; and
• the Moche developed very low carat gold or silver alloysappearing from outside as silver or gold by depleting the sur-face from copper; this process of depletion gilding was called‘tumbaga’ by the Spanish conquerors,and is a known tech-nique, which was used in many cultures worldwide, as earlyas the third millennium BC in Mesopotamia.[18] In the Mochecase, the low carat alloy was burned and/or treated with acids
wileyonlinelibrary.com/journal/xrs Copyright © 2
extracted from plant juices, which produced a copper oxidethat could be removed mechanically. The object was thenplaced in an oxidizing solution containing, it is believed, salt,and ferric sulfate. This process removed through oxidationthe silver from the surface of the object leaving only gold. Inthe following the term, tumbaga will be used for a poor-gold Au Cu-Ag-alloy subject to depletion gilding.
A relevant number of artifacts, mainly made from gilded or sil-vered copper sheets, but also on gold, silver, gold–silver, and silveredgold from Loma Negra, were accurately studied and analyzed byDeborah Schorsch by employing energy dispersive X-ray fluores-cence (EDXRF) attached to a scanning electronmicroscope andwavedispersive X-ray Spectrometry.[8] The gold objects from Loma Negrashowed following average composition: Au~80%, Ag=10–20%,and Cu = 5–15%. The analyzed silver objects showed a high Ag-content, of about 97–99%. Copper covers the difference from100%, and no gold was registered in these silver objects.
Further, fragments from 17 Moche objects on copper, silver al-loys, and gold alloys from the Museum ‘Tumbas Reales de Sipán’have been analyzed by Gerhard Hörz and Monika Kallfass,[9,10]
016 John Wiley & Sons, Ltd. X-Ray Spectrom. (2016)

Figure 2. View of the ‘pyramid’ excavations (top figure), tomb of the ‘Lady of Cao’ (middle) and sarcophagus of the Lady of Cao. The pyramid is located in the‘Complejo El Brujo’, several hundreds of meters from the Pacific Ocean, and a few kilometer fromMagdalena de Cao, which is about 60 km north from Trujillo(Courtesy of Fundacion Wiese).
EDXRF, X-ray transmission, radiography, Au, and Ag, tomb lady of Cao
using optical emission spectrometry with inductively coupledhigh frequency plasma, wavelength-dispersive spectrometry, andstructural analysis. These authors were able to distinguish varioustechniques of manufacture (working, casting, gilding, depletion sil-vering, embossing, and depletion gilding); in particular, they wereable to identify the following:
• gilded copper objects: a series of objects found in the tomb ofthe ‘Señor de Sipán’ was identified as made of gilded copper,characterized by a thin gold film (2–6μm). The coatings con-sist of a gold–copper alloy containing some silver;
• copper–silver alloys: fragments from several human headshapes beads have been analyzed, made of a sheet com-posed of 79% Cu, 20% Ag, and 1% Au approximately;
• copper–gold–silver alloys (depletion gilding objects): frag-ments were analyzed from a headdress, a chin ornament, anornamental disc, and ornamental beads; the average compo-sition of the headdress was calculated to be 60% Cu, 34% Au,and 6% Ag. The average composition of the chin ornament is
X-Ray Spectrom. (2016) Copyright © 2016 John Wiley &
40% Cu, 50% Au, and 10% Ag; the average composition of theornamental disc is 30% Cu, 60% Au, and 10% Ag, and the av-erage composition of the ornamental bead is 20% Cu, 65%Au, and 15% Ag. It should also be observed that the alloycomposition is strongly dependent on the distance from thesurface (Fig. 3).
Recently, Carole Fraresso[19] has examined 15 fragments fromthe Moche site of Huaca de la luna and Huaca del sol. Fromthe analysis of these fragments by an EDXRF-system associ-ated to a scanning electron microscope, ten were on nearlypure copper, and one is possibly on tumbaga; because ofthe surface Au enrichment, another is composed of 98% Cu,1.5% Au, and 0.5% Ag. The two others seem to be on gildedcopper.
It is evident from all measurements carried out and from thevariety of object composition that the analytical problems ofMochemetallurgy are extremely complicated, because of the variety of
Sons, Ltd. wileyonlinelibrary.com/journal/xrs

Figure 3. Examples of tumbaga. The mean profiles are shown of theconcentrations of Cu, Au, and Ag versus distance from the surface, for fourfragments of Moche artifacts. The Au concentration decreases while theCu-concentration increasing versus depth. Modified from G. Hörz and M.Kallfass (Ref. 8).
Figure 4. Energy-dispersive X-ray fluorescence portable equipment,composed of a Si-drift detector (on the right; 123SDD: 450-μm thickness,7-mm2 area, and 125-eV energy-resolution at 5.9 keV) and a Ag-anodeX-ray tube (40 kV, 100-μA maximum voltage and current) (38). Electronicsincluding bias supply and Multi-Channel Analyzer (MCA) are in the case ofthe detector; X-ray tube bias supply is in the case of the X-ray tube. Atypical measurement takes 50–100 s. The energy-dispersive X-rayfluorescence-equipment is analyzing the crown PACEB-F4-00069.
R. Cesareo et al.
alloys and manufacture techniques, of the long time burial and oflayered structure of others.References[20–37] are suggested to better understand the metal-
lurgy of pre-Hispanic cultures from the north of Peru.
Experimental
Energy dispersive X-ray fluorescence
Characteristics and experimental set-up
Energy dispersive X-ray fluorescence analysis is able to quantify thecomposition of a gold, silver, or copper alloy by using, for example,standard samples of the same alloys (Section Quantitative analysisof gold and silver alloys). EDXRF-analysis is also able to detect, andqualitatively determine trace elements, when approximately pres-ent a level of 0.1% or more. EDXRF is a surface analysis, in the sensethat the thickness of the alloy involved in the analysis is of the orderof microns to a maximum of tens of microns (Figs 11 and 12); theresults are therefore related to this depths and are generally validin absence of surface enrichment phenomena (patina and ionsmigration processes).For the measurements carried out in the Museum of Cao, the
portable equipment was composed of a mini X-ray tube byAMPTEK (Bedford, MA, USA),[38] which is characterized by a Ag-anode and works at 40 kV and 200μA maximum voltage andcurrent, and a 123-Si-drift detector.[39] Bias supply and electronicsof both X-ray tube and detector are located in the case of tubeand detector, respectively; in such a manner, the equipment isextremely compact (Fig. 4).The Si-drift is a thermoelectrically cooled detector, with a 450-μm
and 7-mm2 thickness and area of the Si-crystal respectively, and athin Be-window, of typically 12.5-μm thickness (0.5 mil) with about125-eV energy resolution at 6.4 keV.[38] This detector has an effi-ciency of 97%, 39%, and14% at 10, 20, and 30 keV, respectively.The irradiated and analyzed area is of about 20mm2, when theobject is at a distance of a few centimeters.The X-ray beam intensity with a not collimated and not filtered
X-ray tube is largely in excess for analysis of alloys. For this reason,the X-ray beam is collimated and filtered, also to better its ‘form’,
wileyonlinelibrary.com/journal/xrs Copyright © 2
and to partially monochromatize the X-ray beam. The object to beanalyzed is positioned at 1.5–3-cm distance from both X-ray tubeand detector. The measuring time ranges from about 50 s toabout 200 s, mainly according to the sample composition and size.
Standard gold and silver alloys were employed for calibration andfor quantitative determination of alloy composition, containingknown concentration of gold, silver, and copper (gold alloys) and ofsilver, copper, and gold (silver alloys). As will be shown and explainedlater, the ratios Cu/Au and Ag/Au were employed for calibration.
To measure gilding thickness of gilded copper or silver, the Cu(Kα/Kβ)-ratio or Ag(Kα/Kβ)-ratio and the (Au-La/Cu-Ka) or (Au-La/Ag-Ka)-ratios were employed. Further, commercial gold leaves wereemployed (each Au-foil 0.125μm thick) to simulate gilded copperor tumbaga, and silver foils (each Ag-foil 0.25μm thick) to simulatethe ‘silvered copper’ or ‘Ag-tumbaga’. Also calibrated Au-leaves wereemployed, and several gilded-copper samples with calibrated gildingthickness. Thick sheets of pure copper and silver were also employed.
X-ray spectrum of gold alloys
The final result of EDXRF – analysis of a sample is a X-ray spectrumcontaining a set of X-lines for each detectable element present inthe analyzed object.
When K-shells are excited, four characteristic lines are emitted byeach element: Kα1, Kα2, Kβ1, and Kβ2.
[40,41] When L-shells are ex-cited, nine characteristic lines are emitted by each element, thatis, in order of energy, Lη, Lα1, Lα2, Ll, Lβ1, Lβ2, Lβ3, Lγ1, and Lγ3.
40[40,41]
From a practical point of view, and because of the finite energy-resolution of semiconductor detectors, the line combinations Ka1–Ka2, coincide in a unique peak, and the same happens for the linespairs or triplets Kβ1 –Kβ2, Lα1–Lα2, and Lβ1–Lβ2–Lβ3. K-lines aretherefore identified by two X-rays Kα and Kβ, and L-lines by sixX-rays Lη, Lα, Ll, Lβ, Lγ1 and Lγ3 of which only Lα and Lβ of highintensity.
By analyzing a gold alloy, containing Au-Ag-Cu, and using aproper filter at the X-ray tube output to attenuate the low-energypart of the spectrum, a typical X-ray spectrum is obtained, as shownin Fig. 5.
016 John Wiley & Sons, Ltd. X-Ray Spectrom. (2016)

Figure 5. X-ray spectrum of an Au-Ag-Cu alloy (70% Au, 25% Ag, 5% Cu),obtained with the equipment shown in Figure 4; the X-ray tube wasworking at 35 kV and 30 μA. The X-ray peaks are, from leftf: Cu-Kα line(8 keV), Au-Ll (8.5 keV), Cu-Kβ (8.9 keV), Au-Lα (9.7 kev), Au-Lη (10.3 keV),Au-Lβ (11. keV), Au-Lγ (13. keV), Ag-Kα (22 keV), and Ag-Kβ (25 keV). Au X-rays have the following relative intensity: Au-Ll (5), Au-Lα (100), Au-Lη(2.3),Au-Lβ(135), and Au-Lγ (25).
Figure 6. Average Kα/Kβ ratio versus atomic number Z, for infinitely thin(blue rhombs) and thick (red squares) single element samples when theexciting energy is much higher than Kdiscontinuity; values were deducedfrom various calculations. Experimental results are also shown (thicksamples: green triangles; thin samples, black squares). An error of about±0.2 may be assumed for thin samples, a lower error for thick samples.
EDXRF, X-ray transmission, radiography, Au, and Ag, tomb lady of Cao
Quantitative analysis of gold and silver alloys
Artifacts of very different size composition and formwere analyzed.It is, therefore, very difficult to reproduce a fixed geometrical ar-rangement and, in particular, to have always the same distancesX-ray tube object detector. For these reasons, there was a preferredapproach for quantitative analysis, of using, instead of the intensityof X-rays emitted by an element, the intensity ratio of two compo-nents (for example Cu/Au and Ag/Au), which is not depending onthe geometry.
In the case of gold or silver alloys, composed by Au-Ag-Cu andAg-Cu-Au respectively, and assuming that Au(%)+Cu(%)+Ag(%)=100(both for Au and Ag-alloys), by plotting the ratios (Cu-Kα/Au-Lα)counts versus (Cu-Kα/Au-Lα)concentration, (Ag-Kα/Au-Lα)countsversus (Ag-Kα/Au-Lα)concentration and the same for Ag-alloys, itturns out that there is approximately a linear relationship, at leastfor Ag-concentrations in Au up to about 30%, Cu-concentrationsin Au up to 20%, for Au-concentrations in Ag up to 30%, andCu-concentrations in Ag up to 20%.
When other elements are present as trace elements, theirconcentrations can be determined by using the method of funda-mental parameters.
Errors, uncertainties, and minimum detection limits related toquantitative analysis of gold and silver alloys by EDXRF-analysis willbe discussed in the following.
Kα/Kβ or Lα/Lβ-ratios
The Kα/Kβ and Lα/Lβ-ratios for all elements have been calculatedand, in several cases, were measured[42–46] (Fig. 6). Theoreticalvalues are calculated for infinitely thin samples, that is, whensecondary interactions in the sample are negligible. The ratiosKα/Kβ and Lα/Lβ can largely vary
• when the considered element is not ‘infinitely thin’ (self-attenuation effect); and
• when a layer of a different material is covering the consideredelement.
This is the case of gildings, silverings, tumbagas of all type, whichare extremely common in the Moche metallurgy.
X-Ray Spectrom. (2016) Copyright © 2016 John Wiley &
Self-attenuation effects on Kα /Kβ and Lα /Lβ-ratios
For a mono-elemental sample of any thickness, (not infinitely thin),self-attenuation effects must be considered, that is, the different at-tenuation of Kα and Kβ X-rays (or Lα and Kβ X-rays) emitted by theelement in a point of the sample and attenuated by the elementitself.
Kα/Kβ and Lα/Lβ X-rays vary according to followingequations[38–42]:
K∝Kβ
¼"
K∝Kβ
� �thick
,K∝Kβ
� �thin
#1� e� μ0þμ1ð Þ d
1� e� μ0þμ2ð Þ d
� �
¼ μ0 þ μ2
μ0 þ μ1
� �1� e� μ0þμ1ð Þ d
1� e� μ0þμ2ð Þ d
� �(1)
L∝Lβ
¼"
L∝Lβ
� �thick
,L∝Lβ
� �thin
#1� e� μ0þμ1ð Þ d
1� e� μ0þμ2ð Þ d
� �
¼ μ0 þ μ2
μ0 þ μ1
� �1� e� μ0þμ1ð Þ d
1� e� μ0þμ2ð Þ d
� �(2)
where
• thick and thin represent the tabulated and/ormeasured ratiosfor infinitely thick and thin samples,
• μ0 is the linear attenuation coefficient (in cm�1) of theconsidered element at mean energy E0,.
[47]
• μ1 is the linear attenuation coefficient (in cm�1) of theconsidered element, at the energy of its Kα (or Lα) line,
• μ2 is the linear attenuation coefficients (in cm�1) of the con-sidered element, at the energy of its Kβ (or Lβ) radiation, and
• -d represents the thickness (in cm) of the sample.
Eqns (1) and (2) are valid when both incident and output beamare normal to the sample surface, and for pure elements;otherwise, the material composition must be taken into account.
Sons, Ltd. wileyonlinelibrary.com/journal/xrs

R. Cesareo et al.
The values of Eqns (1) and (2) were normalized to 1, in such amanner that Kα/Kβ (or Lα/Lβ)-ratios= 1 for thin samples.Figure 7 shows, for example, the self-attenuation curves for Au.
Kα /Kβ (or Lα /Lβ)-ratios of X-rays emitted by an element in an internal sheetand attenuated by the external sheet (or sheets)
When a sheet, supposed thick, composed by a single element, (orcontaining this element), is covered by a sheet of another element,(or containing this element), then the ratios (Kα/Kβ) or (Lα /Lβ) arealtered in the following manner because of the different attenua-tion of the Kα and Kβ X-rays (or Lα and Kβ X-rays) of the firstelement[42,48] (Fig. 8):
K∝Kβ
¼ K∝Kβ
� �thick
e� μ1�μ2ð Þd (3)
L∝Lβ
¼ L∝Lβ
� �thick
e� μ1�μ2ð Þd (4)
Figure 7. Self-attenuation effect of Au-L lines in the case of gildings,according to Eqn (2) (blue rhombs). Red squares refer to experimentalmeasurements. The behavior for low Au-thickness is shown in the squareon the top right.
Figure 8. Photoelectric effect and emission of X-rays (Xα and Xβ), whichself-attenuated in the first sheet (Eqns 1 and 2), are attenuated in thesecond sheet (Eqns 3 and 4) .
wileyonlinelibrary.com/journal/xrs Copyright © 2
where
Kα/Kβ and Lα/Lβ are the ratios of the X-rays of the mostinternal sheet, supposed on infinite thickness,
μ1 represents the linear attenuation coefficient of the secondsheet at the energy of Kα (or Lα) radiation of the first sheet,[47]
andμ2 is the linear attenuation coefficient of the covering sheet
at the energy of the Kβ (or Lβ) radiation of the internal sheet.
The behavior of copper covered by gold is shown in Fig. 9.
Ratio of X-rays of elements in the external to an element in the internal sheet
Another way to experimentally determine the thickness of the ex-ternal elemental sheet from the X-ray spectrum, assuming thatthe internal elemental sheet has an infinite thickness consists inthe direct use of the X-ray ratio of the two elements characterizingthe two sheet (for example, in the case of gilded copper, the ratioAu-Lα/Cu-Kα). By defining a and b, the external and internal sheetof the following equation, may be written[48]:
Nb
Na¼ P½1� e� μb0þμb1ð Þ�e� μb0þμb2ð Þd (5)
where
• P is a parameter to be determined from experimentalmeasurements,
• μb0 represents the linear attenuation of the element of sheetb at incident energy E0,
• μb1 represents the linear attenuation of the element of sheetb at energy of Kα-line of element a, and
• μb2 represent the linear attenuation of the element of sheet bat energy of Kβ-line of element a.
Figure 10 shows the curves described by Eqn (5) for gildedcopper.
This describedmethod based on the use of Kα/Kβ (or Lα/Lβ)-ratiosand of the ratio of X-rays of elements from contiguous layers was alsoemployed by various authors.[42,49–52]
Figure 9. Cu (Kα/Kβ)-ratio versus Au-thickness, according to Eqn (3);theoretical and experimental values are shown with blue rhombs and redsquares respectively. The behavior for low Au-thickness is shown in thesquare on the top right.
016 John Wiley & Sons, Ltd. X-Ray Spectrom. (2016)

Figure 10. Au-Lα/Cu-Kα-ratio versus Au-thickness according to Eqn (5); theoretical and experimental values are shown with blue rhombs and red squares,respectively. The behavior at low thickness values is shown in the square on the left top.
Figure 11. Typical depths involved when an X-ray beam of about 30-keVaverage energy irradiates a gold alloy (Au = 75%, Ag = 20%, Cu = 5%),and fluorescent X-rays are emitted. The percentage of radiation comingfrom each depth is shown, indicating, for example, that about 70% ofthe Au-Lα, Ag-Kα, and Cu-Kα X-rays are originating from the first 3 μm(Au), 5.5 μm (Ag), and 2 μm (Cu) of the Au-sample, respectively.
EDXRF, X-ray transmission, radiography, Au, and Ag, tomb lady of Cao
Reliability, uncertainties, and errors associated to energy-dispersive X-rayfluorescence analysis of gold and silver alloys
Reliability, uncertainties, and errors related to EDXRF-analysis ofgold and silver artifacts depend on many factors: the artifact itself(method of production, composition, use, possible restoration andconditions)[53–59], the equipment and its use, with special referenceto the X-ray detector, the calibration samples, the X-ray spectrumwith special reference to the width of X-ray peaks and counting sta-tistics, reference samples for EDXRF-analysis, and finally dataprocessing.
Considering all these factors, following absolute errors may beconsidered reasonable.Gold alloy, gold: ± (1–2)%; silver: ± (0.5–2)%;copper: ± (0.5–1)%; Silver alloy, silver: ± (1–2)%; copper: ± (0.5–1)%;gold: ± (0.5–1.5)%; Copper alloy, copper: ± (1–2)%
Thickness deduced by means of Cu Kα=Kβð Þ �ratio: ± 0:5� 1ð Þ μm
Thickness deduced by means of Au Lα=Lβð Þ �ratio: ± 0:3� 1:5ð Þ μm
Thickness deduced by means of AuL α=CuK α �ratio: ± 0:2� 1ð Þ μm
Transmission measurements
As observed previously, EDXRF analysis is a technique, whichanalyzes a thin surface layer. In the case of metals such as goldand silver, it typically interests a depth ofmicrons up to amaximumof tens ofmicrons (Figs 11 and 12). Therefore, EDXRF is affected by alarge indetermination when the sample composition is alteredbecause of surface enrichments processes, as often happens inthe case of silver alloys, and sometimes in the case of gold alloys.
An alternative technique of volume analysis was thereforedeveloped,[60,61] which employs the same equipment of EDXRF-analysis; by monochromatizing the X-ray beam by means of asecondary target composed of a proper element, the attenuation
X-Ray Spectrom. (2016) Copyright © 2016 John Wiley &
of K-X rays emitted by this element can be employed to determinethickness of a sample when composition is known, or composition(for two or three components alloy) when thickness is known ormeasured.
Theoretical background
The attenuation of single Kα and Kβ-lines emitted by target elementb can be employed to determine the thickness of sheet a. Forexample, a secondary target of Sn was usefully employed to deter-mine thickness and/or composition of Au and Ag alloys. In this case,the following may be written concerning attenuation of Sn-Kα andSn-Kβ lines:
Sn Kα½ �=Sn Kα½ �0 ¼ exp �μaαda� �
and (6)
Sons, Ltd. wileyonlinelibrary.com/journal/xrs

Figure 12. Typical depths involved when a X-ray beam of about 30-keVaverage energy irradiates a silver alloy (Ag= 70%, Cu= 15%, Au= 15%,Cu= 15%), and fluorescent X-rays are emitted. The percentage of radiationcoming from each depth is shown indicating, for example, that about 70%of the Ag-Kα, Cu-Kα, and Au-Lα X-rays are originating in the first 8μm (Ag),3μm (Cu), and 4 μm (Au) of the Ag-sample, respectively.
Figure 13. Transmission measurements: Sn-Kα/Sn-Kα° versus thickness(in μm) for absorbers with various thicknesses and for (from left) Au,Au+ 50%Ag, Cu, and Ag. Red circles refer (from left) to gold area of objectF4-0002, to silver area of object F4-0060 and to silver area of objectF4-0002 (blue line).
R. Cesareo et al.
Sn Kβ½ �=Sn Kβ½ �0 ¼ exp �μβαda
� �(7)
where [Kα]0 and [Kβ]0 indicate Kα and Kβ values of element b, withno element a.When sample a is composed by a two components alloy (for
example, Ag-Cu or Au-Ag), then, the following system of equationscan be contemporaneously written:
Sn Kα½ �=Sn Kα½ �0 ¼ e�95 d Agð Þ: e�150 d Cuð Þ (6′)
Sn Kβ½ �=Sn Kβ½ �0 ¼ e�425 d Agð Þ: e�107 d Cuð Þ (7′)
Each of the Eqns (6′) and (7′) can be employed to determine thethickness of the sheet.Alternatively, when the thickness of the two components alloy is
known or can bemeasured and has a value approximately less than1mm for silver alloys, and less than 100μm for gold alloys, thenEqns (6′) and (7′) can be employed to approximately determinethe alloy composition.That gives the possibility to check, with a simple volume analysis
based on transmission of monoenergetic X-rays, the analytical re-sults from EDXRF-analysis, which are related to a thin depth, andcan be, therefore, affected by surface enrichments processes, whichalter the surface composition and, therefore, in many cases, thereliability of EDXRF-analysis.
Experimental set-up and calibration
The experimental set-up for transmission measurements includesthe same X-ray tube and detector employed for EDXRF-analysisand described previously, that is, a Ag-anode X-ray tube workingat 40-kV and 200-μA maximum voltage and current and a Si-driftX-ray detector. The photons emitted by the X-ray tube are filtered,collimated, and irradiate the Sn-target, producing by photoelectriceffect Sn-K X-rays (with energy of 25.2 and 28.5 ke,V respectively).
wileyonlinelibrary.com/journal/xrs Copyright © 2
The Ag or Au-sheets to be measured are inserted between theSn-target and the detector entrance.
Calibration curves from Eqn (6′) are shown, for example, in Fig. 13.Results of transmission measurements can be compared with theresults of EDXRF-analysis and are a test of its reliability in the caseof possible surface enrichments.
Radiography
X-ray radiography is an imaging method that uses X-rays to revealthe structure of an object based on the different densities of itsconstituent materials. In the case of the objects from the tomb ofthe Lady of Cao, we should consider the fact that the large majorityof the objects are sheets basically on gold or silver alloys and theapproximate thickness was measured to be about 100μm forAu-layers and 200–300 for Ag-layers.
Radiographs were carried out with the following portableequipment (Fig. 14):
• a portable mini X-ray tube by AMPTEK, working at 50 kV and100μA maximum voltage and current;
• a flat panel detector by Schick Technologies; and• Image analysis software ISEE.
To image the Moche jewels under study the equipment workedat 25, 35, 45 and 50 kV. The first value appeared to be ideal tovisualize the Ag-areas, while the last values (45 and 50kV) were ableto image the gold areas.
Optical microscopy
Optical microscope investigations were carried out by using a WildMB (Heerbrugg, Heerbrugg Switzerland) optical microscopeequipped with a Leica DFC 320 digital camera.
The following nose decorations were observed by opticalmicroscopy:
• -nose decoration Proyecto Arqueológico Complejo El Brujo(PACEB)-F4-00002
016 John Wiley & Sons, Ltd. X-Ray Spectrom. (2016)

Figure 14. Flat panel-detector employed for the radiographs at the Museum of the Lady of Cao (left). Experimental set-up for digital radiography imageacquisition including X-ray tube and digital detector is shown on the right.
EDXRF, X-ray transmission, radiography, Au, and Ag, tomb lady of Cao
Results on the artifacts from the tomb of theLady of Cao
Gold
Energy-dispersive X-ray fluorescence analysis
Forty one nose decorations partially on gold and partially on silverwere analyzed. (Figures 15–17).[62] The composition of the gold areais shown in Table 1 and Au-Ag-Cu distribution in Fig. 18. It appearsclear, and not casual, that gold areas of nose decorations have samecomposition.
Figure 15. Front and rear side of the nose decoration PACEB-F4-0002. It iscomposed of a body on laminated gold alloy with two shields (on the frontside) and two huts on almost pure silver superimposed and glued. T and tindicate areas where transmission measurements were carried out,numbers 1-6 and a-h EDXRF-measurements carried out in 2014 and 2015,respectively. The red vertical line indicates the radiographic profile shownin Fig. 20. Gold alloy composition: Au= 74.5%, Ag= 19.5%, Cu= 5.5%. Silveralloy composition: Ag= 99.2%, Cu= 0.02%, Au= 0.8%.
Figure 16. Front and back side of nose decoration PACEB-F4-00106. Upperhalf-crown and lower half-crown strip are on gold alloy. The five heads areon silver alloy and are soldered to the half-crown at the top, and to thestrip at the bottom. Red lines show the position of quantitative grey-valuecurves from radiographs (Figs 21 and 22). Gold alloy composition:Au= 81.2%, Ag= 17.7%, Cu= 1.1%. Silver alloy composition: Ag= 91.8%,Cu= 4%, Au= 4.2%.
X-Ray Spectrom. (2016) Copyright © 2016 John Wiley &
Also 16 artifacts completely on gold were analyzed, which resultsare reported in Table 2. The mean composition, that is, Au=80.5%,Ag=15%, and Cu=4.5%, is quite similar to the mean compositionof the gold areas of nose decorations.
Only the eight needles on bulk gold-alloy have different compo-sition and are poor on silver and rich on copper, probably becauseof their use.
Transmission measurements
Attenuation measurements were carried out by using the equip-ment described in Section 2 with a secondary target on Sn. Results
Sons, Ltd. wileyonlinelibrary.com/journal/xrs

Figure 17. Front and back sides of the nose decoration PACEB-F4-00018. Itis composed of a body on laminated gold alloy showing two sneak’s heads,a human figure on silver alloy, and, hanging on the gold structure, 12 diskson silver. The red line shows the position of quantitative grey-value curvesfrom radiographs (Fig. 23). Gold alloy composition: Au= 75%, Ag= 20%,Cu= 5%. Silver alloy composition: Ag= 86.5%, Cu= 9.5%, Au= 4%.
Table 1. Composition of Au-areas of nose decorations N.2–34 and102–112
Number PACEB-F4 Au(%) Ag(%) Cu(%)
2 (Fig. 16) 74.5 19.5 5.5
3 79.5 16 5.5
4 82 14.5 3.5
6 77 18.5 4.5
7 80.5 15.5 4
8 72 24 4
9 79 18 3
10 78 18.5 3.5
11 81 13.5 5.5
13 78 19 3
14 78 18 4
15 75.5 20.5 4
16 79.5 16 4.5
17 78.5 16.5 5
18 (Fig. 18) 75 20 5
19 78 17 5
20 82.5 14 3.5
21 80 15.5 4.5
22 77 17 6
23 82 14.5 3.5
24 75 21 4
25 80 16 4
26 80 15 5
27 74.5 20 5.5
28 74.5 23 2.5
29 82 12.5 5.5
30 80 14 6
31 80 14 6
32 77 18 5
33 81 17 2
102 82.5 13 4.5
103 80 14 6
104 85.5 11.5 3
105 80 14.5 5.5
106 (Fig. 17) 81.2 17.2 1.6
107 72.7 24.5 2.8
108 82.5 12.5 5
109 80.2 13.5 6.3
111 81.3 14.3 4.4
112 81 13.5 6.5
Mean value 79 ± 3 16.6 ± 3.2 4.4 ± 1.2
R. Cesareo et al.
are summarized in Table 3. The purpose of these measurementswas to compare the results obtained with EDXRF-analysis, whichis a surface analysis, with transmission measurements, which givea volume analysis, when the thickness of the examined object isknown.
Radiography
Radiographs of nose decoration PACEB-F4-00002, 00106, and00018 are shown (Figs 19–22). The radiography of the left-upperside indicates that the huts are glued to the gold body. The sameis valid for the two shields.Quite different is the situation concerning legs and feet, which
appear black in the image (Fig. 15). The attenuation is similar to thatof the gold body, and EDXRF-analysis exhibits a quite similar spec-trum. The feet are, therefore, on gold alloy, and areas appearingblacker in the photo are less absorbent in the radiography. The goldsheet has a possibly decreasing thickness from legs to feet.The case of nose decoration PACEB-F4-00106 is different, and
fractures and soldering areas could be identified by radiographs.Still different is the situation of nose decoration PACEB-F4-
00018, in which gold and silver areas are attenuated in a similarmanner, as can be observed by the radiographs. The suspect isthat a unique layer of silver could be subject to aq process ofdepletion gilding.
wileyonlinelibrary.com/journal/xrs Copyright © 2
Optical microscopy
Typical Image from nose decoration PACEB-F4-00002 is shown inFig. 23.
Silver
Energy-dispersive X-ray fluorescence-analysis
Image of a nose decoration, with gold and silver areas, is shown inFig. 24. Results of EDXRF-analysis on all nose-decorations are shownin Table 4; the composition variety of the 41 nose decorations isvery high. The not casual massive presence of Au in these Ag-alloysis not questionable and is very peculiar. It is possibly due to the pur-pose of limiting Ag-oxidation processes, or to give a special color tothe Ag-alloy, or to some undetected processes of depletion gilding.
016 John Wiley & Sons, Ltd. X-Ray Spectrom. (2016)

Figure 18. Distribution of gold, silver, and copper concentration for 41nose decorations of the Lady of Cao. In red and black decorations from 2to 34, and from 102 to 112, respectively.
Table 2. Analysis of 16 artifacts on gold
Object number* Au(%) Ag(%) Cu(%)
PACEB-F4-0048 81 14 5
49-ear ring 82 13.5 4.5
50-ear ring 79.5 16 4.5
51-ear ring 79.5 16.5 4
54-ear ring 83.5 12.5 4
55-ear ring 82.5 13.5 4
56-ear ring 78 14.5 7.5
57-ear ring 77.5 14.5 8.5
58-ear ring 79 15.5 5.5
59-ear ring 79.5 14 6.5
71-dish 83.5 ± 1 13 ± 1 3.5 ± 0.5
89-necklace 80 13.5 6.5
90-necklace 80 16 4
91-necklace 80.5 15 4.5
94-necklace 77 17 6
95-necklace 82 15 3
Mean value 80.5 ± 2.0 15 ± 1.5 4.5 ± 2.0
Table 3. Results of attenuation measurements on gold areas of nosedecorations from the tomb of the Lady of Cao, partially on gold, andpartially on silver
PACEB-F4-N. dAu (μm)* dt (μm)^
2 (Fig. 16) 100 120
3 180 210
6 155 200
8 65 200
10 140 170
11 110 110
12 140 140
13 100 335
17 120 195
20 135 205
23 120 205
29 175 140
Approximate mean values 130 185
* from attenuation measurements and Eqns (6′) and (7′).^ from geometrical measurements (direct measurement or from
mass and sizes; a direct measurement of thickness can give a
partially erroneous result because of the non-flat surface and the
previous use of a protective layer).
Figure 19. Radiography of the left-upper side of the nose-decoration PACEB-F4-0002 (Fig. 15) carried out at kV (to visualize the gold-layer). The thicknessinhomogeneity is clearly represented by the gray levels and red numbers.
Figure 20. Radiography of the feet of nose-decoration PACEB-F4-0002. Thefeet are on gold alloy; areas appearing black in the photo (Fig. 15) exhibitquite similar EDXRF-spectra but appear less absorbent in the radiography.The gold sheet has a possibly slowly decreasing thickness versus feet.
EDXRF, X-ray transmission, radiography, Au, and Ag, tomb lady of Cao
Further, seven small heads on silver were analyzed, showing thefollowing mean composition: Ag =99%, Cu=1%, and Au=0.2%.However, the heads are completely oxidated, and the EDXRF-analyses could give only approximate results.
Transmission measurements
Results on transmission measurements of several nose decorationson silver areas are shown in Table 5, assuming that the results fromEDXRF-analysis are reliable.
Further, the silver ear ring PACEB-F4-00060 was carefully exam-ined by transmission measurements. This ear-ring is peculiar, be-cause as many other objects from the tomb of the Lady of Cao ischaracterized by a very high gold content. Transmission measure-ments are able to verify if the strange composition of this ring
X-Ray Spectrom. (2016) Copyright © 2016 John Wiley & Sons, Ltd. wileyonlinelibrary.com/journal/xrs

Figure 21. Radiography of first Ag-head on the right for nose decoration F4-00106, (last Ag-head and the gold strip, Fig. 18). In the enclosed curve, theinterfaces are shown between the head and the gold structure (red vertical line). A possible interpretation of these interfaces is depicted in the reddashed line (in the image) and shown in the graphic: starting from the top (left in the graphics), we have an Ag-area of the head; then the discontinuitybetween Ag and soldering (the soldering covers partially the silver neck, and partially the gold strip), and then the gold region.
Figure 22. Radiography of nose decoration PACEB-F4-00018 (Fig. 17). Itshows that the body supposed on laminated gold alloy and the humanfigure supposed on silver-alloy have similar mean grey values (blue lines).A possible hypothesis could be that a unique sheet on silver-alloy wasemployed and a gilding procedure was carried out on this alloy, on areasappearing as gold. This hypothesis requires confirmation.
Figure 23. Optical microscopy image of the back side of the nosedecoration PACEB-F4-0002 (Fig. 15), which shows residual material at theinterface between gold and silver laminas.
R. Cesareo et al.
determined by EDXRF-analysis, that is, 48% Ag, 28% Cu, and 24%Au [and this strangeness is common to many other silver areas(Table 4)], could be related to the whole volume or the ring wasaffected by surface enrichment processes. The transmission mea-surements completely confirmed the EDXRF results.
Radiography
Figure 25 shown radiographic images of the silver hut of nosedecoration PACEB-F4-00002, carried out at 25 kV (to imagine silver)
wileyonlinelibrary.com/journal/xrs Copyright © 2
and 50 kV (to imagine gold). In the bottom figures, is visible the areawhere gold and silver are glued.
Figure 26 shows the ear ring PACEB-F4-00060, which composi-tion is shown in Table 7, and radiography in the same Fig. 26.
Gilded copper
Twenty-five objects from the tomb of the Lady of Cao are on gildedcopper and are well preserved, because of the very dry atmospherein the tomb and around it. The situation is different for the objectsfrom the tombs of Sipán: among the many analyzed objects, notmanywere on gilded copper. The reason for that is the damp atmo-sphere in the tomb, which favors the corrosion processes that tendsto destroy the gilding. For the same reason, gilded copper objects
016 John Wiley & Sons, Ltd. X-Ray Spectrom. (2016)

Figure 24. Nose decoration PACEB-F4-00017 on gold and silver scorpionssolded on a Au-Ag basis. The silver-alloy composition is: Ag= 64%,Cu= 16%, Au= 20%.
Table 4. Composition of Ag-areas for nose decorations 2–33 and102–112 and for other artifacts
PACEB F4-N. Ag(%) Cu(%) Au(%) Additional elements
2 99.2 0.02 0.8 Pb 0.2%
3 83 7.5 9.5 As 0.5%, Fe
4 92 4.5 3.5 area4.1,
Hg ~ 0.4%
(traces of Fe, Zn)
5 80 10 10 Pb 0.1–0.2%
6 91.5 4 4.5 Pb 0.2–0.4%
7 87 5 8 Pb 0.15–0.3%
8 41 25 34 —
9 79.5 13.5 7 —
10 52 21 27 —
11 64 21 15 —
12 45.5 35.5 19 —
13 85.5 10.5 4 —
14 51 25 24 —
15 61.5 14.5 24 —
16 73.5 13.5 13 —
17 64 16 20 Pb 0–0.15
18 86.5 9.5 4 Pb 0–0.4%
19 88 4 8 —
20 77 21 2 As 0.5–1%,
Pb 0–0.1%
21 65.5 33.5 1 As or Pb 0.2%, Fe
22 71.5 14 14.5 Pb < 0.1%
23 76 11.5 12.5 —
24 61.5 25.5 13 Pb 0.2%, Fe
25 55.5 22 22.5 —
26 77 13.5 9.5 —
27 81.5 14.5 4 Pb 0.2%, Fe
28 89 7.5 3.5 Pb 0.3%
29 57.5 25.5 17 —
30 56.5 26 17.5 —
31 53.5 24 22.5 —
32 63.5 13 23.5 —
33 74.5 15.5 10 Pb 0.1%
34-ear ring 83.5 4.5 12 —
102- 82.1 4.4 13.5 —
102 ring 68 5.3 26.7 —
103 78.2 11.8 10 —
104 82.6 9.8 7.6 —
105 58.8 15.2 26 —
106 91.8 4.0 4.2 Pb
107 74.5 5.5 20 —
110 41.2 37.3 21.3 —
111 70.6 26.1 3.3 As, Pb
112 58.5 18.7 22.8 —
60-ear ring 48 28 24 —
61-ear ring 48 28 24 —
62-ear ring 76 14 10 —
63-ear ring 69 23 8 —
90-necklace 75 10.5 14.5 —
EDXRF, X-ray transmission, radiography, Au, and Ag, tomb lady of Cao
are generally well recognized, because of the many areas withoutresidual gold.
Energy-dispersive X-ray fluorescence analysis
Table 6 shows the results of the 25 objects on gilded copper. Thegold-leaf thickness is indicated the gilding composition, supposingthat Cu is absent in the gilding (it is almost impossible todifferentiate the possible presence of Cu in the gilding from theCu-substrate). A mean gilding thickness of about 0.6μm wasmeasured, and a gold concentration of about 92%.
A clear comparison with other Moche artifacts on gilded copperis difficult, because of the very poor preservation of these other ar-tifacts. However, in the few cases where this comparison is possible,the results agree with those of the ‘Lady of Cao’ artifacts.
Tumbaga
According to our measurements, there is no evidence of Cu-Autumbaga in the pre-Moche cultures. At the contrary, there aremanyexamples of tumbagas in the Moche culture.
Concerning the calculations of ‘equivalent gold thickness’andcomposition of tumbaga, the first parameter can be evaluatedthrough the ratios Cu(Kα/Kβ), Au(Lα/Lβ), and Au-Lα/Cu-Kα; forexample, for the necklace 00088, these have the following values:
Cu Kα=Kβð Þ ¼ 0:73 ±0:05ð Þ corresponding tod ¼ 3:4 ±0:8ð Þ μm
Au Lα=Lβð Þ Au Lα=Lβð Þ ¼ 0:80 ±0:02ð Þ corresponding tod ¼ 6:5 ±1:7ð Þ μm
Au� Lα=Cu� Kα ¼ 2:2 ±1:0ð Þ corresponding tod ¼ 5:5 ±0:7ð Þ μm:
Regarding composition, in the case of tumbaga, EDXRF-analysisis only giving an approximate indication, because the behavior ofAu, Ag, and Cu concentration changes versus depth as shown, forexample, in Figs 11 and 12.
X-Ray Spectrom. (2016) Copyright © 2016 John Wiley &
Energy-dispersive X-ray fluorescence analysis
Only five objects from the tomb of the Lady of Cao are supposed tobe on tumbaga, according to the ratio (Au-Lα/ Cu-Kα) ~ 1;a nicecollar with the figure of 12 human heads is shown in Fig. 27.
Sons, Ltd. wileyonlinelibrary.com/journal/xrs

Table 5. Transmission measurements of silver areas for several nosedecoration
PACEB-F4-N.000NN SnKα/SnKα0 SnKβ/SnKβ0 dAg(μm)*
2 (huts) 0.18 0.0026 155
3 (upper rectangle) 0.013 0.0008 275
6 (bottom area) 0.07 0.00045 249
8 (head of right prawn) 0.0047 0.0004 166
10 (body of iguana) 0.035 0.005 125
11 (left side on the middle) 0.12 0.018 85
12 (half moon area) 0.016 0.0021 177
13 (half moon area) 0.009 low statistics 358
17 (upper right area) 0.007 0.0008 240
20 (body of animal on the left) 0.04 0.0006 275
23 (tail of the snake) 0.016 0.001 250
29 (bottom on the right) bottom 0.08 0.017 115
* from attenuation measurements and Eqns (6′) and (7′)
R. Cesareo et al.
Table 7 shows the results giving the ‘equivalent gold thickness’,which is the Au-thickness producing the same effect of thetumbaga. A mean equivalent gilding thickness of about 3.4μmwas determined, and a Au-concentration of about 82%.At the contrary, a large part of the artifacts from the Royal Tomb
of Sipán is on tumbaga,[63,64] and the EDXRF-analysis gave thefollowing mean results: Au-thickness= 2.3±0.5μm and Au-meanconcentration=87%.
Discussion and conclusions
Gold alloy artifacts
Following Caley,[65] native gold contains a moderate proportion ofsilver (up to about 30%) and a low proportion of copper (up toabout 5%). Gold alloys ofmoderate to high fineness do not corrode,and therefore, the problem of their EDXRF-analysis is not compli-cated by the presence of corrosion products. Very poor gold alloys,especially when the alloying metal is copper, may corrode undernatural conditions.
Figure 25. Radiographs of the nose decoration PACEB-F4-00002 (see Fig. 15 an(to visualize the silver hut), on the left bottom at 50 kV (to visualize the gold figufrom the two radiographic images on the left.
wileyonlinelibrary.com/journal/xrs Copyright © 2
From the gold artifacts or gold areas from the tomb of the Ladyof Cao (Tables 1 and 2), it appears evident that they have all asimilar composition, that is,41 nose decorations, Au= (79±3)%,Ag= (16.6± 3.2)%, Cu= (4.4 ± 1.2)%,; 16 other artifacts, Au= (80.5± 2)%, Ag= (15±1.5)%, Cu= (4.5±2)%, and; All artifacts, Au= (79.5± 2.5)%, Ag= (16±2.5)%, Cu= (4.5 ± 1.5)%.
It is not usual to find such an homogeneous composition amongartifacts from the same tomb.[63]
These values are, more or less, compatible with the hypothesisthat the Moche from the time of the Lady of Cao (~300 AD) basicallyused native gold. However, composition of native gold variesgreatly, not only from one deposit to another but also even withingrains from the same deposit.[66] A possible explanation would bethat the Moche knew how to mix Au, Ag, and Cu to produce goldobjects of similar composition.
Silver alloy artifacts
Silver objects from early civilizations are scarce, apparently be-cause they were always made from the scarce native metal. Atfirst, the nearly pure metal was used without the addition of anyalloying metal. Later, its alloys with copper were used to a greaterextent. Impurities of Fe, Pb, Sn, Ni, and Au are often present in na-tive silver.[65]
Energy-dispersive X-ray fluorescence analysis of silver areas ofthe 41 nose decorations shows that they have a completelyerratic composition. Further, silver areas of the same object alsoexhibit an inhomogeneous composition. There is a reasonablesuspect that at least some of them were subject to a depletiongilding process.
Silver from the tomb of the Lady of Cao (except for the sevensmall heads) is characterized by the presence of relatively highconcentration of Au (up to about 37%) and Cu (up to about37%). The presence of Au in silver alloys is common, but onlyat levels of traces. For example, silver artifacts from the tombsof Sipán are characterized by the systematic presence of Au,but at levels of percent. The small heads from the tomb ofthe Lady of Cao have about 99% silver, and that demonstratesthat the Moche from Cao intentionally added Au and Cu to thesilver alloy for unknown reasons. Why the Moche from the time
d image at top right). The radiography on the left top was carried out at 25 kVre). The image on the right bottom was obtained after an image processing
016 John Wiley & Sons, Ltd. X-Ray Spectrom. (2016)

Figure 26. Radiographs of ear-ring F4-0060 and grey values along the red dashed horizontal line (top curve from right to left) and along the red dashedvertical line, from top to bottom. Gray values are logarithmically related to thickness differences, which are of the order of 10–15%.
EDXRF, X-ray transmission, radiography, Au, and Ag, tomb lady of Cao
of the Lady of Cao mixed high quantities of gold to the silveralloy is not clear; may be to give to the silver a luminous aspector to limit the oxidation process?
Gold–silver junction of the nose decorations
The combination of gold and silver sheet is common among the ar-tifacts from the tomb of the Lady of Cao, even if almost completelylimited to nose ornaments. As observed by D. Schorsch for Mocheartifacts from Loma Negra,[8] it is clear that the visual juxtapositionof silver and gold was highly significant to the Moche.
Concerning the junction between the two metals, this point isdiscussed by D. Schorsch, who identified three different methodsas follows: (1) mechanical joining, (2) mechanical joining but withCu-gilded or silvered, and (3) adhesive joining methods.
The radiographic images show that adhesive joining (possiblyusing natural resins) and soldering were employed by the Mocheto produce gold–silver nose decorations. The solder should be,therefore, an alloy composed of one or more of the three metals,with high probability a silver alloy.
X-Ray Spectrom. (2016) Copyright © 2016 John Wiley &
Copper-gold tumbaga
Poor Au-alloys enriched at the surface by depletion gilding (calledby the Hyspanic ‘tumbaga’) are very common in pre-Columbiancultures, even if a few examples are also found in other ancientcultures. ‘Tumbaga’ gold was differentiated from a gold alloy fromthe altered Cu(Kα/Kβ) and Au(Lα/Lβ)-ratios. Concerning the pres-ence of tumbaga in the Moche culture, the following may beobserved from the analyzed objects.
Only five objects from the tomb of the Lady of Cao aresupposed to be on tumbaga (Table 7), according to the ratio(Au-Lα/ Cu-Kα) ~ 1. A mean equivalent gilding thickness of about3.4μm was determined, and a Au-concentration of about 82%.
Artifacts on gilded copper
Twenty-five objects from the tomb of the Lady of Cao are on gildedcopper and are generally well preserved because of the very dryatmosphere in the tomb.
Table 6 shows the results of the 27 objects on gilded copper fromthe tomb of the Lady of Cao. Supposing that Cu is absent in the
Sons, Ltd. wileyonlinelibrary.com/journal/xrs

Table 6. Gold thickness and approximate composition* for 27 gildedcopper objects from the tomb of the Lady of Cao
Object PACEB-F4-N. d(μm) Au(%) Ag(%)
Pendant 00037 0.7 89 11
Pendant 00045 0.85 82 18
Pendant 00052 1.3 93 7
Pendant 00053 1.3 93.5 6.5
Diadem 00064 0.5 91 9
Diadem 00065 0.68 88 12
Diadem 00066 0.38 90 10
Diadem 00067 0.37 86 14
Crown 00068 0.85 89 11
Crown 00069 0.45 82 18
Crown 00070 0.7 89 11
Dish 00072 1.15 92 8
Dish 00073 0.9 90.5 9.5
Pendant 00099 0.3 100 0
Pendant 00101 1.1 57 43
Spear I1-00002 0.3 100 0
Spear I1-00003 0.5 100 0
Spear I1-00004 0.4 100 0
Spear I1-00005 0.4 100 0
Spear I1-00006 0.4 100 0
Spear I1-00007 0.5 100 0
Spear I1-00008 0.8 100 0
Spear I1-00009 0.95 88 12
Stick I1-00010 0.45 78–95.5 14 (4.5–22)
Stick I1-00011 0.43 88 12 (8.5–17)
Tissue with sheets
PACEB-H1-00014
0.5 86 14
Tissue with sheets
PACEB-H1-00015
0.55 88 12
Mean value 0.65 ± 0.3μm 88** 12
* the composition was calculated in the hypothesis of absence ofcopper in the gilding.
** excluding the spears, which were analyzed with a Si-PIN detector
having low efficiency for Ag.
Figure 27. Necklace PACEB-F4-00088 with 12 big heads on tumbaga.
Table 7. Gold thickness and ‘equivalent gilding’composition for thefive tumbaga objects
PACEB-F4-N. d(μm) Au(%) Ag(%) Cu(%)
35- ear ring 5.5 ± 1.0 65 15 20
36- ear ring 5.5 ± 1.0 65.5 15.5 20
46- pendant 6.0 ± 1.5 63.5 14.5 22
47- pendant 6.0 ± 1.0 64.5 14.5 21
88-necklace 6.0 ± 1.0 70 12.5 17.5
Mean value 5.7 ± 1.0 65.5 ± 2.5 14.5 ± 1.0 20 ± 1.5
R. Cesareo et al.
wileyonlinelibrary.com/journal/xrs Copyright © 2
gilding, a mean gilding thickness of about 0.6μm was measured,and a gold concentration of about 92%.
A clear comparison with other Moche artifacts on gilded copper isdifficult, because of the very poor preservation of these other artifacts.However, in the few cases where this comparison is possible, theresults are not very different from those of the ‘Lady of Cao’ artifacts.
Trace elements
With regard to detection of trace elements, it should be observedthat EDXRF in the employed portable version is not able to detecttrace element with atomic number Z< 18. Further, it may be ob-served that gold alloys are relatively free from trace elements, withthe exception of Fe and Zn (this last element only in Sipán gold), whilein silver alloys and in copper, they are present trace elements such asFe, Ni, Zn, As, Br, and Pb. More specifically, the following may be ob-served.Iron, – this element is often present in the Moche alloys andwas detected in many artifacts from the tomb of the Lady of Cao(Table 4).; Zinc, – this element is often present in Sipán alloys but onlyin one case, it was detected in artifacts from the tomb of the Lady ofCao.; Arsenic, – this element was never detected before the period ofthe Moche culture. It was detected sometimes in silver from the tombof the Lady of Cao (Table 4). The following the literature is typicallypresent in ancient copper objects, sometimes at levels higher than4–5% (arsenical bronze).[65]; Mercury, – among the Cao artifacts, this el-ement was only clearly detected in the silver area n.1 of artifact PACEB-F4-0004 .; Lead, – lead, which is a relatively common element in silveralloys, was detected at level of traces in many silver objects from Cao(Table 4).; Platinum, – this element, systematically detected in pre-Columbian gold from Equador (63), is difficult to detect and identifyby EDXRF-analysis because its L-lines are close to those of Au. Onlyan enlargement of Au-Lβmaybe expected for Pt-concentrations lowerthan 5% approximately, and this enlargement was never observed.
Acknowledgements
This work was partially supported by the Consiglio Nazionaledelle Ricerche first, in the framework of the Progetto Finalizzato ‘BeniCulturali’ and then, by the bilateral project between the ConsiglioNazionale delle Ricerche and Consejo Nacional de Ciencia, Tecnologiae Innovacion Tecnologica of Perù (CNR-CONCYTEC, 2009–2011).
The ‘Fundacion Wiese’ is acknowledged for permitting toanalyze the artifacts from the tomb of the Lady of Cao and forencouraging this research.
Dr Stefano Ridolfi is acknowledged for providing several ‘Tarì’standard samples of gold alloys, and for useful discussions.
J. Fabian expresses their gratitude to the International Centrefor Theoretical Physics Abdus Salam, for a 5-month grant at theUniversity of Sassari.
Lorenzo Manetti, of the firm ‘Giusto Manetti’, Florence, Italy, isacknowledged for providing standard gold samples.
016 John Wiley & Sons, Ltd. X-Ray Spectrom. (2016)
EDXRF, X-ray transmission, radiography, Au, and Ag, tomb lady of Cao
Luciano Mastrolorenzi, distinguished sculptor and goldsmith, isacknowledged for many discussions about Moche metallurgy andfor preparing gold and silver samples of Moche imitation.
Prof. Emma Angelini and Dr Sabina Grassini from the Polytech-nic of Turin are acknowledged for preparing samples of gildedcopper with calibrated Au-thickness.
Renato Pereira de Freitas from COPPE, Universidade Federal doRio de Janeiro, Rio de Janeiro, Brasil, contributed with measurements.
Marcia Rizzutto, Instituto de Fisica, Universidade de São Paulo,SP, Brasil, contributed with measurements and suggestions.
Fabio Lopes Instituto de Fisica, Universidade de Londrina, PA,Brasil, contributed with measurements.
References[1] W. Alva, SIPAN, Descrubrimiento y Investigation, Quebecor World Perù S.
A, Lima, 2004.[2] W. Alva, C. B. Donnan, The Royal Tomb of Sipán, Los Angeles Fowler
Museum of Cultural history, University of California, Los Angeles, 1993.[3] R. Franco Jordan, in Señores de los Reinos de la Luna, (Ed: K Makowski),
Banco de Crédito del Perù, Lima, 2008, pp. 280–287.[4] R. Franco Jordan, Los Secretos de la Huaca Cao Viejo, Fundacion Wiese y
Petrolera Transoceanica S.A., Lima, 2009.[5] R. Franco Jordan, Pour la Science, Paris, France, 2010 8, pp. 390.[6] R. Franco Jordan, La Dama de Cao, in Investigacion y Ciencia, Bercelona,
Spain, 2011, pp. 68–74.[7] H. Lechtman. American Antiquity 1998, 47(1), 3.[8] D. Schorsch. Metropolitan Museum Journal 1998, 33, 109.[9] G. Hőrz, G. And, M. Kallfass. JOM 1998, 50, 8.[10] G. Hőrz, M. Kallfass. Mater Charact 2000, 45, 391.[11] A. Galli, L. Bonizzoni, E. Sibilia,M.Martini.X-Ray Spectrometry2011, 40(2), 74.[12] H. Lechtman. Sci. Am. 1984, 250, 38.[13] J. L. Ruvalcaba Sil, X-Rays for Archaeology, Springer Netherlands,
Amsterdam, 2001, pp. 123–149.[14] W. Bray, Techniques of gilding and surface enrichment in pre-Hispanic
American metallurgy in Metal Plating and Platination, (Eds: S. La Niece,P. Craddock), Butterworth-Heinemann, 1993, pp. 182–192.
[15] D. A. Scott, A review of gilding techniques in ancient South America inGilded Metals: History, Technology and Conservation, (Eds: T. Drayman-Weisser) Archetype Publ, London 2000, pp. 203–222.
[16] E. Andrade, A. Romero Nunez, A. Ibarra Palos, J. Cruz, M. F. Rocha,C. Solis. Nuclear Instrum Methods in Phys. Res. B 2005, 240, 570.
[17] R. Cesareo, C. Calza, M. Dos Anjos, R. T. Lopes, A. Bustamante, J. Fabian,W. Alva, L. Chero. Appl. Radiat. Isot. 2010, 68, 525.
[18] S. La Niece. Ur. Iraq 1995, 57, 41.[19] C. Fraresso. Boletín del Instituto de Estudios Franceses 2010, 39-2, 351.[20] J. C. Tello. American Antiquity 1943, 9(1), 135.[21] R. L. Burger, Chavin and the origins of Andean Civilization, Thames and
Hudson, New York, 1992.[22] R. L. Burger, Chavin deHuantar and its sphere of influence, inHandbook
of South American Archeology, (Eds: H. Silverman, W. Isbell), Springer,New York, 2008, pp. 681–706.
[23] J. Merkel, I. Shimada, C. P. Swann, R. Doonan, Pre-Hispanic copper alloyproduction at Batan Grande, Peru: interpretation of the analytical datafor ore samples, in Archaeometry of pre Columbian Sites and Artefacts,(Eds: D. A. Scott, P. Meyers), The Getty Conservation Institute, SantaMonica, 1994, pp. 199–227.
[24] C. B. Donnan, Moche art of Peru. Pre-Columbian symboliccommunication, Fowler Museum of Cultural History, University ofCalifornia, Los Angeles, 1978.
[25] H. Lechtman. Technol. Cult. 1984, 25, 1.[26] H. Lechtman, Traditions and styles in central Andean metalworking, in
The Beginning of the use of the Metals and Alloys, (Ed: R. Maddin), MITPress, Cambridge, MA, 1988, pp. 344–378.
[27] J. Jones, Mochica works of art in metal: a review, in Pre-Columbianmetallurgy of South America, (Ed: E. P. Benson), Dumbarton OaksResearch Library and Collections, Trustees for Harvard University,Washington DC, 1979, pp. 53–104.
[28] H. Lechtman. J. Field Archaeol. 1991, 18, 45.[29] P. C. Muro, I. Shimada, Behind the golden mask. Sican gold artifacts
from Batan Grande, Peru in The Art of Pre-Columbian gold. The Jan
X-Ray Spectrom. (2016) Copyright © 2016 John Wiley &
Mitchel Collection, (Ed: J. Jones), Weidenfeld and Nicolson, London,1985, pp. 61–67.
[30] W. Alva. Nat. Geosci. 1988, 174, 550.[31] W. Alva, M. Fecht, P. Schauer, M. Tellenbach, Das Fürstengrab von Sipan,
Entdeckung und Restaurierung, Verlag des Römisch-GermanischenZentralmuseums, Mainz, Germany, 1989.
[32] H. Lechtman. J. Appl. Meteorol. 1979, 31, 154.[33] H. Lechtman. Sci. Am. 1984, 250, 38.[34] Y. Hirao, J. Ohnishi, Y. Onuki, Y. Kato. Chemical composition of samples
excavated from Kuntur Wasi archaeological site, Peru. Archaeology andNatural Science 1992, 25, 13–30 in Y. Onuki and K. Inokuchi: El Tesorodel temple de Kuntur Wasi; Fondo Editorial del Congreso del Peru;Quadgraphics Peru: Lima 2011.
[35] S. Schlosser, A. Kovacs, E. Pernicka, D. Günther, M. Tellenbach.Fingerprints in gold in New Technologies MultidisciplinaryInvestigations in Palpa and Nasca, Peru, (Eds: M. Reindel, G. A.Wagner), Springer Verlag, Berlin, Heidelberg, 2009.
[36] S. Izumi, The Late Prehispanic Coasted States in the Inca World. TheDevelopment of pre-Columbian Peru, (Ed: L. Laurencich Minelli),Norman University of Oklahoma Press, Oklahoma City, 2000, pp. 49–82.
[37] Nickle Arts Museum, Ancient Peru Unearthed Golden Treasures of a LostCivilization, The Nickle Arts Museum, Calgary, 2006.
[38] AMPTEK Inc., 6 De Angelo Drive, Bedford, MA 01730-2204, USA.[39] R. Cesareo, A. Brunetti, A. Castellano, M. A. Rosales, Portable equipment
for X-ray fluorescence analysis, in X-ray Spectrometry: RecentTechnological Advances, (Eds: K. Tsuji, J. Injuk, R. Van Grieken), J. Wiley& Sons, Chichester, UK, 2004, pp. 307–341
[40] R. Cesareo, X-ray physics in La Rivista del Nuovo Cimento, Ed.Compositori, Bologna, Italy, 2000.
[41] A. Markowicz, X-ray physics in Handbook on X-ray Spectrometry:Methods and Techniques, (Eds: R. Van Grieken, A. Markowicz), M.Dekker Inc, New York, Basel, Hong Kong, 1992, Chapter 1.
[42] R. Cesareo, A. Brunetti. J. X-Ray Sci. and Techn. 2008, 16(2), 119.[43] B. Ertugral, G. Apayadin, U. Çevik, M. Ertugrul, Al. Kobya. Radiation Phys.
And Chem. 2007, 76, 15.[44] W. T. Elam, B. D. Ravel, J. R. Sieber. Rad. Phys. And Chem. 2002, 63, 121.[45] T. Trojek, J. Wegrzynek. Nucl. Instrum. Methods 2009, A619, 311.[46] C. Neelmijer, I. Brissaud, T. Calligaro, G. Demortier, A. Hautjärvi, M. Mäder,
M. Schreiner, T. Truernala, G. Weber. X-ray Spectrometry 2000, 29, 101.[47] J. H. Hubbell, W. J. Veigele, E. A. Briggs, R. T. Brown, D. T. Cromer,
R. J. Howerton. J. Phys. Chem. Ref. Data 1975, 4, 471.[48] C. Fiorini, M. Gianoncelli, A. Longoni, F. Zaraga. X-Ray Spectrometry
2002, 31, 92.[49] R. Cesareo. Nucl. Instrum. Methods in Phys. Res. 2003, B211, 133.[50] R. Cesareo, M. A. Rizzutto, A. Brunetti. Nucl. Instrum. Methods 2009 B,
267, 2890.[51] N. Ekinci, E. Baydas, Y. Sahin. Instrum. Sci. Technol. 1999, 27, 181.[52] M. Ferretti, C. Polese, C. RoldánGarcia. Spectrochemica Acta 2013 Part B,
83–84, 21.[53] A. C. Sparavigna, Depletion and Enrichment of an Alloy Surface;
Archaeogate 2013.[54] S. La Niece, M. Cowell, Crimean Metalworking; Analysis and Technical
Examination in the Berthier-Delagarde Collection of CrimeanJewellery in the British Museum, pp. 151–160.
[55] N. Foster, P. Grave, N. Vikery, L. Kealhofer. X-ray Spectrom. 2011, 40, 389.[56] D. A. Scott. Studies in Conservation 1983, 28, 194.[57] E. S. Blakelock. Archaeometry 2015 online version. 5 October 2015.[58] M. Ferretti. J. Anal. At. Spectrom. 2014, 29, 1753.[59] U. Bottigli, A. Brunetti, B. Golosio, P. Oliva, S. Stumbo, L. Vincze,
P. Randaccio, P. Bleuet, A. Simionovici, A. Somogyi. Spectroch. Acta2004 B, 59, 1747.
[60] R. Cesareo. X-ray Spectrometry 2014, 43, 312.[61] R. Cesareo. Work in Preparation 2015.[62] R. Cesareo, A. Bustamante, J. Fabian, S. del Pilar Zambrano Alva,
R. Franco, A. Fernandez, G. Gigante.Archeomatica settembre 2015, 6–10.[63] R. Cesareo, A. Bustamante, J. Fabian, Z. Sandra del Pilar, C. Calza,
M. dos Anjos, R. T. Lopes, W. Alva, L. Chero, M. C. Espinoza Cordoba,R. G. Vasquez, R. R. Ruiz,M. S. Fernandez. Appl. Rad. Isotopes 2010, 68, 525.
[64] R. Cesareo, A. Bustamante, J. Fabian, S. del Pilar Zambrano, C. Calza,M. dos Anjos, R. T. Lopes, W. Alva, L. Chero, M. C. Espinoza Cordoba,R. G. Vasquez, R. R. Ruiz, M. S. Fernandez. X-ray Spectrometry2011, 40, 37.
[65] E. R. Caley, Analysis of ancient metals, Pergamon Press, Oxford, London,New York, 1964.
[66] Geochemical Exploration 1976, (Eds: C. R. M. Butt, I. G. P. Wilding),Elsevier Sci. Publ. Co., Amsterdam, 1977.
Sons, Ltd. wileyonlinelibrary.com/journal/xrs