analysis of trends in art history publishing from ... of trends in . art history publishing from ......
TRANSCRIPT
Analysis of Trends in Art History Publishing from University Presses
A Report to The Samuel H. Kress Foundation
Henry Pisciotta, Arts and Architecture Librarian, Penn State UniversityJames Frost, Statistical Technical Communications Specialist, Minitab, Inc.
June 15, 2010

2
Copyright Information:This work is licensed under a Creative Commons Attribution 3.0 Unported License. Copyright is retained by the Author(s). http://creativecommons.org/licenses/by/3.0/
3Table of Contents
Introduction 4
1. Summary of Findings 4
2. Process 72.1 Data Extraction 72.2 Defining Unique Records 92.3 Coding 9
2.3.1 Coding Media 92.3.2 Coding Geography 102.3.3 Coding Dates 102.3.4 Coding Stokstad Categories 11
2.4 Elimination of Insufficient Data 13 3. Data Analysis 133.1 Identifying Trends with this Dataset 133.2 Media 143.3 Continents 153.4 Stokstad Categories 183.5 Date Ranges 223.6 Understanding the Trends 26
4. Comparison to Trade and Museum Publishing 274.1 Qualitative Assessment 27
Table of Contents

4Introduction
IntroductionHow has the study of the history of art and architecture changed in recent years? Have some specialties flourishes and others withered? Quantitative answers to these questions might take many forms (courses offered, dissertations written, articles published, etc.) This study began with the intention of providing a partial answer, insofar as the book production of university presses might be one potential view of trends in the scholarship of art and art history. This study concentrated on that one measure: the publication of books on art and architecture by university presses and how they have changed over a 17-year period. While it is arguable that university press books may not provide the best view of outputs of art historical research, those publications do have the merit of being easily accounted for by available data sets. Records for these were extracted from the database of a major vendor of academic books: YBP Library Services. The topic of each book was categorized by geographic, chronological, and cultural aspects. The results provide an overview of production from the years 1991 through 2007. The procedures used in this study, as well as the detailed results, are described in sections 2, 3, and 4 of this document. Section 1, Summary of Findings, discusses the most significant results of this work (and may be the only portion needed for many readers.) The Summary refers to specific illustrations in sections 2,3, and 4.
1. Summary Of FindingsGeneral increases. Overall, the dataset used in this study suggested a substantial and fairly steady annual increase in the production of art and architecture books by university presses during the period 1991 through 2007. (See Illus. 3) This finding was supported by other sources of data, such as the statistics reported by the Bowker Annual of Library and Book Trade Information. (The university press data we used increased annually at an average of more than 5%. The Bowker data for art and architecture, which includes all types of publishers and editions, grew at an average of nearly 17% per anum.) The period of our study happens to correspond to the broad cultural discussion of “the death of the book,” but, judging simply from the rate of production, the art book does not seem to be going quietly. A boom in contemporary topics. The most clearly pronounced feature of the university press data was a steady increase in art and architecture topics from the post-war era (1945 to the present.) This result appeared in multiple measures. (See Illus. 12 and 20) We can only speculate about the reasons for this dynamic.
• Isthisasymptomofincreasinginterestinartcriticismasanacademicpursuit?
• Isthistrendasnapshotofsomesortofgenerational,rollingpeakofinterestin the recent past?
• Ifstudyofalivingartistismorelikelytobeembodiedinanexhibitioncatalogue than study of, say, a 15th-century artist, then have increasing collaborations between art museums and university presses meant more contemporary topics?
51. Summary Of Findings
• Perhapsalloftheseexplanations(andothers)arefactors.
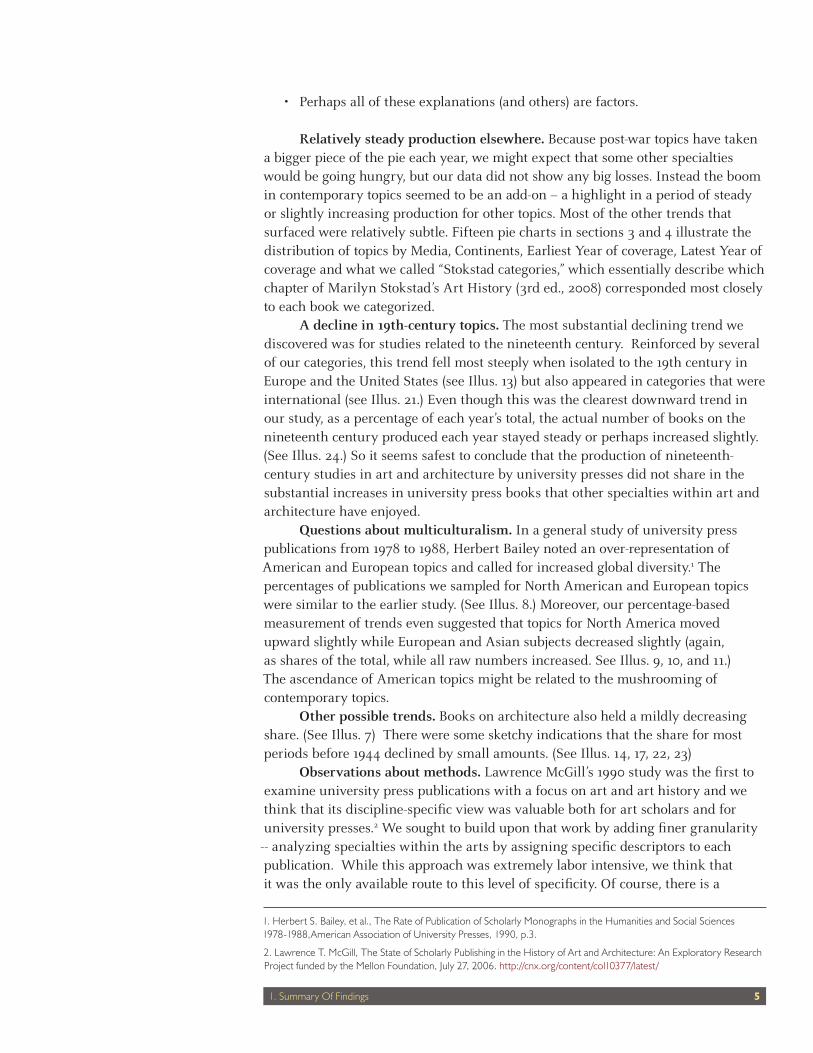
Relatively steady production elsewhere. Because post-war topics have taken a bigger piece of the pie each year, we might expect that some other specialties would be going hungry, but our data did not show any big losses. Instead the boom in contemporary topics seemed to be an add-on – a highlight in a period of steady or slightly increasing production for other topics. Most of the other trends that surfaced were relatively subtle. Fifteen pie charts in sections 3 and 4 illustrate the distribution of topics by Media, Continents, Earliest Year of coverage, Latest Year of coverage and what we called “Stokstad categories,” which essentially describe which chapter of Marilyn Stokstad’s Art History (3rd ed., 2008) corresponded most closely to each book we categorized. A decline in 19th-century topics. The most substantial declining trend we discovered was for studies related to the nineteenth century. Reinforced by several of our categories, this trend fell most steeply when isolated to the 19th century in Europe and the United States (see Illus. 13) but also appeared in categories that were international (see Illus. 21.) Even though this was the clearest downward trend in our study, as a percentage of each year’s total, the actual number of books on the nineteenth century produced each year stayed steady or perhaps increased slightly. (See Illus. 24.) So it seems safest to conclude that the production of nineteenth-century studies in art and architecture by university presses did not share in the substantial increases in university press books that other specialties within art and architecture have enjoyed. Questions about multiculturalism. In a general study of university press publications from 1978 to 1988, Herbert Bailey noted an over-representation of American and European topics and called for increased global diversity.1 The percentages of publications we sampled for North American and European topics were similar to the earlier study. (See Illus. 8.) Moreover, our percentage-based measurement of trends even suggested that topics for North America moved upward slightly while European and Asian subjects decreased slightly (again, as shares of the total, while all raw numbers increased. See Illus. 9, 10, and 11.) The ascendance of American topics might be related to the mushrooming of contemporary topics. Other possible trends. Books on architecture also held a mildly decreasing share. (See Illus. 7) There were some sketchy indications that the share for most periods before 1944 declined by small amounts. (See Illus. 14, 17, 22, 23) Observations about methods. Lawrence McGill’s 1990 study was the first to examine university press publications with a focus on art and art history and we think that its discipline-specific view was valuable both for art scholars and for university presses.2 We sought to build upon that work by adding finer granularity -- analyzing specialties within the arts by assigning specific descriptors to each publication. While this approach was extremely labor intensive, we think that it was the only available route to this level of specificity. Of course, there is a
1. Herbert S. Bailey, et al., The Rate of Publication of Scholarly Monographs in the Humanities and Social Sciences 1978-1988,American Association of University Presses, 1990, p.3.
2. Lawrence T. McGill, The State of Scholarly Publishing in the History of Art and Architecture: An Exploratory Research Project funded by the Mellon Foundation, July 27, 2006. http://cnx.org/content/col10377/latest/
61. Summary Of Findings
potential problem when sorting cases into lots of detailed categories. It is possible to fracture the data into so many groups that the numbers are too small to use for statistical analyses. While the simple solution is to combine compatible small groups into larger ones, this form of analysis can only identify the biggest lumps in a very complex and intriguing stew. The choice of data sources is critical for any attempt at statistical analysis of book production. The three most likely choices for us were Bowker’s Books In Print database, YBP’s GOBI, and the OCLC union catalogue. We chose GOBI because it offered a familiar and fairly well-defined boundary to art and architecture (the Library of Congress Classification), because it offered a sophisticated approach to handling variant editions, and because highly knowledgeable advice was generously provided by YBP’s Principal Bibliographer. But the data, obviously created for purposes completely different from ours, limited our study to a very brief time span (1991 to 2007) and did not support our investigation of trade publishers in the same thorough manner that it supported study of university presses. Next Steps. We are scheduled to present this research as a poster session for the 2011 Annual Conference of the College Art Association and as a talk at Library Research Seminar V: Integrating Practice and Research at the University of Maryland. After having gathered wisdom from these interactions, we wish to rewrite this research into appropriate form for journal publication. That revision will address the existing literature on recent art publishing and on assessment of university press production (writings that we did gather, read, and consider but have not addressed formally.) Thanks. We wish to thank each of the advisors who have been very generous with their expertise at some point during the design and execution of this research: Francoise Crowell, Director, Collection Management and Principal Bibliographer, YBP Library Services
Eleanor Goodman, Executive Editor, Penn State Press
Barbara Polowy, Head of the Hillyer Art Library, Smith College
Lawrence T. McGill, Senior Vice President, Research, Foundation Center
Leo Mazow, Curator of American Art, Palmer Museum of Art, Penn State University Extra thanks are reserved for Francois Crowell for wizardry with YBP’s GOBI database and Katherine Staab, a PhD candidate in Art History at Penn State, who exercised her formidable knowledge of art history in categorizing thousands of books. Kress Foundation President Max Marmor’s initial idea for such a study (which we distorted to the point where he probably does not recognize it) was impelling. His patience, and that of Administrative Officer Lisa Schermerhorn, has been impressive.

72. Process
2. Process
2.1. Data Extraction
On August 27, 2008, records were extracted from YBP’s GOBI database for all university press publications in the database that had been assigned the major Library of Congress Classification categories for the visual arts (N through NX and TR):
Illustration 1: Downloaded Data by Library of Congress ClassificationLC Class Publications
N Art in more than one medium 2,552
NA Architecture 1,305
NB Sculpture 352
NC Graphic arts 261
ND Painting 1,582
NE Prints 182
NK Design 767
NX The arts in general 551
TR Photography 638
Total 8,190
This yielded 8,190 database records. Most of these were for publications produced by university presses in the United States, but other countries were also represented in the data:
Illustration 2: Downloaded Data by Country of PublisherCountry Publications Country Publications
US 5,612 68.7% Singapore 6
UK 1,160 14.2% Thailand 6
[blank] 616 7.5% Belgium 5
Canada 258 3.2% Africa 4
Other 120 1.5% France 4
Australia 117 1.4% Pakistan 4
Netherlands 112 1.4% Switzerland 4
Hong Kong 32 0.4% Philippines 3
India 29 0.4% Puerto Rico 3
Egypt 17 Spain 3
New Zealand 17 China 2
Germany 13 Greece 2
Japan 8 Hungary 1
Denmark 6 Jamaica 1
Ireland 6 Total 8,171
The 8,190 publication dates spanned the years 1985 through 2009. Clearly, the database was limited to a smaller number of imprints and publications for the

82. Process
1980s. However, during the 1990s the coverage was more extensive. The 8,190 publications were the products of 200 imprints (some publishers are recorded with more than one imprint in the GOBI database.)
Illustration 3: Downloaded Data by Publication Year
The 10 most productive imprints were responsible for 53% of the publications. The average publications per imprint was 41. (Median = 7, top quartile =29.)
Publications Imprints
1978 1
1981 1
1982 1
1983 1
1985 3
1986 20 14
1987 17 14
1988 26 15
1989 42 19
1990 83 31
1991 284 59
1992 342 74
1993 359 78
1994 379 75
1995 425 85
Publications Imprints
1996 391 77
1997 490 79
1998 446 77
1999 477 90
2000 515 91
2001 466 78
2002 487 87
2003 464 90
2004 502 92
2005 507 92
2006 577 102
2007 602 88
2008 280 73
2009 2 2
8190 200
92. Process
2.2. Defining Unique Records
During the coding of the university press data, certain records for multiple-volume works were removed from the data set.3 Thirty-two of these records were removed, leaving 8,158 records in the dataset. Paperback editions issued in the same year as hardbound editions were eliminated by the technique used in the initial download from YBP’s GOBI database. However, editions with different publication years (whether hardbound or paperback) were counted as separate publications.
2.3. Coding
To prepare the data for analysis, the topics of books were categorized by:
• Media• Geography• EarliestYear(ofcoverage–expressednumerically)• LatestYear(ofcoverage)• StokstadCategory(adaptedfromMarilynStokstad,ArtHistory,3rded.,
2008.
In each case, the intent was to pigeon hole the main thrust of the book, not to detail its contents. Thus a book of Early Modern art that makes frequent reference to works from Classical Antiquity would simply have been coded as a study of Early Modern art. The data were coded in 3 phases. The first pass consisted of mechanical operations, conducted by library workers with no special knowledge of art or publishing. The second pass was conducted by an accomplished graduate student in art history and focused on situations requiring recognition of periods, styles, artists’ names, etc. The third pass was executed by the Project Coordinator and focused upon decisions that required further research or decisions regarding coding consistency. 2.3.1. Coding Media
One of the following was assigned, where feasible, in the Medium category:
ARCH = ArchitectureFA = Fine Arts (painting, sculpture, drawing, photography, installation, video, etc.)DA = Decorative Arts (graphic design, industrial design, ceramics, metalwork, furniture, interior decoration, etc.)
3. Generally, the GOBI database contains a single record for a multi-volume publication. But two exceptions occur. When volumes of a set have multiple release dates, typically over several years, separate records are created in GOBI. Also, separate records appear for some technical reasons, often volumes containing supplementary media such as CD-ROM. Records of the first type were retained and coded for analysis, since they tended to record highly significant scholarly efforts. Records of the second type were consolidated into a single title for coding and analysis. (For example, volumes 2 through 5 of The Selected Papers of Charles Willson Peale and His Family, published in 1988, 1991, 1996, and 2000, counted as 4 items. The 2 volume Sculpture of Jacopo Sansovino published in 1991 counted as one item.)
102. Process
MM = More than one of the above
First, titles of books were consulted for this information. Then the GOBI “Subject Added Entry” was used, when they were sufficiently specific. (No attempt was made to force the word “art” as it was used in GOBI’s Subject Added Entry into our categories.) During the second and third passes, Medium was often assigned based upon common knowledge of the field – that the Pantheon, for example, is primarily an architectural work -- or based upon an authoritative source such as Oxford Art Online, the book’s table of contents, or a publisher’s description.
All records (100%) were assigned a code for Media.
2.3.2. Coding Geography
When appropriate, the topic of each book was categorized by Continent and further by Nation. The hierarchy and forms in the Thesaurus of Geographic Names was used to provide consistency in the geographic coding. Although continents were sometimes coded without a value in the Nation column, the Nation column was never completed without the appropriate value in the Continent column. Books covering more than one continent were not assigned a value for Continent, nor were general works of theory, practice, etc. As with other coding, book titles that clearly indicated the geographic focus of the book were the first source consulted. GOBI’s “Geographic Interest: Region” field was also consulted. As with other aspects of coding, a general knowledge of art history, Oxford Art Online, tables of contents, and publisher’s descriptions often clarified the geographic scope of a book in the second or third pass. A value for Continent was assigned to 6,828 (84%) of the records and for Nation to 6,289 (77%.) Nations were not used in analyzing the data because too few of the categories were sufficiently populated.
2.3.3. Coding Dates
If the title contained a span of dates, the earliest year mentioned was recorded in the Earliest Year column on a spreadsheet and the latest year in the Latest Year column. If the book focused on a single year, that same year was recorded in both of these columns. If the book was about a single artist and a span of dates for the artist’s life could be found, these years were used as the Earliest Year and Latest Year for the coverage of the book. In the second pass of coding, dates were added that required more interpretation. For example, an introductory book on German Expressionism was assigned the dates of 1905 through 1920 since these were the dates this movement flourished according to the encyclopedia article in Oxford Art Online. The sources for these date ranges were usually Oxford Art Online or Stokstad’s Art History. In the third pass of coding, online tables of contents or publishers descriptions of books were often consulted to help understand the chronological scope of a book. Sometimes broad estimates of the scope of a book were made based upon the maximum potential scope of the topic. For example, a general
112. Process
history of photography was estimated as 1839 through the present – a typical scope for the topic even though the specific book could have focused upon a much more specific time period. When the above techniques failed to yeild a date range for a book, the Stokstad chapter assigned for the book (see below, 2.3.4. Coding Stokstad Categories) was used as an approximation of the historical scope of the book. For all books with coverage of very recent years, the publication date of the book was used for the Latest Year. Values for Earliest and Latest Year were assigned to 7,027 (86%) of the records. These techniques for assigning dates of coverage tended frequently to exaggerate the scope of books – assigning broader date ranges than a careful reading of the book might have yielded. This was thought to be acceptable because only broad chronological groupings were used the analysis and feasible because estimates could be made rapidly during the coding. While this approach was generally constructive, it led to difficulties in analyzing Latest Year dates, especially those from 1991 to 2007. The problem is discussed below in 3.8 Date Ranges.
2.3.4. Coding Stokstad Categories
In the second and third passes of coding an effort was made to assign a comparable chapter of Stokstad’s, Art History. This was essentially a process of answering the hypothetical question “If this topic had been included in Stokstad’s Art History, in what chapter would it most likely have appeared?” However, some alterations were made in the list of Stokstad chapters. First, a “general” category was added for works of theory, practice, methodology, pedagogy, etc. Many Stokstad chapters cover a culture’s art from some historic period through to the present (for example “Chinese and Korean after 1279.”). However, in the study of very recent art, an increasing globalization is generally recognized as an important characteristic of the subject. Also, at an entirely practical level, use of Stokstad’s chapter breakdown would have masked the tendency for publication in contemporary art to be a significantly different area of scholarship and criticism than that of earlier eras. For these reasons, two categories were added that overrode Stokstad chapters in our coding:
• ModernArtinEuropeandtheAmericas,1900-1945(coded201)• TheInternationalSceneSince1945(coded202)
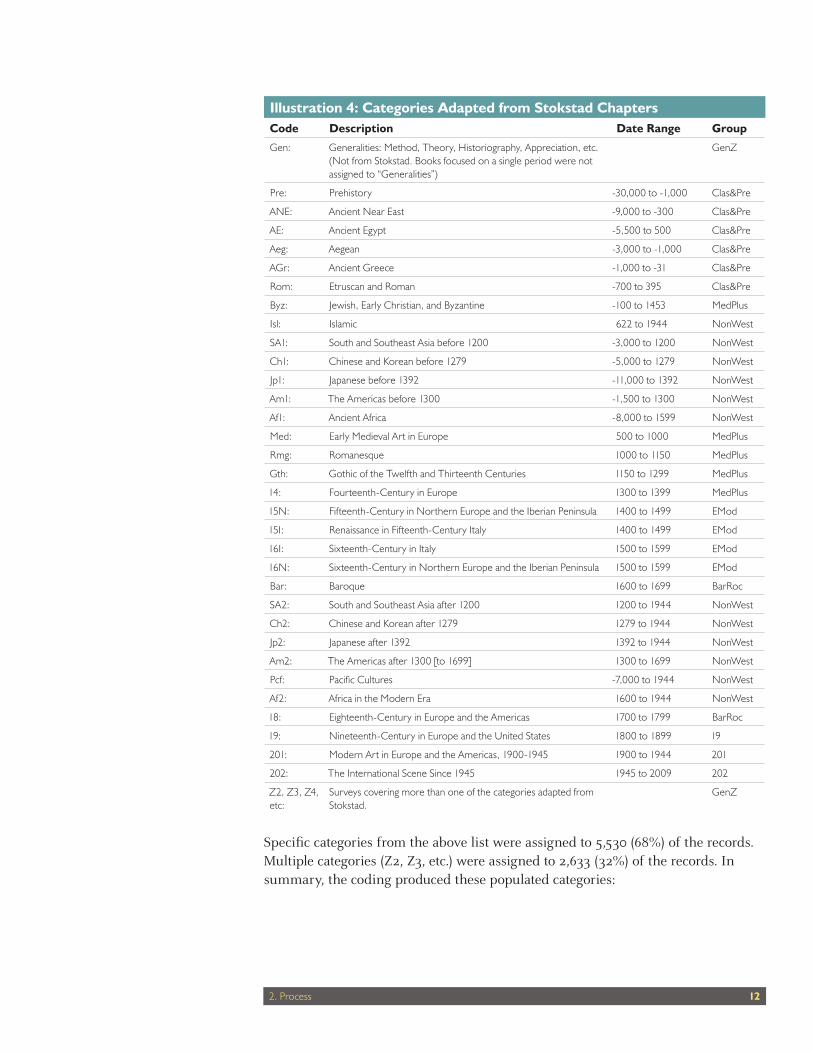
The Illustration 4 lists the Stokstad categories that were used along with the date ranges that were sometimes used for Earliest and Latest Year when no other chronological scope information was available. During analysis of the data, the Stokstad categories were grouped to build larger populations. These groupings are also listed in the table.
122. Process
Illustration 4: Categories Adapted from Stokstad ChaptersCode Description Date Range Group
Gen: Generalities: Method, Theory, Historiography, Appreciation, etc. (Not from Stokstad. Books focused on a single period were not assigned to “Generalities”)
GenZ
Pre: Prehistory -30,000 to -1,000 Clas&Pre
ANE: Ancient Near East -9,000 to -300 Clas&Pre
AE: Ancient Egypt -5,500 to 500 Clas&Pre
Aeg: Aegean -3,000 to -1,000 Clas&Pre
AGr: Ancient Greece -1,000 to -31 Clas&Pre
Rom: Etruscan and Roman -700 to 395 Clas&Pre
Byz: Jewish, Early Christian, and Byzantine -100 to 1453 MedPlus
Isl: Islamic 622 to 1944 NonWest
SA1: South and Southeast Asia before 1200 -3,000 to 1200 NonWest
Ch1: Chinese and Korean before 1279 -5,000 to 1279 NonWest
Jp1: Japanese before 1392 -11,000 to 1392 NonWest
Am1: The Americas before 1300 -1,500 to 1300 NonWest
Af1: Ancient Africa -8,000 to 1599 NonWest
Med: Early Medieval Art in Europe 500 to 1000 MedPlus
Rmg: Romanesque 1000 to 1150 MedPlus
Gth: Gothic of the Twelfth and Thirteenth Centuries 1150 to 1299 MedPlus
14: Fourteenth-Century in Europe 1300 to 1399 MedPlus
15N: Fifteenth-Century in Northern Europe and the Iberian Peninsula 1400 to 1499 EMod
15I: Renaissance in Fifteenth-Century Italy 1400 to 1499 EMod
16I: Sixteenth-Century in Italy 1500 to 1599 EMod
16N: Sixteenth-Century in Northern Europe and the Iberian Peninsula 1500 to 1599 EMod
Bar: Baroque 1600 to 1699 BarRoc
SA2: South and Southeast Asia after 1200 1200 to 1944 NonWest
Ch2: Chinese and Korean after 1279 1279 to 1944 NonWest
Jp2: Japanese after 1392 1392 to 1944 NonWest
Am2: The Americas after 1300 [to 1699] 1300 to 1699 NonWest
Pcf: Pacific Cultures -7,000 to 1944 NonWest
Af2: Africa in the Modern Era 1600 to 1944 NonWest
18: Eighteenth-Century in Europe and the Americas 1700 to 1799 BarRoc
19: Nineteenth-Century in Europe and the United States 1800 to 1899 19
201: Modern Art in Europe and the Americas, 1900-1945 1900 to 1944 201
202: The International Scene Since 1945 1945 to 2009 202
Z2, Z3, Z4, etc:
Surveys covering more than one of the categories adapted from Stokstad.
GenZ
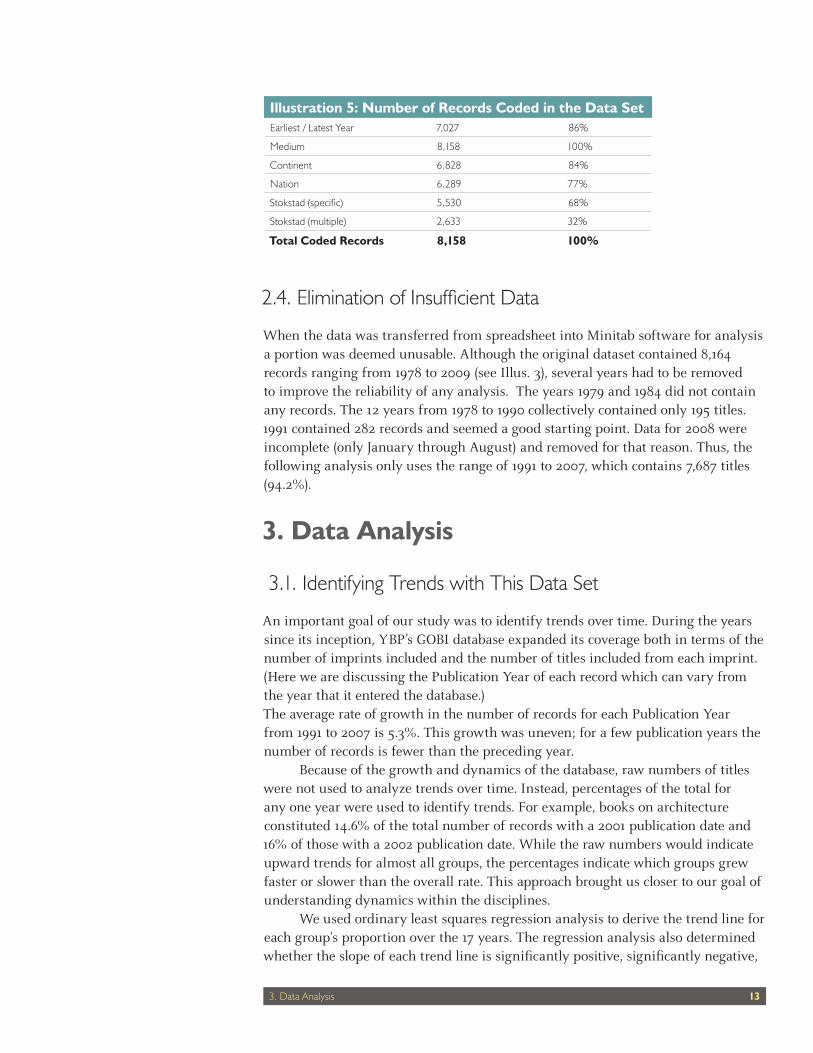
Specific categories from the above list were assigned to 5,530 (68%) of the records. Multiple categories (Z2, Z3, etc.) were assigned to 2,633 (32%) of the records. In summary, the coding produced these populated categories:
133. Data Analysis
Illustration 5: Number of Records Coded in the Data SetEarliest / Latest Year 7,027 86%
Medium 8,158 100%
Continent 6,828 84%
Nation 6,289 77%
Stokstad (specific) 5,530 68%
Stokstad (multiple) 2,633 32%
Total Coded Records 8,158 100%
2.4. Elimination of Insufficient Data
When the data was transferred from spreadsheet into Minitab software for analysis a portion was deemed unusable. Although the original dataset contained 8,164 records ranging from 1978 to 2009 (see Illus. 3), several years had to be removed to improve the reliability of any analysis. The years 1979 and 1984 did not contain any records. The 12 years from 1978 to 1990 collectively contained only 195 titles. 1991 contained 282 records and seemed a good starting point. Data for 2008 were incomplete (only January through August) and removed for that reason. Thus, the following analysis only uses the range of 1991 to 2007, which contains 7,687 titles (94.2%).
3. Data Analysis
3.1. Identifying Trends with This Data Set
An important goal of our study was to identify trends over time. During the years since its inception, YBP’s GOBI database expanded its coverage both in terms of the number of imprints included and the number of titles included from each imprint. (Here we are discussing the Publication Year of each record which can vary from the year that it entered the database.) The average rate of growth in the number of records for each Publication Year from 1991 to 2007 is 5.3%. This growth was uneven; for a few publication years the number of records is fewer than the preceding year. Because of the growth and dynamics of the database, raw numbers of titles were not used to analyze trends over time. Instead, percentages of the total for any one year were used to identify trends. For example, books on architecture constituted 14.6% of the total number of records with a 2001 publication date and 16% of those with a 2002 publication date. While the raw numbers would indicate upward trends for almost all groups, the percentages indicate which groups grew faster or slower than the overall rate. This approach brought us closer to our goal of understanding dynamics within the disciplines. We used ordinary least squares regression analysis to derive the trend line for each group's proportion over the 17 years. The regression analysis also determined whether the slope of each trend line is significantly positive, significantly negative,
143. Data Analysis
or statistically indistinguishable from flat. P-values were calculated for each slope coefficient. For cases where the p-value is greater than 0.05, we assumed that there was not enough evidence to indicate a non-flat trend. For linear trends, the slope coefficient indicates the average increase or decrease for each subsequent year. The r-squared value indicates the percentage of the variance that the trend line accounts for. Higher percentages indicate a tighter fit (less noise) between the trend line and the actual data.
3.2. Media
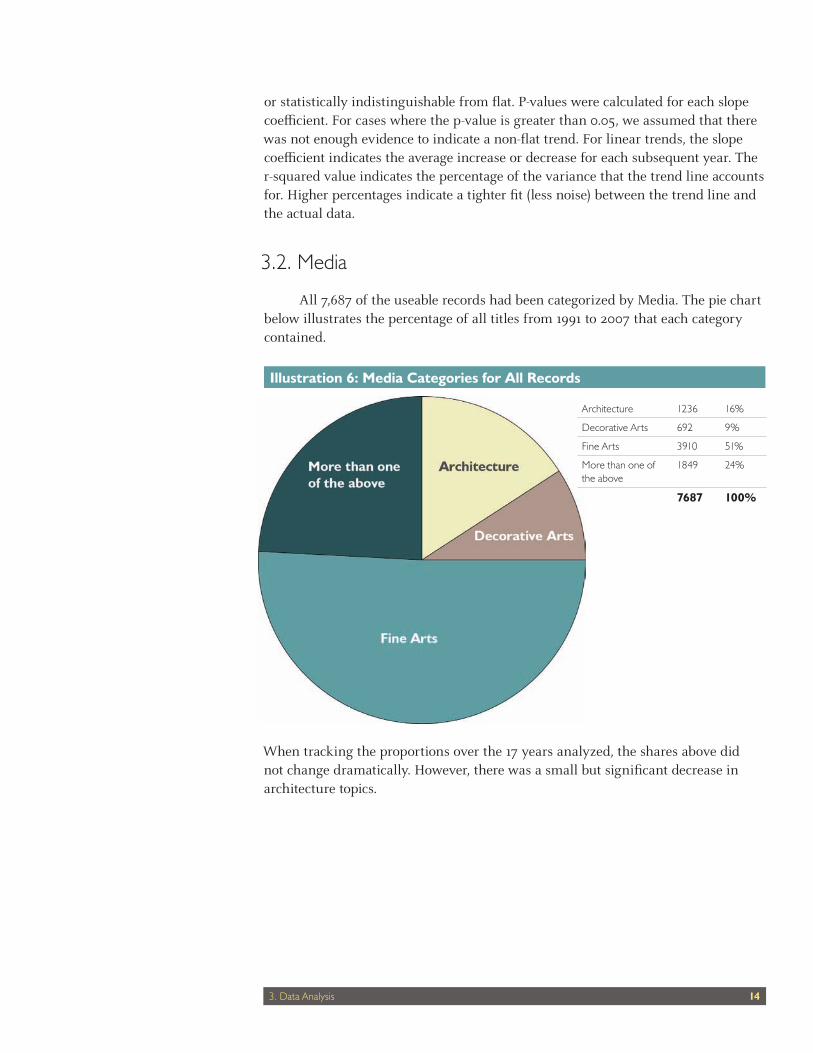
All 7,687 of the useable records had been categorized by Media. The pie chart below illustrates the percentage of all titles from 1991 to 2007 that each category contained.
Illustration 6: Media Categories for All Records
When tracking the proportions over the 17 years analyzed, the shares above did not change dramatically. However, there was a small but significant decrease in architecture topics.
Architecture 1236 16%
Decorative Arts 692 9%
Fine Arts 3910 51%
More than one of the above
1849 24%
7687 100%

153. Data Analysis
Illustration 7: Architecture
(n=1,236, p-value 0.021, coefficient -0.24758, r-squared value 30.6%)
3.3. Continents
All but 1,251 (16.3%) of the titles from the 1991 to 2007 data range were assigned one of the 7 Continent designations. North American and European topics were dominant.
Illustration 8: Continent Categories for All Records
Trends from 1991 to 2007 were not dramatic. Some slight trending was clearly detected for 3 of the geographical categories: North and Central America, Europe, and Asia. Topics on North and Central America had a small but fairly steady increase.
Africa 123 2%
Asia 626 8%
Europe 2711 35%
North & Central America
2804 37%
Oceania 134 2%
South America 36 0%
West Indies 1 0%
Not Used 1251 16%
6435 100%

163. Data Analysis
Illustration 9: North and Central American Topics
(n=2,804, p-value 0.001, coefficient 0.35819, r-squared value 52.6%)
The trend for European topics was also slight but more complicated, generally increasing until 1996-1997 and then decreasing.
Illustration 10: European Topics
(n=2,711, p-value 0.013, r-squared value 53.7%)
Asian topics had a slight curve in the opposite direction, nearly flat but reaching a low in 1999-2000.

173. Data Analysis
Illustration 11: Asia
(n=626, p-value 0.0149087, r-squared value 45.2%)
South American topics also had a slight increase, but the total number of publications was only 36 so we chose not to graph or report this as a trend.
183. Data Analysis
3.4. Stokstad Categories
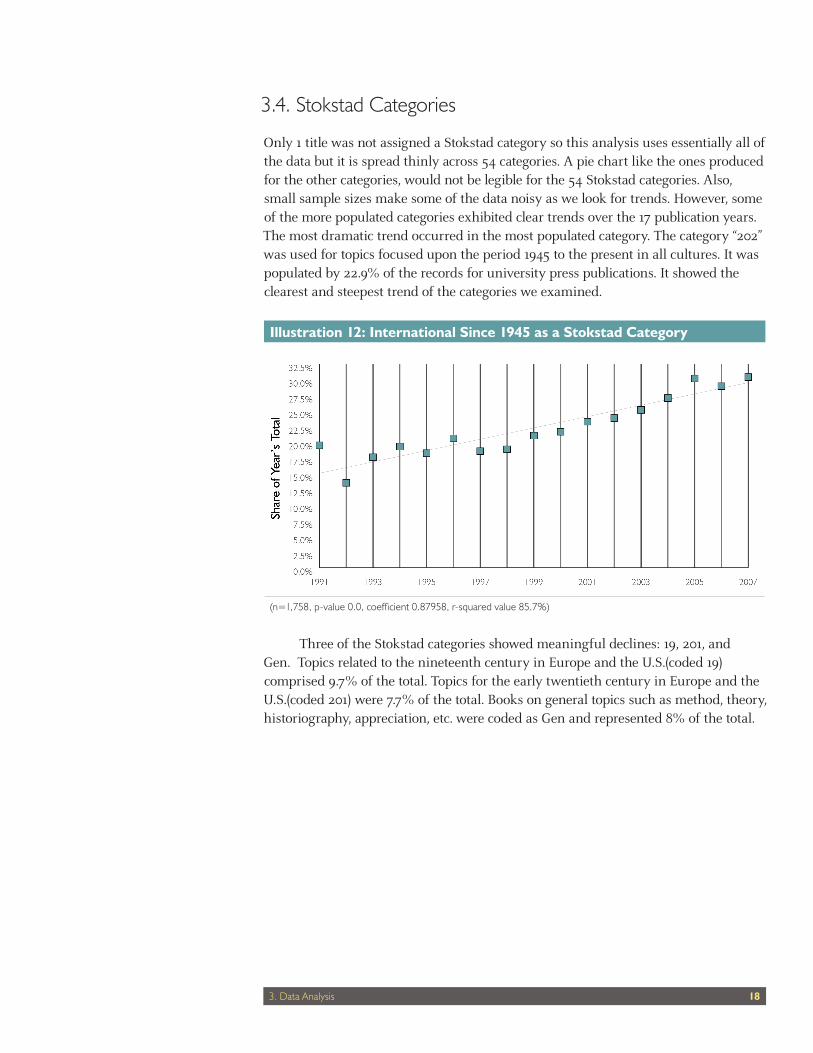
Only 1 title was not assigned a Stokstad category so this analysis uses essentially all of the data but it is spread thinly across 54 categories. A pie chart like the ones produced for the other categories, would not be legible for the 54 Stokstad categories. Also, small sample sizes make some of the data noisy as we look for trends. However, some of the more populated categories exhibited clear trends over the 17 publication years. The most dramatic trend occurred in the most populated category. The category “202” was used for topics focused upon the period 1945 to the present in all cultures. It was populated by 22.9% of the records for university press publications. It showed the clearest and steepest trend of the categories we examined.
Illustration 12: International Since 1945 as a Stokstad Category
(n=1,758, p-value 0.0, coefficient 0.87958, r-squared value 85.7%)
Three of the Stokstad categories showed meaningful declines: 19, 201, and Gen. Topics related to the nineteenth century in Europe and the U.S.(coded 19) comprised 9.7% of the total. Topics for the early twentieth century in Europe and the U.S.(coded 201) were 7.7% of the total. Books on general topics such as method, theory, historiography, appreciation, etc. were coded as Gen and represented 8% of the total.

193. Data Analysis
Illustration 13: Nineteenth-Century Topics (Europe & US) as a Stokstad Category
(n=747, p-value 0.01, coefficient -0.36712, r-squared value 54.1%)
Illustration 14: Europe & the Americas 1900-1944 as a Stokstad Category
(n=591, p-value 0.029, coefficient -0.17971, r-squared value 28.1%)

203. Data Analysis
Illustration 15: Generalities as a Stokstad Category
(n=656, p-value 0.009, coefficient -0.21519, r-squared value 37.4%)
In order to reduce the problem of portraying 54 Stokstad categories, we combined them into 9 groups. The pie chart below illustrates the percentage of all titles from 1991 to 2007 that each of these larger groups contained.
Illustration 16: Grouped Stokstad Categories for All RecordsNonWest all but Western
Europe393 5.1%
Clas&Pre classical & pre-classical (Europe & Mediterranean)
246 3.2%
MedPlus post-classical & medieval (Europe & Byzantine world)
160 2.1%
EMod 15th & 16th centuries (Europe)
281 3.7%
BarRoc Baroque & 18th century
401 5.2%
19 1800-1899 (Europe & US)
747 9.7%
201 1900-1944 (Europe & Americas)
591 7.7%
202 1945+ (international)
1758 22.9%
GenZ generalities & multiple categories
3108 40.4%
7687 100%

213. Data Analysis
But these grouped categories provided little additional indication of trends over the 17 years – only a slight decrease in postclassical and medieval topics in Europe and the Byzantine world (MedPlus) which barely registers a slope.
Illustration 17: Stokstad Categories for Post-Classical and Medieval Topics
(n=160, p-value 0.005, coefficient -0.07724, r-squared value 42.3%)
223. Data Analysis
3.5. Date Ranges
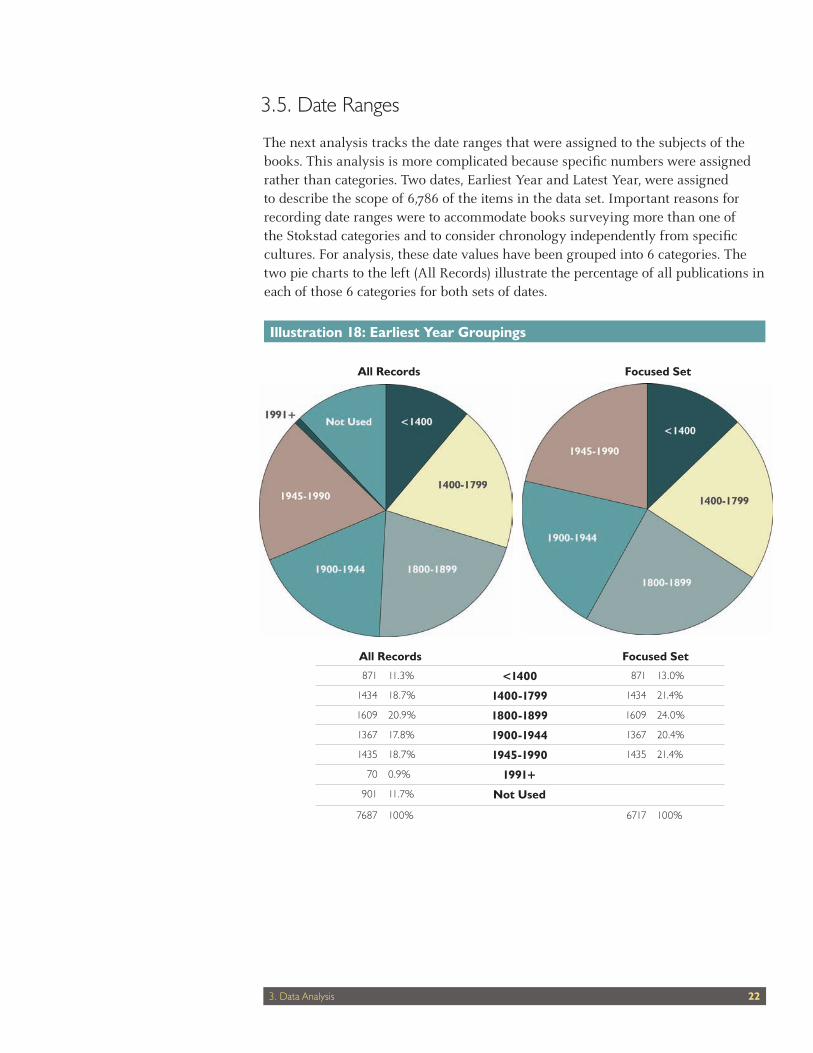
The next analysis tracks the date ranges that were assigned to the subjects of the books. This analysis is more complicated because specific numbers were assigned rather than categories. Two dates, Earliest Year and Latest Year, were assigned to describe the scope of 6,786 of the items in the data set. Important reasons for recording date ranges were to accommodate books surveying more than one of the Stokstad categories and to consider chronology independently from specific cultures. For analysis, these date values have been grouped into 6 categories. The two pie charts to the left (All Records) illustrate the percentage of all publications in each of those 6 categories for both sets of dates.
Illustration 18: Earliest Year Groupings
All Records Focused Set
All Records Focused Set
871 11.3% <1400 871 13.0%
1434 18.7% 1400-1799 1434 21.4%
1609 20.9% 1800-1899 1609 24.0%
1367 17.8% 1900-1944 1367 20.4%
1435 18.7% 1945-1990 1435 21.4%
70 0.9% 1991+
901 11.7% Not Used
7687 100% 6717 100%
233. Data Analysis
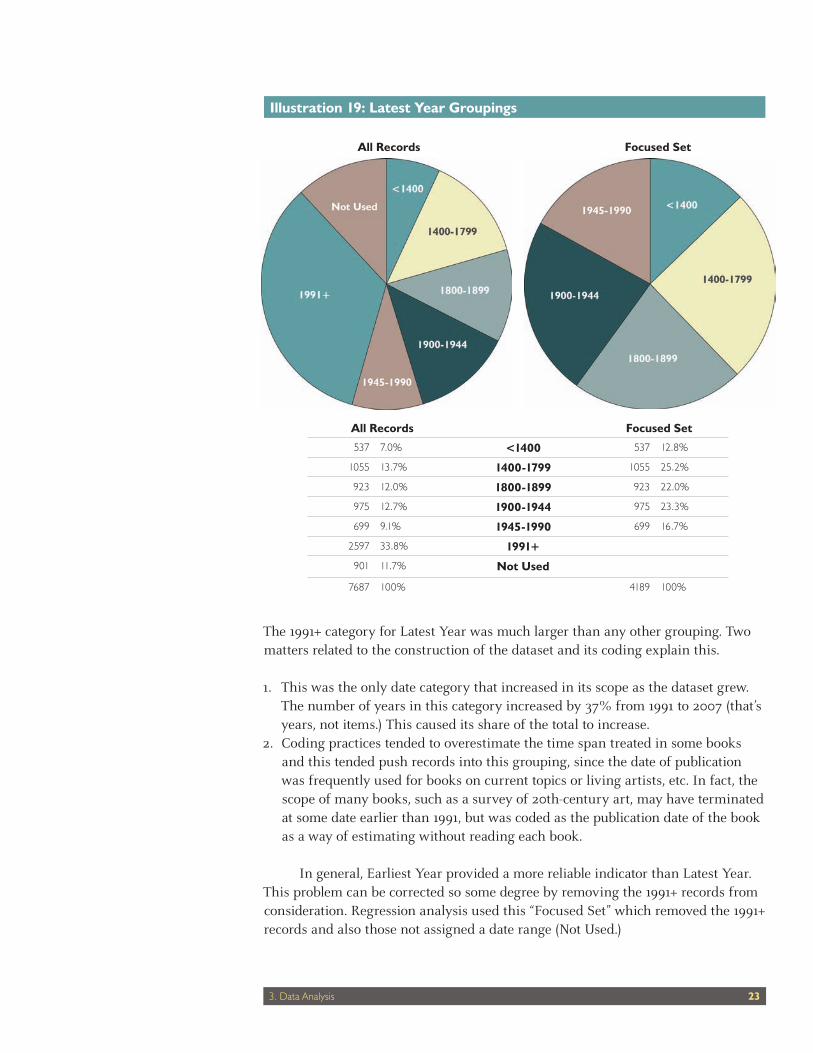
Illustration 19: Latest Year Groupings
All Records Focused Set
The 1991+ category for Latest Year was much larger than any other grouping. Two matters related to the construction of the dataset and its coding explain this.
1. This was the only date category that increased in its scope as the dataset grew. The number of years in this category increased by 37% from 1991 to 2007 (that’s years, not items.) This caused its share of the total to increase.
2. Coding practices tended to overestimate the time span treated in some books and this tended push records into this grouping, since the date of publication was frequently used for books on current topics or living artists, etc. In fact, the scope of many books, such as a survey of 20th-century art, may have terminated at some date earlier than 1991, but was coded as the publication date of the book as a way of estimating without reading each book.
In general, Earliest Year provided a more reliable indicator than Latest Year. This problem can be corrected so some degree by removing the 1991+ records from consideration. Regression analysis used this “Focused Set” which removed the 1991+ records and also those not assigned a date range (Not Used.)
All Records Focused Set
537 7.0% <1400 537 12.8%
1055 13.7% 1400-1799 1055 25.2%
923 12.0% 1800-1899 923 22.0%
975 12.7% 1900-1944 975 23.3%
699 9.1% 1945-1990 699 16.7%
2597 33.8% 1991+
901 11.7% Not Used
7687 100% 4189 100%
243. Data Analysis
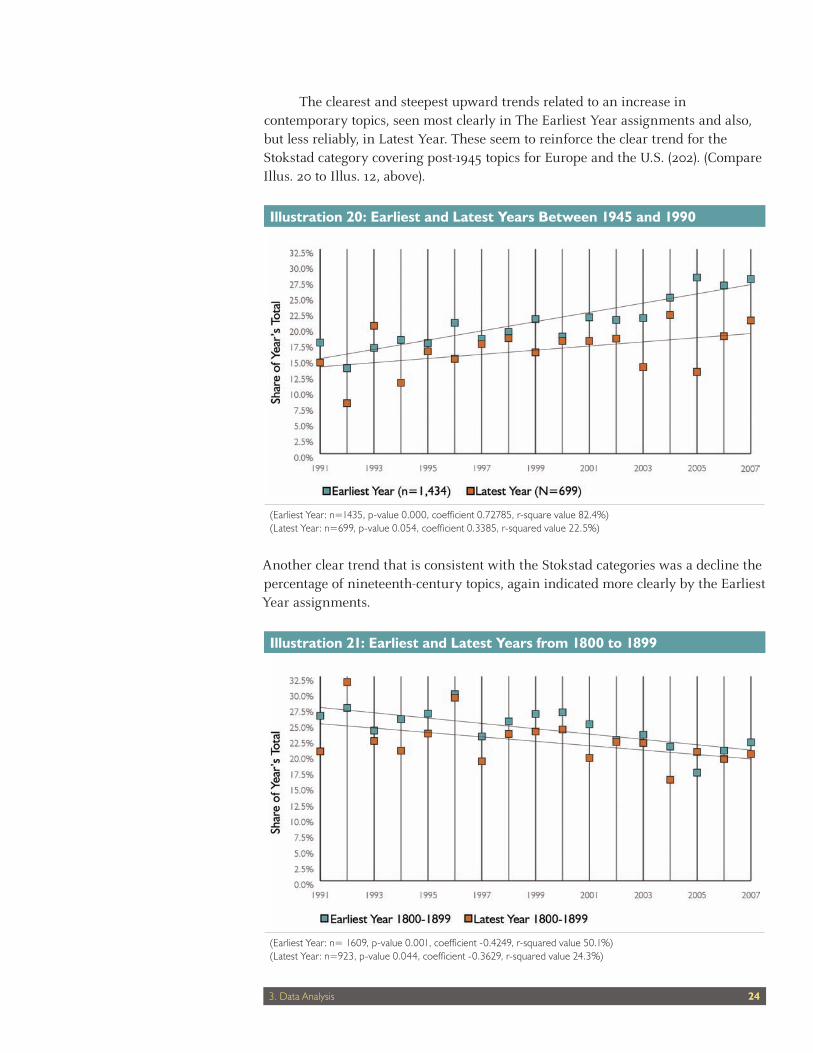
The clearest and steepest upward trends related to an increase in contemporary topics, seen most clearly in The Earliest Year assignments and also, but less reliably, in Latest Year. These seem to reinforce the clear trend for the Stokstad category covering post-1945 topics for Europe and the U.S. (202). (Compare Illus. 20 to Illus. 12, above).
Illustration 20: Earliest and Latest Years Between 1945 and 1990
(Earliest Year: n=1435, p-value 0.000, coefficient 0.72785, r-square value 82.4%)(Latest Year: n=699, p-value 0.054, coefficient 0.3385, r-squared value 22.5%)
Another clear trend that is consistent with the Stokstad categories was a decline the percentage of nineteenth-century topics, again indicated more clearly by the Earliest Year assignments.
Illustration 21: Earliest and Latest Years from 1800 to 1899
(Earliest Year: n= 1609, p-value 0.001, coefficient -0.4249, r-squared value 50.1%)(Latest Year: n=923, p-value 0.044, coefficient -0.3629, r-squared value 24.3%)

253. Data Analysis
Two other significant trends emerged from the Earliest Year data: slight declines in the categories for years before 1400 (E<1400) and for the 15th through 18th centuries (E 1400-1799.)
Illustration 22: Earliest Years Before 1400
(n=871, p-value 0.013, coefficient -0.16707, r-squared value 34.9%)
Illustration 23: Earliest Years From 1400 to 1799
(n=1,434, p-value 0.031, coefficient -0.23439, r-squared value 27.5%)
263. Data Analysis
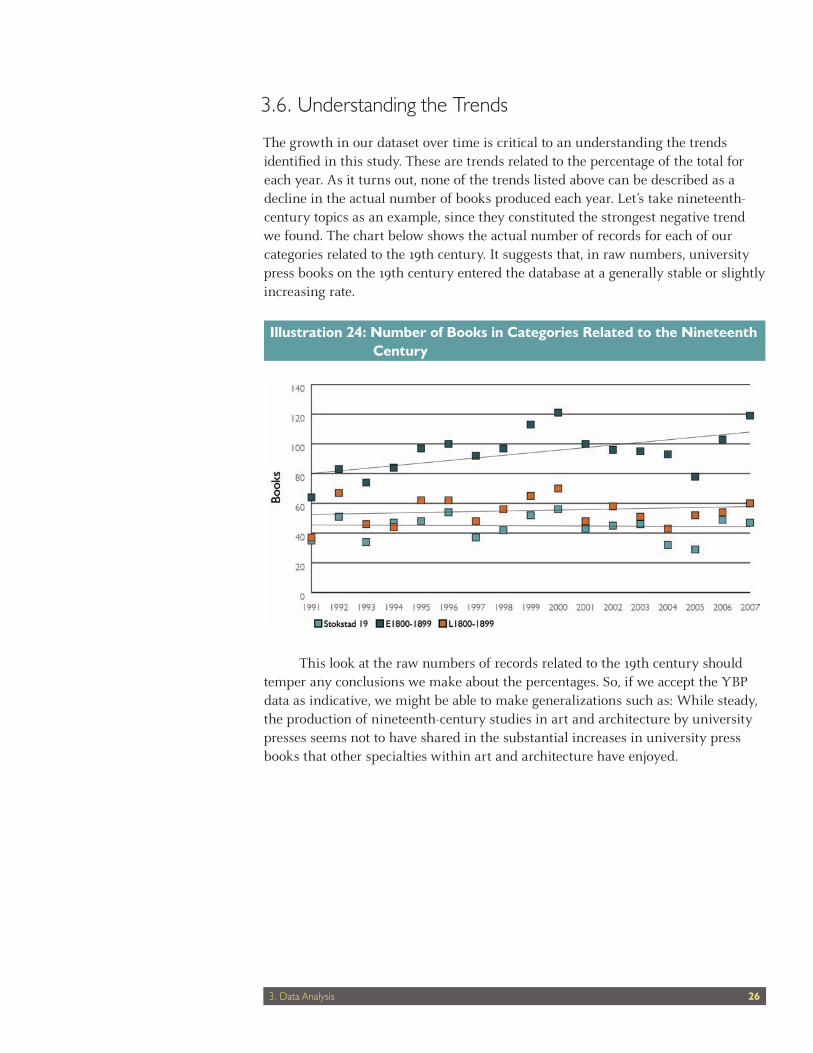
3.6. Understanding the Trends
The growth in our dataset over time is critical to an understanding the trends identified in this study. These are trends related to the percentage of the total for each year. As it turns out, none of the trends listed above can be described as a decline in the actual number of books produced each year. Let’s take nineteenth-century topics as an example, since they constituted the strongest negative trend we found. The chart below shows the actual number of records for each of our categories related to the 19th century. It suggests that, in raw numbers, university press books on the 19th century entered the database at a generally stable or slightly increasing rate.
Illustration 24: Number of Books in Categories Related to the Nineteenth Century
This look at the raw numbers of records related to the 19th century should temper any conclusions we make about the percentages. So, if we accept the YBP data as indicative, we might be able to make generalizations such as: While steady, the production of nineteenth-century studies in art and architecture by university presses seems not to have shared in the substantial increases in university press books that other specialties within art and architecture have enjoyed.

274. Comparison To Trade And Museum Publishing
4. Comparison To Trade And Museum Publishing
4.1. Qualitative Assessment
During the design of this study, a number of questions were discussed relating to the effects of focusing solely on university press publications. Obviously, trade presses play an important role in scholarly publishing. After preliminary analysis, questions persisted about the relationship between university press activities and the scholarly publishing of trade presses and museums. Can we truly understand the university press data without considering other academic publishing? For example, could the decline in the annual percentage of nineteenth-century topics be explained by a shift of this market to trade publishers? Was the increase in post-war topics a matter of university presses catching up to what trade publishers had already been doing? So the decision was made to try to look beyond the initial scope of this project and to consider these closely related publishing activities. Inclusion of trade publishers and museums in the same broad way that university presses were studied was not feasible, since the number of publications that would need to be coded was estimated at many times the number of university press publications. A relatively small set of data was required. So a group of publishers was selected based upon the following criteria:
• Tradepublishersknowntopublishasubstantialquantityofartand architecture titles between 1991 and 2007.
• Majormuseumsknowntobeespeciallyactiveinpublishingartand architecture titles between 1991 and 2007.
• MuseumsandpublisherswhoseoutputwaswellrepresentedinYPB’sGOBI database.
The following table shows the publishers that were selected. Those familiar with art publishing may notice some lacunae among the trade publishers (perhaps Brepols, Brill, and others.) These are usually publishers that were not well represented in the GOBI database because of their methods of distribution. Some notable museums may also seem to be missing, but their output is often in the data under another publisher’s name because of co-publications, distribution arrangements, etc.

284. Comparison To Trade And Museum Publishing
Illustration 25: Trade and Museum Publishers Downloaded and Sampled (Note: This data was used for qualitative analysis.)Publisher Download In Sample
Harry N. Abrams 732 353 (Includes Abradale/Abrams and many co-publications)
Rizzoli 586 287 (Includes many co-publications)
Phaidon 569 300
Tate Publishing 310 142 (Includes Tate Gallery and Tate St. Ives)
Ashgate 272 147 (Includes Avebury/Ashgate, Gower, Scolar/Ashgate, Scolar/GowerVariorum/Ashgate, and Variorum/Gower)
Lund Humphries 214 101 (Includes many co-publications)
Metropolitan Museum of Art 181 88 (Includes many co-publications)
Skira 149 79 (Includes Skira/Rizzoli and many co-publications)
W.W. Norton 131 69
Smithsonian 120 56 (Includes Smithsonian Institution, Smithsonian Books, and many co-publications)
Museum of Modern Art, New York 114 55 (Includes many co-publications)
National Gallery of Art, Washington DC
114 60 (Includes many co-publications)
Victoria & Albert Museum 95 49 (Includes many co-publications)
National Gallery, London 65 41
Museum of Fine Arts, Boston 59 31 (Includes many co-publications)
St. Martin’s 57 28
Whitney Museum of American Art 53 24 (Includes many co-publications)
Harvey Miller 48 25
Kodansha 48 22
J. Paul Getty Museum 31 17 (Most Getty publications had been included iin the data on university presses.)
Kegan Paul International 11 6
Total 3,959 1,980 The sample consists of 50% of the total downloaded.
Of course this list of publishers was both subjective and pragmatic and these factors weakened any potential statistical approach. We also chose to exclude books that had been assigned the “popular” or “juvenile” designations by YBP staff – another subjective determination. In the end, the complexity of the filtering that we wanted to use extract from the GOBI database proved unmanageable. We could not obtain a dataset that was complete within these parameters. We extracted nearly 4,000 records from the GOBI database, all of which met our criteria, but were able to determine that this dataset was missing a significant number of records. So we decided to abandon a fully statistical analysis and to proceed with a purely qualitative overview of the data available. The analyses used for university presses, described in detail above, were repeated using a random sampling of half of the available trade press and museum data. The results were similar to the more rigorous analysis. The most dramatic difference was a much higher percentage of European topics, which is not surprising, when one considers the number of productive trade publishers on our list with European headquarters. (The pattern

294. Comparison To Trade And Museum Publishing
of American publishers favoring 19th and 20th-century American artists and European publishers producing more European monographs for those eras was pronounced.)
Illustration 27: Publications in Both Data Sets by Country of the Publisher
Country University Press Publications Country Selected Trade Publications
US 5612 68.70% US 872 44.54%
UK 1160 14.20% UK 788 40.25%
[blank] 616 7.50% [blank] 178 9.09%
Canada 258 3.20% Other 69 3.52%
Other 120 1.50% Italy 51 2.60%
Australia 117 1.40%
Netherlands 112 1.40%
Additionally, a slightly higher percentage of the output of trade and museum publishers seems to have been devoted to post-1945 topics than was found with university presses. Beyond this, from the limited analysis we could conduct, our overall impression was that trends in the output of the trade and museum presses we selected did not seem to be different, in any clear way, from the trends we have detailed in the output of university presses.