analysis of two-by-two table data: confidence...
TRANSCRIPT

1
1
Confidence Intervals
Analysis of
Two-by-Two Table Data:
Confidence Intervals
UI-MEPI-J: Research Design and Methodology Workshop, May 10 - 12, 2016
2
Confidence Intervals
Objectives
After completing this session, the student should
be able to:
Describe a confidence interval in non-
technical terms
Describe the relationship between a P-value
and a confidence interval
Properly interpret a confidence interval in
terms of precision, covered range, and
statistical significance

2
3
Confidence Intervals
ILL
VANILLA | + - | Total
-----------+-------------+------
+ | 43 11 | 54
- | 3 18 | 21
-----------+-------------+------
Total | 46 29 | 75
Single Table Analysis
Odds ratio 23.45
Cornfield 95% confidence limits for OR 5.07 < OR < 125.19*
RISK RATIO(RR)(Outcome:ILL=+; Exposure:VANILLA=+) 5.57
95% confidence limits for RR 1.94 < RR < 16.03
Ignore risk ratio if case control study
Chi-Squares P-values
----------- --------
Uncorrected: 27.22 0.00000018 <---
Mantel-Haenszel: 26.86 0.00000022 <---
Yates corrected: 24.54 0.00000073 <---
4
Confidence Intervals
Risk ratio = 2.1
95% confidence interval = 1.1–4.0
RR & 95% CI = 2.1 (1.1–4.0)
RR & 95% CLs = 2.1 (1.1, 4.0)
Confidence Intervals

3
5
Confidence Intervals
In epidemiology, the process of making a
quantitative inference about a population from
a sample
– Point estimate
• Characteristic of a population
• Exposure’s effect on disease
– Interval estimate
• Range of values rather than single value
What is Estimation?
6
Confidence Intervals
What we have learnt so far
Population parameters are fixed
We can take samples from the population
Several samples of size ‘n’ are possible
Each sample give estimates (e.g., means)
called “statistics”
Statistics vary from sample to sample
– This is called “Sampling fluctuation”
Concept of confidence
interval
4
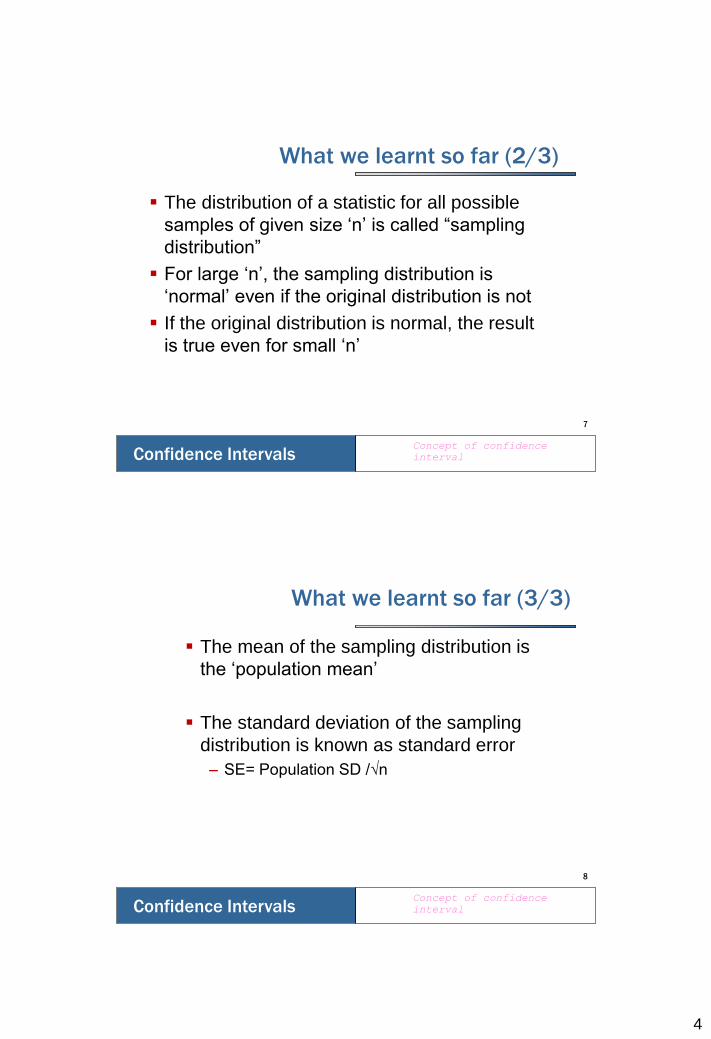
7
Confidence Intervals
What we learnt so far (2/3)
The distribution of a statistic for all possible
samples of given size ‘n’ is called “sampling
distribution”
For large ‘n’, the sampling distribution is
‘normal’ even if the original distribution is not
If the original distribution is normal, the result
is true even for small ‘n’
Concept of confidence
interval
8
Confidence Intervals
What we learnt so far (3/3)
The mean of the sampling distribution is
the ‘population mean’
The standard deviation of the sampling
distribution is known as standard error
– SE= Population SD /√n
Concept of confidence
interval

5
9
Confidence Intervals
A range of values that quantify the uncertainty
around a point estimate of a measure, such as the
proportion of children vaccinated or the effect of
exposure on disease.
Provides interval estimate, reflects precision (or
imprecision) of the point estimate
Examples of point estimates and 95% confidence
intervals :
– Vaccine coverage = 70% (95% CI = 65%-75%)
– Risk ratio = 4.0 (95% CI = 2.0–8.0)
What is a Confidence Interval?
10
Confidence Intervals
Required or recommended by many medical and
public health journals
Most relevant when goal is to estimate…
– Characteristic of a population
– Exposure’s effect on disease
Less relevant for finding single responsible factor
Confidence Intervals

6
11
Confidence Intervals
What is a Confidence Interval? Statistical Definition
The interval calculated from a random sample
by a procedure which, if applied to an infinite
number of random samples of the same size,
would, in 95% (or other specified level) of
instances, contain the true value in population.
12
Confidence Intervals
Population (Vaccine coverage = 60%)
1
2
999
1000
VC=?
VC=?
VC=?
VC=?
VC=?

7
13
Confidence Intervals
95% Confidence Intervals from 20 Samples
14
Confidence Intervals
The range of values that are compatible with
the data under the standard interpretation of
statistical significance.
- Rothman
What is a Confidence Interval? Epidemiologic Definition
8
15
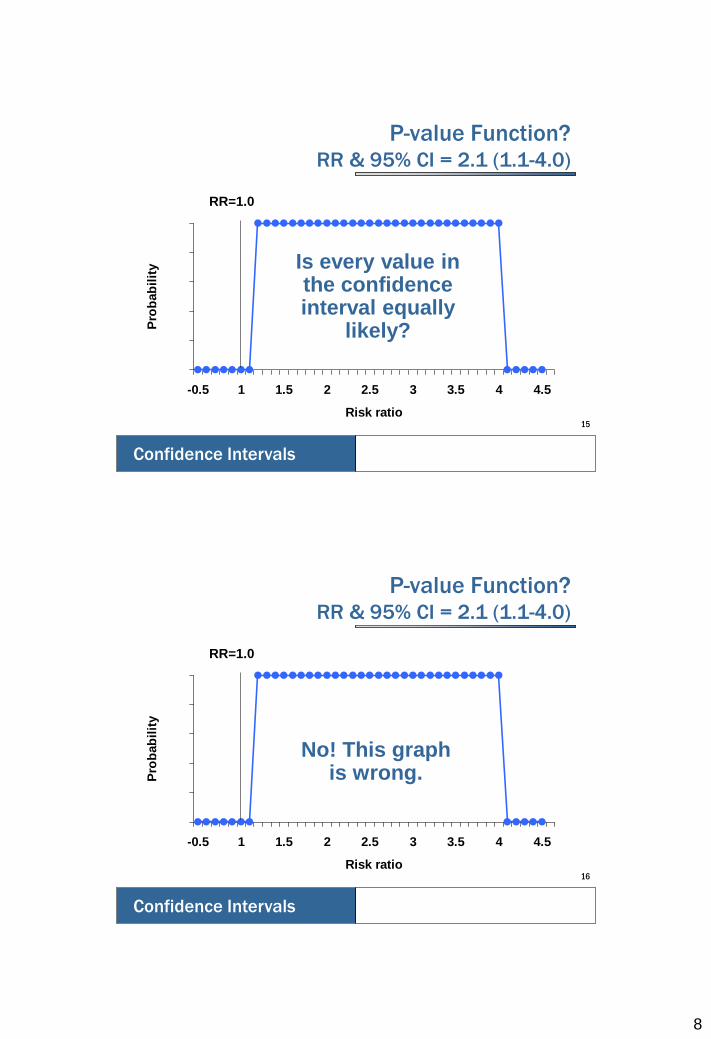
Confidence Intervals
P-value Function? RR & 95% CI = 2.1 (1.1-4.0)
0
0.1
0.2
0.3
0.4
0.5
-0.5 1 1.5 2 2.5 3 3.5 4 4.5
Risk ratio
Pro
bab
ilit
y
RR=1.0
Is every value in the confidence interval equally
likely?
16
Confidence Intervals
P-value Function? RR & 95% CI = 2.1 (1.1-4.0)
0
0.1
0.2
0.3
0.4
0.5
-0.5 1 1.5 2 2.5 3 3.5 4 4.5
Risk ratio
Pro
bab
ilit
y
RR=1.0
No! This graph is wrong.

9
17
Confidence Intervals
P-value Function RR & 95% CI = 2.1 (1.1-4.0)
0
0.1
0.2
0.3
0.4
0.5
-0.5 1 1.5 2 2.5 3 3.5 4 4.5
Risk Ratio
RR=1.0
Pro
ba
bil
ity
This graph is correct.
18
Confidence Intervals
P-value Function RR & 95% CI = 2.1 (1.1-4.0)
0
0.1
0.2
0.3
0.4
0.5
-0.5 1 1.5 2 2.5 3 3.5 4 4.5
Risk Ratio
RR=1.0
Pro
ba
bil
ity
RR=1.1 RR=4.0
RR=2.1
95% CI = 1.1-4.0

10
19
Confidence Intervals
P-value Function RR & 95% CI = 2.1 (0.8-5.5)
0
0.1
0.2
0.3
0.4
0.5
-0.5 1 1.5 2 2.5 3 3.5 4 4.5 5 5.5
Risk Ratio
RR=1.0
Pro
ba
bil
ity
RR=0.8 RR=5.5
RR=2.1
95% CI = 0.8-5.5
20
Confidence Intervals
Width of a Confidence Interval
An interval or range of values that reflects the precision of the point estimate
Example:
– Study 1: RR = 4.0 (95% CI = 2.0–8.0)
– Study 2: RR = 4.0 (95% CI = 1.01–16.0)
Narrower confidence interval means more precise estimate
Wider confidence interval means less precise estimate

11
21
Confidence Intervals
Formulas for Confidence Intervals
Based on the “measure” ± Z multiplied by the standard error (measure), where “measure” represents RR, OR, etc.
Different formula for each measure – Mean, proportion, RR, OR, etc.
Some measures have multiple formulas
Symmetrical for mean, proportion; asymmetrical for RR, OR
Let the computer do the computation!
22
Confidence Intervals
Standard Error
The standard deviation of the
sampling distribution is called the
standard error.
It is the measure of precision of the
estimate i.e the price we pay for
taking a sample
The larger the sample size, the less
the error in its estimate

12
23
Confidence Intervals
Standard Error of the Mean
For single sample;
For two independent samples
24
Confidence Intervals
Standard Error of the Proportion
For single sample;
For two independent samples

13
25
Confidence Intervals
General Structure for Confidence Intervals
variance
]va r ianceZes t im a te )[ ln(p o inte α
Arithmetic Scale Measure
Point estimate ± tα
Multiplicative Scale Measure
Point estimate x e
]va r ianceZ[ α
26
Confidence Intervals
Comments on the Width of a Confidence Interval
Width reflects the precision of the point estimate
OR & 95% CI = 3.0 (1.0 – 9.0)
OR & 95% CI = 3.0 (2.0 – 4.5)
The more confidence you want (95 vs. 99%), the
wider the interval
99 95 OR 95 99

14
27
Confidence Intervals
Confidence Interval is Affected by…
Level of confidence
– 99% wider than 95% CI
Sample size
– Larger study narrower CI because SE decreases as the sample size increases
For some measures, variation in the data
For RR and OR, strength of association
28
Confidence Intervals
CI vs. P-value – Similarities
Both can assess statistical significance
Statistically equivalent (more or less)
Neither accounts for bias
Multiple formulas, including exact methods

15
29
Confidence Intervals
CI vs. P-value – Differences
CI provides same information as a statistical
test, plus more
CI reminds reader of variability
CI provides range of compatible values
(interval estimation)
CI more clearly shows influence of sample
size
30
Confidence Intervals
Risk ratio = 2.1 (95% CI = 1.1– 4.0)
Where is the point estimate?
(RR > 1, RR 1, RR < 1)
Is the range of values wide or narrow?
What values are consistent with this study
(included)? What values are inconsistent
(excluded)?
Is this study consistent with the null hypothesis
(no difference)?
Interpreting a Point Estimate and Confidence Interval

16
31
Confidence Intervals
Interpret the Findings (Studies 1–6)
Study P value RR 95% CI Interpretation
1 0.007
2 0.03
3 0.08
4 0.65
5 0.0001
6 8 x 10-11
2.0 1.2 – 3.3
7.0 1.2 – 40.8
7.0 0.8 – 61.3
0.98 0.9 – 1.07
0.6 0.7 – 0.9
0.98 0.97 – 0.99
32
Confidence Intervals
Interpret the Findings (Studies 7–11)
Study P value RR 95% CI Interpretation
7 0.060 4.0 0.94 – 17.0
8 0.052 4.0 0.99 – 16.2
9 0.048 4.0 1.01 – 15.8
10 0.00009 4.0 2.0 – 8.0
11 0.9 4.0 0.2 – 80.0

17
33
Confidence Intervals
Interpretation of the calculation of the confidence interval for the proportion
The 95% confidence interval for the
proportion of 17% is (13%, 21%)
This means that with repeated random
sampling, 95% of the intervals will contain
the true proportion
Since we have one of these intervals, we
can be 95% confident that this interval
contains the true proportion
Confidence interval for a
proportion
34
Confidence Intervals
Confidence interval is range of values
compatible with the data in a study
Quantifies uncertainty around a point estimate
(indicates precision)
Most relevant for interval estimation
Can be used as test of statistical significance
(95% CI is equivalent to alpha = 0.05)
Does not address bias!
Summary / Final Comments

18
35
Confidence Intervals
The estimation of population
parameters
In an attempt to seek for the reliability
of point estimates obtained for
population parameters, researchers
are more comfortable with interval
estimates taking good advantage of
the central limit theorem on sample
estimates having normal distributions.
36
Confidence Intervals
ILL
VANILLA | + - | Total
-----------+-------------+------
+ | 43 11 | 54
- | 3 18 | 21
-----------+-------------+------
Total | 46 29 | 75
Single Table Analysis
Odds ratio 23.45
Cornfield 95% confidence limits for OR 5.07 < OR < 125.19*
RISK RATIO(RR)(Outcome:ILL=+; Exposure:VANILLA=+) 5.57
95% confidence limits for RR 1.94 < RR < 16.03
Ignore risk ratio if case control study
Chi-Squares P-values
----------- --------
Uncorrected: 27.22 0.00000018 <---
Mantel-Haenszel: 26.86 0.00000022 <---
Yates corrected: 24.54 0.00000073 <---

19
37
Confidence Intervals
38
Confidence Intervals
Look at this picture;

20
39
Confidence Intervals
Author, Acknowledgements, References
Author
Richard Dicker
Acknowledgements
Reference
Rothman KF. Modern Epidemiology