analyst 23-02-10 final r1 - listed...
TRANSCRIPT

Analyst Meeting2009 Performance

2009 Management Highlightsg g g
Industry Outlooks
Operation PerformanceAGENDA
CAPEX
Fi i l P f
AGENDA
Financial Performance
Key Highlightsy g g
2

IMF: “The world economy is recovering at different speeds in the various regions; policies
2009 Highlights IMF: The world economy is recovering at different speeds in the various regions; policies
need to foster a rebalancing of global demand.”.
Oil markets recovered to stabilize in a well-defined price band. The actions of producers halted the price decline and resurgent non-OECD demand, particularly China and India, bring the market back into balancethe market back into balance.
Outlook overview: Another hard year to come. Refining: Weak margin in the near term with recovery beyond 2013 Petrochemical: Industry restructuring likely & necessary
Overview
4Q09 average crude run 70%, 2009 average crude run 66%, decrease 17% from 2008 at 80% due to economic slowdown and shutdown approximately 3 weeks in 1Q09 .
Market GIM in 2009 at 7.2 $/bbl: Refinery 3.1$/bbl, Petrochemical 4.1$/bbl.
Aim to be “Top Quartile Integrated Petrochemical Complex in Asia by 2014” with refinery adherent.
Board approved USD1,412 million budget for 5-year CAPEX plan; already approved 4 newBoard approved USD1,412 million budget for 5 year CAPEX plan; already approved 4 new projects with USD 135 million CAPEX on 22 December 2009
Cost reduction program, 2009 cost reduced by USD 65.5 million or 1.26 $/bbl.
Initiate “IRON”, IRPC Oil on Net, the first Asean online system for petrochemical and Operation
Expected dividend in 2009 is 0 18 baht/share or 4 3% dividend yield 2009 interim dividend
petroleum trading
Obtaining 5-star 2009 Excellent Corporate Governance Award
3
Expected dividend in 2009 is 0.18 baht/share or 4.3% dividend yield, 2009 interim dividend 0.08 baht/share already paid in September 2009
Total ESOP exercised until December 2009 was executed only 2.05% of total shares. Finance

Industry OutlooksIndustry Outlooks
4
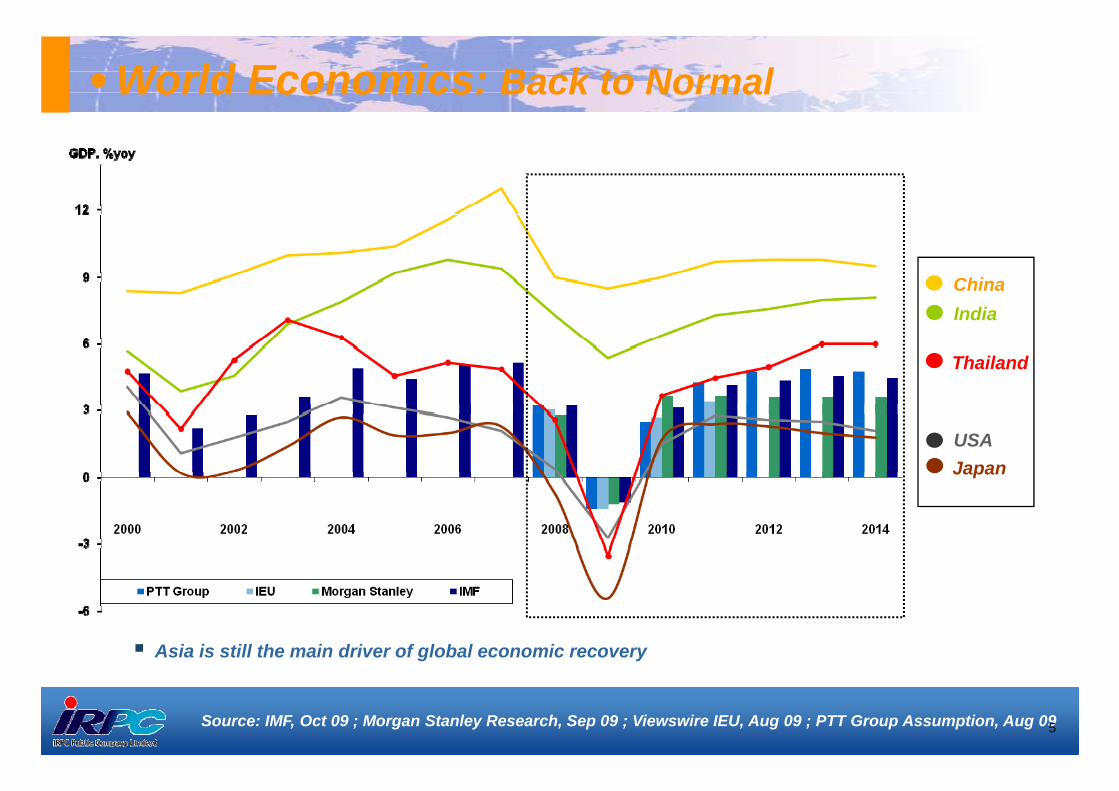
World Economics: Back to Normal
ChinaIndia
Thailand
USAJapan
Asia is still the main driver of global economic recovery
Source: IMF, Oct 09 ; Morgan Stanley Research, Sep 09 ; Viewswire IEU, Aug 09 ; PTT Group Assumption, Aug 09 5

World Oil Demand2009 2010
Change
Md/dGrowth % yoy
Avg. Supply 84.3 86.3 2 2.3788
Mbpd
Avg
Avg. Demand 84.08 84.9 0.82 0.97
87.4
86.186
87
Avg. Supply
86.186
85.5
85
86.3
85.8
85
86
Avg. Demand
84.384.2
84.03
84.75 84.984.93
84
84.78
84.0884
83
823Q09e 4Q09 Y09 1Q10 2Q10 3Q10 4Q10 Y10
OPEC IEA PIRA KBC
6Source: PIRA, Aug 09

Refining Capacity Additions
2500
World Capacity Additions and Petroleum Demand Growth,Thousand Barrels per Day
1500
2000
0
500
1000
-1000
-500
0
Reliance-India 580 KBDCNOOC-China 240 KBD
Petrochina 200 KBDIndia 290 KBD
Essar Oil-India 110 KBDKochi Ref.India 125 KBD
Sinopec 250 KBD CNPC 200 KBD
Saudi Aramco 400 KBDIndia 180 KBD
-2000
-1500Dung Quat-Viet 140 KBD Sinopec 150 KBD
Marathon-USA 180 KBDPemex-Mexico 150 KBD
Nagarjuna-India 125 KBDPersan-Iran 120 KBDSinopec 100 KBD
Petrobras 150 KBD
-25002009 2010 2011 2012 2013
Demand Growth Refinery Capacity Additions
7Source: Purvin & Gertz, Sep 09

2010 Crude Oil Outlook: Average 75-80 $/bbl
Refinery operating rates remain low for Q1/2010 with finventories of middle distillate built-up worldwide remaining
high. Constraining naphtha and aromatics supply, forcing
refineries run at low rates.
8

Refining Outlook: Still under heavy pressureApparent refinery capacity surplus / deficit1, AsiaKbpd, 1990-2015F
Singapore margins2
USD/bbl10
Complex
6
8
Simple
2
4
-2
0
-4
-6
1. Refining capacity minus total oil demand2 Historical margin for 1990-2008 from British Petroleum, margin forecast for 2009 and beyond from FACTS
Gl b l E
1990 20001995 2005 2010 2014
9
Global Energy
Source: MGI; BP Statistical Review of World Energy; Platts; FACTS Global Energy; Team analysis

Operating ratio: %MT
World Ethylene Balance and Operating RateOperating ratio: %MT
Capacity
World Operate
Operate in US
Operate
O i A i
Operate in US
DemandOperate in Asia
No new Ethylene Plant in U.S.A. and Europe Asian Operating rate will go down sharply due to start-up of New Plants in M-East & China After 2010, Operating rate in Asia will rise Expansion of Operating rate in the world as same direction as Asia
10
Expansion of Operating rate in the world as same direction as Asia
Source: The World Outlook Petrochemical, Mitsubishi Corporation Sep 09

Major Olefins Addition Capacity in AsiaMiddle EastChinaRest of Asia
2010 2011 2012
Ethylene
Total = 7,460 KTA Total = 4,733 KTA Total = 3,250 KTA
Propylene
802, 14%
2264,39%
2702,47%
0, 0%
925, 100%
0, 0%1475, 45%375, 11
%
1440, 44%
Total = 5,768 KTA Total = 3,290 KTA Total = 925 KTA
11

Petrochemical Price: Sustainable
Olefins and Polyolefin price tend to reduce start in 2Q from new startup
l b t 10 000 KTA Eth l fplan about 10,000 KTA Ethylene from 8 new crackers (3 in ME, 2 in China, 1 in India, 1 in Singapore and 2 in Thailand))
2009 Aromatics price was better than expected and gradually increased to p g ythe beginning of 2010 supported by high energy price and supply constraint from refinery cut run.
The market could be driven by 2 big events in China, Shanghai China EXPO i 1 M 31 O t 2010 dEXPO in 1 May - 31 Oct 2010 and Asian Game in 12 - 27 Nov 2010.
12

China Petrochemical Balance (as Ethylene Equivalent Basis)
China Supportive of Chemical
& S
Massive new Integrated investments in 2008 2011
Demand & Supply
Integrated investments in 2008-20116.3 MMT Ethylene ; +63%5.3 MMT Propylene ; +57%4.6 MMT Benzene ; +80%4.4 MMT Paraxylene ; +109%
Still not self-sufficient for most chemicals, but import needs are not growing as fast (reducing) after 2010, The Negative Balance will be 0 0, e egat e a a ce besmaller due to self-sufficiency rate grown up
Economic stimulus package will support chemical investment andsupport chemical investment and consumer demand
Coal chemistry is a viable option
13Source: World petrochemical conference, CMAI Mar 09; The World Outlook Petrochemical, Mitsubishi corporation Sep 09

Global Recession Effects to the Earning Level
The earning up-cycle was in full between 2004 - 2008 : Extremely tight markets
The current recession will force global average profits to very low levels through 2010 : levels necessary to Encourage rationalization as newthrough 2010 : levels necessary to Encourage rationalization as new,low cost production enters
Reinvestment level earning will not be reached until 2013 despite thesignificant addition of very low cost production “The New Gulf” capacity
14Source: World petrochemical conference, CMAI Mar 09

Petroleum Outlook Summary
Global refined product demand growth is from Asia Pacific 55% and MiddleEast 20%. In 2010-13 additional demand is approximately 4,600 KBD while newsupply is about 5 600 KBD in the same periodsupply is about 5,600 KBD in the same period.
With so much excess capacity assessed refineries vulnerable for With so much excess capacity, assessed refineries vulnerable forshutdown: about 3.6 MMB/D of refining capacity needs to be rationalized
Singapore margins forecast to be weak in the near term with recoverybeyond 2013
15

Petrochemical Outlook Summary
Global demand loss is largest concern of current market; global demand willrecover with economy by 2010, returning to trend-line patternsy y g p
Over-capacity still looms despite demand recovery, causing margins to under perform expectations until next up cycle.perform expectations until next up cycle.
“Asia” investments chasing local demand recovery, while “Middle East” i i i i i i k i h l f d kinvestments mitigating margin risk with low-cost feedstock
Industry restructuring likely & necessary Industry restructuring likely & necessary- 2009 recovery in margins is temporary- Low margins expose marginal performers with high debt loads- Capacity closures of old/inefficient facilities will occur- Financing difficulties for marginal projects will delay start-ups for 2012+g g p j y p- Cost reduction becomes critical for competitiveness
16

OperationP fPerformance
17
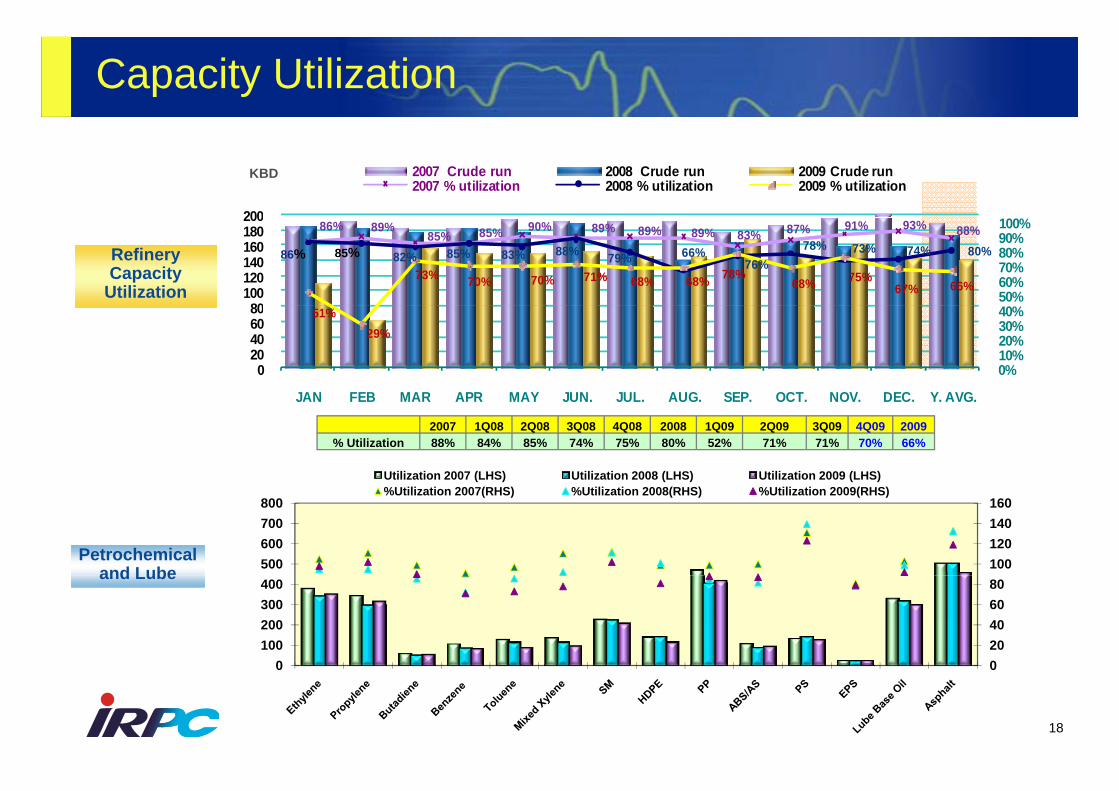
Capacity Utilization
200
2007 Crude run 2008 Crude run 2009 Crude run2007 % utilization 2008 % utilization 2009 % utilization
KBD
86% 89%85% 85% 90% 89% 89% 89% 83% 87% 91% 93% 88%
82% 85% 83% 88% 79% 66%76%
78% 73% 74% 80%
73% 70% 70% 71% 68% 68% 78%68% 75%
67% 66%50%60%70%80%90%100%
80100120140160180200
Refinery Capacity
Utilization
86% 85%
51%29%
0%10%20%30%40%
020406080
JAN FEB MAR APR MAY JUN JUL AUG SEP OCT NOV DEC Y AVGJAN FEB MAR APR MAY JUN. JUL. AUG. SEP. OCT. NOV. DEC. Y. AVG.
2007 1Q08 2Q08 3Q08 4Q08 2008 1Q09 2Q09 3Q09 4Q09 2009% Utilization 88% 84% 85% 74% 75% 80% 52% 71% 71% 70% 66%
Utilization 2007 (LHS) Utilization 2008 (LHS) Utilization 2009 (LHS)
Petrochemical and Lube 100
120140160
500600700800
%Utilization 2007(RHS) %Utilization 2008(RHS) %Utilization 2009(RHS)
and Lube
020406080
0100200300400
18
00

2009 GRM & PTF
6Lube
Gross Refinery Margin$/BBL. MKT GRM A/C GRM$/BBL.
$/BBL
Gross Integrated MarginMKT GIM
2 1 2 0
2.5 1.7 2.01.8
3.9
0.9
3.9 4.03.1
1
2
3
4
5Refined
7.7 8.1 7 5 7 2810121416
PetchemRef ined
1.4-0.4
2.1 2.0 1.31.3
-1
0
1
3.90.9
3.9 4.0 3.1
3.8
4.7
4.2 3.5 4.1
7.75.6
7.5 7.2
02468
Product to Feed$/Ton MKT PTF A/C PTF$/Ton
01Q09 2Q09 3Q09 4Q09 2009
16
$/BBL A/C GIM
122
192 12679 130
92
149138
113123
150200250300350
StyrenicsOlefin
$ $
4.4 5.2
10.4 10.79.7
8.89.9
810121416 Petchem
Refined
78 129 144 129 120
122
050
100150
6.0 5.5 4.0 4.4 4.9
4.4 5.25.7 4.4 5.0
02468
19Note: Based on Production
01Q09 2Q09 3Q09 4Q09 2009

2009 Product Sales Value by Market
100%40,390 47,142 51,001 241,782
1% 1% 2% 1% 2%100%Unit:M.Baht Unit:M.Baht
Sales Proportion 244,694 166,036
Total Products Sales: Local vs Export47,873 163,33140,969 51,792
45%34% 35% 38% 34%
40%50%60%70%80%90%
75% 72% 75% 74% 72%
23% 27% 23% 25% 27%
40%50%60%70%80%90%
55%66% 65% 62% 66%
0%10%20%30%40%
4Q08 3Q09 4Q09 2008 2009
75% 72% 74% 72%
0%10%20%30%40%
4Q08 3Q09 4Q09 2008 2009
Petroleum Petrochemical Others
Unit:M Baht U it M B ht
Domestic Export
Oil products: Local vs Export Petrochemical products: Local vs Export
45%33% 34% 38% 33%
%70%80%90%
100%
43% 36% 37% 37% 36%
60%70%80%90%
100%
30,858 34,281Unit:M.Baht
9,532 12,861 12,158 Unit:M.Baht180,294 118,819 61,488 44,51238,843
55%67% 66% 62% 67%
10%20%30%40%50%60%
57% 64% 63% 63% 64%
10%20%30%40%50%60%
0%
4Q08 3Q09 4Q09 2008 2009Domestic Export
20
0%4Q08 3Q09 4Q09 2008 2009
ExportDomestic

2009 Petroleum Product Sales6 0 4
1,2004Q08 3Q09 4Q09
4 000
4,5002008 2009
M. Liters M. Liters Volume: M.Liters
1016
352
3
870
3 266
1
994
5
334
7
400
600
800
1,000
4,0
08
3,3
72
1 500
2,000
2,500
3,000
3,500
4,000
184
125
81
233
25
101
94
201
23 3
81
97 207
0
200
400
Diesel Mogas ATB/LR Naphtha Lube Others
718
1,3
50
422
379
849
833
1,0
32
287
380
780
0
500
1,000
1,500
Diesel Mogas ATB/LR Naphtha Lube Othersg / p
6
25,000
M. Baht
120,000
M. Baht Value: M.Baht
17,1
49
17,0
5 6
20,3
54
15,000
20,000 4Q08 3Q09 4Q09
105,6
44
60,000
80,000
100,000
2008 2009
2,93
5
738
,013
198
,825
6,72
6
3,76
8
,643
2,22
5
2,86
26,25
1
060
,441
2,50
8
3,22
9 5,000
10,000
18,4
31
22,2
48
8,5
10
12,8
35
12,6
276
1,5
71
20,2
17
13,6
46
4,5
33
8,5
58
10,3
02
20,000
40,000
21
3, 1 3, 23 1 2 25, 1 2 3
0
Diesel Mogas ATB/LR Naphtha Lube Others
22
0
Diesel Mogas ATB/LR Naphtha Lube Others

2009 Petrochemical Product Sales
100 000
120,000 4Q08 3Q09 4Q09
1 0400,000
450,0002008 2009
Tons Tons Volume: M.Tons
93,4
19
,589
109,
519
828 10
3,30
6
9,05
0 60,000
80,000
100,000
419,
771
11 03,5
00
2
408,
320
9 280
2
200,000
250,000
300,000
350,000
31,2
70
16,5
07
41,3
87
34,8
11 68
,
17,4
09
36,4
28
27,5
24
39,3
34
50,5
47
60,
16,7
64
38,4
28
23,6
76
40,1
59
45,6
33
5 9
14,2
16
-
20,000
40,000
HDPE CD1 ABS PP PS EPS Ol fi BTX Oth
140,
750
86,0
78
142,
559
191,
7 3 0
81,7
87153,
852
100,
590
145,
791
201,
789
234,
2
55,2
42
0
50,000
100,000
150,000
HDPE CD1 ABS PP PS EPS Ol fi BTX OthHDPE,CD1 ABS PP PS,EPS Olefin BTX Others HDPE,CD1 ABS PP PS,EPS Olefin BTX Others
5,000 4Q08 3Q09 4Q0925,000
M.Baht M.BahtValue: M.Baht
3,22
0
4,67
723
5 2,500 3,000 3,500 4,000 4,500
1
20,9
80
5,94
115,000
20,000 2008 2009
1,09
4
954
1,46
5 916
1,33
5
547
1,56
9
1,36
4
1,55
3
1,67
7
1,58
6 436
1,60
1
1,24
5
4,2
1,60
7
1,59
3
1,53
8
339
500 1,000 1,500 2,000
,
7,01
1
5,37
1
6,59
3
8,91
6
9,44
2
3,17
7
5,88
0
4,75
9
1 5
5,33
7
5,55
3
5,69
0
1,35
3
0
5,000
10,000
22
-
HDPE,CD1 ABS PP PS,EPS Olefin BTX Others
0
HDPE,CD1 ABS PP PS,EPS Olefin BTX Others

CAPEXCAPEX
23

2007-2012 Projects: Progress
As of December CAPEX Start Complete Progress
CHP Project
As of December 2009
CAPEX Amount
(Million USD)
Start Complete Progress
Phase I
Power Plant * 220 2Q07 1Q11 55%
Safety Improvement 39 2Q07 2011 49%
Total 259
Phase IIABS/SAN Expansion * 78 1Q10 1Q13
High voltage switch gear
New Reg_EURO IV n/a
Propylene Booster * 88 2009 2011
Total 166
Progressing
Grand Total 425
* Note: Projects financed by THB 10 000 local bank term loan
24
Note: Projects financed by THB 10,000 local bank term loan
Demineral water plant - Equipment

Financial P fFinancial Performance
25

Financial HighlightsUnit: Million Baht 4Q09 4Q08 %YoY 3Q09 %QoQ 2009 2008 %YoYSales 51,792 40,969 26.4% 47,874 8.2% 166,036 244,694 -32.1%Net Sales 46,329 39,682 16.8% 42,595 8.8% 149,747 237,319 -36.9%Cost of Goods Sold (44,384) (57,195) (22.4) (38,711) 14.7 (141,657) (242,294) (41.5) Cost of Goods Sold (44,384) (57,195) (22.4) (38,711) 14.7 (141,657) (242,294) (41.5) Gross Profit 1,945 (17,513) 111.1% 3,884 -49.9% 8,090 (4,974) 262.6%Gross Margin 4.2% -44.1% 9.1% 5.4% -2.1%Other Revenue (12) 548 35 107 1,253 SG&A (1,232) (1,594) -22.7% (827) 48.9% (3,514) (4,468) -21.3%EBITDA before LCM 701 (18,558) 103.8% 3,092 -77.3% 4,683 (8,189) 157.2%EBITDA Margin 1.5% -46.8% 7.3% 3.1% -3.5%LCM 34 (416) 34 5,045 (5,045) EBITDA after LCM 735 (18,974) 103.9% 3,126 -76.5% 9,728 (13,234) 173.5%Depre & Amort (851) (784) (855) (3 336) (3 224)Depre. & Amort. (851) (784) (855) (3,336) (3,224) EBIT (116) (19,758) 99.4% 2,271 -105.1% 6,392 (16,458) 138.8%Net Financial Expenses (296) (349) (323) (1,280) (1,235) Pretax Profit (411) (20,107) 98.0% 1,948 -121.1% 5,112 (17,693) 128.9%Taxes 4 7 (23) (51) (41) ( ) ( ) ( )Net Profit before Extra. (407) (20,100) 98.0% 1,925 -121.2% 5,061 (17,734) 128.5%Doubtful Account (7) 19 (5) (0) (25) FX. Gain/(Loss), Swap (149) (210) 169 (188.2) 263 514 (48.9) Investment Gain (Loss) (106) (341) 210 357 (1,154) Asset Gain (Loss) (258) 49 3 (256) 148Asset Gain (Loss) (258) 49 3 (256) 148 Other Expenses (1) (1) (2) (9) (12) Net Profit (928) (20,585) 95.5% 2,300 -140.4% 5,416 (18,262) 129.7%No. Share (M.) 19,829 19,706 19,719 19,829 19,706 Norm. EPS (0.02) (1.02) 0.10 0.26 (0.90) EPS (0 05) (1 04) 0 12 0 27 (0 93)
26
EPS (0.05) (1.04) 0.12 0.27 (0.93) BV 3.63 3.51 3.67 3.63 3.51

Balance Sheet:
Cash &133,175 Unit: Million Baht
Interest Bearing Debt
Cash & S/T Investment 114,194
104,112
Other LiabilitiesOther Assets
EquitiesPP & E
Treasury policy :
Net Debt/Equity < 1.0x
N t D bt/EBITDA < 2 0
Current Status
= 0.31x
2 26
27
Net Debt/EBITDA < 2.0x = 2.26x
Note: EBITDA after LCM

Key Financial Ratios
4Q09 4Q08 3Q09 2009 2008
Liquidity & Leverage Ratio (Times)Quick Ratio 1.18 1.43 0.86 1.18 1.43 Total IBD / Equity 0.39 0.38 0.37 0.39 0.38 Net IBD / Equity 0.31 0.25 0.26 0.31 0.25 Liabilities / Equity 0.59 0.50 0.62 0.59 0.50 Net IBD / EBITDA 2.26 N/A 1.59 2.26 N/AIBD / EBITDA 2 86 N/A 2 21 2 86 N/AIBD / EBITDA 2.86 N/A 2.21 2.86 N/AEBITDA / Interest Exp. 2.33 N/A 9.65 7.23 N/A
Profitability RatioyGross Profit Margin 4.2% N/A 9.1% 5.4% N/AEBITDA Margin 1.5% N/A 7.3% 3.1% N/ANet Profit Margin N/A N/A 5.4% 3.6% N/AROE 10 0% N/A 11 % 10 0% N/AROE 10.0% N/A 11.7% 10.0% N/AROCE 7.2% N/A 8.5% 7.2% N/A
28Note: EBITDA after LCM
Key Hi hli htKey Highlights
29

Phoenix Site Map:HDPE
140 KTAPP
475 KTA
Ethylene Plant596 KTA
HDPE/PPCatalyst
HDPE140 KTA
#17#5
#1GRIFFIN
#6
#7
#3
ABS/SAN96 KTA
CD157 KTA
475 KTA596 KTA
POLYOL25 KTA
PORT & TANK
#1096 KTA
PS100 KTA
BTX 600 KTA
EBSM200 KTA
61 KTA
60 KTA#4 REAL ESTATE
#12
#11
EPS30 KTA
CCM19 KTA
60 KTA
Clean Diesel/ G li
#9
REAL ESTATE
#13
#14
DCCGasoline
PE Expansion(UHMWHDPE or Multimodal)
DCC/ PP /
#3
#2
#14
#15
#16
LUBE33 KBD VAM /
VAM Derivatives
CPP PP DerivativesLUBE
33 KBD#18
TRADING
#8
30
Power PlantPower 108 MWSteam 200 MT #19

Initiatives & Impacts
Petrochem Petroleum Port & Tank Real Estate & Services
Operational Efficiency Improvement
Liquid Port Efficiency & Safety
Petrochem Operation & Energy Efficiency
Petroleum Operation & Energy Efficiency Supply Chain Optimization
21
Asset Utilization Enhancement
IRPC Green Industrial Build & Sustain
Ethylene Specialty Development
Optimization Inventory Optimization Maximize Tank
Efficiency & Utilization
3
Enhancement
Product & Services
Build & Sustain Rayong Land Develop Jana for the South
HDPE, PE, PP Catalyst Commercialization Trading
Lube Group 1 Specialty Products Focus P t l Q lit
Dry Port Commercialization
Improvement Petroleum Quality improvement to EURO IV standard
Professionalize M&E Service Offerings
Ethylene Specialty Development EBSM Upgrading for ABS Specialty
4
Capacity & Products Expansion
for ABS Specialty Vinyl Acetate Monomer (VAM)
1 201431
2010 2014Approved projects
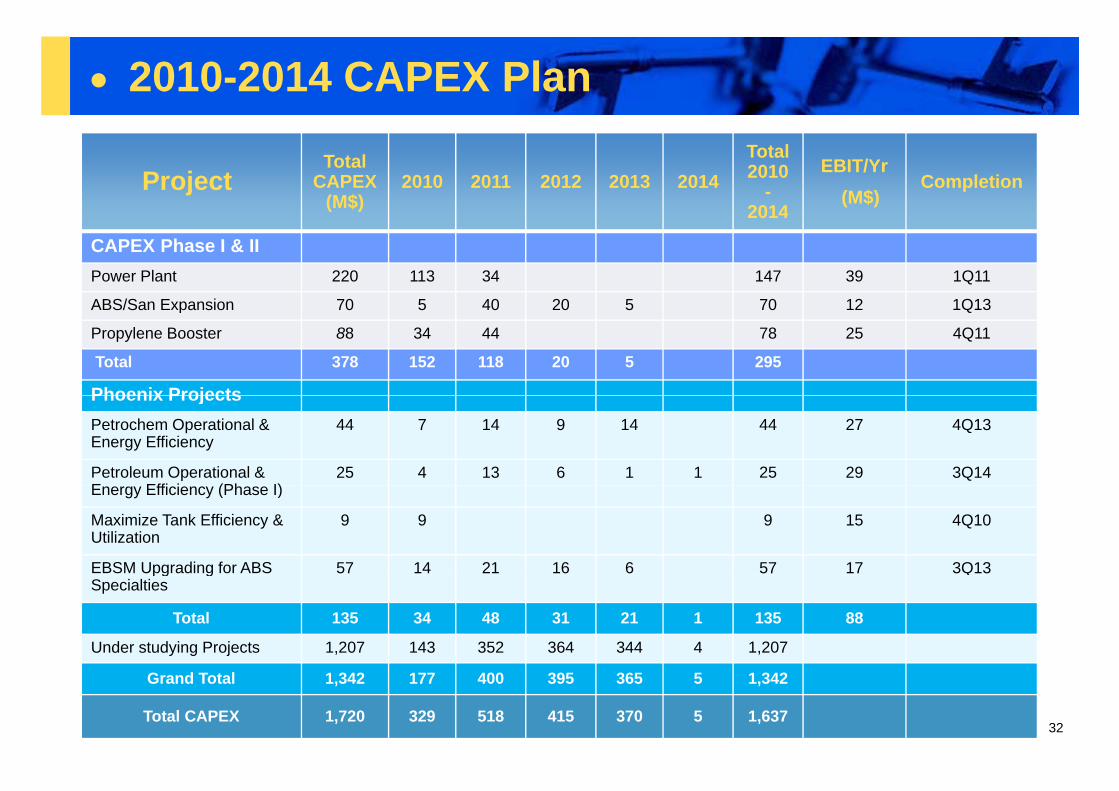
2010-2014 CAPEX Plan
ProjectTotal
CAPEX (M$)
2010 2011 2012 2013 2014Total 2010
-2014
EBIT/Yr (M$)
Completion2014
CAPEX Phase I & IIPower Plant 220 113 34 147 39 1Q11
ABS/San Expansion 70 5 40 20 5 70 12 1Q13ABS/San Expansion 70 5 40 20 5 70 12 1Q13
Propylene Booster 88 34 44 78 25 4Q11
Total 378 152 118 20 5 295
Phoenix ProjectsPhoenix ProjectsPetrochem Operational & Energy Efficiency
44 7 14 9 14 44 27 4Q13
Petroleum Operational & E Effi i (Ph I)
25 4 13 6 1 1 25 29 3Q14Energy Efficiency (Phase I)
Maximize Tank Efficiency & Utilization
9 9 9 15 4Q10
EBSM Upgrading for ABS 57 14 21 16 6 57 17 3Q13pg gSpecialties
Total 135 34 48 31 21 1 135 88
Under studying Projects 1,207 143 352 364 344 4 1,207
32
Grand Total 1,342 177 400 395 365 5 1,342
Total CAPEX 1,720 329 518 415 370 5 1,637

Transformation Roadmap
Top Quartile Integrated Petrochemical Complex in Asia by 2014
2015 onwards
2011-2014
2010-2011 “Investment for utilization and
“Growth and expansion”
“Operational Excellence”
utilization and growth of existing businesses”
• Invest in new energy and petrochemical related businesses in
• Increase efficiency• Improve optimization• Effective procurement
• Debottleneck assets• Invest to commercialize
more• Invest in petrochemical
relevant/ transferable capabilities
• Effective procurement pfacilities
33

Investor Relations Contact : [email protected]. 02-649-7384-8, Fax. 02-649-7379
presentation is available atpresentation is available atwww.irpc.co.th
Click “Presentations”This presentation material has been prepared solely for informational purposes only. IRPC is furnishing it solely for use by prospective investors / analysts in the proposed event. IRPC makes no representations or warranties as to the accuracy or completeness of such information. By accepting this material each recipient agrees that IRPC shall not have any liability for any representations (express or implied) contained in, or for any omissions from this presentation.
The information contained herein does not purport to be all-inclusive or to contain all of the Information that may be material to the recipient’s decision. Each recipient of the information and data contained herein should perform its own independent investigation and analysis of the transaction and the
34
recipient of the information and data contained herein should perform its own independent investigation and analysis of the transaction and the creditworthiness of IRPC . Reference in this Disclaimer to this shall include references to the Appendices (if any) hereto.