analyst day presentations1.q4cdn.com/766430901/files/doc_presentations/2015/03...the company’s...
TRANSCRIPT

TSX: IMG NYSE: IAG
Analyst Day Presentation March 3, 2015
Cautionary Statement on Forward-Looking Information
All information included in this presentation, including any information as to the Company’s future financial or operating performance, and other statements that express management’s
expectations or estimates of future performance, other than statements of historical fact, constitute forward looking information or forward-looking statements and are based on
expectations, estimates and projections as of the date of this presentation. Forward-looking statements contained in this presentation include, without limitation, statements with respect to:
the Company’s guidance for production, cash costs, all-in sustaining costs, depreciation expense, effective tax rate, and operating margin, capital expenditures, operations outlook, cost
management initiatives, development and expansion projects, exploration, the future price of gold, the estimation of mineral reserves and mineral resources, the realization of mineral
reserve and mineral resource estimates, the timing and amount of estimated future production, costs of production, permitting timelines, currency fluctuations, requirements for additional
capital, government regulation of mining operations, environmental risks, unanticipated reclamation expenses, title disputes or claims and limitations on insurance coverage. Forward-
looking statements are provided for the purpose of providing information about management’s current expectations and plans relating to the future. Forward-looking statements are
generally identifiable by, but are not limited to the, use of the words “may”, “will”, “should”, “continue”, “expect”, “antic ipate”, “estimate”, “believe”, “intend”, “plan”, “suggest”, “guidance”,
“outlook”, “potential”, “prospects”, “seek”, “targets”, “strategy” or “project” or the negative of these words or other variations on these words or comparable terminology. Forward-looking
statements are necessarily based upon a number of estimates and assumptions that, while considered reasonable by management, are inherently subject to significant business,
economic and competitive uncertainties and contingencies. The Company cautions the reader that reliance on such forward-looking statements involve risks, uncertainties and other
factors that may cause the actual financial results, performance or achievements of IAMGOLD to be materially different from the Company’s estimated future results, performance or
achievements expressed or implied by those forward-looking statements, and the forward-looking statements are not guarantees of future performance. These risks, uncertainties and
other factors include, but are not limited to, changes in the global prices for gold, copper, silver or certain other commodities (such as diesel and electricity); changes in U.S. dollar and
other currency exchange rates, interest rates or gold lease rates; risks arising from holding derivative instruments; the level of liquidity and capital resources; access to capital markets,
and financing; mining tax regimes; ability to successfully integrate acquired assets; legislative, political or economic developments in the jurisdictions in which the Company carries on
business; operating or technical difficulties in connection with mining or development activities; laws and regulations governing the protection of the environment; employee relations;
availability and increasing costs associated with mining inputs and labour; the speculative nature of exploration and development, including the risks of diminishing quantities or grades of
reserves; adverse changes in the Company’s credit rating; contests over title to properties, particularly title to undeveloped properties; and the risks involved in the exploration,
development and mining business. With respect to development projects, IAMGOLD’s ability to sustain or increase its present levels of gold production is dependent in part on the success
of its projects. Risks and unknowns inherent in all projects include the inaccuracy of estimated reserves and resources, metallurgical recoveries, capital and operating costs of such
projects, and the future prices for the relevant minerals. Development projects have no operating history upon which to base estimates of future cash flows. The capital expenditures and
time required to develop new mines or other projects are considerable, and changes in costs or construction schedules can affect project economics. Actual costs and economic returns
may differ materially from IAMGOLD’s estimates or IAMGOLD could fail to obtain the governmental approvals necessary for the operation of a project; in either case, the project may not
proceed, either on its original timing or at all.
For a more comprehensive discussion of the risks faced by the Company, and which may cause the actual financial results, performance or achievements of IAMGOLD to be materially
different from the company’s estimated future results, performance or achievements expressed or implied by forward-looking information or forward-looking statements, please refer to the
Company’s latest Annual Information Form, filed with Canadian securities regulatory authorities at www.sedar.com, and filed under Form 40-F with the United States Securities Exchange
Commission at www.sec.gov/edgar.html. The risks described in the Annual Information Form (filed and viewable on www.sedar.com and www.sec.gov/edgar.html, and available upon
request from the Company) are hereby incorporated by reference into this presentation.
The Company disclaims any intention or obligation to update or revise any forward-looking statements whether as a result of new information, future events or otherwise except as
required by applicable law.
All monetary amounts are in US dollars, unless otherwise indicated.
2

Changing the Game
3
Strong
Exploration
Pipeline
Operational
Excellence
Sale of
Niobec
Financial
Flexibility

IAMGOLD’s Gold Assets
Four Operating Gold Mines:
2015 Production Guidance 820k – 860k oz. 4

Growth Strategy
5
Optimize Returns from Existing Mines
Pursue M&A and JV Opportunities
Advance Exploration

Poised for Growth
6
Lower
Costs
>$800 M
Cash Lower
CAPEX

Total Cash Costs –gold mines Average Realized Gold Price
All-In Sustaining Costs1,2,3 Drop $209/oz. in 2014
1,230 1,186
1,124 1,115
1,021
1,273 1,286 1,288 1,272 1,201
0
200
400
600
800
1,000
1,200
1,400
Q4 2013 Q1 2014 Q2 2014 Q3 2014 Q4 2014
`
All figures in $/oz. sold
7
1 This is a non-GAAP measure. Refer to the non-GAAP performance measures section of the MD&A for reconciliation to GAAP.
2 In the third quarter 2014, we began including the income from our Diavik royalty as an offset to operating costs in the calculation of this measure. Previous periods were revised for comparability.
3 Gold mines, as used with total cash costs and all-in sustaining costs, consist of Rosebel, Essakane, Westwood (commercial production), Mouska, Sadiola and Yatela on an attributable basis.
3 1 1

Disciplined Capital Spending
$230M*
0
100
200
300
400
500
600
700
800
2013 2014 2015 Guidance
Development /Expansion
Sustaining$325M $
M
$669M
8
* +/- 10%
54% of the decrease
from 2014 to 2015 due
to reduced spending on
gold assets; balance
due to sale of Niobec
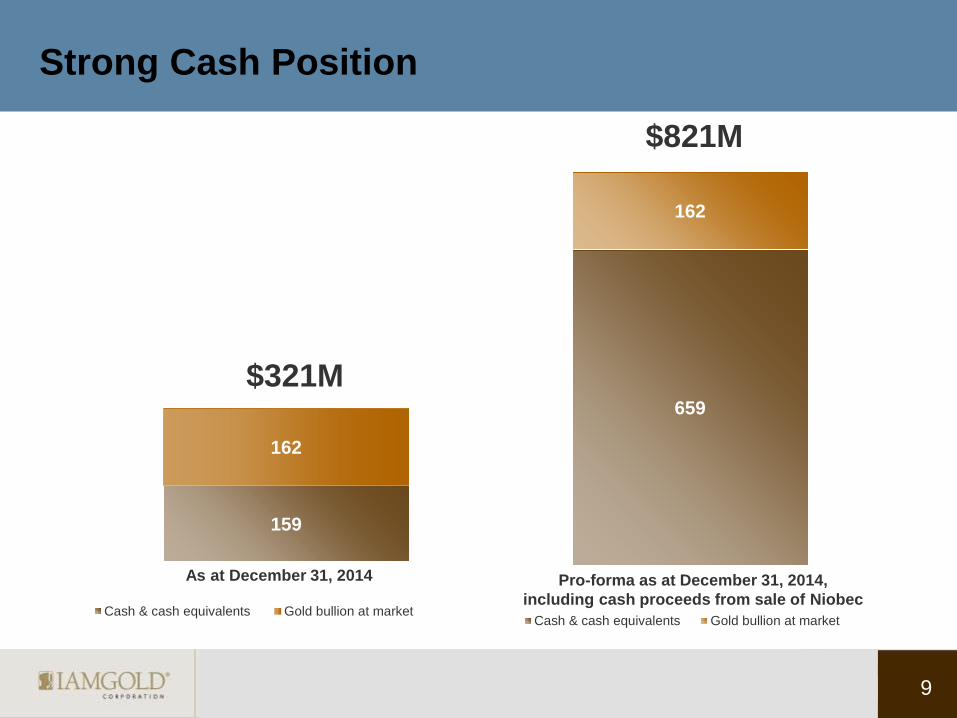
159
162
Cash & cash equivalents Gold bullion at market
659
162
Cash & cash equivalents Gold bullion at market
$321M
$821M
Strong Cash Position
Pro-forma as at December 31, 2014,
including cash proceeds from sale of Niobec
As at December 31, 2014
9

500
230
270
Proceeds from NiobecSale
2015 Capex Guidance Remainder*
10
$ M
167
• M&A and Joint Ventures
• Additional CAPEX
• Bond repurchase
• Combination of above
*$50M balance can be kept
Priorities for Use of Proceeds from Sale of Niobec
Options

Acquisition Criteria
11
Predominantly gold
Producing or near-producing mine
Minimum production of 100k oz./year
Attractive grades
Lower costs
Good mining jurisdiction

Exploration
12

13
Brownfields: discover satellite deposits and deposit extensions to enhance
and extend existing operations (Essakane & Rosebel – Oxide)
Greenfields: discover or acquire undeveloped gold deposits capable of
producing +100koz of gold (or gold equivalent) per year for 10 years at cash
costs lower than IAMGOLD’s average cash costs, while minimizing capital
intensity.
Outcomes:
3 greenfield discoveries in the last 3 years
4 deposits / prospects in delineation with resource updates expected
Boto Gold, Siribaya - Diakha, Pitangui & Côté
6 active discovery stage JVs
Exploration Vision & Mandate

14
Exploration Program & Budget ($ millions)
Category 2013 2014 2015
Greenfield 28.2 34.6 26.0
Brownfield / Near Mine 41.2 22.0 20.0
Subtotal 69.4 56.6 46.0
Studies 24.2 12.3 10.0
Total 93.6 68.9 56.0
Change (YoY) -36% -26% -19%
220,000 – 240,000 m of resource development &
exploration drilling planned (2015)

Project Comparisons in West Africa, Europe and the Americas
15
Gra
de A
u (
g/t
) –
Lo
gari
thm
ic S
ca
le
Contained Au (Moz, Resources) – Logarithmic Scale
Westwood 11 g/t Au
Pitangui 4.9 g/t Au
10
Cote 0.9 g/t Au
Sadiola (100%) 1.8 g/t Au sulphide
Boto 1.7 g/t Au
Monster
>12 g/t Au
Brucejack
Borden
Rainy River
Magino, Bombore
Blackwater
Morelos
Hardrock
Fekola
Yaramoko
Hounde
Karma
exploration
exploration
exploration
2
20
1
IMG Operation (at 100% IMG)
IMG Development, Resource & Exploration Project
Competitor Advanced-Development Project
Sources: SNL Feb. 2015 & IMG Dec. 31, 2014 R & R Statement
0.2
0.5 5 50 1 2 10 20
IAMGOLD’s projects have the potential to rank among the best (n=359)
Essakane 1.2 g/t Au
5
Rosebel 1.0 g/t Au 0.5
Ellipse = 75% of deposits
Major axis = 1.1 g/t Au
Minor axis = 2.25 Moz
100
16
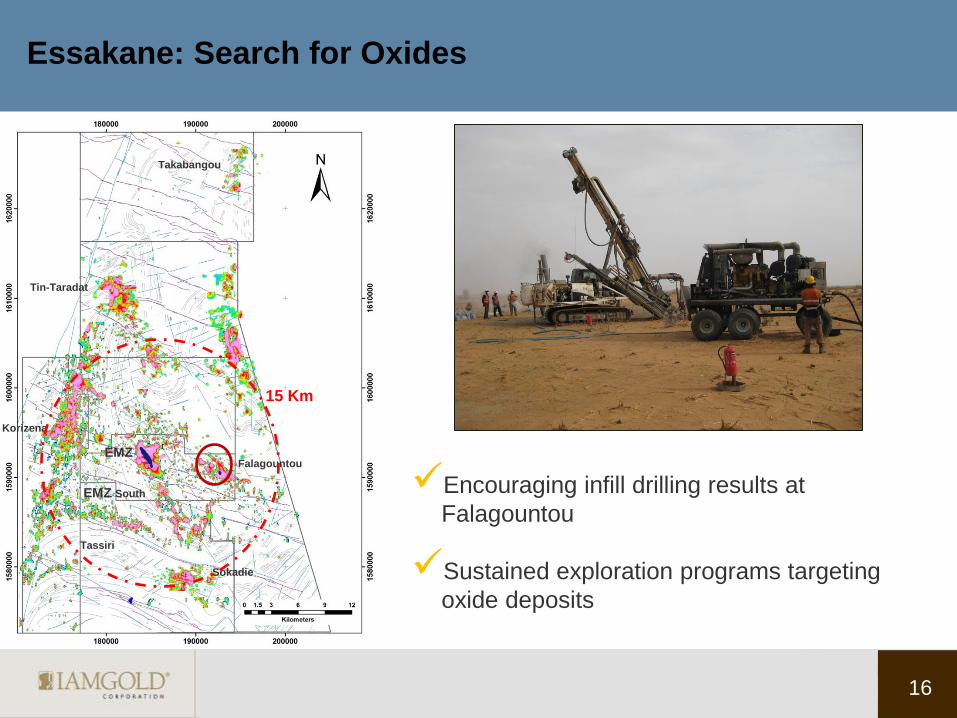
Essakane: Search for Oxides
Korizena
Falagountou
Tassiri
EMZ
Sokadie
EMZ South
Tin-Taradat
Takabangou
15 Km
Encouraging infill drilling results at
Falagountou
Sustained exploration programs targeting
oxide deposits

17
Falagountou
1589600 mN
1589800
1590200
1591000
1590600
19
24
00
19
28
00
19
32
00
Current Pit Shell
Potential Extended Pit Shell
(from 2014 Drilling Program)
LEGEND
Gold Mineralization
Drill Holes
Satellite deposit – 8 kms from
Essakane mill
Probable Reserves:
250Koz @ 1.34 g/t Au
Resources:
M&I - 330Koz @1.38 g/t Au
Inf - 190Koz @ 1.27 g/t Au
Falagountou reserves and resources included in Essakane reserve and resource statement
as at December 31, 2014 (see IMG news release Feb 19, 2015)
A B
C D

18
Falagountou 2014 Infill Drilling Program
W E
19
2 4
00
mE
200m
100m
19
2 8
00
mE
19
2 6
00
mE
19
3 0
00
mE
FDD00
33
FRC09
19
MFD
D00
86
FRC09
20
FRC09
21
MFD
D01
05
FRC04
90
MFD
D00
93
MFD
D00
34
FRC07
95
MFD
D00
91
FRC07
96
FRC09
37
FRC17
60
MFR
C02
11
FRC17
44
MFD
D00
35
MFR
C02
45
MFR
C02
47
MFR
C02
49
X-Section 1590 325 N
6/1.3
4/0.8
3/0.6
Actual Pit Shell (250Koz)
Previous Drill Hole
Gold Mineralization
Diorite Intrusive
Sedimentary Rocks
LEGEND
2014 Drill Hole Mineralization intersected below pit shell
A B

19
Falagountou 2014 Infill Drilling Program
Actual Pit Shell (250Koz)
Previous Drill Hole
Gold Mineralization
Diorite Intrusive
Sedimentary Rocks
LEGEND
2014 Drill Hole
W E
19
2 4
00
mE
200m
100m
19
2 8
00
mE
19
2 6
00
mE
19
3 0
00
mE
FRC06
49
MFR
C00
06
FRC05
68
MFD
D00
94
MFR
C00
05
MFD
D01
01
MFR
C02
43
FRC05
69
FDD00
38
FRC05
70
MFR
C00
08
FRC06
39
MFR
C00
02
MFR
C02
29
MFR
C02
36
MFR
C02
34
MFR
C02
39
X-Section 1590 200 N
Mineralization intersected below pit shell
C D

20
Falagountou Drill Core With Visible Gold

21
West Africa Greenfield Project Highlights
Siribaya JV
Boto
Regional Endowment – Mines
Sadiola - 11.3 Moz
Yatela - 2.1 Moz
Syama - 6.4 Moz
Morilla - 5.8 Moz
Tabakoto - 2.7 Moz
Loulo - 11.4 Moz
Sabodala - 2.7 Moz

22
Quantity
(Mt)
Grade
(g/t Au)
Au Metal
(Koz)
Quantity
(Mt)
Grade
(g/t Au)
Au Metal
(Koz)
RPA
April 19,
2013
22.0 1.62 1,142 1.9 1.35 81
IMG
Dec. 31,
2014
22.8 1.68 1,231 11.0 1.80 635
Total resources have increased by ~100Koz (indicated) and 550koz (inferred)
Malikoundi hosts 81% of total resources grading 1.76 - 1.91 g/t Au
General observations
Recent drill holes not included in current resource estimate
High grade plunge open at depth
Whittle shell extends to base of block model - potential for further resource increase
Boto Gold, Senegal: Updated Resource Estimate

Indicated resource grew in 2014 to 1.2 Moz. at 1.7 g/t Au
from July 2013 initial estimate of 1.1 Moz at 1.6 g/t Au
Inferred resource grew by 550k oz. to 635k oz. at 1.8 g/t Au
February 2015 – final assay results continue to show wide
intervals of high-grade mineralization at the Malikoundi
deposit. Highlights included:
› 9m at 10.5 g/t Au (includes 5m at 17.55 g/t Au)
› 44m at 4.46 g/t Au (includes 6m at 14.46 g/t Au)
› 40m at 3.25 g/t Au (includes 11m at 8.15 g/t Au)
› 61m at 2.91 g/t Au (includes 4m at 12.28 g/t Au)
Plan to complete 50m x 50m infill delineation campaign in
2015 and to incorporate results into updated resource model
Source: Updated Resource Estimate for Boto Gold, effective December 31, 2014.
Note: CIM Definitions were followed for classification of Mineral Resources. Mineral Resources are estimated at a cut-off grade of
0.60 g/t Au. Mineral Resources are estimated using a gold price of US$1,500 per ounce . High grade assays are capped at 15 g/t
Au to 30 g/t Au depending on geological area. Bulk density varies from 1.61 g/cm3 to 2.62 g/cm 3 based on weathering code. The
Mineral Resource Estimate is constrained by a Whittle Pit shell. Mineral Resources are not Mineral Reserves and do not yet have
demonstrated economic viability, but are deemed to have a reasonable prospect of economic extraction. Numbers may not add
due to rounding. Mineral Resources are reported on a 100% ownership basis.
Boto Gold : Malikoundi Drill Results
23
Deposit
Open
A
B
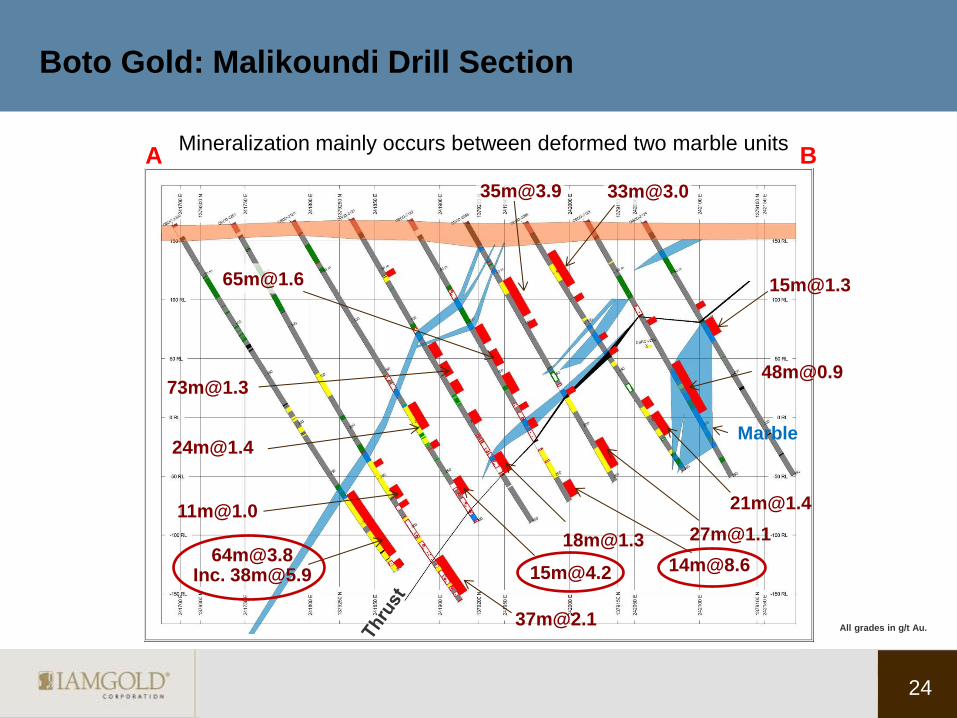
24
Mineralization mainly occurs between deformed two marble units
Marble
Boto Gold: Malikoundi Drill Section
[email protected] Inc. [email protected]
A B
All grades in g/t Au.

25 25
Boto Gold: Malikoundi High Grade Potential
DDH No. From (m) To (m) Interval (m) g/t Au
2200
280 318 38 5.85
2202 320 329 9 6.38
2203 269 285 16 7.73
2218 194
213
349
201
223
353
7
10
4
15.92
11.43
12.62
2222 12
36
23
39
11
3
29.49
24.79
2225 238
367
241
372
3
5
14.44
11.34
2226 179 190 11 8.15
2227 112 116 4 12.28
2232 176
239
183
244
7
5
8.72
12.42

26
Boto Gold: High Grade Infill Drill Intersection

27
Boto Gold: High Grade Infill Drill Intersection

28
Boto Gold: Typical Mineralization
Pyrite
Albite-hematite crackle breccia with Qtz-tourmaline and sulphide mineralization
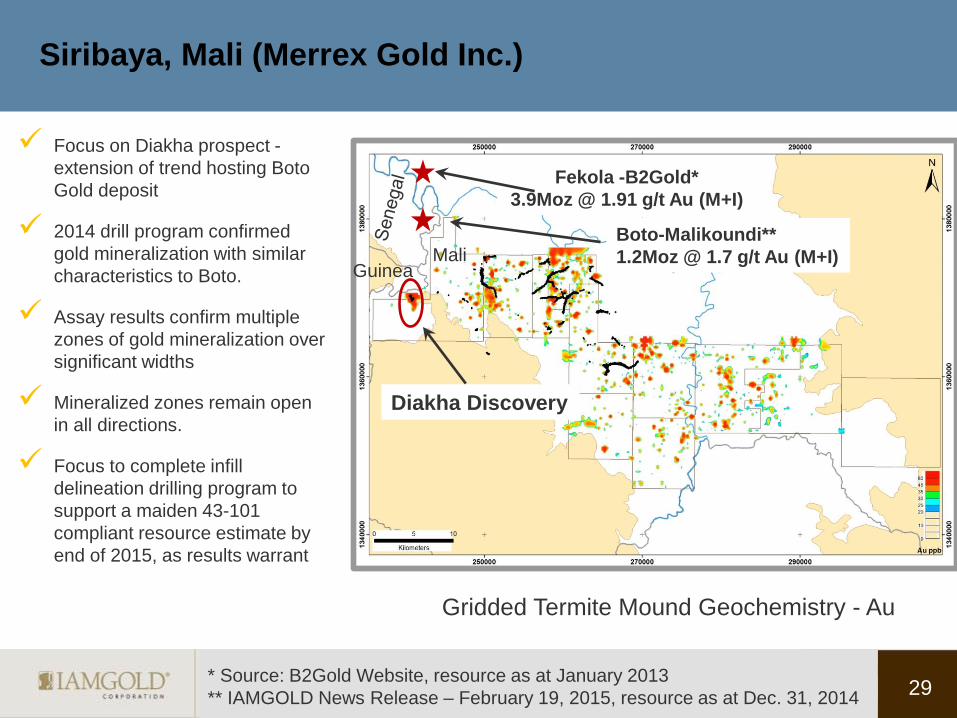
Siribaya, Mali (Merrex Gold Inc.)
Focus on Diakha prospect -
extension of trend hosting Boto
Gold deposit
2014 drill program confirmed
gold mineralization with similar
characteristics to Boto.
Assay results confirm multiple
zones of gold mineralization over
significant widths
Mineralized zones remain open
in all directions.
Focus to complete infill
delineation drilling program to
support a maiden 43-101
compliant resource estimate by
end of 2015, as results warrant
29
Gridded Termite Mound Geochemistry - Au
Mali Guinea
Fekola -B2Gold*
3.9Moz @ 1.91 g/t Au (M+I)
Boto-Malikoundi**
1.2Moz @ 1.7 g/t Au (M+I)
Diakha Discovery
* Source: B2Gold Website, resource as at January 2013
** IAMGOLD News Release – February 19, 2015, resource as at Dec. 31, 2014

RC-448: 4.55 g/t Au / 8m
DD-148: 4.85 g/t Au / 34m
incl: 7.31 g/t Au / 19m
RC-445: 3.22 g/t Au / 34m
& 2.06 g/t Au / 16m
DD-146: 10.99 g/t Au / 12m
DD-145: 4.31 g/t Au / 21m
RC-421: 3.03 g/t Au / 26m
RC-489: 2.36 g/t Au / 24m
Area of mineralization
& artisanal mining
Discovered in 2014
Termite Au anomaly
Artisanal mining
Multiple zones of mineralization
over an 800m x 400m area
Mineralization open at depth
and along strike
Infill drilling program in progress
Resource estimate planned
Siribaya: Diakha Discovery - Drill Hole Plan Map & Results
A
B
30

2.06 g/t Au / 16m
3.22 g/t Au / 34m
4.85 g/t Au / 34m
Incl: 7.31 g/t Au / 19m
Siribaya: Diakha Drill Section
4.91 g/t Au / 4m
1.75 g/t Au / 8m
0.95 g/t Au / 10m
2.18 g/t Au / 8m
A B
31
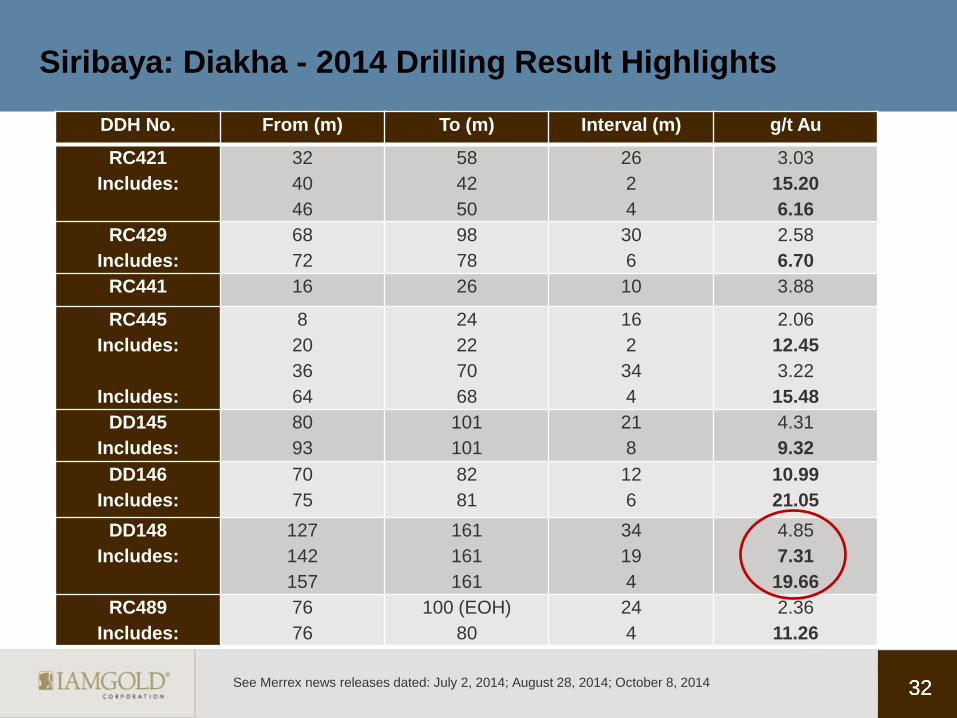
32 32
Siribaya: Diakha - 2014 Drilling Result Highlights
DDH No. From (m) To (m) Interval (m) g/t Au
RC421
Includes:
32
40
46
58
42
50
26
2
4
3.03
15.20
6.16
RC429
Includes:
68
72
98
78
30
6
2.58
6.70
RC441 16 26 10 3.88
RC445
Includes:
Includes:
8
20
36
64
24
22
70
68
16
2
34
4
2.06
12.45
3.22
15.48
DD145
Includes:
80
93
101
101
21
8
4.31
9.32
DD146
Includes:
70
75
82
81
12
6
10.99
21.05
DD148
Includes:
127
142
157
161
161
161
34
19
4
4.85
7.31
19.66
RC489
Includes:
76
76
100 (EOH)
80
24
4
2.36
11.26
See Merrex news releases dated: July 2, 2014; August 28, 2014; October 8, 2014

33
Siribaya: Diakha - Drill Hole SRD14-148: 34m Grading 4.85 g/t Au
1.56g/t
1.06g/t
7.93g/t
8.15g/t
51.0g/t
11.55g/t
0.36g/t
VG
157 m – 161m: 19.66 g/t Au

Infill drilling continues at Sâo Sebastiâo,
24,500m of diamond drilling completed in 2014
April 2014 –maiden inferred resource estimate
of 0.64 Moz at 4.88 g/t Au
June 2014 – confirmed continuity of known
resource / identified new high-grade
intersections in second zone
Ongoing delineation drilling focused on infill and
expansion of current resource and identification
of additional targets
Airborne EM geophysical survey during Q4’14
identified conductive targets to be prioritized in
future drilling programs
Assay results from H2’14 drilling campaign to be
included in updated resource model
Source: Updated Resource Estimate for Pitangui, effective January 9,2014. Note: CIM Definitions were followed for classification of Mineral Resources. Mineral Resources are estimated at a cut-
off grade of 3.0 g/t Au. Mineral Resources are estimated using a gold price of US$1,500 per ounce . High grade assays are capped at 10g/t Au to 15 g/t Au depending on geological area. Bulk
density, as determined from 2,570 measurements, varies from 3.06 g/cm3 to 3.24 g/cm 3 based on geologic area. Mineral Resources are not Mineral Reserves and do not yet have demonstrated
economic viability, but are deemed to have a reasonable prospect of economic extraction. Numbers may not add due to rounding. Mineral Resources are reported on a 100% ownership basis.
34
Pitangui, Brazil
>40Moz Past
production

35
Pitangui: Current Resources & Exploration Target
TABLE 1: MINERAL RESOURCE STATEMENT, PITANGUI PROJECT, BRAZIL
Effective Date: January 9, 2014
Classification Deposit
Tons (000s)
Gold Grade (g/t Au)
Contained Ounces (Au) (000s)
Inferred São Sebastião 4,070 4.88 638
Notes: 1. CIM definitions were followed for classification of Mineral Resources. 2. Mineral Resources are estimated at a cut-off grade of 3.0 g/t Au. 3. Mineral Resources are estimated using a gold price of $1,500 per ounce. 4. High grade capped assay values vary from 10 g/t Au to 15 g/t Au based on geological area. 5. Bulk density, as determined from 2,570 measurements, varies from 3.06 g/cm
3 to 3.24 g/cm
3 based on
geological area.
6. Mineral resources are not mineral reserves and have not demonstrated economic viability. There is no certainty that all or any part of the mineral resource will be converted into mineral reserves.
Exploration Target Objective: 1.2 - 1.5 Moz grading 4.5 - 6.0 g/t Au
The potential quantity and grade is conceptual in nature. Insufficient exploration has been
completed to define a mineral resource and it is uncertain if a mineral resource will be delineated.
The exploration target objective is based on the exploration drilling results completed to date.

36 36
Pitangui
Area of Infill Drilling
(50m x 50m centers)
Deposit Open Up Plunge Infill Drilling
Program
37 37
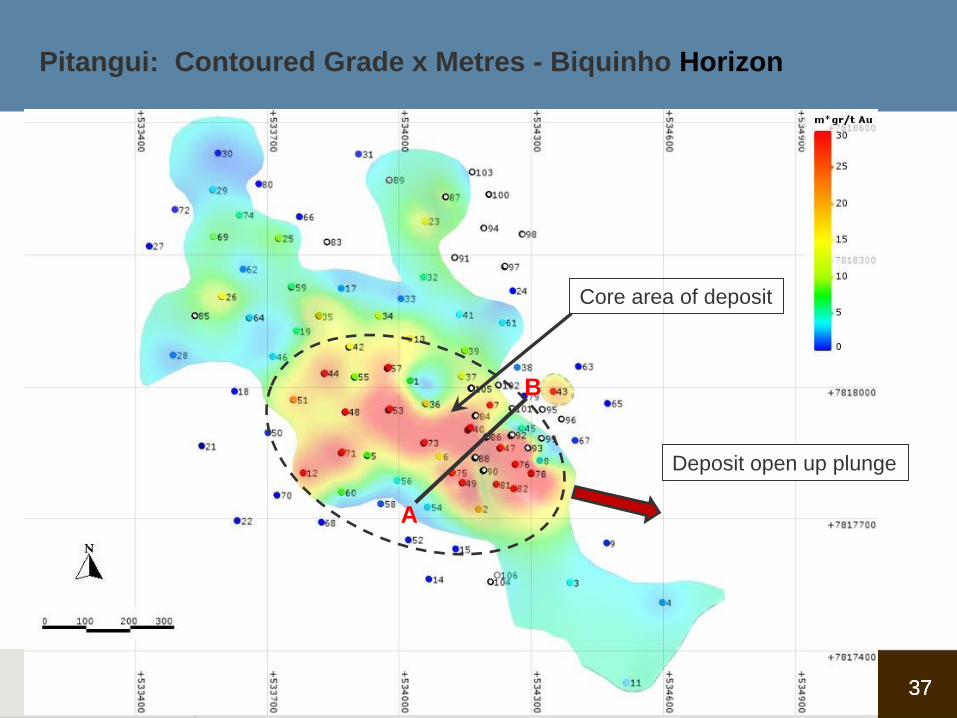
Pitangui: Contoured Grade x Metres - Biquinho Horizon
Deposit open up plunge
Core area of deposit
A
B
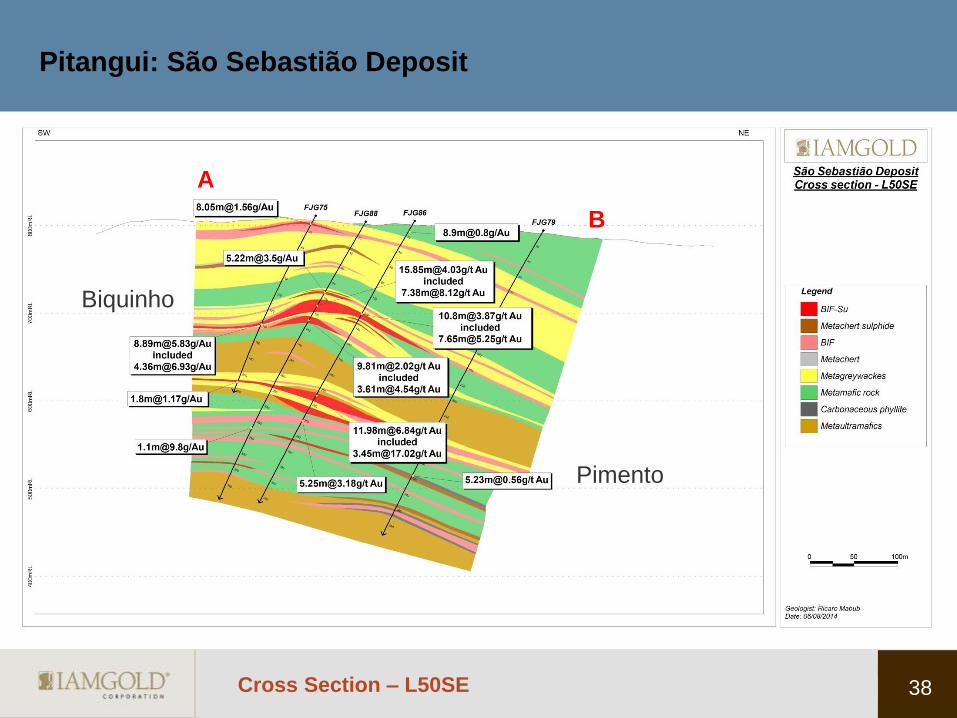
38 Cross Section – L50SE
Pitangui: São Sebastião Deposit
Biquinho
Pimento
A
B

39
Pitangui: Drill Hole FJG78: 9.73 g/t Au over 7.5m
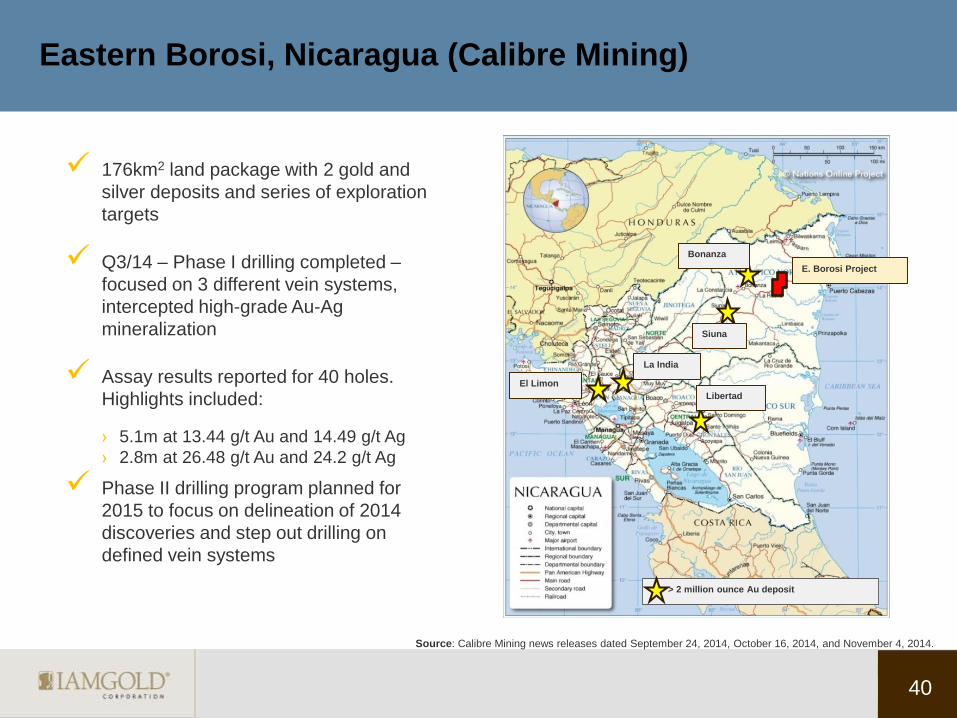
Eastern Borosi, Nicaragua (Calibre Mining)
176km2 land package with 2 gold and
silver deposits and series of exploration
targets
Q3/14 – Phase I drilling completed –
focused on 3 different vein systems,
intercepted high-grade Au-Ag
mineralization
Assay results reported for 40 holes.
Highlights included:
› 5.1m at 13.44 g/t Au and 14.49 g/t Ag
› 2.8m at 26.48 g/t Au and 24.2 g/t Ag
Phase II drilling program planned for
2015 to focus on delineation of 2014
discoveries and step out drilling on
defined vein systems
> 2 million ounce Au deposit
Bonanza
El Limon
Siuna
Libertad
La India
E. Borosi Project
40
Source: Calibre Mining news releases dated September 24, 2014, October 16, 2014, and November 4, 2014.

Eastern Borosi: 2014 Drill Highlights
41
GUAPINOL VEIN
GP14-002: 6.0 m @ 14.4 g/t Au;
GP14-003: 4.8 m @ 25.7 g/t Au
GP14-028: 5.1 m @ 13.4 g/t Au
GP14-030: 2.8 @ 26.5 g/t Au
Vancouver VEIN
GP14-010: 6.5 m @ 16.9 g/t Au
BLAG VEIN
BL14-005: 6.4 m @ 4.1 g/t Au;
235.9 g/t Ag
Base map from Calibre Mining Corp
RISCOS de ORO VEIN (ext.)
RD14-038: 1.6 m @ 4.4 g/t Au
and 402 g/t Ag
Epithermal Au-Ag vein systems
Multiple veins identified at surface
Minimal historical drilling
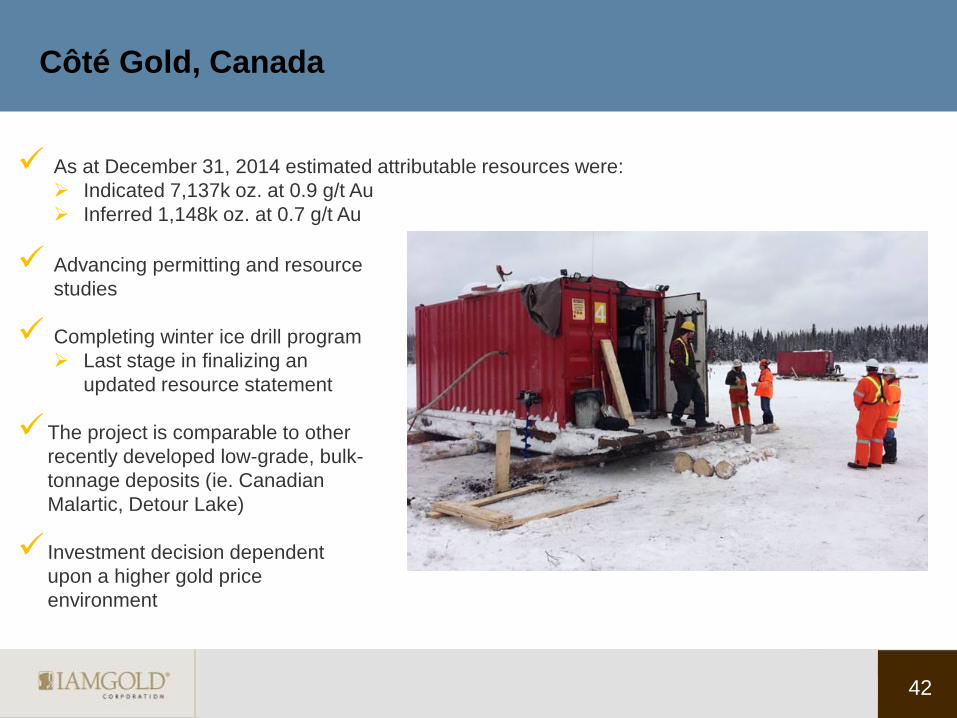
Côté Gold, Canada
42
Advancing permitting and resource
studies
Completing winter ice drill program
Last stage in finalizing an
updated resource statement
The project is comparable to other
recently developed low-grade, bulk-
tonnage deposits (ie. Canadian
Malartic, Detour Lake)
Investment decision dependent
upon a higher gold price
environment
As at December 31, 2014 estimated attributable resources were:
Indicated 7,137k oz. at 0.9 g/t Au
Inferred 1,148k oz. at 0.7 g/t Au

Westwood
Monster Lake
Monster Lake, Canada (TomaGold Corporation)
Excellent location in Abitibi Greenstone
belt
High-grade intervals (25 to +30 g/t Au)
from previous drilling
2014 diamond drilling program of
12,761m on tested targets along 4km
mineralized corridor
› Confirmed presence of high-grade
mineralization at depth and identified
several new gold-bearing structures
February 2015, reported assay results
from 17 of 26 holes in drill program.
Highlights included:
› 9.18m at 46.33 g/t Au
› (including 2.2m at 182.8 g/t Au)
› 3.42m at 18.68 g/t Au
› 7.1m at 6.74 g/t Au
43
Sedimentary rocks

44
Black quartz vein
Zone Megane-325 Outcrop
Erratix Showing
Monster Lake: High Grade Shear Hosted Mineralization
Graphitic tuff - sulphides
High grade shear zone
hosted Quartz veins
Drilling has confirmed 325
zone extends from surface
to > 400m & remains open
Shear Zone: graphite &
sulphides (i.e. conductive)
VG

ML-14-114
ML-14-132 ML-14-115
ML-14-108
ML-14-118
ML-14-130
ML-14-112 ML-14-113
ML-14-110
ML-14-111 ML-14-116
ML-14-133
ML-14-125
ML-14-109
ML-14-128
ML-14-117
ML-14-119
ML-14-120
Metal Factor
(g/t * m.t.w)
0 to 5
5 to 10
10 to 20
20 to 50
50 to 100
+ 100
Hole number
Au g/t / True Width (m)
6.74 g/t Au / 7.10 m
3.15 g/t Au / 3.64 m
325-Megane Zone lens
Historical Drilling
Monster Lake: 2014 Fall Drill Program – Final Results
300m
200m
100m
0m
-100m
-200m Vertical Longitudinal Section
Looking NW 100 m
46.33 g/t Au / 9.18 m (incl.182.8 / 2.2 m)
ML-14-131
18.68 g/t Au / 3.42 m
45
Open
325-Megane Zone Longitudinal Section

46
Monster Lake: Conductive Plate Models
Area of 325 Zone
Areas Under Explored
47
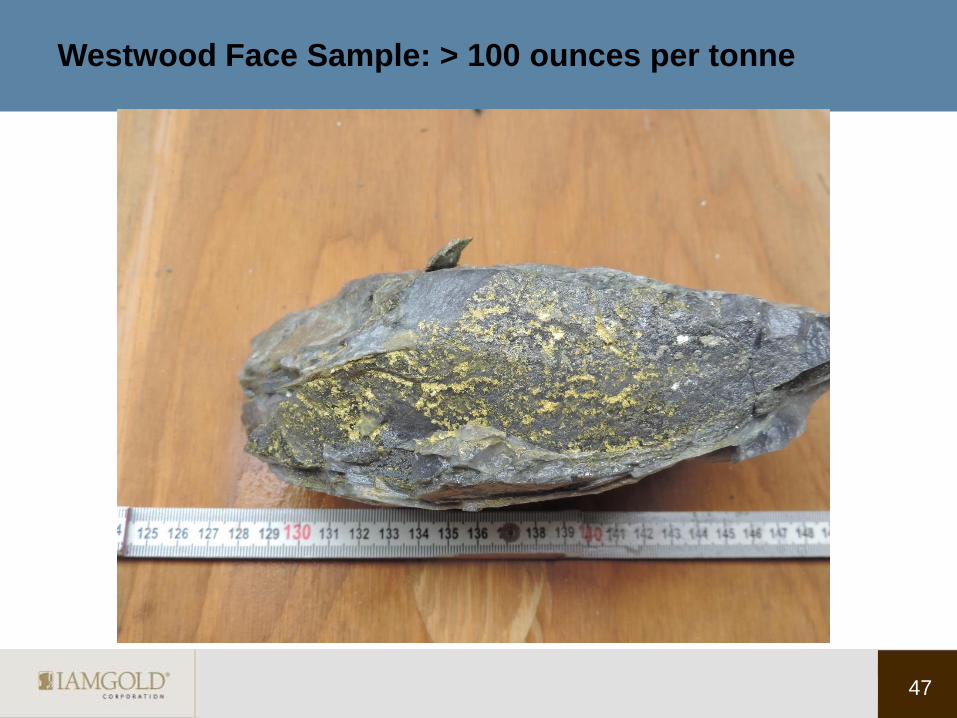
Westwood Face Sample: > 100 ounces per tonne
Operations
48

2014 Attributable Production Trend1
172
206 225
241
0
50
100
150
200
250
300
Q1 Q2 Q3 Q4
00
0’s
oz.
20%
Mill expansion
at Essakane
Westwood in
commercial
production
Grade
improvement
and higher
throughput at
Rosebel
9%
7%
Improving
grades at
Rosebel and
Essakane
49 2014 Production 844k oz.
1 Attributable gold production includes Westwood pre-commercial production for Q1 of 1,000 ounces and Q2 of 9,000 ounces

IAMGOLD – Consolidated Production and Cost Profile
2015-20191,2
50
1 Assuming base case scenario for all LOM plans at operating mines. 2 Sadiola and Yatela plans are being reviewed by our JV partner and no adjustments have been made for changes in assumptions to Oil and FX.
0
200
400
600
800
1,000
1,200
1,400
0
100
200
300
400
500
600
700
800
900
2015 2016 2017 2018 2019
$/o
z.
Att
rib
uta
ble
Pro
du
ctio
n 0
00
s ko
z.
Attributable Production Range (koz.) Average Cash Costs ($/oz.) AISC - Gold Mines ($/oz.)
This chart provides a 5-
year outlook on
production, cash costs
and all-in sustaining costs
Detailed charts by mine
for each of our wholly-
owned mines follow
This chart includes the JV
mines in Mali
The production bars
illustrate a range by year,
with the range slightly
widening in future years
The cost curves have
been smoothed to show
the expected trend for our
costs.
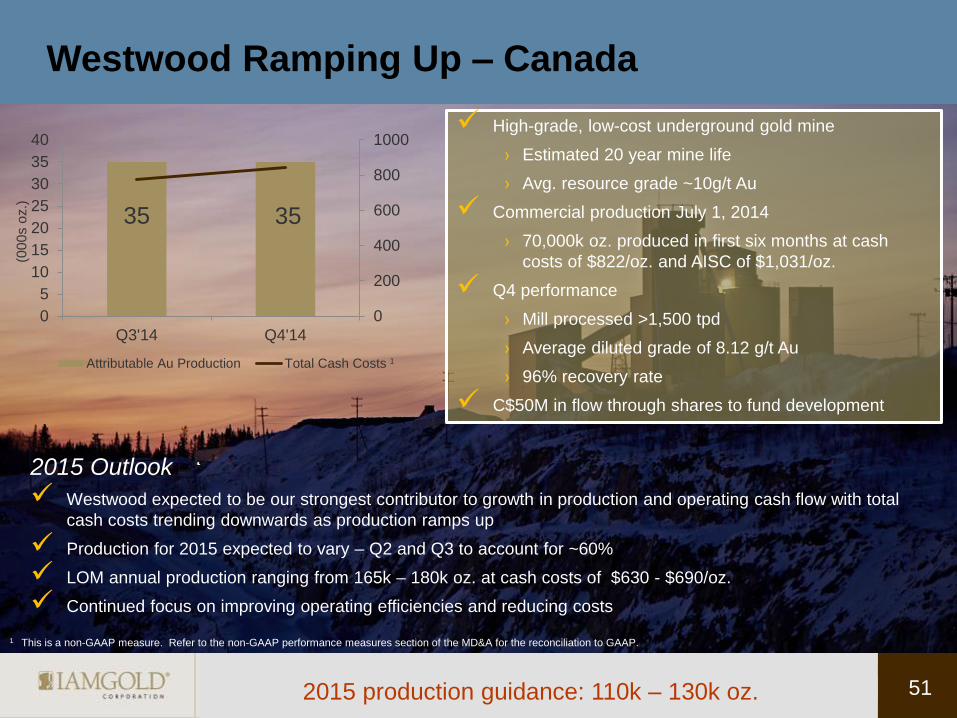
2015 Outlook
Westwood expected to be our strongest contributor to growth in production and operating cash flow with total
cash costs trending downwards as production ramps up
Production for 2015 expected to vary – Q2 and Q3 to account for ~60%
LOM annual production ranging from 165k – 180k oz. at cash costs of $630 - $690/oz.
Continued focus on improving operating efficiencies and reducing costs
Westwood Ramping Up – Canada
51 2015 production guidance: 110k – 130k oz.
High-grade, low-cost underground gold mine
› Estimated 20 year mine life
› Avg. resource grade ~10g/t Au
Commercial production July 1, 2014
› 70,000k oz. produced in first six months at cash
costs of $822/oz. and AISC of $1,031/oz.
Q4 performance
› Mill processed >1,500 tpd
› Average diluted grade of 8.12 g/t Au
› 96% recovery rate
C$50M in flow through shares to fund development
1
(00
0s o
z.)
35 35
0
200
400
600
800
1000
0
5
10
15
20
25
30
35
40
Q3'14 Q4'14
Attributable Au Production Total Cash Costs
1 This is a non-GAAP measure. Refer to the non-GAAP performance measures section of the MD&A for the reconciliation to GAAP.

52
Westwood – Production and Cost Profile 2015-2019
Westwood to ramp up to
LOM level of production in
2019
Total cash costs and AISC
expected to trend
downwards as production
ramps up
Gradual increase in
production allows for
required underground
development to be done
concurrently
0
200
400
600
800
1,000
1,200
0
50
100
150
200
250
2015 2016 2017 2018 2019
$/o
z.
00
0s
oz.
Production (koz.) Average Cash Costs ($/oz.) AISC - Gold Mines ($/oz.)

Westwood Working Faces (as at January 2015)
53
Current mining is concentrated
on two lenses in Sector 1, a
high-grade lens and a lower-
grade lens
Production ramp-up strategy is
to increase development
allowing us to operate in more
than 2 sectors concurrently
Mining of multiple sectors allows
for increased operating flexibility
Blending ore from multiple
lenses in multiple sectors
reduces grade variability

Westwood Development Performance – Average
Advance Meters / Day
54
4.2
5.7
8.8 8.4
8.8 9.2
2012 2013 Q1-2014 Q2-2014 Q3-2014 Q4-2014
Av
era
ge M
ete
rs/D
ay
Exceptional improvement
in 2014 quarter-over-
quarter in average
advance meters/day
Production is ramping up
as expected
Tonnage and grade
reconciliation to date has
been positive
Underground development
has now stabilized and is
now at the desired pace
Focus shifts to optimizing
productivity and reducing
development costs
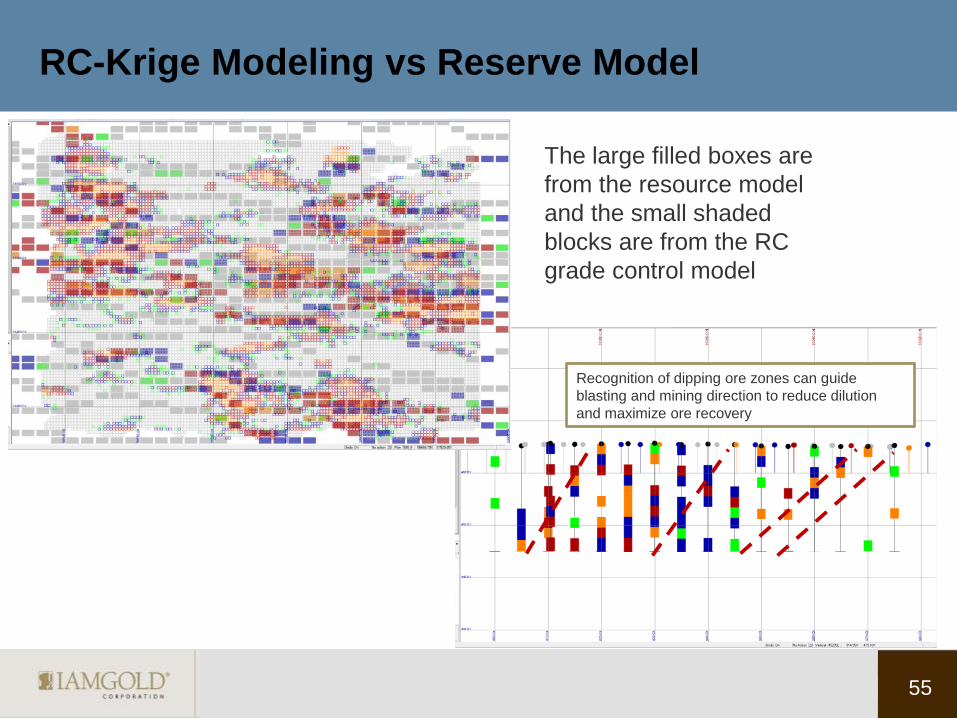
RC-Krige Modeling vs Reserve Model
55
Recognition of dipping ore zones can guide
blasting and mining direction to reduce dilution
and maximize ore recovery
The large filled boxes are
from the resource model
and the small shaded
blocks are from the RC
grade control model

56
Improving Performance Opportunities at Westwood
As Westwood ramps up to full commercial production, the focus is now on optimizing
development while maintaining advance rates
From 2012 – 2014, Westwood was able to improve lateral development productivity by
over 70% for all crews
For the last 6 months, the mine has been averaging over 1,530m of lateral development
per month and 250m of vertical development per month
Ongoing continuous improvement process continues:
Reviewing new innovations that improve productivity
Testing battery powered scoops that can save on energy costs, including
maintenance and fuel consumption, and provide benefits for ventilation and
temperature control

Improving Performance at Rosebel - Suriname
1 This is a non-GAAP measure. Refer to the non-GAAP performance measures section of the MD&A for the reconciliation to GAAP.
($/o
z.) (0
00
s o
z.)
2015 production guidance: 290k – 300k oz.
Multiple open-pit mine
Diminishing supply of soft rock within current reserves
2014 – 325,000 oz. produced at total cash costs of
$804/oz. and AISC of $1,045/oz.
Improving trend in grades
› RC drilling for in-pit grade control
› Strong improvement in dilution control
Strong Q4 performance
› Q4 head grade improved to 0.96 g/t Au
› Cash costs down $264 from peak in Q2 to $678/oz.
57
2015 Outlook
Focus is to continue grade improvement,
increase efficiencies and reduce costs
Lower oil prices expected to continue to benefit
power costs
80 68 83
94
0
200
400
600
800
1000
0
20
40
60
80
100
Q1'14 Q2'14 Q3'14 Q4'14
Attributable Au Production Total Cash Costs1

Rosebel – Production and Cost Profile 2015-2019
58
0
200
400
600
800
1,000
1,200
1,400
1,600
0
50
100
150
200
250
300
350
2015 2016 2017 2018 2019
$/o
z.
Att
rib
uta
ble
Pro
du
ctio
n 0
00
s o
z.
Attributable Production Range (koz.) Average Cash Costs ($/oz.) AISC - Gold Mines ($/oz.)
As the percentage of hard
rock increases, production
is expected to decrease
Harder rock requires more
power for crushing and
grinding, challenging to
sustain throughput capacity
A solution is to find soft rock
in surrounding JV area - an
economical solution to
maintain mill throughput and
reduce power consumption
The operation, however, is
not counting on this and is
continually moving ahead
with initiatives to cut costs
and improve productivity
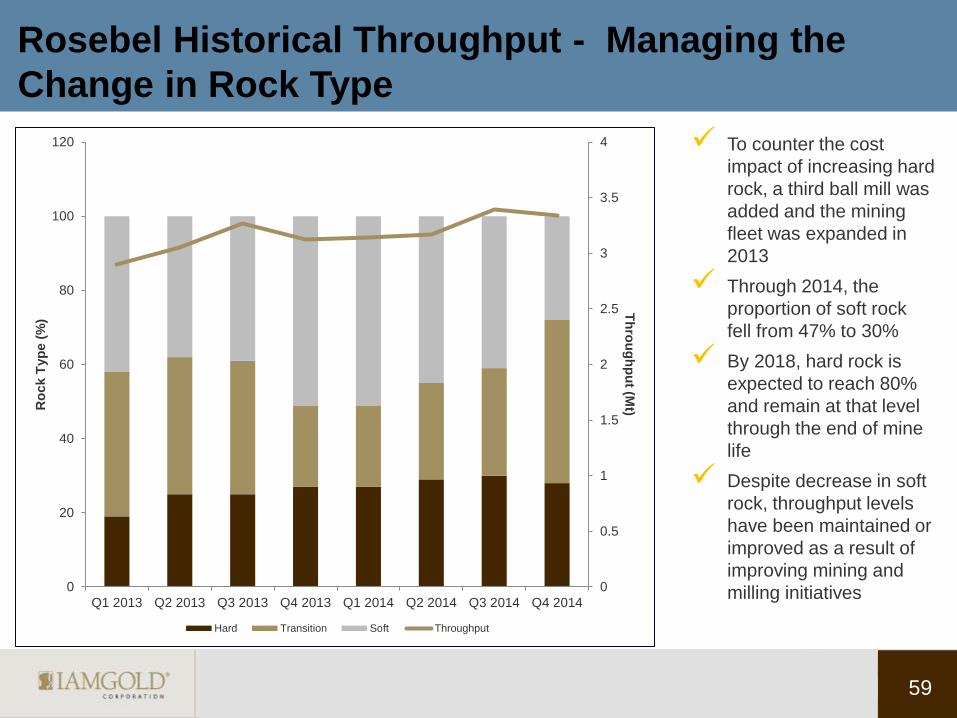
Rosebel Historical Throughput - Managing the
Change in Rock Type
59
0
0.5
1
1.5
2
2.5
3
3.5
4
0
20
40
60
80
100
120
Q1 2013 Q2 2013 Q3 2013 Q4 2013 Q1 2014 Q2 2014 Q3 2014 Q4 2014
Th
rou
gh
pu
t (Mt) R
ock T
yp
e (
%)
Hard Transition Soft Throughput
To counter the cost
impact of increasing hard
rock, a third ball mill was
added and the mining
fleet was expanded in
2013
Through 2014, the
proportion of soft rock
fell from 47% to 30%
By 2018, hard rock is
expected to reach 80%
and remain at that level
through the end of mine
life
Despite decrease in soft
rock, throughput levels
have been maintained or
improved as a result of
improving mining and
milling initiatives

60
Improving Performance Opportunities at Rosebel
Continue to be focused on improving operating efficiencies
In 2014, we employed a third party to review our mining and milling processes
Initiatives to improve processes and productivity are producing positive results
Initiatives Implemented Result
Creation of pre-production stockpiles (materials of variable
rock hardness blended together to stabilize ore blend)
Increased throughput and recoveries, and reduced consumption
of power and reagents
Remote monitoring of drilling Enhanced operator and drill performance
Electronic monitoring of blast movement Reduced dilution
Improved shift coordination Reduced idle equipment time
Increased employee training on equipment maintenance Reduced reliance on expensive contractors
Elimination of redundant maintenance activities Increased equipment availability and reduced costs
Revamped system for cleaning and filtering oil Reduced truck downtime
Changed to reverse circulation drilling for grade control Improved definition of boundaries between waste rock and ore
body, less dilution and improved grade reconciliation

61
Improving Performance Opportunities at Rosebel
Initiatives Still Underway
Removing operating barriers
Improving communication within and between departments
Reducing the causes of lost time to improve productivity
Optimizing mining sequence to feed the mill effectively
Streamlining management information and processes

Optimizing Performance at Essakane – Burkina Faso
2015 Outlook
Higher grades and lower oil prices expected to improve cash costs
Process improvement initiatives actively being implemented –
targeting optimization of mining and milling processes
($/o
z.)
(00
0s o
z.)
1 This is a non-GAAP measure. Refer to the non-GAAP performance measures section of the MD&A for the reconciliation to GAAP.
2015 production guidance: 360k - 370k oz. 62
68
92 83
89
0
200
400
600
800
1000
0
20
40
60
80
100
Q1'14 Q2'14 Q3'14 Q4'14
Attributable Au Production Total Cash Costs
Open-pit mine in 4th year, 10 years remaining in LOM
Mill expansion in 2013 to accommodate hard rock
2014 cash cost of $852/oz reflects harder rock and lower
capitalized stripping – AISC of $1,060/oz.
2014 production increased 33% from 2013
› Improvements – 21% grades and 12% throughput
› 11.9 Mtpa throughput – above nameplate of 10.8 Mtpa
1

Essakane– Production Profile 2015-2019
63
0
200
400
600
800
1,000
1,200
1,400
0
50
100
150
200
250
300
350
400
450
2015 2016 2017 2018 2019
$/o
z.
Att
rib
uta
ble
Pro
du
ctio
n 0
00
s o
z.
Attributable Production Range (koz.) Average Cash Costs ($/oz.) AISC - Gold Mines ($/oz.)
Major mill expansion
completed in 2013 to
accommodate a growing
proportion of hard rock
Expansion driving strong
production and steady
state costs for the next
four years
In 2019, production is
currently forecasted to
decline and costs to rise
due to lower grades
being mined
Exploration objective
is to find higher grade
to mitigate the decline

Essakane Throughput for 2013 & 2014 – Managing Rock Hardness
64
0
0.5
1
1.5
2
2.5
3
3.5
4
0
20
40
60
80
100
120
Q1 2013 Q2 2013 Q3 2013 Q4 2013 Q1 2014 Q2 2014 Q3 2014 Q4 2014
Th
rou
gh
pu
t (Mt) R
ock T
yp
e (
%)
Hard Transition Soft Throughput Nameplate Expanded Mill Capacity
In 2014, hard rock
increased from 25%
to over 81%
Despite the declining
proportion of soft
rock, throughput
levels were
maintained
H1 2014 throughput
levels high due to
higher soft and
transition ore levels,
and a successful
commissioning of the
mill expansion
Hard rock levels
expected to continue
at current level
65
Improving Performance Opportunities at Essakane
Achieved a 33% increase in production year over year in 2014 due to the mill expansion and
higher grades
Greatest opportunity to reduce our cost structure at Essakane will come from process
improvement initiatives being implemented in 2015
Focus is now on reducing costs and optimizing the mining and milling processes
Implementing many of the same initiatives that were effective at improving operating
efficiency at Rosebel last year

Revitalization Strategy for Sadiola – Mali
66
Open-pit mine in operation for 20 years
Transitioning to hard rock
Continuing to look for additional oxide reserves
Existing plant not built for hard rock
2014 production of 84,000 oz. slightly lower year
over year due to lower grades, partially offset by
higher throughput and recoveries
($/o
z.) (0
00
s o
z.)
19
24
21 20
0
200
400
600
800
1000
1200
0
5
10
15
20
25
30
Q1'14 Q2'14 Q3'14 Q'14
Attributable Au Production Total Cash Costs
Outlook
Expansion to accommodate hard rock processing would provide a significant growth opportunity
Expansion would extend the mine life to 10 years, reduce unit costs and increase production by nearly 3M oz.
Strong IRR at current gold price environment
Reliable, long-term supply of low-cost power critical to expansion project
2015 production will deplete the existing supply of soft rock and throughput is expected to decline thereafter
Ongoing discussions continue with our partner examining options to move forward
1
1 This is a non-GAAP measure. Refer to the non-GAAP performance measures section of the MD&A for the reconciliation to GAAP.
2015 production guidance: 60k oz.

Burkina Faso: Social Environment
67
Stakeholder Engagement:
Continuous engagement with all parties (300 visits in 2014)
Ongoing:
• Specific discussion with youth representatives from Essakane and Falagountou
• Agreement with ASSM (Essakane) and negotiation with ASSM (Falagountou)
• Internal alignment of stakeholder engagement plan
Shared Value Model: Community investment ($2M in 2014)
Ongoing:
• Development of local procurement strategy
• Alignment of community investment program towards development of livelihood
activities
Since the events of October 2014, the expectations of civil society and communities
have increased, and it is essential that mining companies engage proactively and
constructively with their host communities. IAMGOLD does this and is widely
recognized as a leader for its CSR programs.
ASSM = Artisanal small scale miners or orpailleurs
West Africa Update
68
Political Environment in Burkina Faso:
Since October, a transitional, consensus-based, government has been in place to prepare for elections in October
IAMGOLD has engaged with all key members of this administration, and their commitment to the security and success of the mining sector is clear
The government has proposed changes to the Mining Code, but we expect little impact on existing operators
Ebola in West Africa:
No cases ever in Burkina, no cases currently in Senegal or Mali
We and our host countries take significant precautions including sanitization and temperature checks at remote exploration sites
We participate in supporting the fight against Ebola
69
Financial Review

Maintaining Strong Liquidity $
mil
lio
ns
159
162
500
As at December 31, 2014
70
The Company has $650 million of senior unsecured notes due October 2020.
$821
659
162
500
40
Proforma as at December 31, 2014, with sale of Niobecand cash proceeds from flow through shares
Proceeds fromflow throughshares
Unused creditfacility
Gold bullion atmarket
Cash & cashequivalents
1
$1,361
1 Flow through shares C$50M to be used in Canada, for development work at Westwood and exploration in Ontario and Quebec.
Converted to $US dollars at an exchange rate of 0.80 as of February 27, 2015.
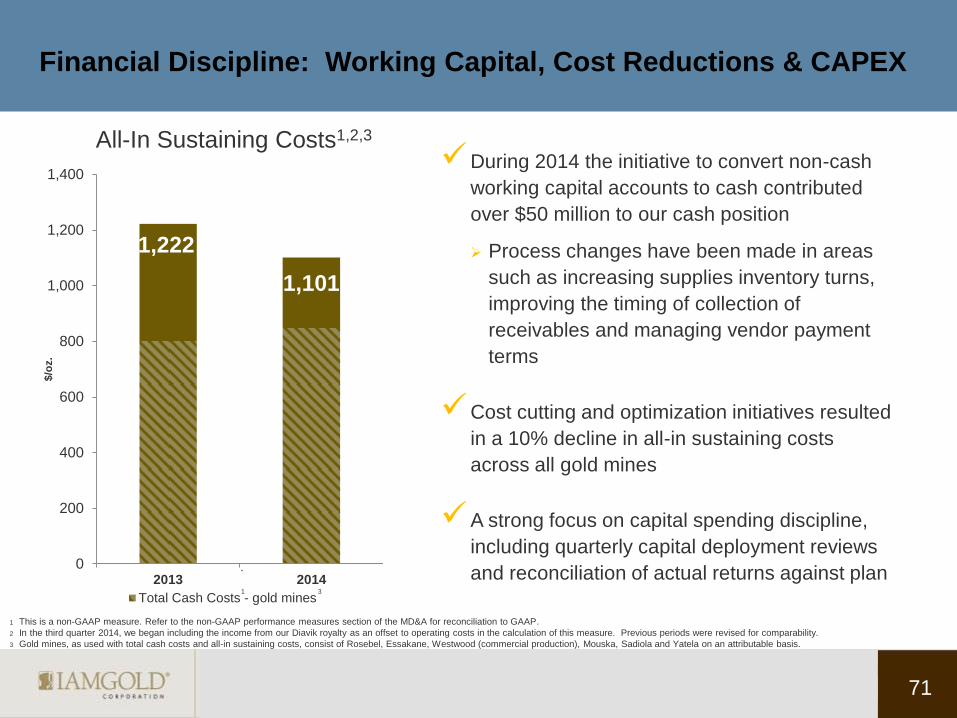
Financial Discipline: Working Capital, Cost Reductions & CAPEX
During 2014 the initiative to convert non-cash
working capital accounts to cash contributed
over $50 million to our cash position
Process changes have been made in areas
such as increasing supplies inventory turns,
improving the timing of collection of
receivables and managing vendor payment
terms
Cost cutting and optimization initiatives resulted
in a 10% decline in all-in sustaining costs
across all gold mines
A strong focus on capital spending discipline,
including quarterly capital deployment reviews
and reconciliation of actual returns against plan
71
1,222
1,101
0
200
400
600
800
1,000
1,200
1,400
2013 2014
$/o
z.
Total Cash Costs - gold mines
`
All-In Sustaining Costs1,2,3
1 This is a non-GAAP measure. Refer to the non-GAAP performance measures section of the MD&A for reconciliation to GAAP.
2 In the third quarter 2014, we began including the income from our Diavik royalty as an offset to operating costs in the calculation of this measure. Previous periods were revised for comparability.
3 Gold mines, as used with total cash costs and all-in sustaining costs, consist of Rosebel, Essakane, Westwood (commercial production), Mouska, Sadiola and Yatela on an attributable basis.
1 3

Summary of Outstanding Hedge and Non-Hedge Derivative Contracts1
72
Contracts 2015 2016 2017 2018
Foreign currency
Canadian dollar contracts (M of C$) 145.0 60.0 – –
Contract rate range (C$/$) 1.10 – 1.17 1.12 – 1.18 – –
Hedge ratio2 60% 29% – –
Euro contracts (M of €) 126.0 – – –
Contract rate range ($/€) 1.21 – 1.26 – – –
Hedge ratio2 53% – – –
Commodities
Crude oil contracts (barrels) 1,080,000 1,101,000 786,000 –
Contract price range ($/barrel of crude oil) 75 -95 68 – 95 71 – 95 –
Hedge ratio2 77% 76% 51% –
1 Further information found on page 22 of IAMGOLD Corporation’s Annual MD&A – December 31, 2014 2 Hedge ratio is calculated by dividing the amount (in foreign currency or commodity units) of outstanding derivative contracts by total foreign exchange and
commodity exposures.
IAMGOLD Hedging Strategy Proactive strategy to mitigate risk from fluctuating exchange rates and oil prices in volatile markets
Hedges a portion of exposure to FX resulting from operating and CAPEX requirements.
Hedges a portion of anticipated fuel consumption. A portion of exposure remains unhedged so there is opportunity to benefit from further
price declines. Zero cost collars lock in a ceiling and floor price.
2015 outlook based on average crude oil price of $73/barrel. This reflects a weighted average of multiple fuel contracts ranging between $75
and $95 per barrel for 77% of anticipated fuel purchases and the consensus forecast price for WTI, for which we could purchase the
unhedged portion of our anticipated fuel purchases in the open market.
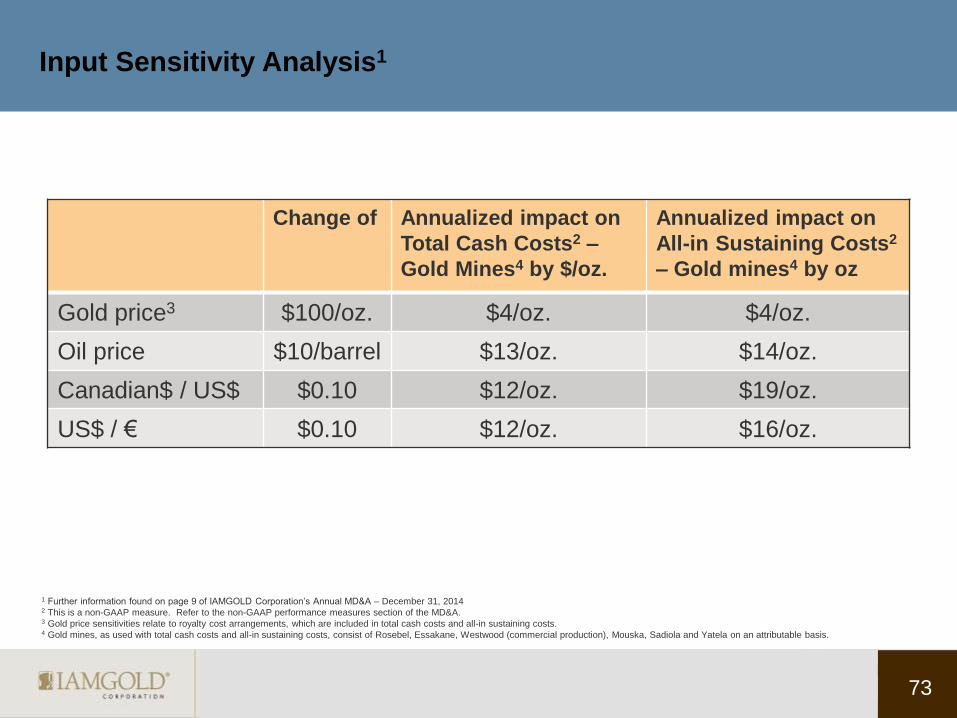
Input Sensitivity Analysis1
73
Change of Annualized impact on
Total Cash Costs2 –
Gold Mines4 by $/oz.
Annualized impact on
All-in Sustaining Costs2
– Gold mines4 by oz
Gold price3 $100/oz. $4/oz. $4/oz.
Oil price $10/barrel $13/oz. $14/oz.
Canadian$ / US$ $0.10 $12/oz. $19/oz.
US$ / € $0.10 $12/oz. $16/oz.
1 Further information found on page 9 of IAMGOLD Corporation’s Annual MD&A – December 31, 2014 2 This is a non-GAAP measure. Refer to the non-GAAP performance measures section of the MD&A. 3 Gold price sensitivities relate to royalty cost arrangements, which are included in total cash costs and all-in sustaining costs. 4 Gold mines, as used with total cash costs and all-in sustaining costs, consist of Rosebel, Essakane, Westwood (commercial production), Mouska, Sadiola and Yatela on an attributable basis.

Regional tax rates, available pools, cash taxes, royalty rates & other
74
Africa Americas
Burkina Faso Mali Canada Suriname
Corp. Tax Rate 17.50%
Statutory corporate income tax rate of
27.5% less 10% per Mining Agreement
30%
36%
includes Quebec mining duty taxes -
deductible for income tax purposes
36%
Available tax pools
~$850M
~900M
~$1,490M
~$300M
2015
Cash income and
mining duty taxes
–
–
$17M to $22M
–
Royalty Rate
3%- Au price <$1,000/oz
6% N/A
6.5% (Au price >$425/oz)
4%- Au price $1,000-$1,300/oz (2.25% in-kind of production)
5%- Au price >$1,300/oz
Other Taxes 18%
Non-refundable VAT on Light Fuel Oil
VAT
majority fully refundable
GST/HST/QST
Majority fully refundable
VAT
majority fully refundable
Non-Resident
withholding tax
6.25% on interest and dividends
Various exemptions apply
to interest, dividends, and
services rendered by non-
residents
N/A N/A 10% on services rendered by non-
residents (mining activities)
20% on services rendered by non-
residents (non-mining activities)

Capital Structure
75
Debt
IAMGOLD 6 ¾ callable bonds October 1, 2020
Rating: B2 (Moody’s), and B+ (S&P) as of February 2015
Rank: Sr Unsecured
Issue price: $100
Last trade: $80.50 (as at Feb 27, 2015)
Yield: 11.6%
Covenants:
Cash proceeds from the sale of Niobec must be used
within one year of closing. This window can be extended
an additional 6 months with firm capital commitments
made within this time period. A balance of less than $50M
can be kept.
Capital commitments can include planned CAPEX
spending or capital used for M&A.
Should the above requirements not be met, IAMGOLD
must buy back the outstanding balance in bonds at par.
Credit Facility Guarantors: Unsecured except for
subsidiary guarantees by Rosebel
Covenants:
• Net Debt : EBITDA - 3.5 times
• Tangible Net Worth - currently have $400-$500M
cushion
Equity
IMG CDN Equity (as at Feb 27, 2015)
Price: $3.06
Market Cap: $1,196M
52 Wk High/Low: $4.82 / $1.62
YTD: (3%)
IAG US Equity (as at Feb 27, 2015)
Price: $2.45
Market Cap: $958M
52 Wk High/Low:$4.35 / $1.42
YTD: (9%)

Why invest in IAMGOLD?
Diversified portfolio of operating gold mines in friendly mining jurisdictions
Owned and operated mines generating positive free cash flow
AISC improving - optimizing economic returns from existing assets
Demonstrated ability to adapt in a volatile gold market
Significant financial flexibility from sale of Niobec
Promising exploration pipeline
Excellent CSR reputation
76

Appendix
77

2015 Production and Cost Guidance1 A
ttrib
uta
ble
go
ld p
rod
uction
Guidance
Rosebel (000s oz.) 290 – 300
Essakane (000s oz.) 360 – 370
Westwood (000s oz.) 110 – 130
Total owner-operator production (000s oz.) 760 – 800
Joint ventures (000s oz.) 60
Total attributable production (000s oz.) 820 – 860
Total cash costs2 – owner-operator ($/oz.) $825 - $865
Total cash costs – gold mines3 ($/oz.) $850 - $900
All-in sustaining costs2 – owner-operator ($/oz.) $1,050 - $1,150
All-in sustaining costs – gold mines ($/oz.) $1,075 - $1,175
1 The outlook is based on 2015 full year assumptions with an average realized gold price of $1,250 per ounce, Canadian $/USD exchange rate of 1.15, USD/€ exchange rate of 1.20 and average crude oil price of $73/barrel. 2 This is a non-GAAP measure. Refer to the non-GAAP performance measures section of the MD&A for reconciliation to GAAP. 3 Gold mines, as used with total cash costs and all-in sustaining costs, consist of Rosebel, Essakane, Westwood, Sadiola and Yatela on an attributable basis.
78

2015 – 2019 Budget Assumptions
79
2015 2016 2017 2018 2019
Gold Price ($/oz.) 1,250 1,300 1,300 1,300 1,300
Oil ($/barrel) 73 80 80 80 80
USD/CAD 1.15 1.15 1.15 1.15 1.15
Euro/USD 1.20 1.20 1.20 1.20 1.20

2015 Capital Expenditure Outlook
1 Includes capitalized stripping of $20M at Rosebel and $20M at Essakane.
($ millions) Sustaining1
Development/
Expansion
(Non-sustaining)
Total
Rosebel 70 10 80
Essakane 55 5 60
Westwood 30 50 80
Total gold segments 155 65 220
Côté Gold - 5 5
Total consolidated 155 70 225
Joint ventures 5 - 5
Total (±10%) 160 70 230
80
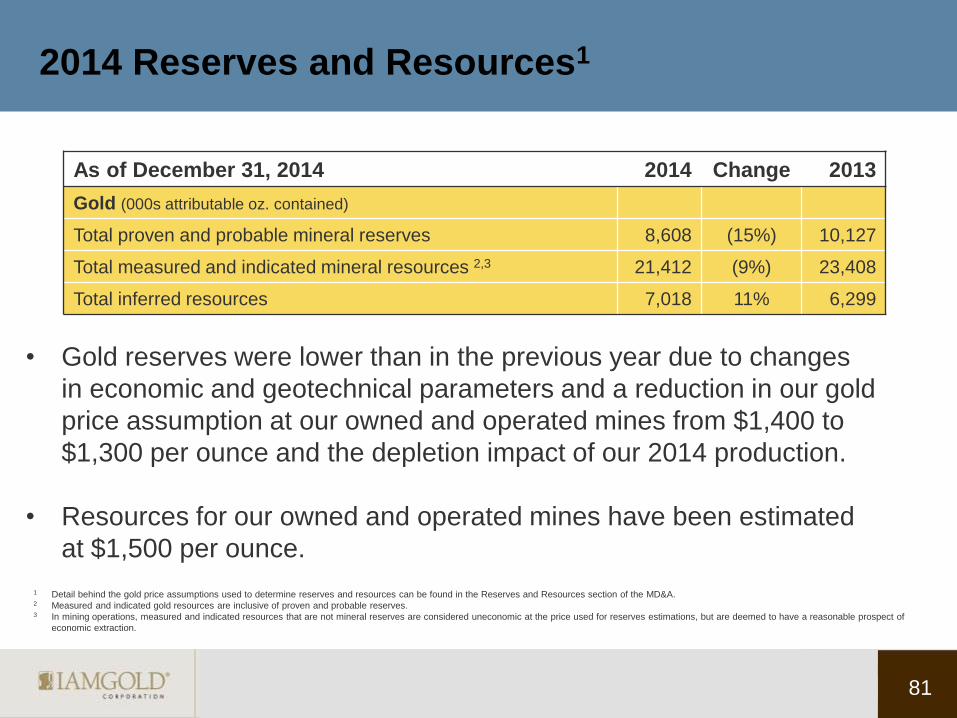
2014 Reserves and Resources1
As of December 31, 2014 2014 Change 2013
Gold (000s attributable oz. contained)
Total proven and probable mineral reserves 8,608 (15%) 10,127
Total measured and indicated mineral resources 2,3 21,412 (9%) 23,408
Total inferred resources 7,018 11% 6,299
81
1 Detail behind the gold price assumptions used to determine reserves and resources can be found in the Reserves and Resources section of the MD&A.
2 Measured and indicated gold resources are inclusive of proven and probable reserves. 3 In mining operations, measured and indicated resources that are not mineral reserves are considered uneconomic at the price used for reserves estimations, but are deemed to have a reasonable prospect of
economic extraction.
• Gold reserves were lower than in the previous year due to changes
in economic and geotechnical parameters and a reduction in our gold
price assumption at our owned and operated mines from $1,400 to
$1,300 per ounce and the depletion impact of our 2014 production.
• Resources for our owned and operated mines have been estimated
at $1,500 per ounce.

82
Greenfield Exploration References
Boto Project, Senegal: see IAMGOLD news releases dated April 9, October 20, 2014
& February 3, February 18, 2015.
Eastern Borosi, Nicaragua: see Calibre Mining news releases dated September 2, September 24,
November 4, 2014 & January 21, 2015.
Monster Lake, Canada: see IAMGOLD news releases dated May 27, August 20, 2014
& February 5, 2015
Pitangui, Brazil: see IAMGOLD news release dated April 9 and June 23, 2014.
Siribaya Project, Mali: see Merrex gold releases dated July 2, August 28, October 8 2014
& February 2,9 and 27, 2015.
Qualified Persons
The technical information in this presentation relating to exploration projects was prepared under the
supervision of or reviewed by Craig MacDougall, P.Geo., Senior Vice President, Exploration for IAMGOLD.
Mr. MacDougall is a Qualified person as defined by National Instrument 43-101.

TSX: IMG NYSE: IAG
Investor Relations [email protected]
Laura Young
Director, Investor Relations
T: 416-933-4952
Penelope Talbot-Kelly
Analyst, Investor Relations
T: 416-933-4738
Bob Tait
VP, Investor Relations
T: 416-360-4743