analyst meet 21stfeb12
TRANSCRIPT

Analyst Meet
21st February 2012
Disclaimer
This presentation may contain statements which reflect
Management’s current views and estimates and could be
construed as forward looking statements. The future involves
risks and uncertainties that could cause actual results to differ
materially from the current views being expressed. Potential
risks and uncertainties include factors such as general
economic conditions, commodities and currency
fluctuations, competitive product and pricing
pressures, industrial relations and regulatory developments.

Quick Recap

Food is a USD 240
billion opportunity
Branded food growing
faster than overall
food and non-food
Biscuits is the largest
category in branded
foods ( ~ USD 2.2
billion)
Growth driven by
rising income, quality
consciousness and
convenience seeking
Non-biscuit bakery is
large, unorganized
and provides a big
opportunity for
Britannia
Dairy branded but
generic, growing fast
and providing scope
for differentiation
Quick Recap

Since Our Last Meeting

Results Highlights – 2011-12
Growth Q1 Q2 Q3
Sales 21.4% 18.2% 15.4%
Profit from Operations 20.3% 18.4% 49.6%
PAT 27.3% 18.7% 44.8%
Standalone
Consolidated
Growth Q1 Q2 Q3
Sales 21.2% 18.8% 17.7%
PAT 38.8% 61.0% 35.4%

23.8
21.4
18.2
15.4
-
5
10
15
20
25
2010-11 Q1 Q2 Q3
Gro
wth
%
NSV Growth%
Double-Digit Growth Continues….
2011-12

Despite Declining Growth Rate Of The Biscuit Market
20
26 2624
21
17
11
8
11
0
4
8
12
16
20
24
28
Apr 11 May 11 Jun 11 Jul 11 Aug 11 Sep 11 Oct 11 Nov 11 Dec 11
% G
row
th
Market Growth –Value (% YOY)
Source : Nielsen

Achieved By All Round Innovation
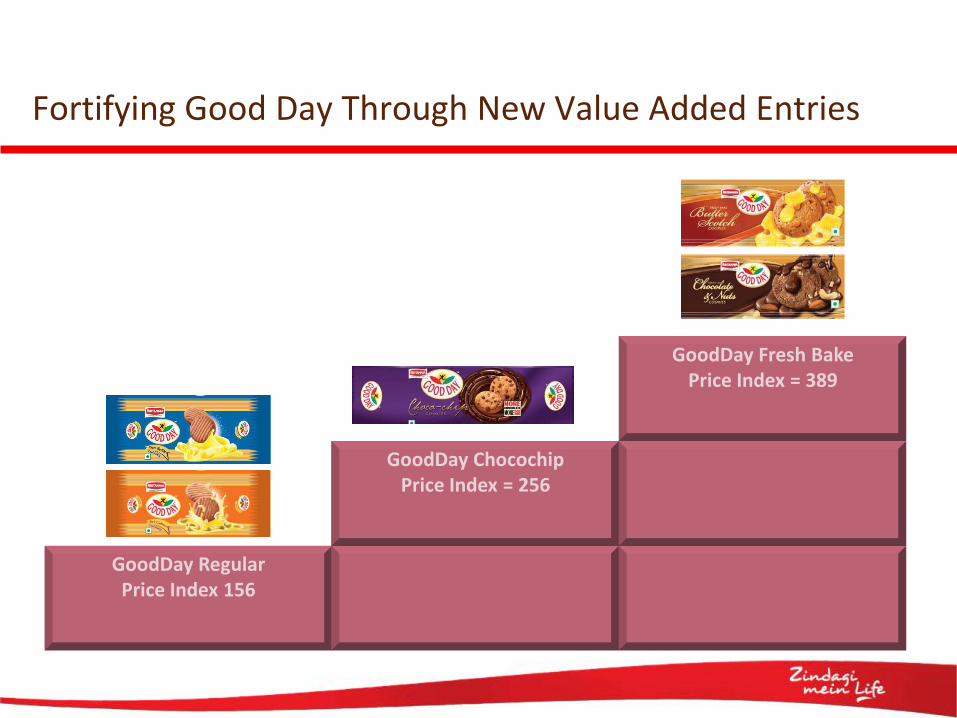
Fortifying Good Day Through New Value Added Entries
GoodDay Regular Price Index 156
GoodDay ChocochipPrice Index = 256
GoodDay Fresh BakePrice Index = 389

Taking 50-50 Into New Consumption And Benefit Occasions
50-50 Regular Price Index 111
50-50 Maska Chaska
Price Index = 156
50-50 SnackuitsPrice Index = 300

Breaking Format And Benefit Barriers In NutriChoice
NutriChoice Digestive Price Index 192
NutriChoice DFE OatsPrice Index = 388
NutriChoice Multigrain ThinsPrice Index = 514

Consistently Supporting Our Brands
A&SP YTD Dec-11 22.9%
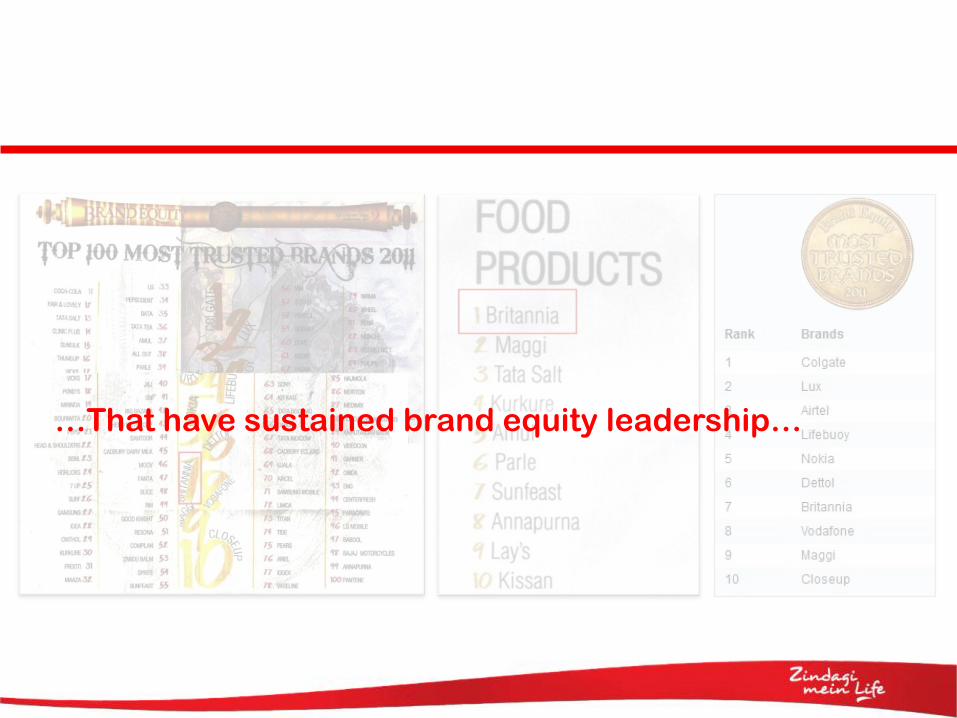
…That have sustained brand equity leadership…

100 100
95
103
Flour Sugar
(In
dex
YTD
De
c 1
0 =
10
0)
YTD Dec 10 YTD Dec 11
While Flour & Sugar Prices Have Been Steady…
Market Prices

100 100 100 100 100
118
132
164
133 133
RPO SMP Cashew Cocoa Mfg Fuel
(In
dex
YTD
De
c 1
0 =
10
0)
YTD Dec 10 YTD Dec 11
Moderate To High Inflation In Many Other Inputs
Market Prices

2011-12
PAT Increase Of 31% - YTD December
24.7 27.3 18.7
44.8
-
5.0
10.0
15.0
20.0
25.0
30.0
35.0
40.0
45.0
50.0
2010-11 Q1 Q2 Q3
Gro
wth
%
PAT – Growth %
*
* - includes payment of Rs. 150 MM on account of voluntary retirement scheme, following the closure of
Mumbai factory.

Business Beyond Biscuits

…..Is Significant And Growing Fast
~ Rs 11,000 MM*
Dairy Cakes Bread Rusk
* Annualized

Bread, Cake And Rusk On Accelerated Growth Trajectory
100133
196233
306
384
2006-07 2007-08 2008-09 2009-10 2010-11 2011-12
NSV
Ind
exe
d t
o 2
00
6-0
7
Net Sales Value – YTD December

Dairy Business More Than Doubled Over Five Years
100117
135159
183
239
2006-07 2007-08 2008-09 2009-10 2010-11 2011-12
NSV
Ind
exe
d t
o 2
00
6-0
7
Dairy NSV – YTD December

Innovation --- Central To Building Brands

Adding Health And Delight In Cheese…
Britannia Cheese SlicesPrice Index 100
Britannia SlimzPrice Index = 107
Britannia Gourmet Gouda Classic
Price Index = 150

Taking Bread Up The Value Chain…
Britannia White BreadPrice Index 100
Britannia Brown BreadPrice Index = 140
Britannia Honey & Oats Britannia Multi-Grain
Price Index = 196

Expanding Into Adjacent Spaces: Breakfast
Basic Cereals
Value added Cereals
Value Added Indian Breakfast

Investing In Capacity And Capability To Fuel Growth

To Summarize
• We operate in a large and fast growing market
• We are driving innovation & differentiation backed by investment behind ourbrands
• We have improved margins despite continued input inflation
• We have built a significant, fast growing business beyond biscuits
• We are investing in capability and capacity to fuel growth
