analyst presentation q3 2017
TRANSCRIPT


01 GRUPPOHERA
The period main events underpinning results
September
2017
March
2017
December
2016
September
2016 June
2017
Default
Gas
Safeguarded
‘17-’18
Safeguarded
VEN-FVG
Expanding all business under competition
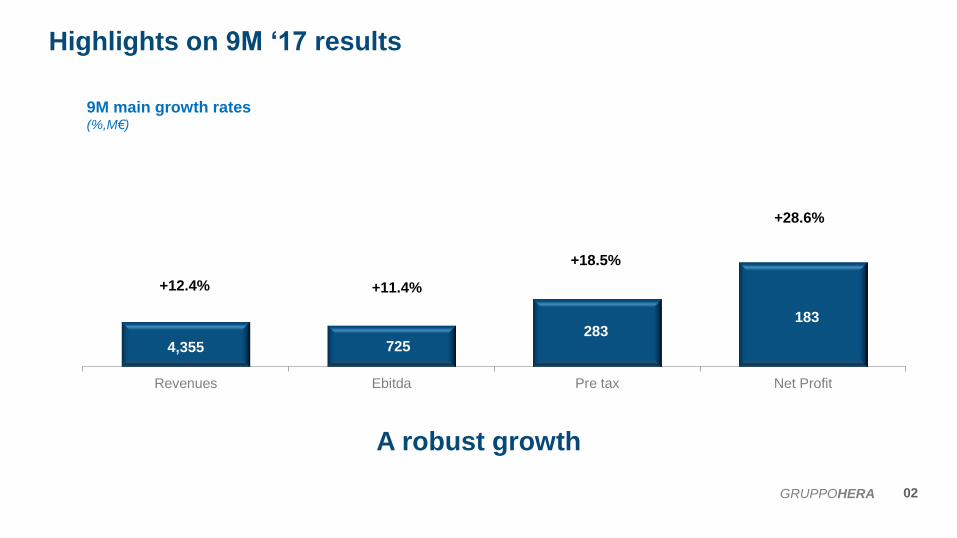
4,355 725 283
183
Revenues Ebitda Pre tax Net Profit
02 GRUPPOHERA
A robust growth
9M main growth rates (%,M€)
Highlights on 9M ‘17 results
+12.4% +11.4%
+28.6%
+18.5%

03 GRUPPOHERA
Ebitda growth drivers (M€)
650,6
724,7 +69,5
+12.6
(8.0)
9M '16 Internal Growth M&A Incentives 9M '17
Performance underpinned by growth in all businesses
9M 2017 EBITDA growth drivers
+11.4%
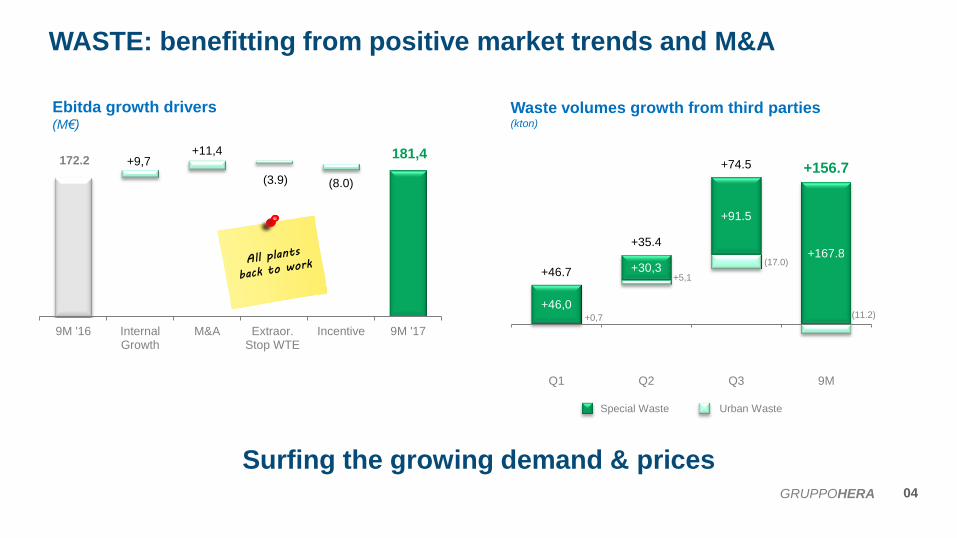
(11.2) +0,7
+5,1
(17.0)
+46,0
+30,3
+91.5
+167.8
+46.7
+35.4
+74.5 +156.7
Q1 Q2 Q3 9M
181,4 172.2 +9,7
+11,4
(3.9) (8.0)
9M '16 InternalGrowth
M&A Extraor.Stop WTE
Incentive 9M '17
WASTE: benefitting from positive market trends and M&A
Ebitda growth drivers (M€)
GRUPPOHERA 04
Waste volumes growth from third parties (kton)
Surfing the growing demand & prices
Special Waste Urban Waste

303,5 306,4
+2,9
9M '16 Internal growth 9M '17
NETWORKS: squeezing value from our RAB
Ebitda growth drivers (M€)
05 GRUPPOHERA
RAB breakdown (B€)
1,4
3,1
1,1
0,4
0,2
Water Gas Electricity D.H. Group
Fine tuning activities and quality of regulated services

ENERGY: expansion in all activities
Benefitting from external scenario discontinuities
220,6
161.0
+35,9 +6,0 +11,0
+ 6.7
9M '16 Newsafeg.
One offsafeg.
PowerGen.
Margins/Volumes
9M '17
Ebitda growth drivers (M€)
06 GRUPPOHERA
Industrial
Development
Development
Networks
Development
Energy
Customer base growth (K unit)
2.202
2.355
+53
+100
9M '16 Gas Electricity 9M '17
+153k customers
Development
Waste
GRUPPOHERA
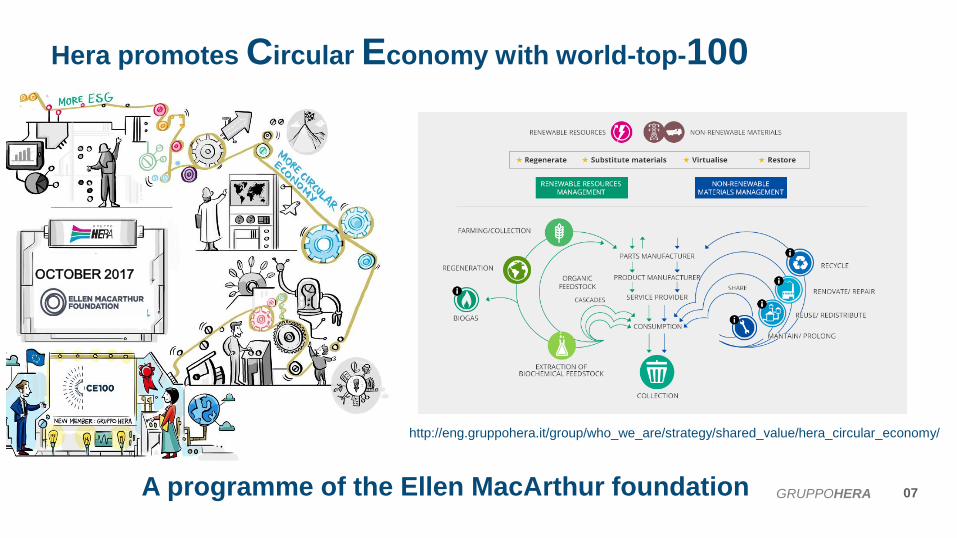
Hera promotes Circular Economy with world-top-100
A programme of the Ellen MacArthur foundation
OCTOBER 2017
http://eng.gruppohera.it/group/who_we_are/strategy/shared_value/hera_circular_economy/
07

Net profit & returns
Exploiting financial and tax optimisations
08 GRUPPOHERA
Development
Waste
9M Financial Inc./(Expenses) (M€)
9M ROI & ROE (%)
(104,2) (99,2) (98,8) (90,2) (74,5)
9M '13 9M '14 9M '15 9M '16 9M '17
9,0% 8,3%
9,3% 9,7%
ROI ROE
9M 2017 EPS growth (%)
+16.9%
+6,6%
+20,0%
+9,0% +13,6%
+28,9%
9M '13 Adj. 9M '14 9M '15 9M '16 9M '17
Cagr: +15.2%
9M Tax rate (%)
44,8% 40,6% 38,2% 36,5%
32,0%
9M '13 9M '14 9M '15 9M '16 9M '17
9M ‘16 9M ‘17 9M ‘16 9M ‘17
Cagr: (8.1%) Cagr: (8.0%)
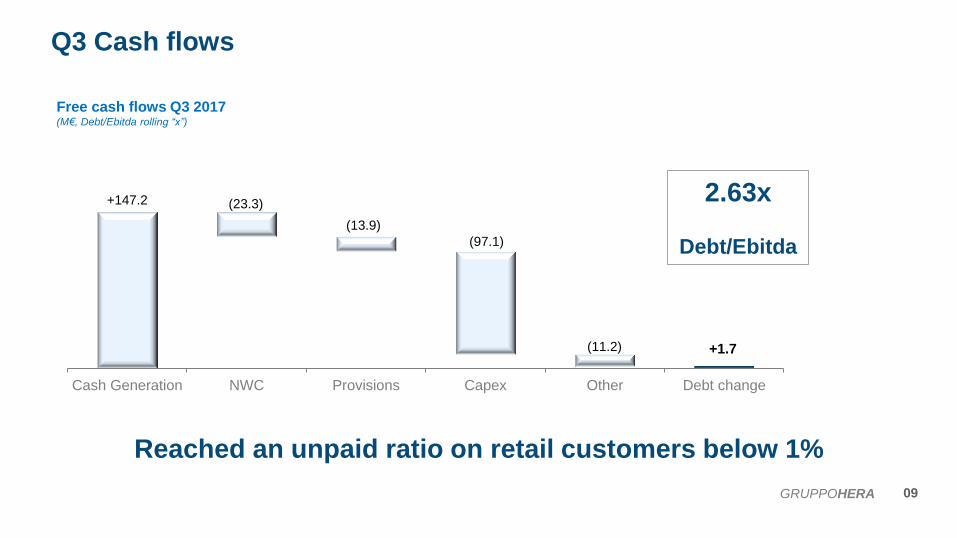
Q3 Cash flows
09 GRUPPOHERA
Reached an unpaid ratio on retail customers below 1%
+147.2
+1.7
(23.3)
(13.9)
(97.1)
(11.2)
Cash Generation NWC Provisions Capex Other Debt change
Free cash flows Q3 2017 (M€, Debt/Ebitda rolling “x”)
2.63x
Debt/Ebitda

Closing remarks
10 GRUPPOHERA
• Results reflect Group capability to seize M&A
and business opportunities in all activities.
• These good results brought an advantage to
face this challenging Quarter.
• Currently finalizing new 5 year business plan
to be disclosed beginning next year.
9M 2017 EPS growth (euro cent, % growth 9M/9M)
9M '17
+28.9%
Good Q3 results take aim on fixed targets
12.4c€


Annex: P&L
11 GRUPPOHERA
9M ‘16 9M ’17
REVENUES 3,875.4 4,355.1 +12.4%
EBITDA 650.6 724.7 +11.4%
Ebitda margin 16.8% 16.6%
Depreciation and provisions (321.3) (366.8)
EBIT 329.2 357.9 +8.7%
Financial costs (84.0) (69.7)
Figurative interests (IAS) (14.2) (14.0)
Income from Associates & J.V. 8.0 9.2
PRETAX PROFIT 239.1 283.4 +18.5%
Tax (87.2) (90.6)
Tax rate 36.5% 32.0%
Minorities (9.6) (9.9)
NET PROFIT POST MINORITIES 142.2 182.9 +28.6%
9M Profit & Loss (M€)

5,1% 5,5% 6,0% 6,6%
7,1% 7,6%
14,1% 15,0% 14,5% 14,5% 14,6% 15,0%
'15 '16 '17 '18 '19 '20Gas Electricity
Churn rates
Annex: Waste
Leveraging on market expansion
12 GRUPPOHERA
(m€)
Revenues
Ebitda
Q1 2016 Q1 2017 Ch.
235.4 240.2 +4.8
62.4 64.0 +1.5
Q2 2016 Q2 2017 Ch.
256.0 306.2 +90.8
54.0 57.3 +2.4
Q3 2016 Q3 2017 Ch.
236.2 257.4 +21.1
55.8 60.1 +4.3
9M 2016 9M 2017 Ch.
727.6 803.7 +76.1
172.2 181.4 +9.1
Q2 2016 Q2 2017 Ch.
536.6 541.7 +5.1
597.1 627.4 +30.3
1,133.8 1,169.2 +35.4
650.6 714.7 +64.0
1,784.4 1,883.8 +99.4
Q1 2016 Q1 2017 Ch.
471.0 471.7 +0.7
581.0 627.0 +46.0
1,052.0 1,098.7 +46.7
625.7 588.3 (37.4)
1,677.7 1,687.0 +9.3
Data
Urban W. Volumes (Kton)
Special W. Volumes (Kton)
Waste from third parties
Internal W. Volumes (Kton)
Total Volumes Treated
Q3 2016 Q3 2017 Ch.
525.8 508.8 (16.9)
569.5 661.0 +91.5
1,095.2 1,169.8 +74.6
593.6 328.0 (265.6)
1,688.8 1,497.8 (191.0)
9M 2016 9M 2017 Ch.
1,533.4 1,522.3 (11.2)
1,747.6 1,915.4 +167.8
3,281.0 3,437.7 +156.7
1,869.8 1,631.0 (238.9)
5,150.9 5,068.6 (82.2)

(m€)
Revenues
Ebitda
5,1% 5,5% 6,0% 6,6%
7,1% 7,6%
14,1% 15,0% 14,5% 14,5% 14,6% 15,0%
'15 '16 '17 '18 '19 '20Gas Electricity
Churn rates
Annex: Water
Growing results in Water
13 GRUPPOHERA
Q1 2016 Q1 2017 Ch.
179.4 201.8 +22.5
49.8 53.3 +3.4
Q2 2016 Q2 2017 Ch.
194.7 205.0 +10.2
56.8 58.1 +1.0
Q3 2016 Q3 2017 Ch.
220.3 219.9 (0.4)
67.1 66.9 (0.1)
9M 2016 9M 2017 Ch.
594.4 626.7 +32.4
173.7 178.3 +4.6
Data
Aqueduct (mm3)
Sewerage (mm3)
Purification (mm3)
Q1 2016 Q1 2017 Ch.
69.8 71.1 +1.3
57.3 54.8 (2.5)
56.8 54.6 (2.2)
Q2 2016 Q2 2017 Ch.
73.2 75.6 +2.4
60.8 67.0 +6.2
60.3 66.1 +5.8
Q3 2016 Q3 2017 Ch.
85.1 86.6 +1.5
70.5 72.1 +1.6
69.9 71.5 +1.5
9M 2016 9M 2017 Ch.
228.1 233.3 +5.2
188.6 193.9 +5.3
187.0 192.1 +5.2
9M 2016 9M 2017 Ch.
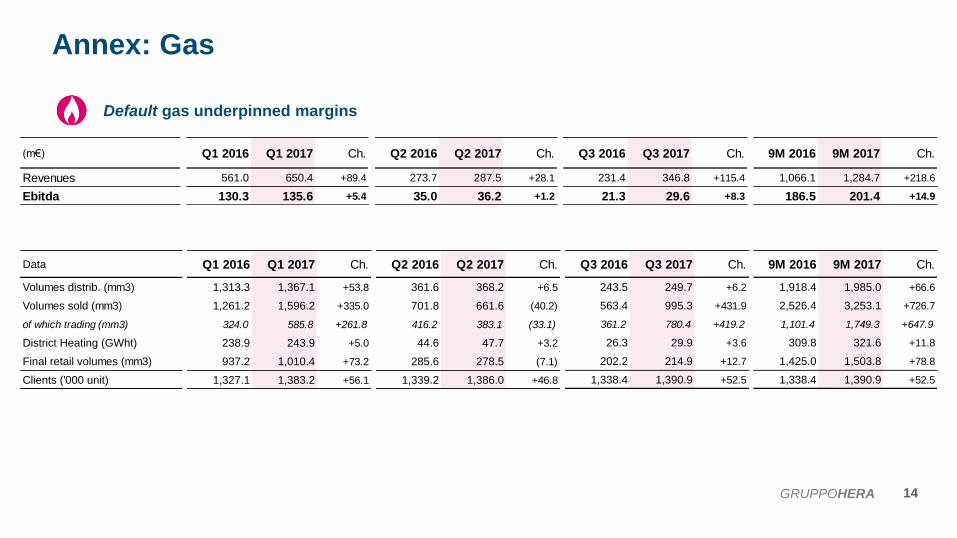
1,918.4 1,985.0 +66.6
2,526.4 3,253.1 +726.7
1,101.4 1,749.3 +647.9
309.8 321.6 +11.8
1,425.0 1,503.8 +78.8
1,338.4 1,390.9 +52.5
Q3 2016 Q3 2017 Ch.
243.5 249.7 +6.2
563.4 995.3 +431.9
361.2 780.4 +419.2
26.3 29.9 +3.6
202.2 214.9 +12.7
1,338.4 1,390.9 +52.5
Q2 2016 Q2 2017 Ch.
361.6 368.2 +6.5
701.8 661.6 (40.2)
416.2 383.1 (33.1)
44.6 47.7 +3.2
285.6 278.5 (7.1)
1,339.2 1,386.0 +46.8
Q1 2016 Q1 2017 Ch.
1,313.3 1,367.1 +53.8
1,261.2 1,596.2 +335.0
324.0 585.8 +261.8
238.9 243.9 +5.0
937.2 1,010.4 +73.2
1,327.1 1,383.2 +56.1
Data
Volumes distrib. (mm3)
Volumes sold (mm3)
of which trading (mm3)
District Heating (GWht)
Final retail volumes (mm3)
Clients ('000 unit)
9M 2016 9M 2017 Ch.
1,066.1 1,284.7 +218.6
186.5 201.4 +14.9
Q3 2016 Q3 2017 Ch.
231.4 346.8 +115.4
21.3 29.6 +8.3
Q2 2016 Q2 2017 Ch.
273.7 287.5 +28.1
35.0 36.2 +1.2
Q1 2016 Q1 2017 Ch.
561.0 650.4 +89.4
130.3 135.6 +5.4
(m€)
Revenues
Ebitda
5,1% 5,5% 6,0% 6,6%
7,1% 7,6%
14,1% 15,0% 14,5% 14,5% 14,6% 15,0%
'15 '16 '17 '18 '19 '20Gas Electricity
Churn rates
Annex: Gas
Default gas underpinned margins
14 GRUPPOHERA

9M 2016 9M 2017 Ch.
1,552.3 1,775.1 +222.8
104.3 147.4 +43.1
Q3 2016 Q3 2017 Ch.
545.5 627.6 +82.0
31.2 55.8 +24.7
Q2 2016 Q2 2017 Ch.
647.0 513.4 +186.8
41.5 43.1 +22.8
Q1 2016 Q1 2017 Ch.
359.8 634.1 +274.4
31.6 48.4 +16.8
(m€)
Revenues
Ebitda
Safeguarded clients underpinned margins
Annex: Electricity
15 GRUPPOHERA
Data
Volumes sold (GWh)
of which Salvaguardia (GWh)
Volumes distrib. (GWh)
Clients ('000 unit)
Q1 2016 Q1 2017 Ch.
2,524.2 2,478.9 (45.3)
656.5 507.1 (149.4)
747.6 751.2 +3.6
862.6 911.3 +48.6
Q2 2016 Q2 2017 Ch.
1,142.6 1,333.9 +191.3
520.3 486.0 (34.3)
699.4 716.5 +17.1
855.6 930.8 +75.2
Q3 2016 Q3 2017 Ch.
3,566.9 3,927.8 +360.8
520.5 745.6 +225.1
768.9 802.2 +33.3
8.2 33.3 +25.1
9M 2016 9M 2017 Ch.
7,233.7 7,740.6 +506.8
1,697.3 1,738.7 +41.4
2,215.9 2,269.9 +54.1
863.8 964.1 +100.3