analyst report nissei build kogyo co., ltd
TRANSCRIPT

ANALYST NET Company Report
Nissei Build Kogyo Co., Ltd. (Code 1916: First Section of the Tokyo Stock Exchange) Issue Date: February 3, 2015
1/26
This report is created by J-Phoenix Research Inc. (hereinafter JPR) simply for the purpose of providing information to the investors, not for soliciting any trading of securities. Although the report
is based on information and resources that JPR believed to be reliable, JPR does not guarantee against the accuracy, reliability, completeness, conformity or timeliness of any of the content. JPR
shall not be liable for any direct or indirect damage caused by the investors resulting from the use or reliance on the information contained herein. Investors are responsible for their own trading
of securities and other financial products. The intellectual property rights of this report belong to Toward the Infinite World, Inc. No part of this report may be reproduced, transcribed or cited
without the written consent of the company.
ADVANCING TO A NEW GROWTH STAGE
A company with a unique business portfolio of systemized construction and parking
structures
Nissei Build Kogyo is an integrated manufacturer and construction company, particularly
strong in systemized construction and parking structures. Systemized construction,
including assembly of prefabricated homes, exploits the potential of standardized building
components or units, and a tightly organized factory production system, to speedily provide
standardized buildings. Nissei Build’s business portfolio is distinguished by being strong in
the capacity to supply structures of 1,000 m2 or less in gross floor area. The enormous
reconstruction demand after the Tohoku earthquake and tsunami of March 2011 enabled
Nissei Build to expand sales from ¥17,204 million in FY3/2011 (fiscal year ended March
2011) to ¥41,854million in FY3/2012. During the same period, ROE (return on equity)
improved significantly from 2.6% to 20.6%. Offsetting a subsequent drop in reconstruction
demand, Nissei Build recorded sales of ¥41,854 million and ROE of 13.0% in FY3/2014
due to successful alliance and M&A strategies.
Advancing to a new growth stage, driven by alliance and M&A strategies
Nissei Build has the ability to provide customers throughout the nation with solutions and
the technological capabilities to realize the maximum potential of available space. Led by
Atsuhiro Morioka, second- generation president, Nissei Build has been aggressive in (1)
executing M&A strategy, (2) executing alliance strategy, (3) growing in high-margin
stock-based (as opposed to flow-based) business, and (4) expanding overseas. The
company’s Systemized Construction business has high growth potential in the domestic
market, estimated to be about ¥700 billion in scale. It is believed that Nissei Build is
advancing into a new growth stage, which has not been fully discounted in its current stock
price.
Anticipating the company’s specific longer-term growth-oriented message
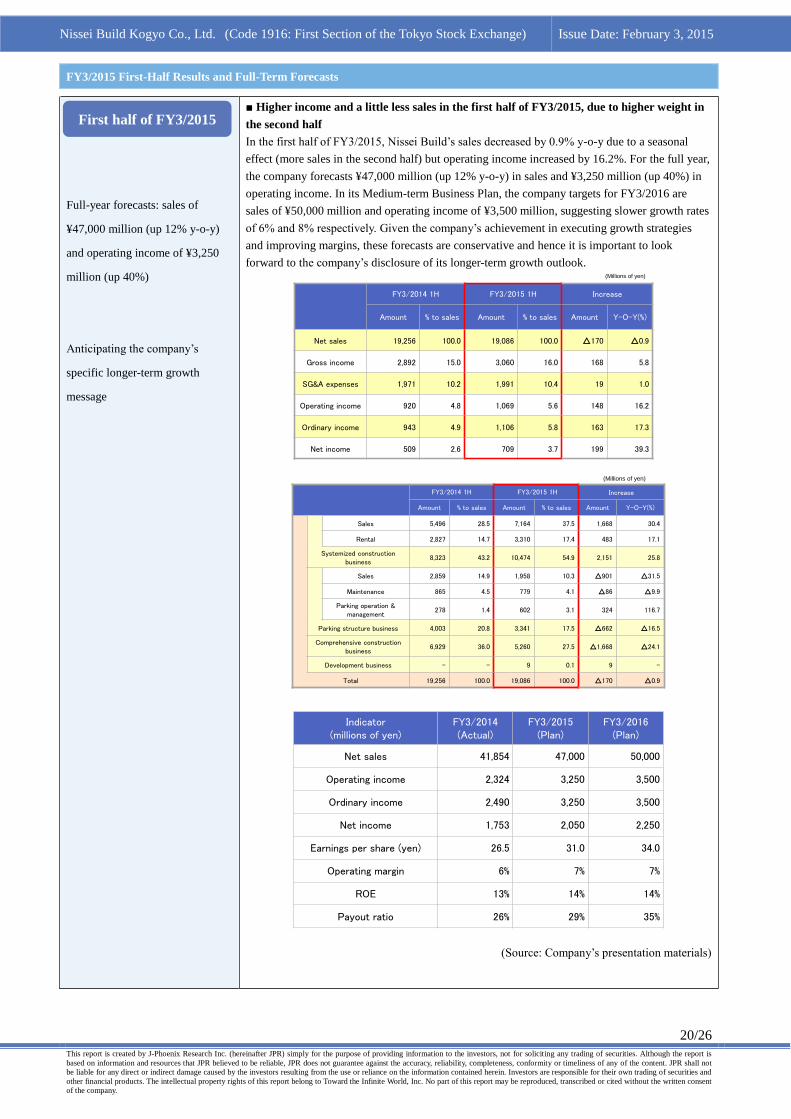
In the first half of FY3/2015, sales decreased by 0.9% y-o-y due to a seasonal effect (sales
tend to be higher in the second half) but operating income increased by 16.2%, led by
margin improvement. For the full year, the company forecasts ¥47,000 million (up 12%
y-o-y) in sales and ¥3,250 million (up 40%) in operating income. In its Medium- term
Business Plan, targets for FY3/2016 are sales of ¥50,000 million and operating income of
¥3,500 million, suggesting growth rates will slow down. In view of this, the company’s
longer-term growth outlook is of great interest.
Basic report
J-Phoenix Research Inc.
Osamu Miyashita, CFA
Basic corporate data
Location Ishikawa Pref.
Representative Atsuhiro Morioka
Established July 1961
Capital ¥7,002 mn
Listed Aug. 1978
URL www.nisseibuild..
co.jp
Industry sector Construction
Employees 478
Share information as of
Jan. 30, 2015
Stock price ¥281
52-week high ¥315
52-week low ¥219
Shares outstanding 71,113,200
Trading unit 1,000
Market cap ¥19,983 mn
DPS (est.) ¥9
EPS (est.) ¥31.00
PER (est.) 9.1x
BPS (actual) ¥221.66
PBR (actual) 1.28x
Fiscal term Sales ¥mn
YOY %
Operating income
¥mn
YOY %
Ordinary income
¥mn
YOY %
Net income ¥mn
YOY %
EPS ¥
Term-end closing share price ¥
High Low
March 2012 Actual 41,879 143.4 6,333 1,047.3 6,436 1,080.9 2,196 782.1 31.4 222 99
March 2013 Actual 25,487 -39.1 1,847 -70.8 1,979 -69.3 1,747 -20.4 26.1 212 108
March 2014 Actual 41,854 64.2 2,324 25.8 2,490 25.8 1,753 0.3 26.5 288 147
Apr.- Sep. 2013 Actual 19,256 71.9 920 69.3 943 60.0 509 45.4 7.7 217 147
Apr.-Sep. Sep. 2014 19,086 -0.9 1,069 16.2 1,106 17.3 709 39.3 10.9 315 219
March 2015 Est. 47,000 12.3 3,250 39.8 3,250 30.5 2,050 16.9 31.0 - -
* EPS, PER, BPS, and PBR are based on the number of shares outstanding, excluding that of the treasury stock.

Nissei Build Kogyo Co., Ltd. (Code 1916: First Section of the Tokyo Stock Exchange) Issue Date: February 3, 2015
2/26
This report is created by J-Phoenix Research Inc. (hereinafter JPR) simply for the purpose of providing information to the investors, not for soliciting any trading of securities. Although the report is
based on information and resources that JPR believed to be reliable, JPR does not guarantee against the accuracy, reliability, completeness, conformity or timeliness of any of the content. JPR shall not
be liable for any direct or indirect damage caused by the investors resulting from the use or reliance on the information contained herein. Investors are responsible for their own trading of securities and
other financial products. The intellectual property rights of this report belong to Toward the Infinite World, Inc. No part of this report may be reproduced, transcribed or cited without the written consent
of the company.
Nissei Build, founded in 1961,
built a nationwide network and
expanded businesses. Since
1996, Atushiro Morioka,
second-generation president, has
aggressively transformed the
company into an integrated
manufacturer.
Examples of systemized
construction structures
Examples of parking structures
■ Leadership of second-generation president and growth
Hiroshi Morioka founded Nissei Build as a garage manufacturing and sales company in 1961, with
17 employees. Over the following years the company has built a network of factories to provide
ability to supply its products nationwide, and was listed in the Second Section of the Osaka
Securities Exchange in 1978. Nissei Build then added more factories, expanded further, and was
listed in the First Section of the Tokyo Stock Exchange in 1996. In 1998, Atsuhiro Morioka became
the second president. Since then, Nissei Build has endeavored to realize organizational reform,
enhance its marketing and sales force, strengthen its group power, and promote its M&A strategy.
The company has been transformed into an integrated manufacturer with its core strength in
systemized construction and parking structures, and additionally, productive engagement in general
construction, development, and overseas businesses.
1961
The late Hiroshi Morioka founded Nissei Build as an assembly-type garage
manufacturing and sales company in Kanaiwa, Kanazawa City.
1968 Built a factory in Saitama Prefecture. Established the House Department.
1971 Built a factory in Fukuoka Prefecture.
1973 Built a factory in Iwate Prefecture.
1974 Established the Housing Section.
1978 Listed in the Second Section of the Osaka Securities Exchange
1979 Built a factory in Hokkaido Prefecture.
1980 Established the Building Material Business Section.
1981 Built a factory in Ishikawa Prefecture.
1988 Established the Parking Structure Business Section.
1989 Built a factory in Ehime Prefecture.
1991 Listed in the First Section of the Osaka Securities Exchange
1993 Established the Building Lease Business Department
1996 Listed in the First Section of the Tokyo Stock Exchange.
1998 Atsuhiro Morioka became the second-generation president.
1999 Established the Sales Management Division to control sections, which were
renamed from departments.
2000 Sections were integrated to the Housing Business Department and the Parking
Structure Business Department.
2007 Delisted from the First Section of the Osaka Securities Exchange and became
listed only in the First Section of the Tokyo Stock Exchange.
2008 Reformed the Organization with the aim of growing larger products and
enhancing business in the Greater Tokyo area.
2009 Established the Maintenance Department.
2010 Renamed the Tokyo Sales Office to Tokyo Branch Office to enhance business in
the Greater Tokyo area.
(Source: Prepared by JPR, based on company materials)
(Source: Prepared by JPR, based on company materials)
Corporate name Nissei Build Kogyo Co., Ltd.
Location 3-16-10 Kanaiwa-kita, Kanazawa City, Ishikawa Prefecture, Japan
Representative Atsuhiro Morioka, President
Established July 3, 1961
Capital 7,002 million yen
Employees 478 (as of March 31, 2014)
Fiscal term Ends March 31
Traded on Tokyo Stock Exchange (First Section)
Sales FY ended March 2014 ¥44,854mn (Consol.): ¥25,903mn (Non-consol.)
Business lines
• Sales of systemized construction (prefabricated houses, and unit houses); rental of prefabricated houses
• Sales, maintenance, and renewal of automated tower parking and multilevel parking
• Sales of parking facilities with ramps
• Construction and renovation construction of railways, civil engineering, and building works (by subsidiaries)
• Parking management and operation (by a subsidiary)
• Trading, brokerage, agency work, rental, and management of real estate (by a subsidiary)
• Comprehensive management and maintenance of commercial facilities, etc. (by a subsidiary)
• Planning, design, development, and management of software (by a subsidiary)
Corporate Profile and Business Characteristics
History and Corporate
Profile

Nissei Build Kogyo Co., Ltd. (Code 1916: First Section of the Tokyo Stock Exchange) Issue Date: February 3, 2015
3/26
This report is created by J-Phoenix Research Inc. (hereinafter JPR) simply for the purpose of providing information to the investors, not for soliciting any trading of securities. Although the report is
based on information and resources that JPR believed to be reliable, JPR does not guarantee against the accuracy, reliability, completeness, conformity or timeliness of any of the content. JPR shall not
be liable for any direct or indirect damage caused by the investors resulting from the use or reliance on the information contained herein. Investors are responsible for their own trading of securities and
other financial products. The intellectual property rights of this report belong to Toward the Infinite World, Inc. No part of this report may be reproduced, transcribed or cited without the written consent
of the company.
■ Providing clients with full-range services, including construction, maintenance, and
facilities management
The Nissei Build Group (see chart below) provides full-range services, including construction,
maintenance, and facilities management throughout Japan, in alliance with major six partner
companies. Overseas, the company mainly operates parking structure businesses in Singapore,
Thailand, and China. Plans have been made to set up a joint venture in Vietnam, with a local oil
plant construction and sales company and others, to engage in construction, sales, and maintenance
of parking structures.
■ Four major businesses
Nissei Build has four major businesses: (1) Systemized Construction; (2) Parking Structures; (3)
General Construction; and (4) Property Development.
(Source: Company’s presentation materials)
Nissei Build Asia Pte. Ltd.
Capital: ¥490mn
Owned: 100%
Employees: 144
Business lines:
Railway constructionBuilding construction
Civil engineering
Renovation
construction
Nisse Build Kogyo
NB Construction Ozawa Construction NB Parking NB Investment NB Facilities NB Networks
Capital: ¥50mn
Owned: 100%
Employees: 18
Business lines:
Building constructionCivil engineering
Capital: ¥30mn
Owned: 100%
Employees: 14
Business lines:
Operation and
management of car-
parking and bicycle-
parking facilities
Capital: ¥30mn
Owned: 100%
Employees: 3
Business lines:
Trade, brokerage,
agency business,
rental, and
management of real
estate
Capital: ¥37mn
Owned: 100%
Employees: 5
Business lines:
General management
and maintenance of
commercial facilities,
etc.
Capital: ¥30mn
Owned: 100%
Employees: 2
Business lines:
Planning, design,
development &
management of
software
Country: SingaporeCapital: SGD1.54mnOwned: 100%Employees: 1Business lines:Sales of parking structuresOperation and management of
parking facilities
Nissei Build GroupConsolidated sales: ¥41,854mn (FY3/2014)
Group employees: 678
(as of the end of September, 2014)
Country: ChinaOwned: 40%Capital: RMB17mnEmployees: 4Business lines:Operation,
management, and maintenance of parking facilities
Space Value (Thailand)Co., Ltd.
Country: ThailandCapital: THB10mnOwned: 49%Employees: 9Business lines:Sales of parking structuresOperation and management
of parking facilitiesSales of systemized
construction
Asia Parking Investment Pte. Ltd.
Country: SingaporeCapital: SGD1.3mnOwned: 80%Employees: -Business lines:Development and
investment of parking facilities
Shanghai Tiandi Nissei Parking
Management Co., Ltd.
Overseas Group Companies
Domestic Group CompaniesCapital: ¥7,002mn
Employees: 478
Systemized construction
business
Parking structure business
General construction
business
Property development
business (FY3/2015)
Systemized construction: Frontage of 10-40m; Use of H-type lightweight steel frame
Building structures with standardized components and via systemized processes in a single process from design to factory fabrication to on-site construction.
Nissei Build is the only Japanese company to perform systemized construction by using H-type lightweight steel frame.
Prefabricated houses: Frontage of less than 10m; use of C-type steel frame.
Quick construction, low cost, and flexible response to customer needs.
Unit houses: Assemble units from factory-fabricated components.
Automated tower parking: Maximum use of limited space by using an elevator.
Multi-stacked parking; A product line-up of two- to six-storied structures.
Parking with ramps: Safe, convenient, and cost-effective parking.
Maintenance service.
Coin-operated parking structures.
Construction related to condominiums, large facilities, and railways.
Anti-seismic reinforcement, large-scale repair of condominiums.
Large-scale home centers, medical and welfare facilities, large-scale commercial buildings, etc.
Development of condominiums and road-side buildings.
Introduction to the
Nissei Build Group
Business Outline
Nissei Build Kogyo Co., Ltd. (Code 1916: First Section of the Tokyo Stock Exchange) Issue Date: February 3, 2015
4/26
This report is created by J-Phoenix Research Inc. (hereinafter JPR) simply for the purpose of providing information to the investors, not for soliciting any trading of securities. Although the report is
based on information and resources that JPR believed to be reliable, JPR does not guarantee against the accuracy, reliability, completeness, conformity or timeliness of any of the content. JPR shall not
be liable for any direct or indirect damage caused by the investors resulting from the use or reliance on the information contained herein. Investors are responsible for their own trading of securities and
other financial products. The intellectual property rights of this report belong to Toward the Infinite World, Inc. No part of this report may be reproduced, transcribed or cited without the written consent
of the company.
Representative products
Interior of “Nissei V Span-S”
H-type lightweight steel frames
used in systemized construction
by Nissei Build
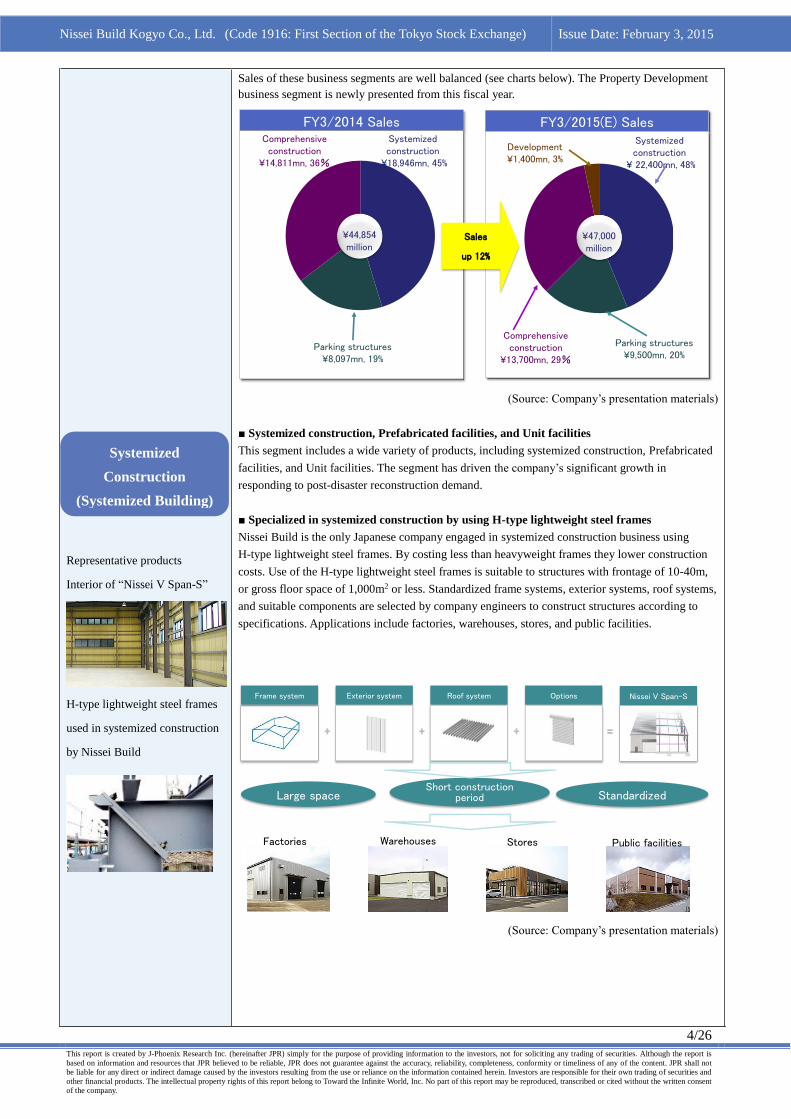
Sales of these business segments are well balanced (see charts below). The Property Development
business segment is newly presented from this fiscal year.
(Source: Company’s presentation materials)
■ Systemized construction, Prefabricated facilities, and Unit facilities
This segment includes a wide variety of products, including systemized construction, Prefabricated
facilities, and Unit facilities. The segment has driven the company’s significant growth in
responding to post-disaster reconstruction demand.
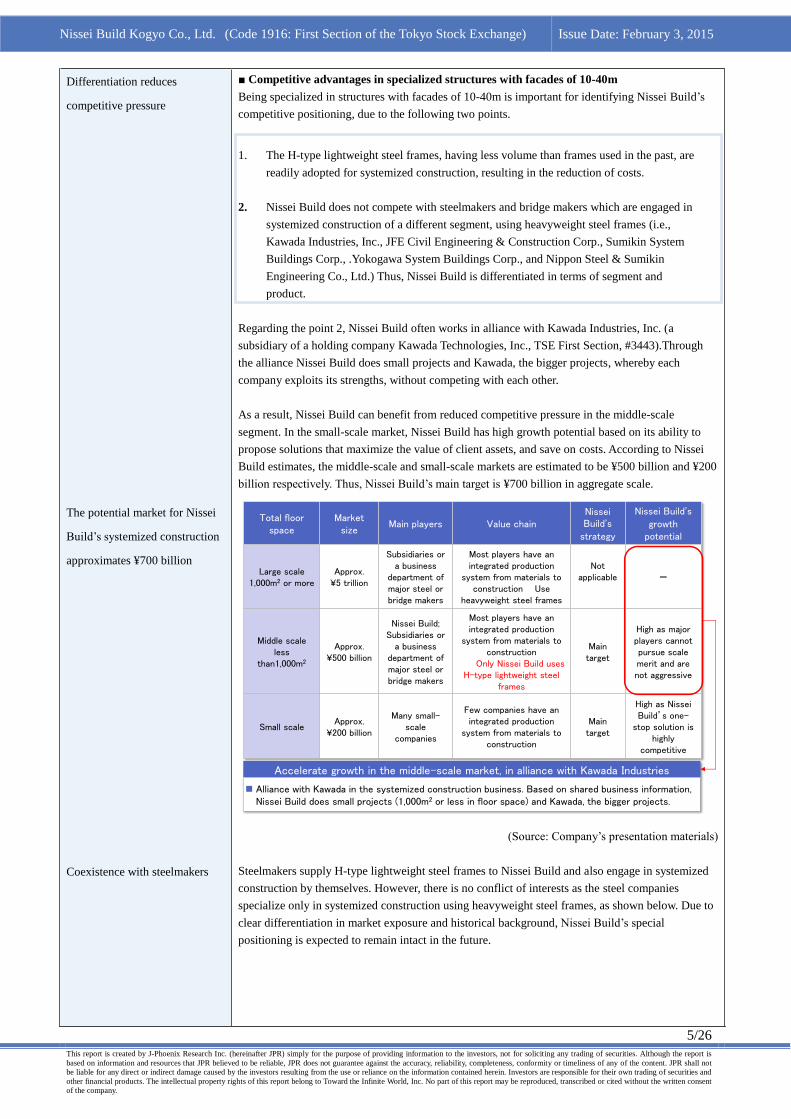
■ Specialized in systemized construction by using H-type lightweight steel frames
Nissei Build is the only Japanese company engaged in systemized construction business using
H-type lightweight steel frames. By costing less than heavyweight frames they lower construction
costs. Use of the H-type lightweight steel frames is suitable to structures with frontage of 10-40m,
or gross floor space of 1,000m2 or less. Standardized frame systems, exterior systems, roof systems,
and suitable components are selected by company engineers to construct structures according to
specifications. Applications include factories, warehouses, stores, and public facilities.
(Source: Company’s presentation materials)
FY3/2014 SalesSystemized construction
¥18,946mn, 45%
Parking structures¥8,097mn, 19%
Comprehensive construction
¥14,811mn, 36%
FY3/2015(E) SalesSystemized construction
¥ 22,400mn, 48%
Parking structures¥9,500mn, 20%
¥44,854million
¥47,000million
Comprehensive construction
¥13,700mn, 29%
Development ¥1,400mn, 3%
Sales
up 12%
Nissei V Span-SFrame system Exterior system Roof system Options
Large spaceShort construction
period Standardized
Factories Warehouses Stores Public facilities
Systemized
Construction
(Systemized Building)
Nissei Build Kogyo Co., Ltd. (Code 1916: First Section of the Tokyo Stock Exchange) Issue Date: February 3, 2015
5/26
This report is created by J-Phoenix Research Inc. (hereinafter JPR) simply for the purpose of providing information to the investors, not for soliciting any trading of securities. Although the report is
based on information and resources that JPR believed to be reliable, JPR does not guarantee against the accuracy, reliability, completeness, conformity or timeliness of any of the content. JPR shall not
be liable for any direct or indirect damage caused by the investors resulting from the use or reliance on the information contained herein. Investors are responsible for their own trading of securities and
other financial products. The intellectual property rights of this report belong to Toward the Infinite World, Inc. No part of this report may be reproduced, transcribed or cited without the written consent
of the company.
Differentiation reduces
competitive pressure
The potential market for Nissei
Build’s systemized construction
approximates ¥700 billion
Coexistence with steelmakers
■ Competitive advantages in specialized structures with facades of 10-40m
Being specialized in structures with facades of 10-40m is important for identifying Nissei Build’s
competitive positioning, due to the following two points.
1. The H-type lightweight steel frames, having less volume than frames used in the past, are
readily adopted for systemized construction, resulting in the reduction of costs.
2. Nissei Build does not compete with steelmakers and bridge makers which are engaged in
systemized construction of a different segment, using heavyweight steel frames (i.e.,
Kawada Industries, Inc., JFE Civil Engineering & Construction Corp., Sumikin System
Buildings Corp., .Yokogawa System Buildings Corp., and Nippon Steel & Sumikin
Engineering Co., Ltd.) Thus, Nissei Build is differentiated in terms of segment and
product.
Regarding the point 2, Nissei Build often works in alliance with Kawada Industries, Inc. (a
subsidiary of a holding company Kawada Technologies, Inc., TSE First Section, #3443).Through
the alliance Nissei Build does small projects and Kawada, the bigger projects, whereby each
company exploits its strengths, without competing with each other.
As a result, Nissei Build can benefit from reduced competitive pressure in the middle-scale
segment. In the small-scale market, Nissei Build has high growth potential based on its ability to
propose solutions that maximize the value of client assets, and save on costs. According to Nissei
Build estimates, the middle-scale and small-scale markets are estimated to be ¥500 billion and ¥200
billion respectively. Thus, Nissei Build’s main target is ¥700 billion in aggregate scale.
(Source: Company’s presentation materials)
Steelmakers supply H-type lightweight steel frames to Nissei Build and also engage in systemized
construction by themselves. However, there is no conflict of interests as the steel companies
specialize only in systemized construction using heavyweight steel frames, as shown below. Due to
clear differentiation in market exposure and historical background, Nissei Build’s special
positioning is expected to remain intact in the future.
Total floor space
Market size
Main players Value chainNissei Build’s
strategy
Nissei Build’s growth
potential
Large scale1,000m2 or more
Approx. ¥5 trillion
Subsidiaries or a business
department ofmajor steel or bridge makers
Most players have an integrated production
system from materials to construction Use
heavyweight steel frames
Not applicable -
Middle scaleless
than1,000m2
Approx. ¥500 billion
Nissei Build; Subsidiaries or
a business department ofmajor steel or bridge makers
Most players have an integrated production
system from materials to construction
Only Nissei Build uses H-type lightweight steel
frames
Main target
High as major players cannot pursue scale merit and are not aggressive
Small scaleApprox.
¥200 billion
Many small-scale
companies
Few companies have an integrated production
system from materials to construction
Main target
High as Nissei Build’s one-
stop solution is highly
competitive
Accelerate growth in the middle-scale market, in alliance with Kawada Industries
Alliance with Kawada in the systemized construction business. Based on shared business information, Nissei Build does small projects (1,000m2 or less in floor space) and Kawada, the bigger projects.

Nissei Build Kogyo Co., Ltd. (Code 1916: First Section of the Tokyo Stock Exchange) Issue Date: February 3, 2015
6/26
This report is created by J-Phoenix Research Inc. (hereinafter JPR) simply for the purpose of providing information to the investors, not for soliciting any trading of securities. Although the report is
based on information and resources that JPR believed to be reliable, JPR does not guarantee against the accuracy, reliability, completeness, conformity or timeliness of any of the content. JPR shall not
be liable for any direct or indirect damage caused by the investors resulting from the use or reliance on the information contained herein. Investors are responsible for their own trading of securities and
other financial products. The intellectual property rights of this report belong to Toward the Infinite World, Inc. No part of this report may be reproduced, transcribed or cited without the written consent
of the company.
Prefab house (image)
Nissei Build’s capabilities to
shorter construction time,
standardized formats, and lower
costs are highly acknowledged
by nationwide convenience
stores and other retail
franchisers
(Source: Company’s presentation materials)
■ Nissei’s prefab houses have facades of 10m or less
Prefabricated facilities (prefabs) are to manufacture pillars, beams, roofs, walls, and other
components of a building at off-site factories in advance and then assemble them on-site to
complete construction.
Nissei Build specializes in prefab housing having facades of 10m or less. Many components are
standardized, enabling high efficiency in both off-site factory production and on-site construction,
and ensuring that high standards of quality are satisfied. The rationalized entire processes from
design to production and construction helps lessen the overall work period and reduce construction
costs. Among the Nissei Build customers who benefit from this method are convenience store and
other retail business chains, including their franchisees, as chains require stores that are made
according to a high degree of standardization, resulting in cost reduction, more flexible store
development and reorganization. Nissei Build’s technological capabilities, ability to satisfy
customers, and nationwide presence are highly evaluated by those familiar with the company.
Steelmakers
Lightweight steel frames
Heavyweight steel frames
Bridge-related systemized construction
makers
Steelmaking-related systemized construction
makers
Only Nissei Build is insystemized construction
business, using lightweight steel frames
Frontage of 10-40m
Floor space of 1,000m2 or less
Frontage of 40m or more
Floor space of 1,000m2 or more
Due to different background, Nissei Build is differentiated from other makers, and has established a value chain optimal to its business characteristics, that acts to deter entrants from other groupings.
This has provided stability for the company.
Groundwork Pillar installation Beam and bracing installation
Exterior wall panel installation
Completion
Office buildings Stores Garages Public facilities
Short construction period Standardized
Coin-operated laundries
Systemized
Construction
(Prefabs)
Nissei Build Kogyo Co., Ltd. (Code 1916: First Section of the Tokyo Stock Exchange) Issue Date: February 3, 2015
7/26
This report is created by J-Phoenix Research Inc. (hereinafter JPR) simply for the purpose of providing information to the investors, not for soliciting any trading of securities. Although the report is
based on information and resources that JPR believed to be reliable, JPR does not guarantee against the accuracy, reliability, completeness, conformity or timeliness of any of the content. JPR shall not
be liable for any direct or indirect damage caused by the investors resulting from the use or reliance on the information contained herein. Investors are responsible for their own trading of securities and
other financial products. The intellectual property rights of this report belong to Toward the Infinite World, Inc. No part of this report may be reproduced, transcribed or cited without the written consent
of the company.
Installation of factory-made
finished products on site
Strong ability to propose
solutions and use technology for
effective use of space
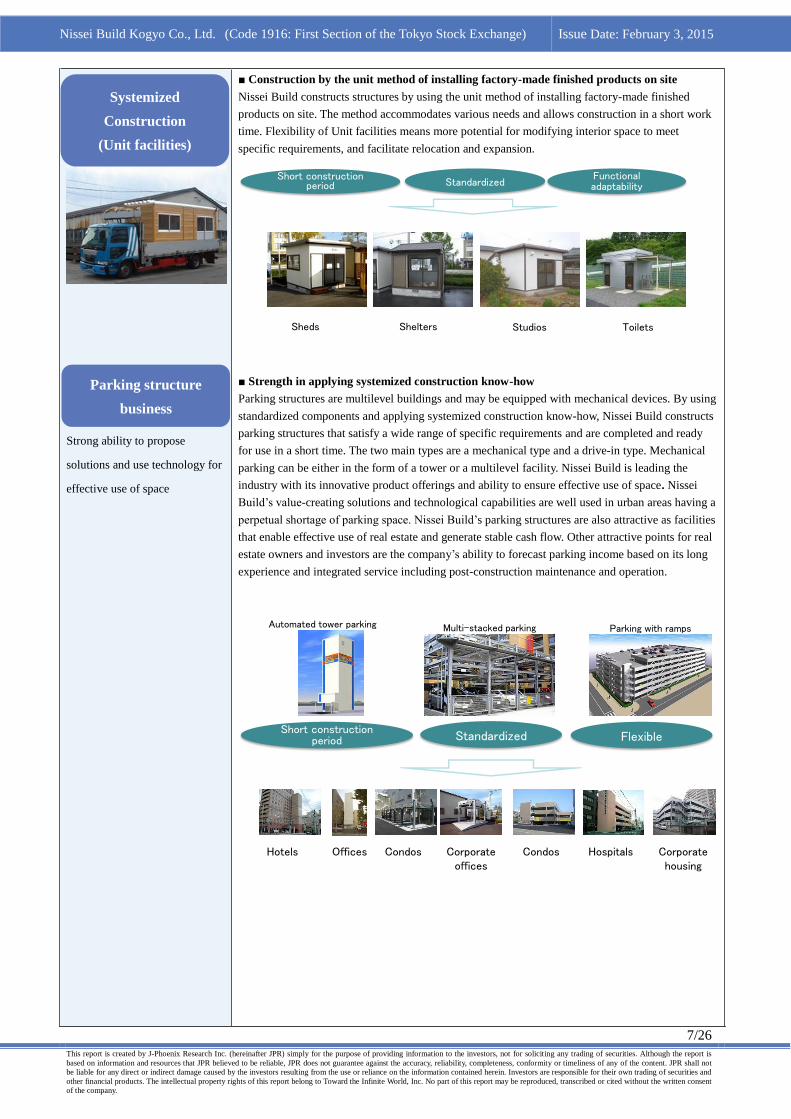
■ Construction by the unit method of installing factory-made finished products on site
Nissei Build constructs structures by using the unit method of installing factory-made finished
products on site. The method accommodates various needs and allows construction in a short work
time. Flexibility of Unit facilities means more potential for modifying interior space to meet
specific requirements, and facilitate relocation and expansion.
■ Strength in applying systemized construction know-how
Parking structures are multilevel buildings and may be equipped with mechanical devices. By using
standardized components and applying systemized construction know-how, Nissei Build constructs
parking structures that satisfy a wide range of specific requirements and are completed and ready
for use in a short time. The two main types are a mechanical type and a drive-in type. Mechanical
parking can be either in the form of a tower or a multilevel facility. Nissei Build is leading the
industry with its innovative product offerings and ability to ensure effective use of space. Nissei
Build’s value-creating solutions and technological capabilities are well used in urban areas having a
perpetual shortage of parking space. Nissei Build’s parking structures are also attractive as facilities
that enable effective use of real estate and generate stable cash flow. Other attractive points for real
estate owners and investors are the company’s ability to forecast parking income based on its long
experience and integrated service including post-construction maintenance and operation.
Short construction period Standardized
Functional adaptability
Sheds Shelters Studios Toilets
Short construction period Standardized Flexible
Automated tower parking
タワー式
Parking with rampsMulti-stacked parking
Hotels Offices Condos Corporate offices
HospitalsCondos Corporate housing
Systemized
Construction
(Unit facilities)
Parking structure
business
Nissei Build Kogyo Co., Ltd. (Code 1916: First Section of the Tokyo Stock Exchange) Issue Date: February 3, 2015
8/26
This report is created by J-Phoenix Research Inc. (hereinafter JPR) simply for the purpose of providing information to the investors, not for soliciting any trading of securities. Although the report is
based on information and resources that JPR believed to be reliable, JPR does not guarantee against the accuracy, reliability, completeness, conformity or timeliness of any of the content. JPR shall not
be liable for any direct or indirect damage caused by the investors resulting from the use or reliance on the information contained herein. Investors are responsible for their own trading of securities and
other financial products. The intellectual property rights of this report belong to Toward the Infinite World, Inc. No part of this report may be reproduced, transcribed or cited without the written consent
of the company.
Comprehensive support
Operates mainly in the Greater
Tokyo area
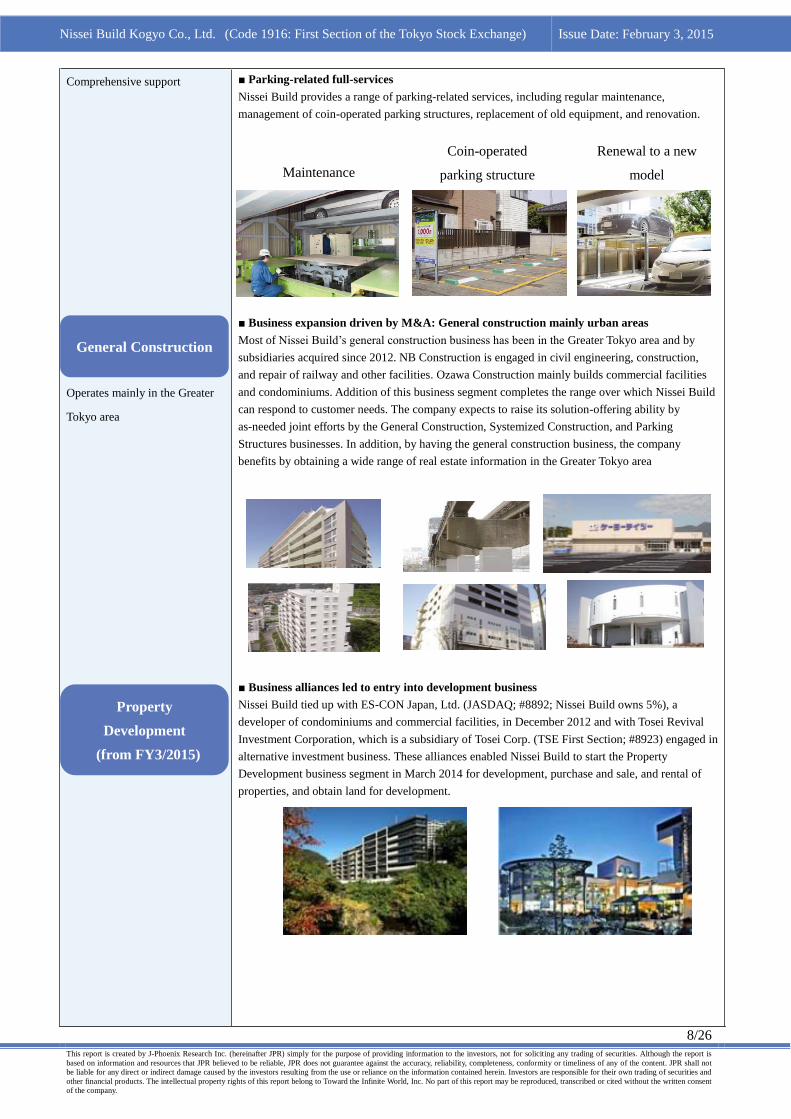
■ Parking-related full-services
Nissei Build provides a range of parking-related services, including regular maintenance,
management of coin-operated parking structures, replacement of old equipment, and renovation.
■ Business expansion driven by M&A: General construction mainly urban areas
Most of Nissei Build’s general construction business has been in the Greater Tokyo area and by
subsidiaries acquired since 2012. NB Construction is engaged in civil engineering, construction,
and repair of railway and other facilities. Ozawa Construction mainly builds commercial facilities
and condominiums. Addition of this business segment completes the range over which Nissei Build
can respond to customer needs. The company expects to raise its solution-offering ability by
as-needed joint efforts by the General Construction, Systemized Construction, and Parking
Structures businesses. In addition, by having the general construction business, the company
benefits by obtaining a wide range of real estate information in the Greater Tokyo area
■ Business alliances led to entry into development business
Nissei Build tied up with ES-CON Japan, Ltd. (JASDAQ; #8892; Nissei Build owns 5%), a
developer of condominiums and commercial facilities, in December 2012 and with Tosei Revival
Investment Corporation, which is a subsidiary of Tosei Corp. (TSE First Section; #8923) engaged in
alternative investment business. These alliances enabled Nissei Build to start the Property
Development business segment in March 2014 for development, purchase and sale, and rental of
properties, and obtain land for development.
General Construction
Renewal to a new
model
Property
Development
(from FY3/2015)
Maintenance
Coin-operated
parking structure

Nissei Build Kogyo Co., Ltd. (Code 1916: First Section of the Tokyo Stock Exchange) Issue Date: February 3, 2015
9/26
This report is created by J-Phoenix Research Inc. (hereinafter JPR) simply for the purpose of providing information to the investors, not for soliciting any trading of securities. Although the report is
based on information and resources that JPR believed to be reliable, JPR does not guarantee against the accuracy, reliability, completeness, conformity or timeliness of any of the content. JPR shall not
be liable for any direct or indirect damage caused by the investors resulting from the use or reliance on the information contained herein. Investors are responsible for their own trading of securities and
other financial products. The intellectual property rights of this report belong to Toward the Infinite World, Inc. No part of this report may be reproduced, transcribed or cited without the written consent
of the company.
Maximizing value by means of
combining three elements,
satisfying owners’ needs, and
sensitivity to features of the site
and its location
“Space is Value” is a corporate
slogan
■ Solution-providing ability and technological capabilities: two strengths to maximize usage
of space
Nissei Build’s strength lies in solution-providing ability and technological capability, that enable
maximal usage of space, and customers throughout the nation can avail themselves of these
advantages.
(Source: Prepared by JPR, based on company interview)
■ Three elements of solution-providing ability: ability to combine businesses, understand
customer needs, and provide full-range support.
First, ability to combine. Nissei Build combines its business of Systemized Construction, General
Construction, and Parking Structures and proposes a one-stop solution to maximize usage of space.
The Systemized Construction business facilitates shorter work time, greater space, standardized
products, lower price, and receptiveness to scrap-and-build situations. The General Construction
business responds to lasting individual customer needs. The Parking Structure business can realize
effective use of spare space and improve convenience. By combining these businesses for specific
projects, Nissei can better achieve maximizing customer value, based on needs of landowners and
business operators, characteristics of properties, and location conditions.
(Source: Prepared by JPR, based on company interview)
The second element is to understanding customers’ needs. Based on information provided by
alliance partners, Nissei Build strives to properly understand needs of prospective customers who
are interested in its solutions, and to make actionable proposals. Typical customers are convenience
store chains, hospitals, and public facilities.
Solution Providing Ability Technological Capability
Solution Providing Abilities and Technological Capabilities which pursue the maximization of the value of the space of
the real-estate for the landlords and the business operators are available nation-wide
1) Ability of
combining various
solutions
2) Ability of
understanding
needs of clients
3) Providing one
stop supporting
services
1) Own designing
and
manufacturing
Capability
2) Capability of
realizing
combination of
various solutions
3) Nation-wide
capability to
provide the same
quality of service
and facilities
Space
Needs
&
Feature of Real-estate
&
Conditions of
Location
Value Realization through
Systemized Construction
structures
Value Realization through
General Construction
Value Realization through
Parking Structures
“Space is Value”
Business Model Characteristics
Two strengths
enabling
maximization of space
usage
Three elements of
solution-providing
ability

Nissei Build Kogyo Co., Ltd. (Code 1916: First Section of the Tokyo Stock Exchange) Issue Date: February 3, 2015
10/26
This report is created by J-Phoenix Research Inc. (hereinafter JPR) simply for the purpose of providing information to the investors, not for soliciting any trading of securities. Although the report is
based on information and resources that JPR believed to be reliable, JPR does not guarantee against the accuracy, reliability, completeness, conformity or timeliness of any of the content. JPR shall not
be liable for any direct or indirect damage caused by the investors resulting from the use or reliance on the information contained herein. Investors are responsible for their own trading of securities and
other financial products. The intellectual property rights of this report belong to Toward the Infinite World, Inc. No part of this report may be reproduced, transcribed or cited without the written consent
of the company.
Slashing the requirement for
skilled workers means Nissei
Build is less affected by the labor
shortage problem than
constructors using conventional
methods
The third element is provision of full-range support. Nissei Build is committed to provide a
one-stop, most-appropriate support for the constructed building.
(Source: Prepared by JPR, based on company interview)
■ Three elements of technological capability: provision of own design and production service,
ability to form combinations, and offering of the same level of capabilities nationwide
The first element is the company’s own design and production capabilities. In an integrated
manner, Nissei Build designs and manufactures steel frames, walls, roofs, and other building
components and devises control programs for tower parking facilities. Standardized mass
production helps lower costs and the construction technology reduce the need for veteran
construction workers, which enables restraint of overall costs and shortening of construction
periods.
The second element is ability to flexibly realize combinations. Depending on customer needs and
characteristics of sites and building requirements, Nissei Build can come up with a wide variety of
proposals by combining the specialties of Systemized Construction (i.e., “Nissei V Span-S,” prefab
houses and Unit facilities for sale or lease), General Construction, and Parking Structures
(mechanical, drive-in, coin-operated parking, or their combination) segments and by developing
proposals using its technological capabilities.
The third element is provision of identical-quality technical services of design, manufacturing, and
construction by Nissei Build’s own factories, partner building contractors, and sales offices across
Japan. The company is less affected by the labor shortage problem, compared to constructors using
conventional methods, as it does not require skilled workers. Moreover, it can fully respond to
market needs throughout the nation.
Design
Constru
ctio
n
Com
pletio
n
Ope
ration an
d m
anage
ment
Main
tenan
ce
Renew
al
Ope
ration an
d m
anage
ment
Dism
antle
ment
Three elements of
technological
capabilities

Nissei Build Kogyo Co., Ltd. (Code 1916: First Section of the Tokyo Stock Exchange) Issue Date: February 3, 2015
11/26
This report is created by J-Phoenix Research Inc. (hereinafter JPR) simply for the purpose of providing information to the investors, not for soliciting any trading of securities. Although the report is
based on information and resources that JPR believed to be reliable, JPR does not guarantee against the accuracy, reliability, completeness, conformity or timeliness of any of the content. JPR shall not
be liable for any direct or indirect damage caused by the investors resulting from the use or reliance on the information contained herein. Investors are responsible for their own trading of securities and
other financial products. The intellectual property rights of this report belong to Toward the Infinite World, Inc. No part of this report may be reproduced, transcribed or cited without the written consent
of the company.
Sustainable long-term
value-creating chain realized by
providing one-stop solutions
Enhanced ability to collect
information, through alliances
■Value-creating chain to maximize usage of space
With the aim of strengthening its strengths in making proposals and technological capabilities,
Nissei Build focuses on realizing a sustainable long-term value-creating chain by offering one-stop
solutions to customers. The sequence of this chain processes is as follows: collect information
construct manage enhance functional and asset value anticipate future needs provide
new ways to utilize space.
(Source: Company presentation materials)
To collect information is the first step of the value-creating chain. Nissei Build has enhanced this
step by making the following alliances since 2012.
(Source: Company presentation materials)
The Nissei Build Group has also established arrangements to realize all steps of the value-creating
chain, and does this by means of the above-mentioned M&A strategy. By having pursued this
since 2012, the entire structure has now been completed and is ready to be activated.
Nissei Build’s one-stop solution forms
a long-term sustainable value-creating chain
Through alliance partners, collect nation-wide information on land with development potential in connection with business activity
Provide realistic, convincing construction proposals, combined with comprehensive construction expertise
Manage
Enhance functional and asset value
Construct
Operate and manage the constructed property in optimal condition
Enhance the value of property through good facility management and maintenance
Anticipate future needs
Perform large-scale repair or renovation work in keeping with changing needs
Collect information
Pro
vide w
ays to u
tilize spac
e
GE Capital Japan
ORIX Corporation
ES-CON Japan Ltd
Luckland Co., Ltd.
Tosei Revival Investment Corporation
Business alliance for introduction of lease clients
Business alliance for introduction of lease clients
Business and capital alliance for development of condominiums and commercial facilities
Nissei Build owns a 5% stake
Business and capital alliance on development of new products and clients
Cross-shareholding of ¥50 million with Nissei Build
Business alliance on real estate development, renewal, and property management
Kawada
Industries, Inc.
Business alliance for systemized construction; Nissei Build does small projects (1,000m2 or less in floor space), Kawada does bigger projects
Clients of all sectors; financing
Store openings;
planning and design of
commercial facilities
Need for building renewals
Need for systemized construction
Type of information
Alliance partners DetailsStart time
Sep. 2012
Aug. 2012
Nov. 2012
Nov. 2012
Apr. 2013
Sep. 2013
How to create
corporate value
Nissei Build Kogyo Co., Ltd. (Code 1916: First Section of the Tokyo Stock Exchange) Issue Date: February 3, 2015
12/26
This report is created by J-Phoenix Research Inc. (hereinafter JPR) simply for the purpose of providing information to the investors, not for soliciting any trading of securities. Although the report is
based on information and resources that JPR believed to be reliable, JPR does not guarantee against the accuracy, reliability, completeness, conformity or timeliness of any of the content. JPR shall not
be liable for any direct or indirect damage caused by the investors resulting from the use or reliance on the information contained herein. Investors are responsible for their own trading of securities and
other financial products. The intellectual property rights of this report belong to Toward the Infinite World, Inc. No part of this report may be reproduced, transcribed or cited without the written consent
of the company.
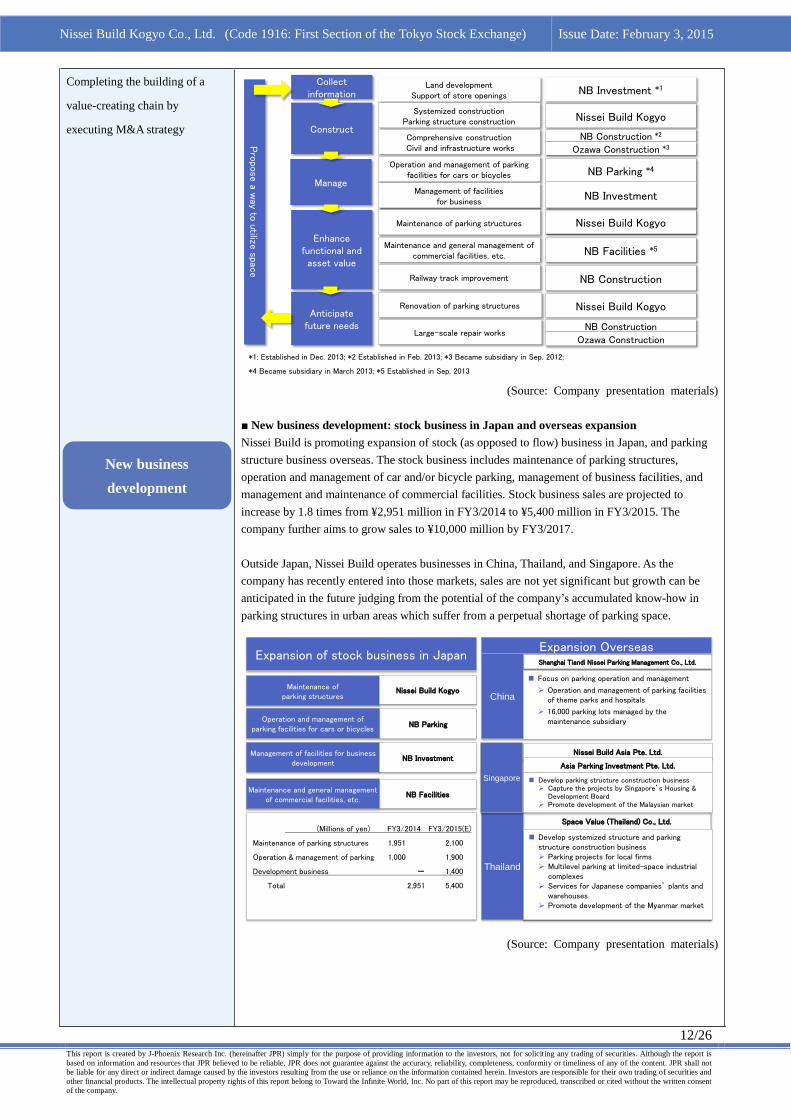
Completing the building of a
value-creating chain by
executing M&A strategy
(Source: Company presentation materials)
■ New business development: stock business in Japan and overseas expansion
Nissei Build is promoting expansion of stock (as opposed to flow) business in Japan, and parking
structure business overseas. The stock business includes maintenance of parking structures,
operation and management of car and/or bicycle parking, management of business facilities, and
management and maintenance of commercial facilities. Stock business sales are projected to
increase by 1.8 times from ¥2,951 million in FY3/2014 to ¥5,400 million in FY3/2015. The
company further aims to grow sales to ¥10,000 million by FY3/2017.
Outside Japan, Nissei Build operates businesses in China, Thailand, and Singapore. As the
company has recently entered into those markets, sales are not yet significant but growth can be
anticipated in the future judging from the potential of the company’s accumulated know-how in
parking structures in urban areas which suffer from a perpetual shortage of parking space.
(Source: Company presentation materials)
Enhance functional and asset value
Anticipate future needs
Manage
Construct
Collect information
Nissei Build Kogyo
NB Construction *2
Ozawa Construction *3
NB Parking *4
NB Facilities *5
NB Investment *1Land developmentSupport of store openings
Systemized constructionParking structure construction
Comprehensive constructionCivil and infrastructure works
Operation and management of parking facilities for cars or bicycles
Management of facilities for business
Maintenance of parking structures
Maintenance and general management of commercial facilities, etc.
Railway track improvement
Renovation of parking structures
Large-scale repair works
Nissei Build Kogyo
Nissei Build Kogyo
NB Investment
NB Construction
NB Construction
Ozawa Construction
Pro
pose
a way to
utilize spac
e
*1: Established in Dec. 2013; *2 Established in Feb. 2013; *3 Became subsidiary in Sep. 2012;
*4 Became subsidiary in March 2013; *5 Established in Sep. 2013
Expansion of stock business in Japan
NB Facilities
Maintenance ofparking structures
Maintenance and general management of commercial facilities, etc.
Nissei Build Kogyo
NB Parking Operation and management of
parking facilities for cars or bicycles
(Millions of yen) FY3/2014 FY3/2015(E)
Maintenance of parking structures 1,951 2,100
Operation & management of parking 1,000 1,900
Development business - 1,400
Total 2,951 5,400
Management of facilities for business development
NB Investment
Expansion OverseasShanghai Tiandi Nissei Parking Management Co., Ltd.
Space Value (Thailand) Co., Ltd.
China
Thailand
Singapore
Nissei Build Asia Pte. Ltd.
Asia Parking Investment Pte. Ltd.
Focus on parking operation and management
Operation and management of parking facilities of theme parks and hospitals
16,000 parking lots managed by the maintenance subsidiary
Develop systemized structure and parking structure construction business Parking projects for local firms Multilevel parking at limited-space industrial
complexes Services for Japanese companies’ plants and
warehouses Promote development of the Myanmar market
Develop parking structure construction business Capture the projects by Singapore’s Housing &
Development Board Promote development of the Malaysian market
New business
development

Nissei Build Kogyo Co., Ltd. (Code 1916: First Section of the Tokyo Stock Exchange) Issue Date: February 3, 2015
13/26
This report is created by J-Phoenix Research Inc. (hereinafter JPR) simply for the purpose of providing information to the investors, not for soliciting any trading of securities. Although the report is
based on information and resources that JPR believed to be reliable, JPR does not guarantee against the accuracy, reliability, completeness, conformity or timeliness of any of the content. JPR shall not
be liable for any direct or indirect damage caused by the investors resulting from the use or reliance on the information contained herein. Investors are responsible for their own trading of securities and
other financial products. The intellectual property rights of this report belong to Toward the Infinite World, Inc. No part of this report may be reproduced, transcribed or cited without the written consent
of the company.
■ Higher fixed-cost coverage ratio enhances value creation
The stock business has high growth potential. Target sales are ¥10,000 million in FY3/2017. This
business has a higher gross margin, 30-40%, than other businesses. Expansion of the stock business
will make the company’s profit structure more resilient and will better cover fixed costs.
(Source: Company’s presentation materials)
■ Business segments and segmentation
Business segments and segmentation, including non-consolidated subsidiaries, are summarized
below. Note, however, that NB Facilities, which is engaged in facility management, and overseas
subsidiaries are not consolidated.
(Source: Company presentation materials)
FY3/2015
¥5.4bn (E) in sales
Aim over ¥10bn in sales
in around FY3/2017• Accelerate sales by acquiring maintenance management
companies, as wide-range synergies in use of space can be expected
Maintenance and general management
of commercial facilities, etc.
• Accelerate sales by acquiring parking facility management companies, as wide-range synergies in use of space can be expected
Operation and management of
parking facilities for cars or bicycles
Management of business facilities
(Development business)
• Promotion of increase in management assets to include visible cash-flow parking facilities adjacent to convenience stores, and hospitals
• Focus on less economic sensitive projects with ensured exit strategy
FY3/2015 Sales Plan by Segment
Systemized construction business
¥22,400mn,
48%
販売事業12,41430%
Parking structure business
¥9,500mn, 20%
¥47,000million
Development business¥1,400mn, 3%
Comprehensive construction business
¥13,700mn, 29%
Systemized construction
Parking structures
Comprehensive construction
Development
Nissei Build Kogyo (Parent)
NB Construction
Ozawa Construction
NB Parking
NB Investment
Nissei Build Kogyo (Parent)
Nissei Build Kogyo (Parent)
Non-consolidated subsidiaries
Equity income affiliate
NB Facilities
Space Value (Thailand) Co., Ltd.
Nissei Build Asia Pte. Ltd.
Asia Parking Investment Pte. Ltd.
Shanghai Tiandi Nissei Parking Management Co., Ltd.
Business Segmentation
Financial implication
of stock business
expansion
Business segments and
segmentation

Nissei Build Kogyo Co., Ltd. (Code 1916: First Section of the Tokyo Stock Exchange) Issue Date: February 3, 2015
14/26
This report is created by J-Phoenix Research Inc. (hereinafter JPR) simply for the purpose of providing information to the investors, not for soliciting any trading of securities. Although the report is
based on information and resources that JPR believed to be reliable, JPR does not guarantee against the accuracy, reliability, completeness, conformity or timeliness of any of the content. JPR shall not
be liable for any direct or indirect damage caused by the investors resulting from the use or reliance on the information contained herein. Investors are responsible for their own trading of securities and
other financial products. The intellectual property rights of this report belong to Toward the Infinite World, Inc. No part of this report may be reproduced, transcribed or cited without the written consent
of the company.
■ Nine directors and three auditors
Nissei Build has one outside director and two outside auditors.
President and Representative Director Atsuhiro Morioka
Senior Managing Director Naoki Morioka
Managing Director Yoshiaki Motoyoshi
Managing Director, General Manager of the
Production Division
Keiji Fujiwara
Director, General Manager of the Sales
Division
Masao Nawamaki
Director, General Manager of the
Engineering Division
Nobu Tanida
Director, Manager of the Greater Tokyo
Business Section and of the Kanto Block, the
Sales Division
Hideki Ueda
Director, General Manager of the
Maintenance Division
Koji Kotani
Director Junya Kikuchi (Outside Director)
Full-time Auditor Akihiro Matsumoto
Auditor Shouji Arakawa (Outside Auditor)
Auditor Mitsuhiro Tokuno (Outside Auditor)
(Source: Securities Filing; as of March 31, 2014)
■ Well-diversified shareholder structure
The ten largest shareholders are well diversified with financial institutions such as banks and
securities companies ranking at the top. The founder’s family, owning less than 10%, does not
have controlling interest. The composition of the board of directors and of the body of
shareholders indicates that corporate governance is functioning well with no great cause for
concern.
Major shareholders Shares owned
(Thousands)
Voting
rights
(%)
1 The Master Trust Bank of Japan, Ltd. (Trust
Account)
6,307 8.87
2 Japan Trustee Services Bank, Ltd. (Trust
Account)
5,594 7.87
3 Morioka International Ltd. 4,551 6.40
4 Hokuriku Bank, Ltd. 2,684 3.77
5 Hokkoku Bank, Ltd. 2,607 3.67
6 The Nomura Trust and Banking Co., Ltd.
(Investment Trust Account)
2,235 3.14
7 Nippon Life Insurance Company 2,055 2.89
8 BNP-Paribas Securities Services 1,660 2.33
9 Atsuhiro Morioka 1,423 2.00
10 Goldman Sachs International 1,367 1.92
(Source: Securities Filing; as of March 31, 2014)
■ Standard dividend policy
According to securities filings, Nissei Build’s basic dividend policy is to maintain stable
dividend payments and take into account a comprehensive range of factors, including financial
conditions and plans for future business development. The company also intends to secure
internal reserves for efficient investment for business growth and for future returning of profit.
The company’s payout ratio is not low at 30.4% in FY3/2014 and is expected to be about 30%
in the near future years.
Corporate Governance
Board of Directors
Major shareholders
Policy to return profits
to shareholders

Nissei Build Kogyo Co., Ltd. (Code 1916: First Section of the Tokyo Stock Exchange) Issue Date: February 3, 2015
15/26
This report is created by J-Phoenix Research Inc. (hereinafter JPR) simply for the purpose of providing information to the investors, not for soliciting any trading of securities. Although the report is
based on information and resources that JPR believed to be reliable, JPR does not guarantee against the accuracy, reliability, completeness, conformity or timeliness of any of the content. JPR shall not
be liable for any direct or indirect damage caused by the investors resulting from the use or reliance on the information contained herein. Investors are responsible for their own trading of securities and
other financial products. The intellectual property rights of this report belong to Toward the Infinite World, Inc. No part of this report may be reproduced, transcribed or cited without the written consent
of the company.
■ Political, economic, and social environment based evaluation
Negative factors for Nissei Build include sustained high building material prices and concerns
over the rise in labor cost, caused by a labor shortage. In contrast, positive factors are the expected
rise of real estate prices mainly in the Great Tokyo area, ahead of the 2020 Tokyo Olympics, rising
benefits from land management induced by lower interest rates, and greater needs for property
management in anticipation of the January 2015 rise in the inheritance tax. As real estate tends to
be evaluated lower than cash in assessing value for inheritance tax, there is a growing need to
convert cash into real estate, as a way to reduce inheritance tax obligations.
■ Five force analysis: Strong and solid market positioning
As shown in the chart below, Nissei Build has established a strong positioning in all five forces.
(Source: Company’s presentation materials)
■ Assessment of management resources by VRIO analysis
Nissei Build is highly valued as it has established competent management resources in all four
factors: value, rareness, imitability, and organization.
(Source: Company’s presentation materials)
Competitive rivalryThreat of new entrants Threat of substitutes
Relationship with partners
Strong and solid relations with clients
Few companies offer one-stop solutions in Nissei Build’s targeted middle-and small-scale markets.
Limited competition
It is not easy to provide a comprehensive service with a nationwide production network such as that of Nissei Build.
Low risk
Nissei Build’s products replace conventional methods.
Low substitution risk
Clients such as convenience store chains highly regard Nissei Build’s capability to provide solutions based on understanding of the client’s business.
Clients are highly satisfied with Nissei Build’s systemized construction (for 1,000m2 or less) and parking structures.
Nissei Build has established strong relationships of trust with intermediate companies or agencies, who in turn are trusted by clients.
The life cycle maintenance enables to last long-term relationship.
Information providing partners: Alliances with Nissei Build invigorates their business
Building contractors in partnership: Profit from handling Nissei Build’s differentiated products
Steelmakers: Nissei Build established a strong relationships of trust as a large client to purchase lightweight steel frames
Strong and solid relations
Value
Nissei Build’s total solutions to maximize space value and satisfy client needs, which are available nationwide, have proven highly valuable to operators of chain stores.
Rarity
Nissei Build is the only company in Japan to do systemized construction by using H-type lightweight steel frame for structures of 10-40 m in frontage and 1,000m2 or less in gross floor space in Japan.
Very few companies provide one-stop solution for small-scale structures, from component fabrication to construction and maintenance.
Imitability
It is difficult to imitate systemized construction starting with component fabrication.
Nissei Build’s human resources who market total solutions and respond to client needs are difficult to replicate.
Organization
Nissei Build is organized to provide one-stop solutions from component fabrication to construction and maintenance for systemized construction of 1,000m2 or less.
Nissei Build is capable of proposing use of space of the target businesses and do actual construction as one-stop.
Business Model Evaluation
Evaluation concerning
external environments
Five force analysis
VRIO analysis

Nissei Build Kogyo Co., Ltd. (Code 1916: First Section of the Tokyo Stock Exchange) Issue Date: February 3, 2015
16/26
This report is created by J-Phoenix Research Inc. (hereinafter JPR) simply for the purpose of providing information to the investors, not for soliciting any trading of securities. Although the report is
based on information and resources that JPR believed to be reliable, JPR does not guarantee against the accuracy, reliability, completeness, conformity or timeliness of any of the content. JPR shall not
be liable for any direct or indirect damage caused by the investors resulting from the use or reliance on the information contained herein. Investors are responsible for their own trading of securities and
other financial products. The intellectual property rights of this report belong to Toward the Infinite World, Inc. No part of this report may be reproduced, transcribed or cited without the written consent
of the company.
Growth, driven first by
reconstruction demand, and then
M&A and alliance strategies
Growth was accelerated by
aggressive alliance strategy in and
after 2012
■ Assessment in growth
Nissei Build’s sales surged in FY3/2012, due to strong post-earthquake reconstruction demand,
after which sales increased due to the M&A and alliance strategies. Based on the company’s
forecasts up to FY3/2016, the expected compound annual growth rates in sales, operating income,
and net income from FY3/2010 to FY3/2016 are 17.0%, 42.1%, and 42.8% respectively.
(Source: Company’s presentation materials)
By business segment, the Parking Structure business recorded double-digit sales growth of 26.9%
y-o-y in FY3/2013, 39.0% in FY3/2014, and is estimated to grow 17.3% in FY3/2015. This
includes a strong contribution from the alliance strategy. The Systemized Construction segment is
projected to increase sales by 18.2% y-o-y for FY3/2015, with almost no negative impact from the
disappearance of reconstruction demand. Since 2012, growth has appeared boosted by business
expansion driven by aggressively making alliances.
(Source: Prepared by JPR, based on Securities Filing)
Indicators(millions of yen)
FY3/2010 FY3/2011 FY3/2012 FY3/2013 FY3/2014FY3/2015
(Plan)FY3/2016
(Plan)
Net sales 18,367 17,204 41,879 25,487 41,854 47,000 50,000
Gross profit 3,305 3,148 9,591 5,271 6,356 7,650 8,300
SG&A expenses 2,911 2,596 3,258 3,423 4,031 4,400 4,800
Operating income 394 552 6,333 1,847 2,324 3,250 3,500
Ordinary income 477 545 6,436 1,979 2,490 3,250 3,500
Net income 242 249 2,196 1,747 1,753 2,050 2,250
0
10,000
20,000
30,000
40,000
50,000
60,000
Net Sales
0
500
1,000
1,500
2,000
2,500
Operating Income
0
1,000
2,000
3,000
4,000
5,000
6,000
7,000
Net Income(Millions
of yen)
(Millions
of yen)
(Millions
of yen)
Indicators
(millions of yen)FY3/2010 FY3/2011 FY3/2012 FY3/2013 FY3/2014
FY3/2015
(Plan)
Net sales 18,367 17,204 41,879 25,487 41,854 47,000
Systemized
construction business11,367 11,327 37,288 18,236 18,945 22,400
Parking structure
business6,998 5,877 4,590 5,824 8,097 9,500
General construction
business0 0 0 1,426 14,811 13,700
Property development
business 0 0 0 0 0 1,400
Sales Growth Ratio -25.0% -6.3% 143.4% -39.1% 3.9% 18.2%
Systemized
construction business-0.4% 229.2% -51.1% 3.9% 18.2%
Parking structure
business-16.0% -21.9% 26.9% 39.0% 17.3%
General construction
business-7.5%
Financial analysis

Nissei Build Kogyo Co., Ltd. (Code 1916: First Section of the Tokyo Stock Exchange) Issue Date: February 3, 2015
17/26
This report is created by J-Phoenix Research Inc. (hereinafter JPR) simply for the purpose of providing information to the investors, not for soliciting any trading of securities. Although the report is
based on information and resources that JPR believed to be reliable, JPR does not guarantee against the accuracy, reliability, completeness, conformity or timeliness of any of the content. JPR shall not
be liable for any direct or indirect damage caused by the investors resulting from the use or reliance on the information contained herein. Investors are responsible for their own trading of securities and
other financial products. The intellectual property rights of this report belong to Toward the Infinite World, Inc. No part of this report may be reproduced, transcribed or cited without the written consent
of the company.
Operating margin is improving
from 5.6% in FY3/2014 to 7.0%
in FY3/2016
General Construction business
improves margin by selective
order-taking
■ Evaluation of margins, EPS, and payout ratio
After a spike in FY3/2012, margins have dropped with the fading away of reconstruction demand.
Operating margin is expected to gradually improve from 5.6% in FY3/2014 to 6.9% estimated for
FY3/2015 and 7.0% estimated for FY3/2016.
(Source: Company’s presentation materials)
Segment information reveals that General Construction, driven by M&A activities and added in
FY3/2013, has a lower margin compared to the Systemized Construction segment and the Parking
Structure segment. The General Construction segment became more selective in receiving orders
and the improved margin enabled a swing back to profits in FY3/2014.
(Source: Prepared by JPR, based on securities filing)
Ratios (millions of yen)
FY3/2010 FY3/2011 FY3/2012 FY3/2013 FY3/2014FY3/2015
(Plan)FY3/2016
(Plan)
Gross margin 18.0% 18.3% 22.9% 20.7% 15.2% 16.3% 16.6%
SG&A expenses to sales
15.8% 15.1% 7.8% 13.4% 9.6% 9.4% 9.6%
Operating margin 2.1% 3.2% 15.1% 7.3% 5.6% 6.9% 7.0%
Ordinary margin 2.6% 3.2% 15.4% 7.8% 5.9% 6.9% 7.0%
Net margin 1.3% 1.4% 5.2% 6.9% 4.2% 4.4% 4.5%
0%
5%
10%
15%
20%
25%
Gross Margin
0%
1%
2%
3%
4%
5%
6%
7%
8%
Net Margin
0%
2%
4%
6%
8%
10%
12%
14%
16%
Operating Margin
Ratios (millions of yen) FY3/2013 FY3/2014
Sales
Systemized construction business 18,239 18,945
Parking structure business 5,824 8,097
General construction business 1,426 14,811
Consolidated 25,487 41,854
Segment
Profits
Systemized construction business 3,228 2,820
Parking structure business 397 287
General construction business -161 677
Adjustments -1,617 1,460
1,847 2,324
Profit Margin
Systemized construction business 17.7 14.9
Parking structure business 6.8 8.4
General construction business -11.3 1.9
Adjustments - -
Consolidated 7.2 5.6
Nissei Build Kogyo Co., Ltd. (Code 1916: First Section of the Tokyo Stock Exchange) Issue Date: February 3, 2015
18/26
This report is created by J-Phoenix Research Inc. (hereinafter JPR) simply for the purpose of providing information to the investors, not for soliciting any trading of securities. Although the report is
based on information and resources that JPR believed to be reliable, JPR does not guarantee against the accuracy, reliability, completeness, conformity or timeliness of any of the content. JPR shall not
be liable for any direct or indirect damage caused by the investors resulting from the use or reliance on the information contained herein. Investors are responsible for their own trading of securities and
other financial products. The intellectual property rights of this report belong to Toward the Infinite World, Inc. No part of this report may be reproduced, transcribed or cited without the written consent
of the company.
ROE exceeds 10%
Payout ratio is 30%
Stable and efficient balance sheet
Net D/E ratio of 0.13 times
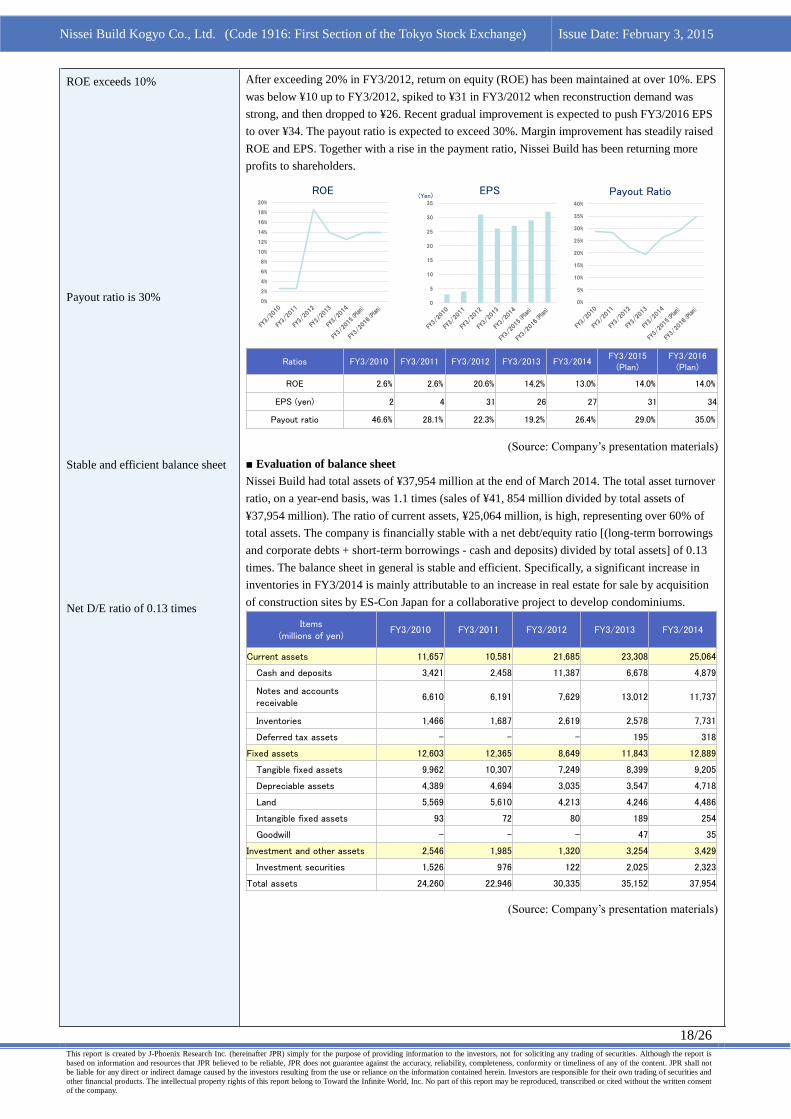
After exceeding 20% in FY3/2012, return on equity (ROE) has been maintained at over 10%. EPS
was below ¥10 up to FY3/2012, spiked to ¥31 in FY3/2012 when reconstruction demand was
strong, and then dropped to ¥26. Recent gradual improvement is expected to push FY3/2016 EPS
to over ¥34. The payout ratio is expected to exceed 30%. Margin improvement has steadily raised
ROE and EPS. Together with a rise in the payment ratio, Nissei Build has been returning more
profits to shareholders.
(Source: Company’s presentation materials)
■ Evaluation of balance sheet
Nissei Build had total assets of ¥37,954 million at the end of March 2014. The total asset turnover
ratio, on a year-end basis, was 1.1 times (sales of ¥41, 854 million divided by total assets of
¥37,954 million). The ratio of current assets, ¥25,064 million, is high, representing over 60% of
total assets. The company is financially stable with a net debt/equity ratio [(long-term borrowings
and corporate debts + short-term borrowings - cash and deposits) divided by total assets] of 0.13
times. The balance sheet in general is stable and efficient. Specifically, a significant increase in
inventories in FY3/2014 is mainly attributable to an increase in real estate for sale by acquisition
of construction sites by ES-Con Japan for a collaborative project to develop condominiums.
(Source: Company’s presentation materials)
0%
5%
10%
15%
20%
25%
30%
35%
40%
Ratios FY3/2010 FY3/2011 FY3/2012 FY3/2013 FY3/2014FY3/2015
(Plan)FY3/2016
(Plan)
ROE 2.6% 2.6% 20.6% 14.2% 13.0% 14.0% 14.0%
EPS (yen) 2 4 31 26 27 31 34
Payout ratio 46.6% 28.1% 22.3% 19.2% 26.4% 29.0% 35.0%
0%
2%
4%
6%
8%
10%
12%
14%
16%
18%
20%
ROE
0
5
10
15
20
25
30
35
EPS Payout Ratio(Yen)
Items(millions of yen)
FY3/2010 FY3/2011 FY3/2012 FY3/2013 FY3/2014
Current assets 11,657 10,581 21,685 23,308 25,064
Cash and deposits 3,421 2,458 11,387 6,678 4,879
Notes and accounts receivable
6,610 6,191 7,629 13,012 11,737
Inventories 1,466 1,687 2,619 2,578 7,731
Deferred tax assets - - - 195 318
Fixed assets 12,603 12,365 8,649 11,843 12,889
Tangible fixed assets 9,962 10,307 7,249 8,399 9,205
Depreciable assets 4,389 4,694 3,035 3,547 4,718
Land 5,569 5,610 4,213 4,246 4,486
Intangible fixed assets 93 72 80 189 254
Goodwill - - - 47 35
Investment and other assets 2,546 1,985 1,320 3,254 3,429
Investment securities 1,526 976 122 2,025 2,323
Total assets 24,260 22,946 30,335 35,152 37,954

Nissei Build Kogyo Co., Ltd. (Code 1916: First Section of the Tokyo Stock Exchange) Issue Date: February 3, 2015
19/26
This report is created by J-Phoenix Research Inc. (hereinafter JPR) simply for the purpose of providing information to the investors, not for soliciting any trading of securities. Although the report is
based on information and resources that JPR believed to be reliable, JPR does not guarantee against the accuracy, reliability, completeness, conformity or timeliness of any of the content. JPR shall not
be liable for any direct or indirect damage caused by the investors resulting from the use or reliance on the information contained herein. Investors are responsible for their own trading of securities and
other financial products. The intellectual property rights of this report belong to Toward the Infinite World, Inc. No part of this report may be reproduced, transcribed or cited without the written consent
of the company.
An increase in inventories is the
greatest cash-out item
(Source: Company’s presentation materials)
(Source: Prepared by JPR, based on Company’s disclosed materials. Figures based on term-end
differ from the aforementioned ones)
■ Cash flow
An increase in inventories is the greatest cash-out item in FY3/2014.
(Source: Company’s presentation materials)
Items(millions of yen)
FY3/2010 FY3/2011 FY3/2012 FY3/2013 FY3/2014
Current liabilities 11,621 10,115 14,800 18,628 19,815
Notes and accounts payable 3,984 3,992 7,742 11,410 10,354
Short-term borrowings, bonds, etc.
4,999 3,717 1,666 2,359 4,394
Deferred tax liabilities - - - - -
Non-current liabilities 3,161 3,341 3,715 3,648 3,988
Long-term borrowings, bonds, etc.
2,251 2,247 2,705 2,091 2,298
Deferred tax liabilities - 7 2 144 77
Total liabilities 14,782 13,456 18,515 22,276 23,803
Net assets 9,478 9,490 11,819 12,875 14,151
Common stock 7,002 7,002 7,002 7,002 7,002
Capital surplus 1,913 1,913 1,913 1,913 1,913
Retained earnings 715 894 3,020 4,279 5,701
Treasury stock -123 -123 -126 -624 -625
Total shareholders’ equity 9,507 9,686 11,810 12,570 13,992
Net unrealized valuation gain, etc.
-29 -196 - 289 120
Subscription rights to shares - - 8 16 37
Minority interests - - - - -
Total liabilities and net assets 24,260 22,946 30,335 35,152 37,954
Own capital 9,478 9,490 11,810 12,859 14,113
Interest-bearing debt 7,250 5,964 4,371 4,450 6,692
Items FY3/2010 FY3/2011 FY3/2012 FY3/2013 FY3/2014
ROE(on the basis of the year-end data, not compatible with the previous pages)
2.5% 2.6% 18.6% 13.9% 12.5%
ROA(on the basis of the year-end data, not compatible with the previous pages)
1.6% 2.4% 20.9% 5.3% 6.1%
Net D/E Ratio (Times) 0.40 0.36 -0.59 -0.18 0.13
Total Assets Turnover (Times) 0.76 0.75 1.38 0.73 1.10
Items(millions of yen)
FY3/2010 FY3/2011 FY3/2012 FY3/2013 FY3/2014
Operating cash flow 1,364 1,061 10,368 -50 -1,633
Pre-tax income 294 306 3,211 1,885 1,764
Depreciation 720 700 553 347 504
Amortization of goodwill - - - 76 18
Increase in accounts payable 1,248 419 -1,437 767 1,278
Decrease in inventories 1,500 -221 -932 155 -5,141
Decrease in accounts receivable -1,574 7 3,749 -1,084 -1,064
Subtotal 1,645 1,212 10,678 1,549 -1,658
Interest and dividends received 36 26 27 7 27
Interest expenses paid -163 -140 -96 -77 -75
Income taxes paid -153 -37 -50 -1,529 73
Investing cash flow -94 -646 235 -2,266 -2,248
Increase in tangible and intangible fixed assets
-71 -1,035 -296 -841 -1,397
Increase in investment securities -63 5 740 -1,258 -972
Financing cash flow -564 -1,367 -1,678 -2,364 1,744
Increase in borrowings and corporate bonds
-553 -1,283 -1,593 -1,346 2,117
Increase in treasury stock -1 0 -2 -498 -1
Dividends paid 0 -70 -68 -483 -329
Cash and cash equivalents 3,387 2,434 11,359 6,678 4,679
Nissei Build Kogyo Co., Ltd. (Code 1916: First Section of the Tokyo Stock Exchange) Issue Date: February 3, 2015
20/26
This report is created by J-Phoenix Research Inc. (hereinafter JPR) simply for the purpose of providing information to the investors, not for soliciting any trading of securities. Although the report is
based on information and resources that JPR believed to be reliable, JPR does not guarantee against the accuracy, reliability, completeness, conformity or timeliness of any of the content. JPR shall not
be liable for any direct or indirect damage caused by the investors resulting from the use or reliance on the information contained herein. Investors are responsible for their own trading of securities and
other financial products. The intellectual property rights of this report belong to Toward the Infinite World, Inc. No part of this report may be reproduced, transcribed or cited without the written consent
of the company.
Full-year forecasts: sales of
¥47,000 million (up 12% y-o-y)
and operating income of ¥3,250
million (up 40%)
Anticipating the company’s
specific longer-term growth
message
■ Higher income and a little less sales in the first half of FY3/2015, due to higher weight in
the second half
In the first half of FY3/2015, Nissei Build’s sales decreased by 0.9% y-o-y due to a seasonal
effect (more sales in the second half) but operating income increased by 16.2%. For the full year,
the company forecasts ¥47,000 million (up 12% y-o-y) in sales and ¥3,250 million (up 40%) in
operating income. In its Medium-term Business Plan, the company targets for FY3/2016 are
sales of ¥50,000 million and operating income of ¥3,500 million, suggesting slower growth rates
of 6% and 8% respectively. Given the company’s achievement in executing growth strategies
and improving margins, these forecasts are conservative and hence it is important to look
forward to the company’s disclosure of its longer-term growth outlook.
(Source: Company’s presentation materials)
FY3/2014 1H FY3/2015 1H Increase
Amount % to sales Amount % to sales Amount Y-O-Y(%)
Net sales 19,256 100.0 19,086 100.0 △170 △0.9
Gross income 2,892 15.0 3,060 16.0 168 5.8
SG&A expenses 1,971 10.2 1,991 10.4 19 1.0
Operating income 920 4.8 1,069 5.6 148 16.2
Ordinary income 943 4.9 1,106 5.8 163 17.3
Net income 509 2.6 709 3.7 199 39.3
(Millions of yen)
(Millions of yen)
FY3/2014 1H FY3/2015 1H Increase
Amount % to sales Amount % to sales Amount Y-O-Y(%)
Sales 5,496 28.5 7,164 37.5 1,668 30.4
Rental 2,827 14.7 3,310 17.4 483 17.1
Systemized construction business
8,323 43.2 10,474 54.9 2,151 25.8
Sales 2,859 14.9 1,958 10.3 △901 △31.5
Maintenance 865 4.5 779 4.1 △86 △9.9
Parking operation & management
278 1.4 602 3.1 324 116.7
Parking structure business 4,003 20.8 3,341 17.5 △662 △16.5
Comprehensive construction business
6,929 36.0 5,260 27.5 △1,668 △24.1
Development business - - 9 0.1 9 -
Total 19,256 100.0 19,086 100.0 △170 △0.9
Indicator(millions of yen)
FY3/2014 (Actual)
FY3/2015 (Plan)
FY3/2016 (Plan)
Net sales 41,854 47,000 50,000
Operating income 2,324 3,250 3,500
Ordinary income 2,490 3,250 3,500
Net income 1,753 2,050 2,250
Earnings per share (yen) 26.5 31.0 34.0
Operating margin 6% 7% 7%
ROE 13% 14% 14%
Payout ratio 26% 29% 35%
FY3/2015 First-Half Results and Full-Term Forecasts
First half of FY3/2015
のレビュー

Nissei Build Kogyo Co., Ltd. (Code 1916: First Section of the Tokyo Stock Exchange) Issue Date: February 3, 2015
21/26
This report is created by J-Phoenix Research Inc. (hereinafter JPR) simply for the purpose of providing information to the investors, not for soliciting any trading of securities. Although the report is
based on information and resources that JPR believed to be reliable, JPR does not guarantee against the accuracy, reliability, completeness, conformity or timeliness of any of the content. JPR shall not
be liable for any direct or indirect damage caused by the investors resulting from the use or reliance on the information contained herein. Investors are responsible for their own trading of securities and
other financial products. The intellectual property rights of this report belong to Toward the Infinite World, Inc. No part of this report may be reproduced, transcribed or cited without the written consent
of the company.
15.5% dilution due to stock
acquisition rights
Close to ¥4 billion in capital
procurement when fully exercised
Successful capital procurement
will strengthen net assets,
currently ¥14 billion, and
accelerate investment
Focus on creation of a virtuous
cycle of “margin improvement”
“higher stock price”
“financing by exercise of stock
acquisition rights” “more
profit growth led by more
investment”
■ Issuance of 10 million stock acquisition rights at exercise prices of ¥300, ¥350, and ¥500
On November 26, 2014, Nissei Build issued 10 million stock acquisition rights, allotted to
Deutsche Bank AG, London Branch. Given use of treasury stock when exercised, the dilution rate
should be 15.5%. The exercise prices are set at ¥300, ¥350, and ¥500, with respective issuance of
3 million, 3 million, and 4 million shares. The exercise prices are above the current stock price.
Unless the stock price rises to those levels, dilution will not occur, proving that consideration has
been given to existing shareholders in the choice of financing method.
This financing arrangement will result in procurement of ¥900 million, ¥1,050 million, and ¥2,000
million (¥3,950 million in total) with a three-year exercise period. The company’s approval is
required for Deutsche Bank to request exercise. It is expected that Nissei Build will give full
consideration to the impact on its stock price and the market’s sales trend after third-party
allotment. There is an option for Nissei Build to revise the exercise price from May 26, 2015. The
proceeds will be used as capital for lease building assets, land and stores of convenience stores,
the coin-operated parking business, and M&A in the facility management business. Nissei Build’s
advantage when attempting to make acquisition in the facility management business is to be able
to strategically offer an acquisition price by considering benefits from synergies with its other
businesses.
(Source: Company’s disclosed materials)
As mentioned above, Nissei Build has the ability to propose solutions and the technological
capabilities to make optimum use of space, and do so on behalf of clients anywhere in the nation.
The company has been aggressive in (1) executing M&A strategy, (2) executing alliance strategy,
(3) achieving growth in high-margin stock-based business, and (4) expanding overseas. Those
measures, since 2012, are likely to show results in terms of upcoming operating performance.
Under the strong leadership of Atsuhiro Morioka, Nissei Build is advancing to a new growth stage
in terms of the growth process and profitability, which is thought to not be reflected in the current
stock price level. It is important to focus on whether the recent issuance of stock acquisition rights
will create a virtuous cycle of “margin improvement in the growth stage” “higher stock price”
“financing by exercise of stock acquisition rights” “more profit growth led by more
investment.”
Stock acquisition rightsTotal number of stock acquisiton rights 3,000,000 rights 3,000,000 rights 4,000,000 rightsAggregate amount to be paid in 1,140,000 yen 840,000 yen 1,000,000 yenPer share amount to be paid in 0.38 yen 0.28 yen 0.25 yenPer share exercise price 300 yen 350 yen 500 yenItem concerning revision to exercise priceExercise periodConditions for the exercise of stock acquisition rights Yes Yes Yes
First series Second series Third series
Yes Yes YesThree years Three years Three years
Margin Improvement
Higher Stock PriceMore profit growth led
by more investment
Financing by
exercising stock
acquisition rights
Equity Financing
Issuance of stock
acquisition rights by
third party allotment

Nissei Build Kogyo Co., Ltd. (Code 1916: First Section of the Tokyo Stock Exchange) Issue Date: February 3, 2015
22/26
This report is created by J-Phoenix Research Inc. (hereinafter JPR) simply for the purpose of providing information to the investors, not for soliciting any trading of securities. Although the report is
based on information and resources that JPR believed to be reliable, JPR does not guarantee against the accuracy, reliability, completeness, conformity or timeliness of any of the content. JPR shall not
be liable for any direct or indirect damage caused by the investors resulting from the use or reliance on the information contained herein. Investors are responsible for their own trading of securities and
other financial products. The intellectual property rights of this report belong to Toward the Infinite World, Inc. No part of this report may be reproduced, transcribed or cited without the written consent
of the company.
Average performance and
valuation at present
Not undervalued based on the
current profit levels
■ Comparison with other listed construction-related manufacturers
The table below compares Nissei Build with other listed companies in construction-related
products.
(Note: Stock prices and market cap are based on closing prices of January 30, 2015)
Nissei Build ranks in the middle to lower tier in terms of operating margin and ROA but in the
top 25% in ROE. It also ranks in the middle tier to the lower tier in terms of PER. Its PBR is in
the upper tier, while its EBITDA ratio is in the upper to middle tier. Looking at the current
profitability, Nissei Build is not undervalued compared to its peers. Valuation of the stock should
incorporate consideration given to Nissei Build’s growth expectations driven by its aggressive
M&A and alliance strategies since 2012.
(Source: Prepared by JPR, based on FactSet, etc.)
Operating marginOperating margin Year-end ROE Year-end ROA PER PER PBR EBITDA ratio
(Actual) (Estimate) (Estimate) (Estimate) (Actual) (Estimate) (Actual) (Actual)
1916 Nissei Build 5.6 6.9 12.4 1.10 8.8 10.2 1.26 7.8
2445 SRG Takamiya 9.4 10.7 18.6 0.87 22.6 27.5 4.87 10.1
4212 Sekisui Jushi 13.8 13.6 8.3 0.69 10.9 10.4 0.89 5.3
5011 Nichireki 11.1 9.9 11.0 1.12 8.1 7.3 0.84 1.8
5202 Nippon Sheet Glass 0.1 3.4 -10.7 0.66 87.9 -4.5 0.46 12.1
5262 Nippon Hume 6.0 4.9 7.5 0.84 7.6 10.2 0.77 6.9
5269 Nippon Concrete Industries 5.2 5.4 3.5 0.62 19.7 26.9 0.97 11.5
5273 Mitani Sekisan 9.3 8.9 9.8 1.09 12.1 11.4 1.11 4.9
5288 Japan Pile 6.0 5.7 12.0 1.17 10.3 8.9 1.08 4.0
5929 Sanwa Holdings 6.6 7.1 8.9 1.11 16.2 17.3 1.61 8.3
5930 Bunka Shutter 7.5 7.5 15.8 1.15 8.0 7.5 1.21 4.4
5933 Alinco 7.7 7.9 13.3 1.17 9.8 9.2 1.20 5.6
5959 Okabe 10.2 10.4 9.2 0.80 11.3 11.7 1.10 6.2
6581 Hitachi Koki 3.3 4.6 1.5 0.89 22.3 46.2 0.73 11.1
6586 Makita 14.3 15.5 8.8 0.74 16.8 16.3 1.44 10.4
7438 Kondotec 6.8 6.8 10.6 1.39 10.7 10.6 1.13 5.0
7463 Advan 24.5 24.4 9.5 0.45 11.0 12.1 1.03 8.0
7821 Maeda Kosen 13.4 13.6 11.0 0.87 12.9 13.7 1.75 8.1
7943 Nichiha 8.2 7.3 10.4 0.99 10.7 9.2 0.88 4.2
7949 Komatsu Wall Industry 13.2 14.2 8.4 0.88 7.7 10.1 0.87 4.7
7971 Toli 2.8 3.1 5.2 1.30 8.3 11.0 0.57 4.4
8007 Takashima 1.9 2.0 10.7 2.16 8.2 8.8 0.93 6.0
8087 Furusato Industries 3.8 3.5 4.5 1.55 12.0 14.5 0.68 4.1
9639 Sankyo Frontier 12.4 12.7 9.6 0.56 9.8 10.1 0.93 4.1
9663 Nagawa 13.8 14.7 6.2 0.65 20.3 23.5 1.38 5.9
9761 Tokai Lease 3.2 4.8 1.8 0.43 19.0 27.1 0.50 7.0
9763 Marubeni Construction Material Lease 3.3 3.5 8.8 0.61 12.8 11.2 0.99 25.9
9991 Gecoss 5.9 7.6 9.4 0.91 10.9 16.0 1.49 11.0
Average 8.2 8.6 8.4 0.96 15.2 14.1 1.17 7.5
Highest 24.5 24.4 18.6 2.16 87.9 46.2 4.87 25.9
Top 25% average 11.4 11.2 10.8 1.13 16.3 16.1 1.22 8.7
Middle 50% average 7.2 7.4 9.3 0.89 11.0 11.1 1.01 6.1
Bottom 25% average 4.8 4.9 7.2 0.68 9.5 9.8 0.86 4.6
Lowest 0.1 2.0 -10.7 0.43 7.6 -4.5 0.46 1.8
Corporate nameCode
75 Days Moving Average 25 Days Moving Average 5 Days Moving Average
240
250
260
270
280
290
300
310
3202
015
/1/3
0
20
15/1
/27
20
15/1
/22
20
15/1
/19
20
15/1
/14
20
15/1
/8
20
15/1
/5
20
14/1
2/2
6
20
14/1
2/2
2
20
14/1
2/1
7
20
14/1
2/1
2
20
14/1
2/9
20
14/1
2/4
20
14/1
2/1
20
14/1
1/2
6
20
14/1
1/2
0
20
14/1
1/1
7
20
14/1
1/1
2
20
14/1
1/7
20
14/1
1/4
20
14/1
0/2
9
20
14/1
0/2
4
20
14/1
0/2
1
20
14/1
0/1
6
20
14/1
0/1
0
20
14/1
0/7
20
14/1
0/2
20
14/9
/29
20
14/9
/24
20
14/9
/18
20
14/9
/12
20
14/9
/9
20
14/9
/4
20
14/9
/1Comparison with Peers and Stock Price Chart
Comparison with
peers in
construction-related
products
Stock price chart (yen)

Nissei Build Kogyo Co., Ltd. (Code 1916: First Section of the Tokyo Stock Exchange) Issue Date: February 3, 2015
23/26
This report is created by J-Phoenix Research Inc. (hereinafter JPR) simply for the purpose of providing information to the investors, not for soliciting any trading of securities. Although the report is
based on information and resources that JPR believed to be reliable, JPR does not guarantee against the accuracy, reliability, completeness, conformity or timeliness of any of the content. JPR shall not
be liable for any direct or indirect damage caused by the investors resulting from the use or reliance on the information contained herein. Investors are responsible for their own trading of securities and
other financial products. The intellectual property rights of this report belong to Toward the Infinite World, Inc. No part of this report may be reproduced, transcribed or cited without the written consent
of the company.
The current stock price (¥281 on
January 30, 2015) does not yet
fully discount the Medium-term
Business Plan and the stock
business expansion
■ Sensitivity analysis
Nissei Build has announced a Medium-term Business Plan, for up to FY3/2016. The stock
business has the target of ¥10 billion by FY3/2017. A DCF model for sensitivity analysis was
used to analyze the impact of future growth on the stock price. Sales growth rates were set from
-2.5% to 7.5% for flow business (FY3/2016 to FY3/2020) and for stock business (FY3/2017 to
FY3/2020). The growth rate after FY3/2020 is 0%. Two scenarios in stock acquisition rights, (1)
no exercise and (2) full exercise, were run. Assumptions for profit and asset structures were for
no significant change (see details below). The weighted-average cost of capital (WACC) used the
following key assumptions: (1) beta of 1.125, based on the past 3-year stock price fluctuation; (2)
after-tax interest expenses divided by average interest bearing debt of FY3/2014; (3) 10-year
Japanese Government bond yield as of December 30, 2014; (4) interest bearing debt at the end of
September 2014; (5) market cap at the closing stock price of December 30, 2014. The WACCs by
different risk premiums are calculated below. In sensitivity analysis, the WACC range from 4% to
9% is used.
Risk premium 5% 6% 7% 8% 9% 10%
WACC (Est.) 4.7% 5.3% 6.2% 7.0% 7.8% 8.7%
(Source: Prepared by JPR)
■ Growth potential is not discounted at the closing stock price of ¥281 of January 30, 2015
Results of sensitivity analysis are as follows:
(Source: Prepared by JPR)
In case of the WACC of 9%, fully-exercised stock acquisition rights, and a growth rate of -2.5,
the fair stock price is calculated to be ¥358. In the scenario of fully-exercised stock acquisition
rights and assuming 7% WACC, the calculated stock price is ¥505 at a growth rate of 2.5% and
¥551 at a growth rate at 7.5%. If Nissei Build’s growth rate accelerates from FY3/2016, thanks to
its aggressive measures taken since 2012, the stock price of ¥500 or higher can be fully justified
even with due consideration to dilution by exercise of the stock acquisition rights. It is believed
that the stock price of ¥281 at closing on January 30, 2015, does not incorporate growth potential
likely to emerge from FY3/2017 on the back of expansion of the stock business and the
medium-term business forecasts.
WACC
584 -2.50% 0.00% 2.50% 5.00% 7.50%
4% 956 1,010 1,064 1,125 1,185
5% 761 800 839 884 928
6% 631 661 690 724 757
7% 538 561 584 610 636
8% 468 486 504 525 546
9% 414 428 443 460 476
4% 828 874 921 973 1,026
5% 659 693 726 765 803
6% 546 572 597 627 655
7% 465 486 505 528 551
8% 405 421 437 455 472
9% 358 371 383 398 412
Average growth rate (FY3/2017 - FY3/2020)Stock
acquisition
rights
(1) No
exercise
(2) Full
exercise
Sensitivity analysis based on DCF
Sensitivity analysis
based on DCF

Nissei Build Kogyo Co., Ltd. (Code 1916: First Section of the Tokyo Stock Exchange) Issue Date: February 3, 2015
24/26
This report is created by J-Phoenix Research Inc. (hereinafter JPR) simply for the purpose of providing information to the investors, not for soliciting any trading of securities. Although the report is
based on information and resources that JPR believed to be reliable, JPR does not guarantee against the accuracy, reliability, completeness, conformity or timeliness of any of the content. JPR shall not
be liable for any direct or indirect damage caused by the investors resulting from the use or reliance on the information contained herein. Investors are responsible for their own trading of securities and
other financial products. The intellectual property rights of this report belong to Toward the Infinite World, Inc. No part of this report may be reproduced, transcribed or cited without the written consent
of the company.
(Units: ¥100 million, times, and days, unless specified)
(Source: Prepared by JPR. Based on the company’s forecasts for FY3/2015, JPR estimated gross margin of the flow-type and
stock-type businesses and assumed ¥10 billion in sales for the stock-type business in FY3/2017.)
FY3/2015 FY3/2016 FY3/2017 FY3/2018 FY3/2019 FY3/2020 FY3/2021
(Plan) (Plan) (Est.) (Est.) (Est.) (Est.) (Est.)
Sales 47,000 50,000 54,500 55,870 57,270 58,710 58,710
Systemized Construction Business 22,400 23,000 23,600 24,200 24,810 25,440 25,440
Prefab construction sales business (flow-type) 15,000 15,400 15,800 16,200 16,610 17,030 17,030
Prefab construction lease business (flow-type) 7,400 7,600 7,800 8,000 8,200 8,410 8,410
Parking Structure Business 9,500 11,000 13,650 13,990 14,340 14,690 14,690
Parking structure sales business (flow-type) 5,500 6,000 6,550 6,710 6,880 7,050 7,050
Parking structure maintenance business (stock-type) 2,100 3,000 4,300 4,410 4,520 4,630 4,630
Parking operation & management business (stock-type) 1,900 2,000 2,800 2,870 2,940 3,010 3,010
General Construction Business (flow-type) 13,700 14,000 14,350 14,710 15,080 15,460 15,460
Property Development Business (stock-type) 1,400 2,000 2,900 2,970 3,040 3,120 3,120
Flow-type sales 41,600 43,000 44,500 45,620 46,770 47,950 47,950
Stock-type sales 5,400 7,000 10,000 10,250 10,500 10,760 10,760
Growth rate
Sales growth rate 12.3% 6.4% 9.0% 2.5% 2.5% 2.5% 0.0%
Systemized Construction Business 18.2% 2.7% 2.6% 2.5% 2.5% 2.5% 0.0%
Prefab sales business (flow-type) 18.9% 2.7% 2.6% 2.5% 2.5% 2.5% 0.0%
Prefab lease business (flow-type) 17.0% 2.7% 2.6% 2.5% 2.5% 2.5% 0.0%
Growth rate in Systemized Constuction (ex. reconstruction-related) 21.5% 2.7% 2.6% 2.5% 2.5% 2.5% 0.0%
Parking Structure Business 17.3% 15.8% 24.1% 2.5% 2.5% 2.5% 0.0%
Parking structure sales business (flow-type) 6.9% 9.1% 9.2% 2.5% 2.5% 2.5% 0.0%
Parking structure maintenance business (stock-type) 7.6% 42.9% 43.3% 2.5% 2.5% 2.5% 0.0%
Parking operation & management business (stock-type) 90.0% 5.3% 40.0% 2.5% 2.5% 2.5% 0.0%
General Construction Business (flow-type) -7.5% 2.2% 2.5% 2.5% 2.5% 2.5% 0.0%
Property Development Business (stock-type) - 42.9% 45.0% 2.5% 2.5% 2.5% 0.0%
Gross income 7,650 8,300 9,410 9,650 9,880 10,130 10,130
SG&A expenses 4,400 4800 5230 5360 5500 5640 5640
(SG&A expenses to Sales) 9.4% 9.6% 9.6% 9.6% 9.6% 9.6% 9.6%
Goodwill 18 17 0 0 0 0 0
Operating income 3,250 3,500 4,180 4,290 4,380 4,490 4,490
Interest income and dividend income 71 45 39 34 32 32 32
Interest expense, etc. 71 45 39 34 32 32 32
(Interest rate on average interest bearing debts) 1.4% 1.4% 1.4% 1.4% 1.4% 1.4% 1.4%
Ordinary income 3,250 3,500 4,180 4,290 4,380 4,490 4,490
Pretax income 3,250 3,500 4,180 4,290 4,380 4,490 4,490
Income taxes, etc. 1,200 1,250 1,493 1,532 1,564 1,604 1,604
(Income taxes, etc.) / (Pretax income) 36.9% 35.7% 35.7% 35.7% 35.7% 35.7% 35.7%
Net profit 2,050 2,250 2,687 2,758 2,816 2,886 2,886
Gross income to sales 16.3% 16.6% 17.3% 17.3% 17.3% 17.3% 17.3%
Operating income to sales 6.9% 7.0% 7.7% 7.7% 7.6% 7.6% 7.6%
Year-end base
ROE 13.2% 13.1% 14.0% 13.2% 12.3% 12.6% 12.6%
ROA 8.5% 8.6% 9.6% 9.4% 9.1% 9.2% 9.2%
Net D/E ratio -0.12 -0.17 -0.19 -0.25 -0.29 -0.28 -0.28
Total assets turnover 1.23 1.24 1.25 1.22 1.19 1.21 1.21
Dividends paid 463 595 788 941 965 2,816 2,886
Internal reserve 1,587 1,656 1,900 1,817 1,850 71 0
Earnings per share (yen) 28.8 31.6 37.8 38.8 39.6 40.6 40.6
Book value per share (yen) 221 245 271 297 323 324 324
Full-year dividend per share (yen) 9 11 13 14 40 41 41
Dividends on common stock 595 788 941 965 2,816 2,886 2,886
Shares outstanding (share) 71,113,168 71,113,168 71,113,168 71,113,168 71,113,168 71,113,168 71,113,168
Treasury stock (share) -6,725,410 -6,725,410 -6,725,410 -6,725,410 -6,725,410 -6,725,410 -6,725,410
Dilutive shares (exercise price at 300 yen) 3,000,000 3,000,000 3,000,000 3,000,000 3,000,000 3,000,000 3,000,000
Dilutive shares (exercise price at 350 yen) 3,000,000 3,000,000 3,000,000 3,000,000 3,000,000 3,000,000 3,000,000
Dilutive shares (exercise price at 500 yen) 4,000,000 4,000,000 4,000,000 4,000,000 4,000,000 4,000,000 4,000,000
DCF Model Assumptions: A case of 7% in WACC and 2.5% in Growth Rate

Nissei Build Kogyo Co., Ltd. (Code 1916: First Section of the Tokyo Stock Exchange) Issue Date: February 3, 2015
25/26
This report is created by J-Phoenix Research Inc. (hereinafter JPR) simply for the purpose of providing information to the investors, not for soliciting any trading of securities. Although the report is
based on information and resources that JPR believed to be reliable, JPR does not guarantee against the accuracy, reliability, completeness, conformity or timeliness of any of the content. JPR shall not
be liable for any direct or indirect damage caused by the investors resulting from the use or reliance on the information contained herein. Investors are responsible for their own trading of securities and
other financial products. The intellectual property rights of this report belong to Toward the Infinite World, Inc. No part of this report may be reproduced, transcribed or cited without the written consent
of the company.
(Source: Prepared by JPR)
FY3/2015 FY3/2016 FY3/2017 FY3/2018 FY3/2019 FY3/2020 FY3/2021
(Plan) (Plan) (Est.) (Est.) (Est.) (Est.) (Est.)
Cash and deposits 5,479 5,829 6,353 6,513 6,676 6,844 6,844
Notes and accounts receivable 13,180 14,021 15,283 15,667 16,060 16,464 16,464
Inventories 4,947 5,263 5,736 5,881 6,028 6,180 6,180
Other current assets 717 717 717 717 717 717 717
Depreciable assets 5,298 5,636 6,144 6,298 6,456 6,618 6,618
Land 5,038 5,359 5,841 5,988 6,138 6,293 6,293
Intangible fixed assets ex. goodwill 219 219 219 219 219 219 219
Goodwill 17 0 0 0 0 0 0
Investments and others 3,429 3,429 3,429 3,429 3,429 3,429 3,429
Other assets 0 0 0 0 0 0 0
Total assets 38,324 40,473 43,737 45,684 48,050 48,651 48,651
Notes and accounts payable 11,627 12,369 13,482 13,821 14,168 14,524 14,524
Other current liabilities 5,690 6,053 6,598 6,764 6,933 7,108 7,108
Short-term loans and current portion of corporate bonds 1,280 669 376 0 0 0 0
Long-term loans and corporate bonds 2,298 2,298 2,298 2,298 2,298 2,298 2,298
Other long-term liabilities 1,690 1,690 1,690 1,690 1,690 1,690 1,690
Net assets 15,738 17,394 19,293 21,111 22,961 23,032 23,032
Common stock 7,002 7,002 7,002 7,002 7,002 7,002 7,002
Capital surplus 1,913 1,913 1,913 1,913 1,913 1,913 1,913
Retained earnings 7,288 8,944 10,843 12,661 14,511 14,582 14,582
Treasury stock -625 -625 -625 -625 -625 -625 -625
Shareholders' equity 15,578 17,234 19,133 20,951 22,801 22,872 22,872
Valuation and translation adjustments 120 120 120 120 120 120 120
Stock acquisition rights 40 40 40 40 40 40 40
Minority interests - - 0 0 0 0 0
Total liabilities and net assets 38,324 40,473 43,737 45,684 48,050 48,651 48,651
49 49 49 49 49 49 49
(Cash & deposits) / Sales X 365 42.5 42.5 42.5 42.5 42.5 42.5 42.5
(Notes and accounts receivable) / Sales × 365 102.4 102.4 102.4 102.4 102.4 102.4 102.4
Inventories / Sales × 365 38.4 38.4 38.4 38.4 38.4 38.4 38.4
(Other current assets) / Sales × 365 5.6 5.2 4.8 4.7 4.6 4.5 4.5
Sales / (Depreciable assets) (1) 8.9 8.9 8.9 8.9 8.9 8.9 8.9
Sales / Land (2) 9.3 9.3 9.3 9.3 9.3 9.3 9.3
(1) + (2) 18.2 18.2 18.2 18.2 18.2 18.2 18.2
(Notes and accounts payable) / Sales × 365 90.3 90.3 90.3 90.3 90.3 90.3 90.3
(Other current liabilities) / Sales X 365 44.2 44.2 44.2 44.2 44.2 44.2 44.2
Depreciation and amortization 566 600 627 655 701 712 715
(Depreciation and amortization) / (Average depreciable tangible fixed assets)11.3% 11.0% 10.7% 10.5% 11.0% 10.9% 10.8%
Estimated capital expenditures for depreciable assets 1,146 938 1,135 810 859 874 715
Investments in land 552 322 482 147 150 154 0
Dividends paid -463 -595 -788 -941 -965 -2,816 -2,886
(Dividends paid) / (Previous year's net income) 26% 29% 35% 35% 35% 100% 100% Perpetuity
NOPAT 2,095 2,279 2,712 2,780 2,836 2,907 2,907
Depreciation and amortization 566 600 627 655 701 712 715
Capital expenditures -1,697 -1,259 -1,617 -956 -1,009 -1,028 -715
Increase in working capital 3,237 -52 -78 -24 -24 -25 0
FCF 4,200 1,568 1,645 2,455 2,504 2,565 2,907 2,907
Discount factor 0.935 0.873 0.816 0.763 0.713 0.666 0.623 8.9
Net Present Value FCF 3,925 1,369 1,343 1,873 1,785 1,709 1,810 25,861
Net Present Value 39,676
Interest-bearing debts 6,965
Cash and deposits 4,879
Shareholder value 37,590
Estimated stock price (yen) 584
Fully-diluted stock price (yen) 505
Nissei Build Kogyo Co., Ltd. (Code 1916: First Section of the Tokyo Stock Exchange) Issue Date: February 3, 2015
26/26
This report is created by J-Phoenix Research Inc. (hereinafter JPR) simply for the purpose of providing information to the investors, not for soliciting any trading of securities. Although the report is
based on information and resources that JPR believed to be reliable, JPR does not guarantee against the accuracy, reliability, completeness, conformity or timeliness of any of the content. JPR shall not
be liable for any direct or indirect damage caused by the investors resulting from the use or reliance on the information contained herein. Investors are responsible for their own trading of securities and
other financial products. The intellectual property rights of this report belong to Toward the Infinite World, Inc. No part of this report may be reproduced, transcribed or cited without the written consent
of the company.
This report is issued by Toward the Infinite World, Inc. under the name of "ANALYST NET" and written by
external partners and analysts as its main authors.
□ In the report issued under the brand name of "ANALYST NET", we are aiming to provide information and
explanations about the target companies using a different approach from the traditional method. In principle,
TIW does not seek a review or authorization against the contents herein. (However, we point out to the authors
only if there are errors or incorrect wording.)
□ TIW may receive compensation directly or indirectly from the target companies in the project proposal and
infrastructure offering to issue this report.
□ External partners and analysts may receive compensation directly or indirectly from the target companies for
additional work apart from writing this report. The external partners and analysts may have already been
involved or may be involved in some trading of securities of target companies in the future.
□ This report is created for the purpose of providing information for investors to refer to when they are making
decisions about investments, and not for soliciting trading of securities or other financial products. Investors are
responsible for their final decisions on trading of securities or other financial products.
□ Although authors collected information during interviews with the target companies in order to create this report,
the hypothesis and opinions in this report do not reflect the views of such companies, and are from the authors'
own analysis and evaluation.
□ Although this report is based on information that the authors believed to be reliable, we do not guarantee the
accuracy, completeness and/or timeliness of the contents. The opinions and forecasts in this report are conducted
at the time of publication and may be changed without notice.
□ In any event, TIW and authors are not liable for any direct, indirect, incidental, or special damages that the
investors may receive by relying on the information and analysis contained in this report.
□ All contents of this report are the copyright of TIW unless otherwise stated. No part of such information shall be
reproduced, sold, displayed, distributed, published, amended, or used for commercial purposes without TIW's
consent.
□ "ANALYST NET" is a registered trademark of TIW.
Disclaimer