analysts meeting - dassault systèmes · jean-philippe sallini, plm manager, safan transmission...
TRANSCRIPT

Analysts Meeting
Q2 & H1 2016

4
Q2 2016 Highlights
Delivering Q2 results at the high-end of guidance
Seeing continued traction of 3DEXPERIENCE platform
ENOVIA delivering strong growth
Diversification Industries showing good momentum
Expanding in Production Planning & Scheduling with Ortems acquisition
Expanding in Electromagnetic Simulation with CST proposed acquisition
Reconfirming FY16 guidance with double-digit new licenses growth in H2

5
1 Q2 16 & H1 16 Business Review
2 Q2 16 & H1 16 Business Highlights
3
4 Q3 16 & FY 16 Financial Objectives
5
Financial Information Appendix
Agenda
Q2 16 & H1 16 Financial Highlights

6
€ millions Q2 16 YTD 16
Revenue 754.0 1,447.5
Growth +4% +4%
Growth exFX +6% +5%
Software Growth exFX +7% +6%
Operating Margin 30.4% 28.4%
Operating Margin Growth +1.0 pt +0.7 pt
EPS (€) 0.57 1.08
EPS Evolution +8% +13%
Q2 16 & H1 16 Non-IFRS
• Improved software revenue in Q2
• Solid EPS growth, up 12% exFX in Q2

7
Software Revenue by Brands Non-IFRS
CATIA: impacted by a weak quarter in Asia
ENOVIA: excellent growth across geographies
SOLIDWORKS: improved new licenses
revenue growth in Q2
Other Software: led by SIMULIA, DELMIA,
QUINTIQ and EXALEAD
Software Revenue Growth exFX by Brands
Q2 16 YTD 16
CATIA +1% +3%
ENOVIA +13% +12%
SOLIDWORKS +13% +10%
Other Software +10% +4%
Total Software +7% +6%

8
Revenue by Region Non-IFRS
Double-digit Q2 new licenses revenue growth
both in US and in Latin America
Double-digit Q2 new licenses revenue growth in
Europe led by Northern and Southern Europe
and France
Weak performance in Korea, India and AP
South
Q2 16 YTD 16
Americas +8% +7%
Europe +9% +6%
Asia +4% +4%
Software Revenue +7% +6%
Software Revenue Growth exFX by Region

9
1
Q2 16 & H1 16 Business Review
2 Q2 16 & H1 16 Business Highlights
3
4 Q3 16 & FY 16 Financial Objectives
5
Financial Information Appendix
Agenda
Q2 16 & H1 16 Financial Highlights

10
Q2 16 Business Highlights
3DEXPERIENCE Platform
ENOVIA
Industry Diversification
Ortems Acquisition
CST Acquisition

11
3DEXPERIENCE | H1 Performance
* Excluding SOLIDWORKS and acquisitions
20%
33%
H1 2015 H1 2016
+13 points in H1 16
% V6 / New Licenses Revenue* Non-IFRS
3DEXPERIENCE new licenses
revenue up +68% exFX

12
13
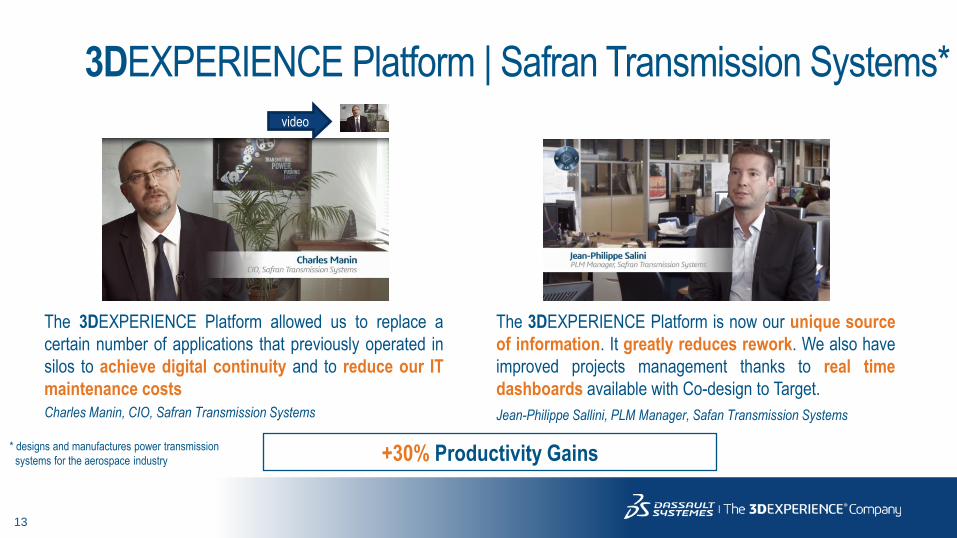
3DEXPERIENCE Platform | Safran Transmission Systems*
* designs and manufactures power transmission
systems for the aerospace industry
The 3DEXPERIENCE Platform allowed us to replace a
certain number of applications that previously operated in
silos to achieve digital continuity and to reduce our IT
maintenance costs
Charles Manin, CIO, Safran Transmission Systems
The 3DEXPERIENCE Platform is now our unique source
of information. It greatly reduces rework. We also have
improved projects management thanks to real time
dashboards available with Co-design to Target.
Jean-Philippe Sallini, PLM Manager, Safan Transmission Systems
+30% Productivity Gains
video

14
Q2 16 Business Highlights
3DEXPERIENCE Platform
ENOVIA
Industry Diversification
Ortems Acquisition
CST Acquisition
15
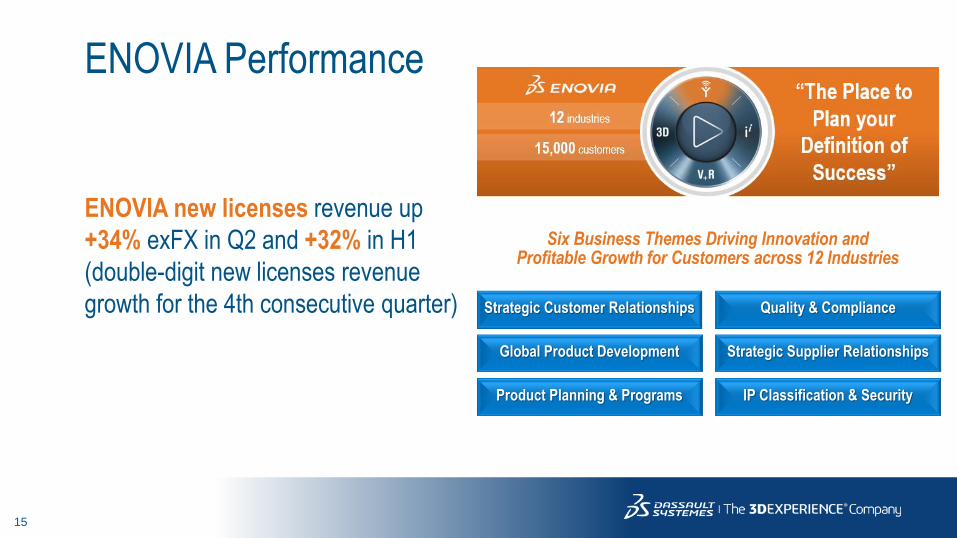
ENOVIA Performance
ENOVIA new licenses revenue up
+34% exFX in Q2 and +32% in H1
(double-digit new licenses revenue
growth for the 4th consecutive quarter)
Six Business Themes Driving Innovation and Profitable Growth for Customers across 12 Industries
Quality & Compliance
Strategic Supplier Relationships
IP Classification & Security Product Planning & Programs
Strategic Customer Relationships
Global Product Development

ENOVIA Portfolio
PR
OD
UC
T D
EV
EL
OP
ME
NT
DIVERSIFICATION
The ENOVIA
portfolio
provides
collaborative
innovation
apps for
Business
and Product
Development
users
The ENOVIA
portfolio is
expanding to
address
Business and
Product
Development
users in
Diversification
industries
BU
SIN
ES
S
Design Reviewer
Product Engineer
Project Manager
Project Analyst
Portfolio Manager
Software & System-
on-a-Chip Designer
Formula Developer
Packaging
Assets Manager
Financial Service
Manager
3D Merchandiser
Quality Manager
Collection Sourcing
Manager
CORE
Requirements Manager
Product Manager
Mechanical Designer

17

18
19
Q2 16 Business Highlights
3DEXPERIENCE Platform
ENOVIA
Industry Diversification
Ortems Acquisition
CST Acquisition

20
Industry Vertical Diversification
Diversification industries* representing
31% of H1 2016 software revenue
+1 percentage point YoY driven by Marine
& Offshore, High-Tech and Energy, Process
& Utilities
H1 16 – Software Revenue
* Architecture, Engineering & Construction; Consumer Goods & Retail; Consumer Packaged Goods & Retail; Energy, Process & Utilities; Finance Business
Services; High-Tech; Life Sciences; Marine & Offshore; Natural Resources

21
Energy, Process & Utilities
Energy, Process & Utilities software revenue up ~+15% exFX in Q2
Diversifying in Oil & Gas segment
Enabling continued innovation and increasing safety in nuclear plants with key
recent wins

22
Attending World Nuclear Exhibition | JUNE 28-30, 2016 - LE BOURGET - PARIS
Emmanuel Macron,
French economy minister
featuring Dassault
Systèmes
ASE Group of Companies (Rosatom)
winner of World Nuclear Exhibition
competition in Operational Excellence
Nomination* with 3DEXPERIENCE
Platform implementation
Assystem and Dassault
Systèmes partner to
digitally transform nuclear
engineering
* http://www.rosatom.ru/en/press-centre/news/ase-group-of-companies-is-a-winner-of-world-nuclear-exhibition-competition-in-the-operational-excell/
23
Reactor commissioned on-time
and on-budget
TRANSFORMATION MILESTONES
Digital simulation providing accountable, reliable and predictable performance of plant operations
Digital continuity enhancing collaboration between engineering and construction teams on site
Business Benefits
Technical Scope
Multidisciplinary digital mock-up including suppliers and multi-dimensions (3D, time, resources, costs, risks …)
Up to 60% productivity
increase on engineering
Covering with NIAEP-ASE Full Nuclear Lifecycle
Accelerating commissioning
Reducing time of unit outage
Engineering Construction
Commissioning

24

25
Q2 16 Business Highlights
3DEXPERIENCE Platform
ENOVIA
Industry Diversification
Ortems Acquisition
CST Acquisition

26
The 3DEXPERIENCE Platform for
Global Industrial Operations
Build & Simulate the Manufacturing Processes
Operate & Measure the Physical Manufacturing Operations
Optimize & Predict Hot rescheduling & predictive analytics
Real time 3DEXPERIENCE
Collaborative Platform, all stakeholders share common
understanding

27
Digital
Manufacturing
Manufacturing Operations Management
Supply Chain
Planning
& Operations
Master
Production
Scheduling
(Quintiq)
Sales &
Operations
Planning
(Quintiq)
Ortems for
Production
Scheduling
Ortems Extends DELMIA Applications in Supply Chain
Planning & Operations

28
Ortems Complementing DELMIA Applications
Ortems Profile:
Expert in production planning and scheduling
Privately-held company based in Lyon (France)
~50 employees
FY15 revenue: ~€5m (half software, half service)
Complementing DELMIA Manufacturing Execution System
and Manufacturing Operations Management with Ortems
constraint-based production scheduling capabilities

29
Q2 16 Business Highlights
3DEXPERIENCE Platform
ENOVIA
Industry Diversification
Ortems Acquisition
CST Acquisition

30
Electromagnetism is a fundamental physics
that harmonizes the communication between
Product, Nature and Life

31
Multiphysics Discipline Our Technology
Vision
Mul
tisca
le
Electromagnetics
Systems
Sensors
Chips
Circuits
Particles
32
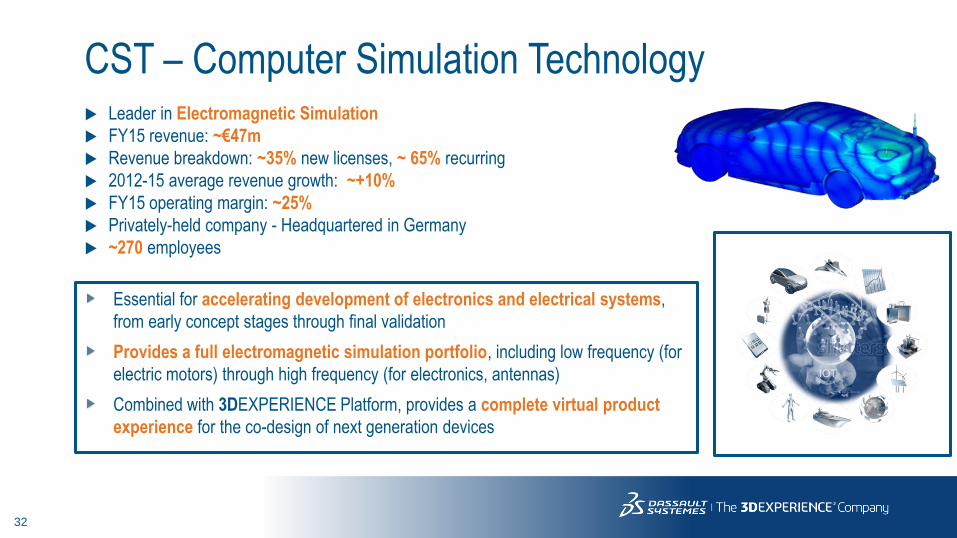
CST – Computer Simulation Technology Leader in Electromagnetic Simulation
FY15 revenue: ~€47m
Revenue breakdown: ~35% new licenses, ~ 65% recurring
2012-15 average revenue growth: ~+10%
FY15 operating margin: ~25%
Privately-held company - Headquartered in Germany
~270 employees
Essential for accelerating development of electronics and electrical systems,
from early concept stages through final validation
Provides a full electromagnetic simulation portfolio, including low frequency (for
electric motors) through high frequency (for electronics, antennas)
Combined with 3DEXPERIENCE Platform, provides a complete virtual product
experience for the co-design of next generation devices

33
CST Acquisition Closing
Closing expected in Q4 2016 and subject to customary conditions precedent,
including antitrust approvals in Germany and Austria
Price: approximately €220 million in cash
Impact on non-IFRS FY16 objectives to be included after the closing
Immediately accretive to non-IFRS earnings

34
1
Q2 16 & H1 16 Business Review
2 Q2 16 & H1 16 Business Highlights
3
4 Q3 16 & FY 16 Financial Objectives
5
Financial Information Appendix
Agenda
Q2 16 & H1 16 Financial Highlights

35
Software Revenue Growth Non-IFRS
Software Revenue
Improved software revenue growth with new licenses revenue return to growth in Q2
New Licenses Revenue
+0.9%
+2% ex FX
+4.8%
+6% ex FX
+5.4%
+7% ex FX
+4.6%
+6% ex FX

36
Software Revenue Growth Non-IFRS
Strong recurring revenue
+6.1%
+7% ex FX
+5.6%
+8% ex FX
Recurring
Non-recurring
Recurring and Other Software Revenue Software Revenue Evolution

37
Service Revenue & Margin Evolution Non-IFRS
Service Revenue
+1.2%
+2% ex FX
-4.0%
-3% ex FX
Serv. Gross Margin 10.7% 5.6% 15.9% 7.6%
38
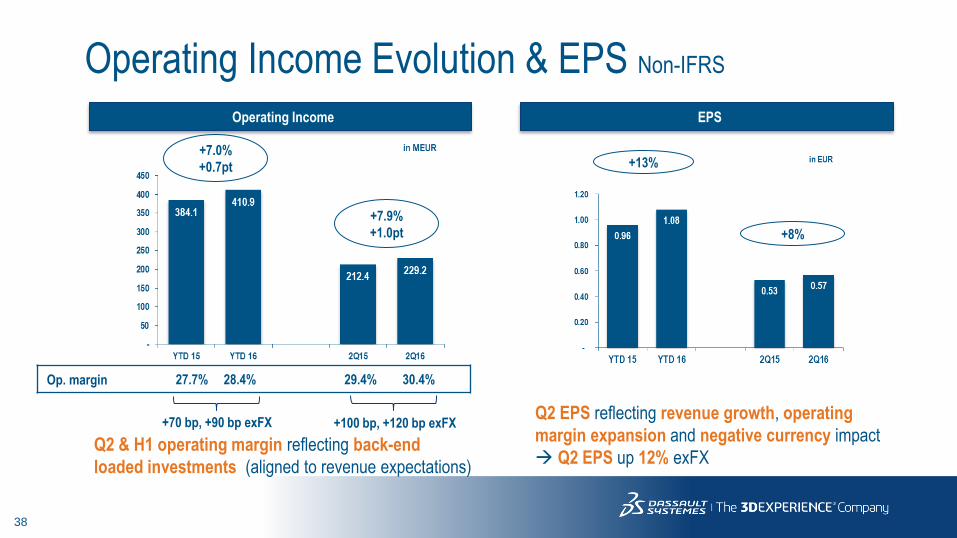
Operating Income Evolution & EPS Non-IFRS
Q2 & H1 operating margin reflecting back-end
loaded investments (aligned to revenue expectations)
+7.0%
+0.7pt
+7.9%
+1.0pt
+13%
+8%
Op. margin 27.7% 28.4% 29.4% 30.4%
+100 bp, +120 bp exFX +70 bp, +90 bp exFX Q2 EPS reflecting revenue growth, operating
margin expansion and negative currency impact
Q2 EPS up 12% exFX
Operating Income EPS

39
Change in Net Financial Position (YTD)
Operating cash flow: +€449m
compared to +€417m in H1 2015,
up +8%

40
Operating Cash Flow Evolution IFRS
€ million YTD 16 YTD 15 Changes
Operating Cash Flow +449 +417 +32
Net income adjusted for non cash items +288 +255 +33
Decrease in trade accounts receivable +115 +118 -3 Trade accounts receivable up 14% exFX compared to Q2 2015
Increase in unearned revenue +145 +135 +10 Unearned revenue up 12% exFX compared to Q2 2015
Decrease in accrued compensation -23 -25 +2
Decrease in accounts payable -6 -18 +12 Timing impact compared to H1 2015
Decrease in income taxes payable -73 -40 -33 Impact of tax downpayments and payments made in
connection with ongoing tax proceedings
Other +3 -8 +11

41
1
Q2 16 & H1 16 Business Review
2 Q2 16 & H1 16 Business Highlights
3
4 Q3 16 & FY 16 Financial Objectives
5
Financial Information Appendix
Agenda
Q2 16 & H1 16 Financial Highlights
42
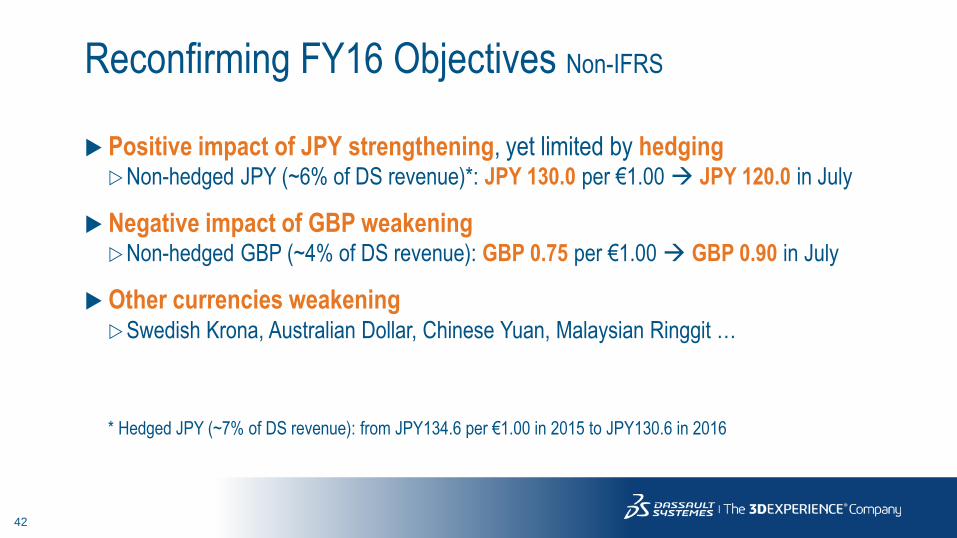
Reconfirming FY16 Objectives Non-IFRS
Positive impact of JPY strengthening, yet limited by hedging Non-hedged JPY (~6% of DS revenue)*: JPY 130.0 per €1.00 JPY 120.0 in July
Negative impact of GBP weakening Non-hedged GBP (~4% of DS revenue): GBP 0.75 per €1.00 GBP 0.90 in July
Other currencies weakening Swedish Krona, Australian Dollar, Chinese Yuan, Malaysian Ringgit …
* Hedged JPY (~7% of DS revenue): from JPY134.6 per €1.00 in 2015 to JPY130.6 in 2016

43
Objectives Changes Non-IFRS
Revenue variation
Mid-range: 3,000 3,003
ex FX Growth: +6-7% +6-7%
2,985-3,015 2,990-3,015
+10+7 +2
-1 -14 -4 -2
2,800
2,850
2,900
2,950
3,000
3,050
InitialObj.
Q1 FX Q2 FX GBP JPY Other FX Total FX Ortems JulyObj.

44
Proposed objectives Non-IFRS Q3 2016:
• New licenses revenue acceleration
• Q3 15 EPS reflecting €6M R&D tax
credit benefit and 4 cents of reversal
of tax reserves excluding these
impacts, Q3 16 EPS up +8-14% exFX
FY 2016:
• FY 16 revenue implying double-digit
new licenses growth exFX in H2
• Negative currency impact on revenue
growth above 2 points
• Tax rate below last year by 2 points
• Negative currency impact on EPS
growth above 4 points
Q3 2016 FY 2016
Revenue (M€) 715-725 2,990-3,015
Growth +4-6% +4-5%
Growth ex FX +6-8% +6-7%
Operating Margin 30-30.5% ~31.0%
Operating Margin Growth -1pt to Stable Stable
EPS (€) 0.54-0.57 2.40
EPS Growth -7% to -2% ~+7%
€/$ rates 1.15 1.13
€/¥ rates 120.0 122.2

68