analysts' meeting for financial results of first half fy 2013 · pdf fileanalysts'...
TRANSCRIPT

FY 2013 Nippon Paint Group Analysts' Meeting for Financial Results of First Half FY 2013
November 18, 2013Nippon Paint Co., Ltd.
Disclaimer
The forward-looking statements in this document are based on information available at the time of preparation and involve inherent risks and uncertainties. Accordingly, the actual results and performance of Nippon Paint Co., Ltd. and the Nippon Paint Group may be significantly different from the forward-looking statements. Please be advised that Nippon Paint Co., Ltd. and information providers will not take any responsibility for any damage suffered by any person relying on any information or statements contained herein. This document has been translated from the original Japanese version.In the event of any discrepancy between the original and translation, the original prevails.
1
2
Table of Contents
・・・・・・・・・・・・・・・ P3
1. Financial Results of 1H FY 2013・・・・・・・・・・・・・・・ P5
2. Forecast of FY 2013 ・・・・・・・・・・・・・・・ P11
3. Progress of 2014 Middle-Term Management Plan ・・・・・・・・・・・・・・・ P21
・・・・・・・・・・・・・・・ P30
Trends of Financial Results for Full Year & Summary
<Reference Materials>

3
Financial Results Trend
(100 million yen)
ROE 7.6% 11.6% 9.3% 13.5% 12.4% 17.0%
FY 2013 (Forecast)
2165 2274 2223 23342520 2550
315
259
163160
99
270
440330
202202
128
330
FY 2009 FY 2010 FY 2011 FY 2012Announced on May 8, 2013
Announced on Nov 6, 2013
Net sales
Operating income
Ordinary income

4
(i) Japan: Automobile production exceeded the Company’s estimate. The Company saw a last-minute rise in demand for trade-use paints and industrial-use coatings before the consumption tax hike.
(ii) Equity-method affiliates: Sales were strong and profitability improved due to the Chinese-version Survival Challenge program.
(iii) Net sales and profits in overseas business grew due to the depreciation of the yen.
Summary
Financial Results of 1H FY 2013
(i) Japan: Sales of trade-use paints are likely to decrease from 1H due to seasonal factors; sales of automotive and industrial-use coatings are expected to remain flat (vs. 1H).
(ii) Equity-method affiliates: Sales of the Chinese business are likely to keep growing. Profits are expected to increase significantly (vs. FY2012) because the weaker yen also contributed to the increase.
(iii) Profits are forecast to decrease from 1H, since Nippon estimates that raw material prices will soar and automotive coating sales will decline in North America and Thailand. However, profits are expected to increase (vs. FY2012).
Forecast of 2H FY 2013

5
1. Financial Results of 1H FY 2013
6
Financial Results for 1H FY 2013
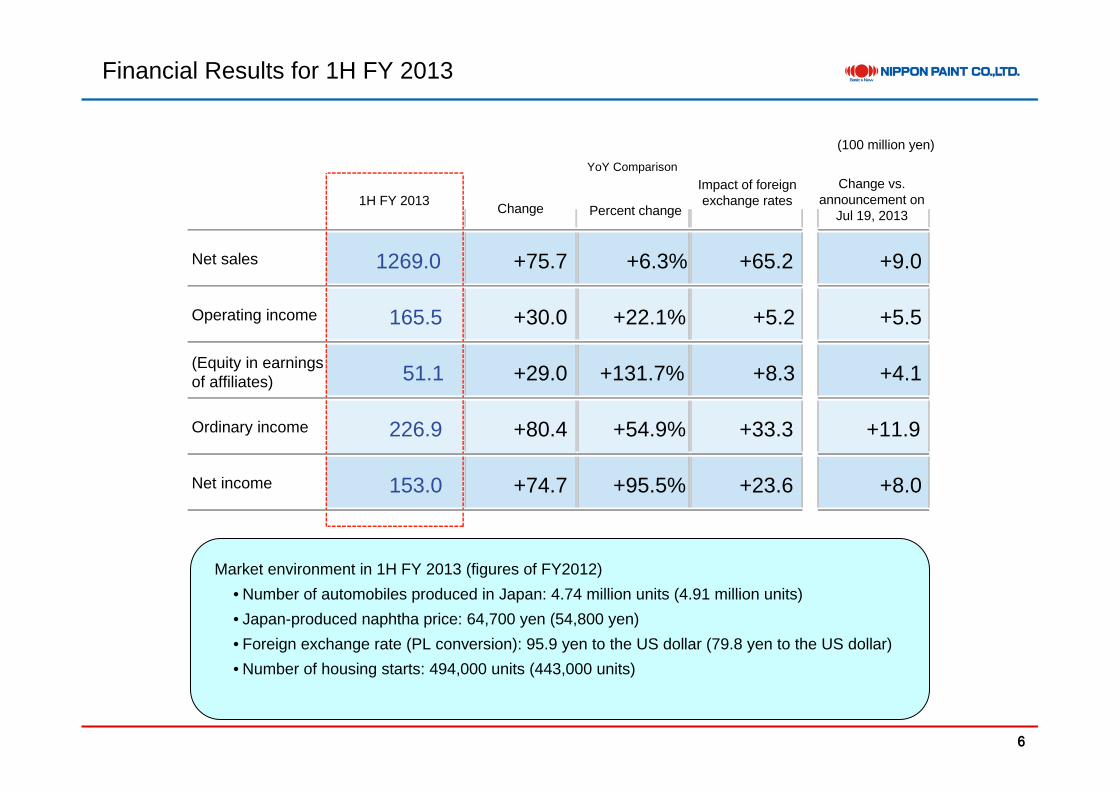
Market environment in 1H FY 2013 (figures of FY2012)• Number of automobiles produced in Japan: 4.74 million units (4.91 million units)• Japan-produced naphtha price: 64,700 yen (54,800 yen)• Foreign exchange rate (PL conversion): 95.9 yen to the US dollar (79.8 yen to the US dollar)• Number of housing starts: 494,000 units (443,000 units)
(100 million yen)
Percent change
Change vs. announcement on
Jul 19, 2013
Net sales 1269.0 +75.7 +6.3% +65.2 +9.0
Operating income 165.5 +30.0 +22.1% +5.2 +5.5
(Equity in earnings of affiliates) 51.1 +29.0 +131.7% +8.3 +4.1
Ordinary income 226.9 +80.4 +54.9% +33.3 +11.9
Net income 153.0 +74.7 +95.5% +23.6 +8.0
Impact of foreign exchange rates1H FY 2013 Change
YoY Comparison
7
Net Sales by Business Segment
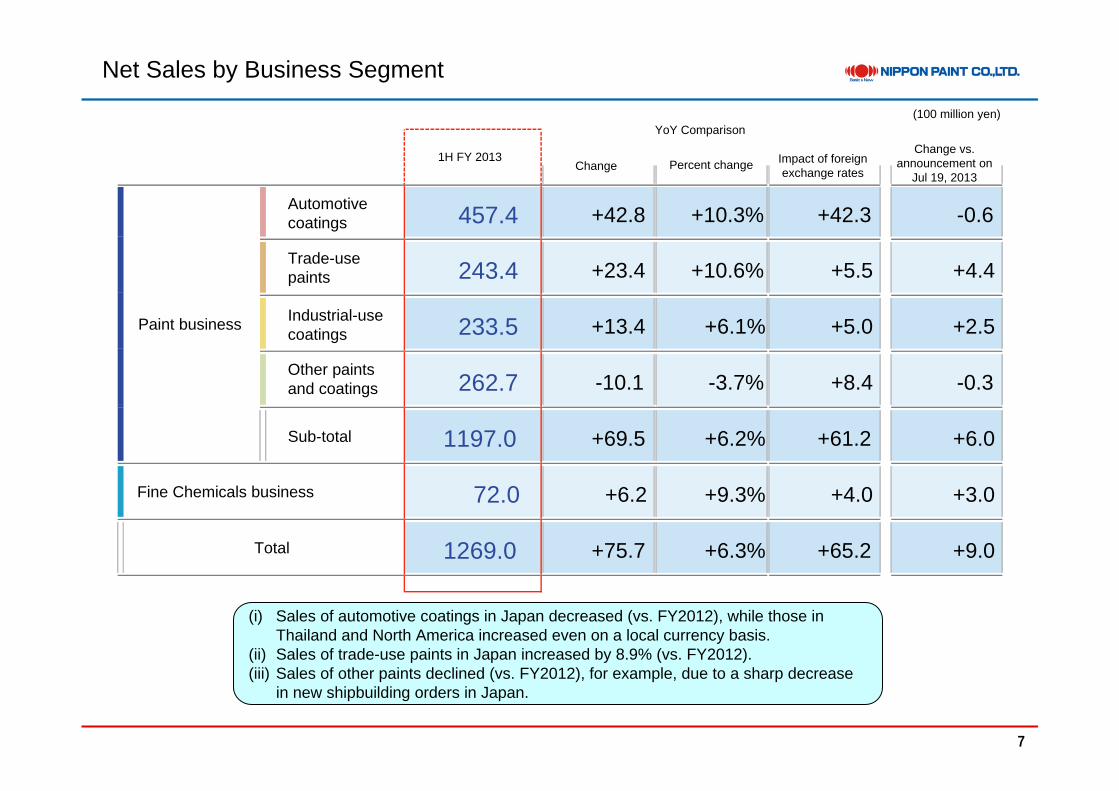
(i) Sales of automotive coatings in Japan decreased (vs. FY2012), while those in Thailand and North America increased even on a local currency basis.
(ii) Sales of trade-use paints in Japan increased by 8.9% (vs. FY2012).(iii) Sales of other paints declined (vs. FY2012), for example, due to a sharp decrease
in new shipbuilding orders in Japan.
Automotive coatings 457.4 +42.8 +10.3% +42.3 -0.6
Trade-use paints 243.4 +23.4 +10.6% +5.5 +4.4
Industrial-use coatings 233.5 +13.4 +6.1% +5.0 +2.5
Other paints and coatings 262.7 -10.1 -3.7% +8.4 -0.3
Sub-total 1197.0 +69.5 +6.2% +61.2 +6.0
72.0 +6.2 +9.3% +4.0 +3.0
1269.0 +75.7 +6.3% +65.2 +9.0
Paint business
Fine Chemicals business
Total
(100 million yen)
Percent changeChange vs.
announcement on Jul 19, 2013
Impact of foreign exchange rates
1H FY 2013 Change
YoY Comparison

8
Net Sales and Profits by Geographic Segment
(i) Sales in Japan increased (vs. FY2012) due to a rise in sales of trade-use and industrial-use paints, etc., although sales of automotive coatings declined.
(ii) Sales in Asia declined (vs. FY2012) in real terms due to a drop in sales of paints for ships etc., though sales of automotive coatings grew in real terms.
(iii) In North America, sales for Japanese automobile manufacturers remained strong even on a local currency basis.
Net sales 909.1 +13.3 - +9.1
Operating income 134.1 +17.2 - +4.1
Net sales 225.5 +39.3 +43.9 +0.5
Operating income 19.1 +7.4 +3.7 +0.1Equity in earnings of affiliates 51.1 +29.0 +8.3 +4.1
Net sales 119.5 +21.3 +19.7 -0.5
Operating income 11.5 +5.7 +2.1 +0.5
Net sales 14.9 +1.8 +1.5 -0.1
Operating income 0.2 +0.4 0 +0.2Other
Japan
Asia
North America
YoY Comparison
1H FY 2013 Change
(100 million yen)
Change vs. announcement on
Jul 19, 2013
Impact of foreign exchange rates

9
Analysis on Changes in Operating Income
Y-on-Y Comparison
(i) Soaring Japan-produced naphtha prices pushed up raw material costs.(ii) Rising raw material prices were absorbed by cost reduction efforts (VA).(iii) Overseas subsidiaries importing raw materials in yen saw operating income
increase due to foreign exchange fluctuations (weaker yen).
Change in net sales +410 Change in Japan
Non-consolidated
changeSelling prices +90Raw material costs -1,140VA +1,140Manufacturing expenses +240Selling, general and administrative expenses +160Subsidiaries +820 Change in
subsidiaries
+740 Change in overseas
+610 +1,350
-70
Operating income for 1H FY 2013 16,550 million yen (Japan: 13,410 million yen; Overseas etc.: 3,140 million yen)
+1,720+900
+2,170
Operating income for 1H FY 2012 13,550 million yen (Japan: 11,690 million yen; Overseas etc.: 1,860 million yen)
Detai
ls of
chan
ge by
facto
r
Japa
n seg
ment
Non-
cons
olida
ted co
mpan
y
Asia segment
North America segment etc.
Consolidation adjustment
+3.4億円
Change in non-consolidated and subsidiaries
Up 3,000 million yen
Change by segment

10
Analysis on Change in Ordinary Income
Y-on-Y Comparison
(i) Most of the increase in equity in earnings of affiliates were attributable to the Chinese business. Sales of profitable trade-use paints were especially robust.
(ii) The Company had foreign exchange gains of around 2,000 million yen due to the weaker yen.
Operating income +3,000Financial account balance +170Equity in earnings of affiliates +2,900Other non-operating income +1,970
Ordinary income for 1H FY 2012 14,650 million yen
Det
ails
of c
hang
e
Ordinary income for 1H FY 2013 22,690 million yen
Up 8,040 million yen
11
2. Forecast of FY 2013

12
Forecast of FY 2013
(i) Operating income is forecast to decrease in 2H (vs. 1H), since raw material prices are likely to rise further.
(ii) Equity in earnings of affiliates is expected to grow in 2H (vs. 1H) because equity-method affiliated companies in China fared well in the 3Q.
2550 1269 1281 +216.2 +9.3% +131.2 +20.0
315 165 150 +56.4 +21.8% +10.6 +15.0
110 51 59 +61.1 +124.9% +20.7 +25.0
440 227 213 +110.4 +33.5% +51.4 +50.0
300 153 147 +99.8 +49.9% +41.3 +45.0
2H1HFull-year
FY 2013
Net sales
Operating income
(Equity in earnings of affiliates)
Ordinary income
Net income
(100 million yen)YoY comparison
Change vs. announcement on
Jul 19, 2013 Impact of foreign exchange rates
Percent changeChange
13
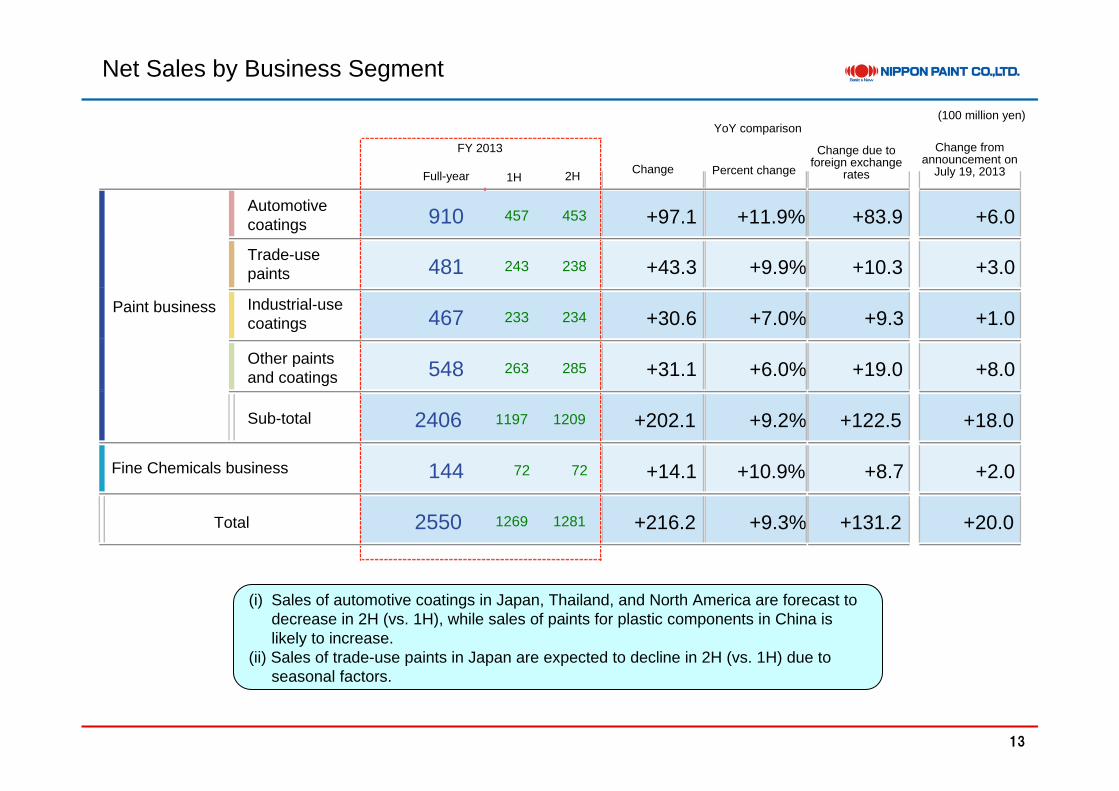
Net Sales by Business Segment
(i) Sales of automotive coatings in Japan, Thailand, and North America are forecast to decrease in 2H (vs. 1H), while sales of paints for plastic components in China is likely to increase.
(ii) Sales of trade-use paints in Japan are expected to decline in 2H (vs. 1H) due to seasonal factors.
910 457 453 +97.1 +11.9% +83.9 +6.0
481 243 238 +43.3 +9.9% +10.3 +3.0
467 233 234 +30.6 +7.0% +9.3 +1.0
548 263 285 +31.1 +6.0% +19.0 +8.0
2406 1197 1209 +202.1 +9.2% +122.5 +18.0
144 72 72 +14.1 +10.9% +8.7 +2.0
2550 1269 1281 +216.2 +9.3% +131.2 +20.0
2H1HFull-year
FY 2013
(100 million yen)YoY comparison
Change from announcement on
July 19, 2013
Change due to foreign exchange
ratesChange Percent change
Automotive coatings
Trade-use paints
Industrial-use coatings
Other paints and coatings
Sub-total
Paint business
Fine Chemicals business
Total
14
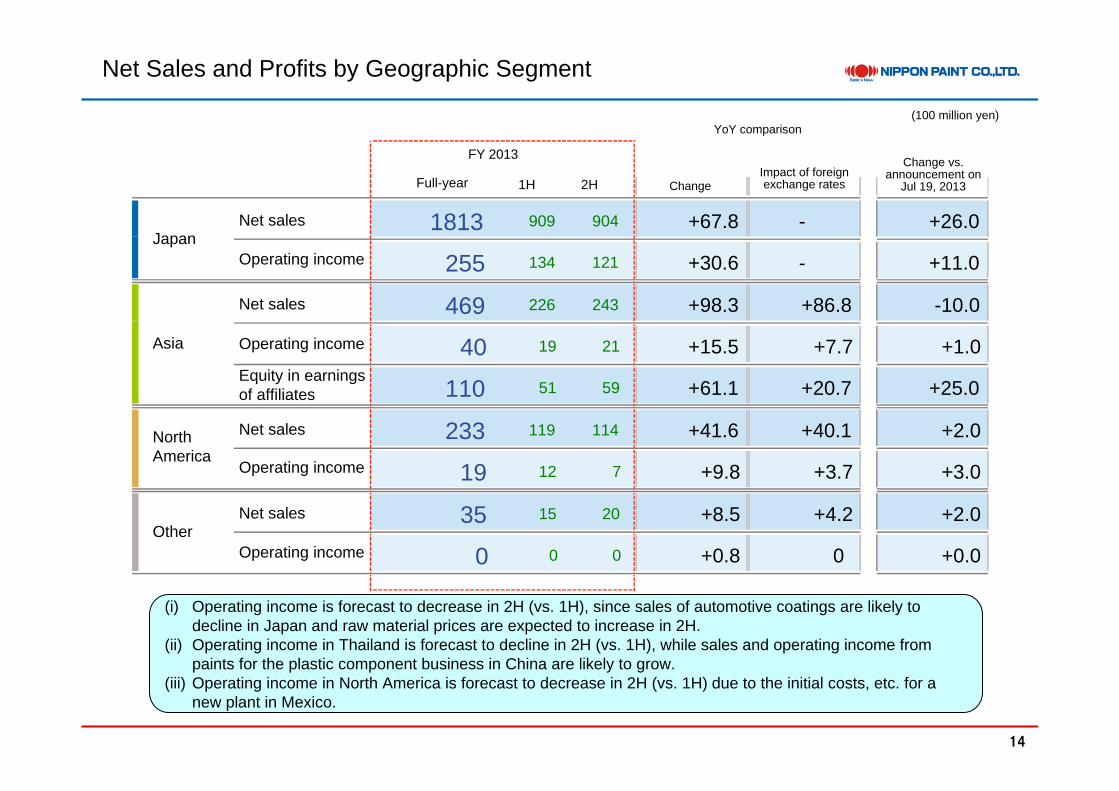
Net Sales and Profits by Geographic Segment
(i) Operating income is forecast to decrease in 2H (vs. 1H), since sales of automotive coatings are likely to decline in Japan and raw material prices are expected to increase in 2H.
(ii) Operating income in Thailand is forecast to decline in 2H (vs. 1H), while sales and operating income from paints for the plastic component business in China are likely to grow.
(iii) Operating income in North America is forecast to decrease in 2H (vs. 1H) due to the initial costs, etc. for a new plant in Mexico.
1813 909 904 +67.8 - +26.0
255 134 121 +30.6 - +11.0
469 226 243 +98.3 +86.8 -10.0
40 19 21 +15.5 +7.7 +1.0
110 51 59 +61.1 +20.7 +25.0
233 119 114 +41.6 +40.1 +2.0
19 12 7 +9.8 +3.7 +3.0
35 15 20 +8.5 +4.2 +2.0
0 0 0 +0.8 0 +0.0
2H1H Full-year
FY 2013
(100 million yen)YoY comparison
Change vs. announcement on
Jul 19, 2013 Impact of foreign exchange ratesChange
Net sales
Operating income
Net sales
Operating income
Equity in earnings of affiliates
Net sales
Operating income
Net sales
Operating incomeOther
Japan
Asia
North America
15
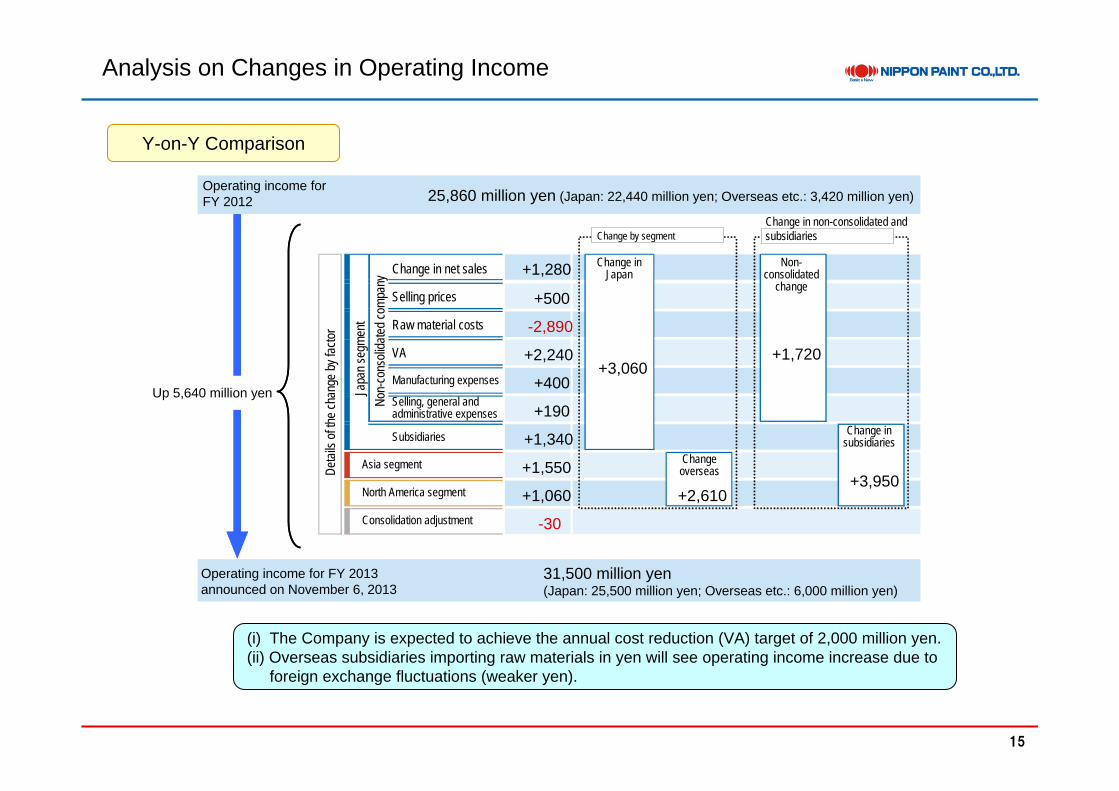
Analysis on Changes in Operating Income
Y-on-Y Comparison
(i) The Company is expected to achieve the annual cost reduction (VA) target of 2,000 million yen.(ii) Overseas subsidiaries importing raw materials in yen will see operating income increase due to
foreign exchange fluctuations (weaker yen).
+1,280
+500
-2,890
+2,240
+400
+190
+1,340
+1,550
+1,060 +2,610
-30
Operating income for FY 2012 25,860 million yen (Japan: 22,440 million yen; Overseas etc.: 3,420 million yen)
Operating income for FY 2013 announced on November 6, 2013
31,500 million yen(Japan: 25,500 million yen; Overseas etc.: 6,000 million yen)
+3,060+1,720
+3,950
+3.4億円Up 5,640 million yen
Change in net sales
Selling prices
Raw material costs
VA
Manufacturing expenses
Selling, general and administrative expenses
Subsidiaries
Detai
ls of
the ch
ange
by fa
ctor
Japa
n seg
ment
Non-
cons
olida
ted co
mpan
y
Asia segment
North America segment
Consolidation adjustment
Change in Japan
Non-consolidated
change
Change in subsidiaries
Change overseas
Change in non-consolidated and subsidiariesChange by segment
16
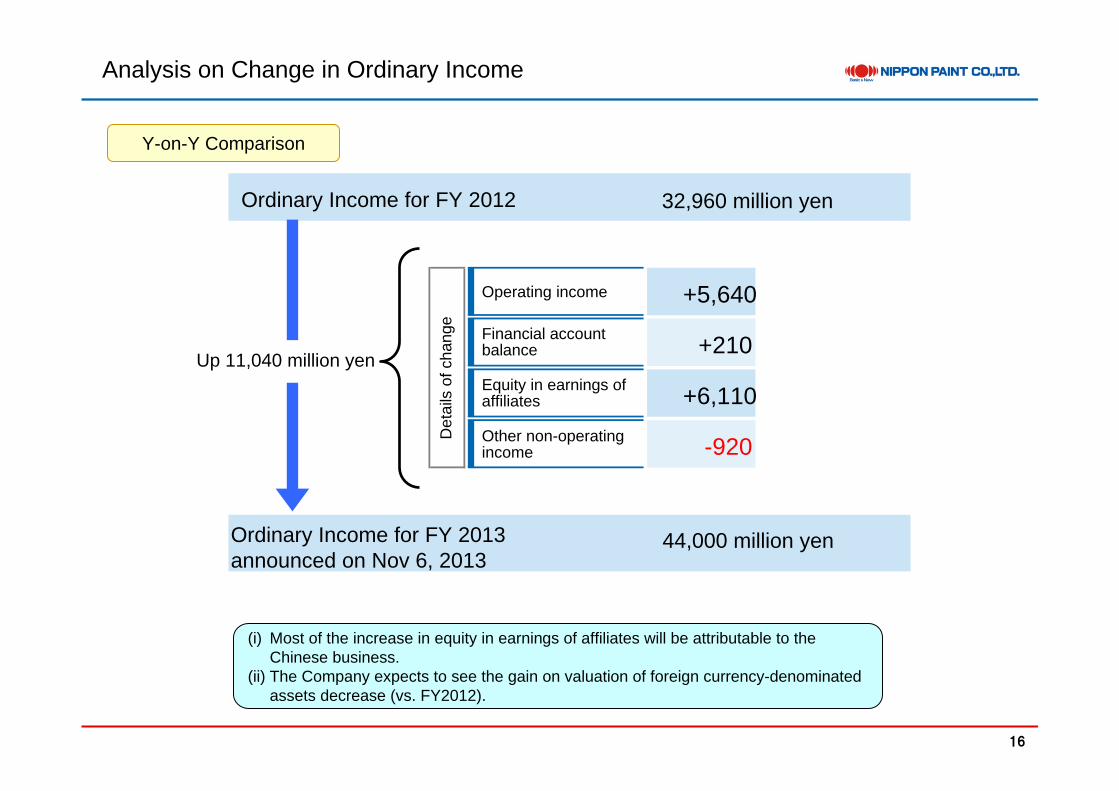
Analysis on Change in Ordinary Income
Y-on-Y Comparison
(i) Most of the increase in equity in earnings of affiliates will be attributable to the Chinese business.
(ii) The Company expects to see the gain on valuation of foreign currency-denominated assets decrease (vs. FY2012).
+5,640
+210
+6,110
-920
Ordinary Income for FY 2012
Ordinary Income for FY 2013 announced on Nov 6, 2013
Up 11,040 million yen
Operating income
Financial account balance
Equity in earnings of affiliates
Other non-operating income
Det
ails
of c
hang
e
44,000 million yen
32,960 million yen
17
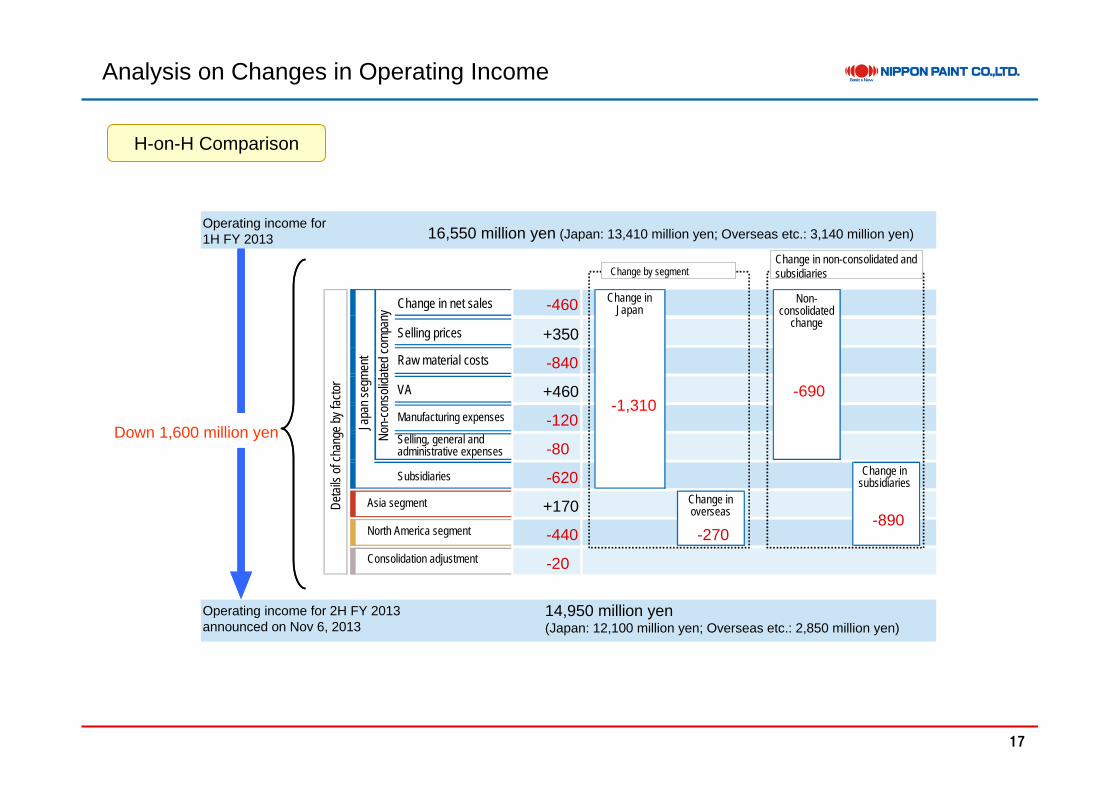
Analysis on Changes in Operating Income
H-on-H Comparison
-460
+350
-840
+460
-120
-80
-620
+170
-440 -270
-20
-1,310-690
-890
+3.4億円Down 1,600 million yen
Operating income for 1H FY 2013 16,550 million yen (Japan: 13,410 million yen; Overseas etc.: 3,140 million yen)
Operating income for 2H FY 2013 announced on Nov 6, 2013
14,950 million yen(Japan: 12,100 million yen; Overseas etc.: 2,850 million yen)
Change in net sales
Selling prices
Raw material costs
VA
Manufacturing expenses
Selling, general and administrative expenses
Subsidiaries
Detai
ls of
chan
ge by
facto
r
Japa
n seg
ment
Non-
cons
olida
ted co
mpan
y
Asia segment
North America segment
Consolidation adjustment
Change in Japan
Non-consolidated
change
Change in subsidiaries
Change in overseas
Change in non-consolidated and subsidiariesChange by segment
18
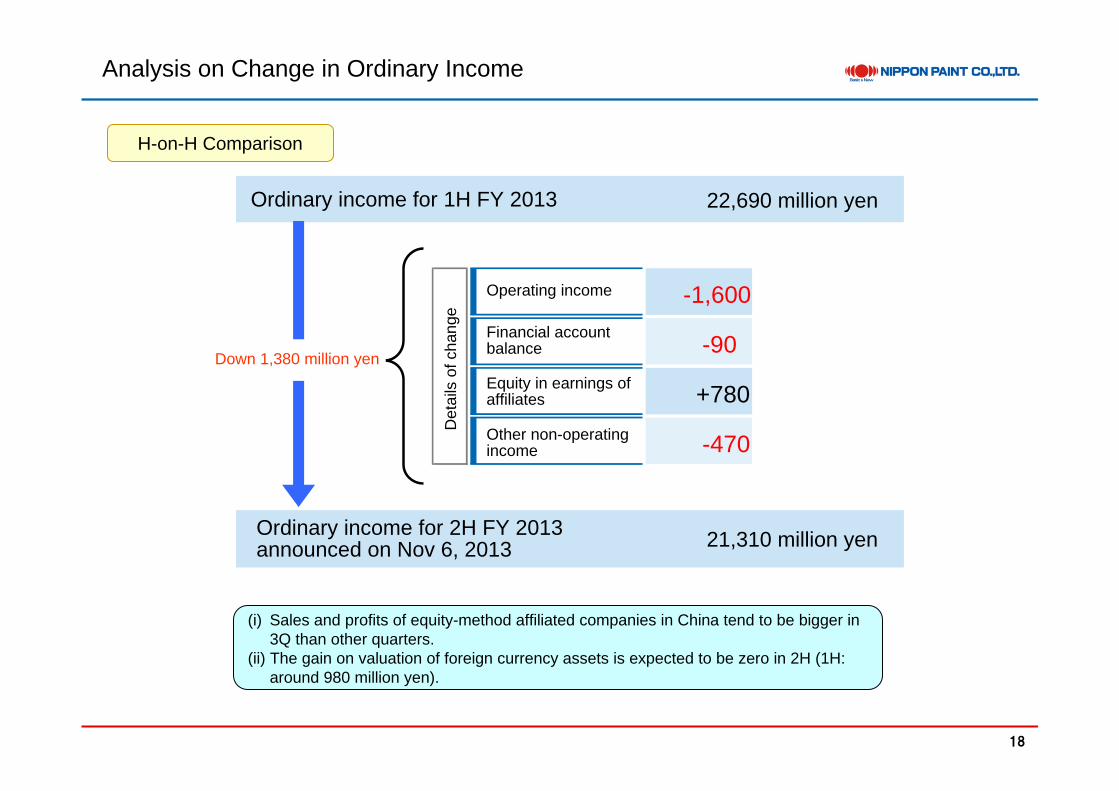
Analysis on Change in Ordinary Income
(i) Sales and profits of equity-method affiliated companies in China tend to be bigger in 3Q than other quarters.
(ii) The gain on valuation of foreign currency assets is expected to be zero in 2H (1H: around 980 million yen).
H-on-H Comparison
-1,600
-90
+780
-470
Ordinary income for 1H FY 2013
Ordinary income for 2H FY 2013 announced on Nov 6, 2013
Down 1,380 million yen
Operating income
Financial account balance
Equity in earnings of affiliates
Other non-operating income
Det
ails
of c
hang
e
22,690 million yen
21,310 million yen
19
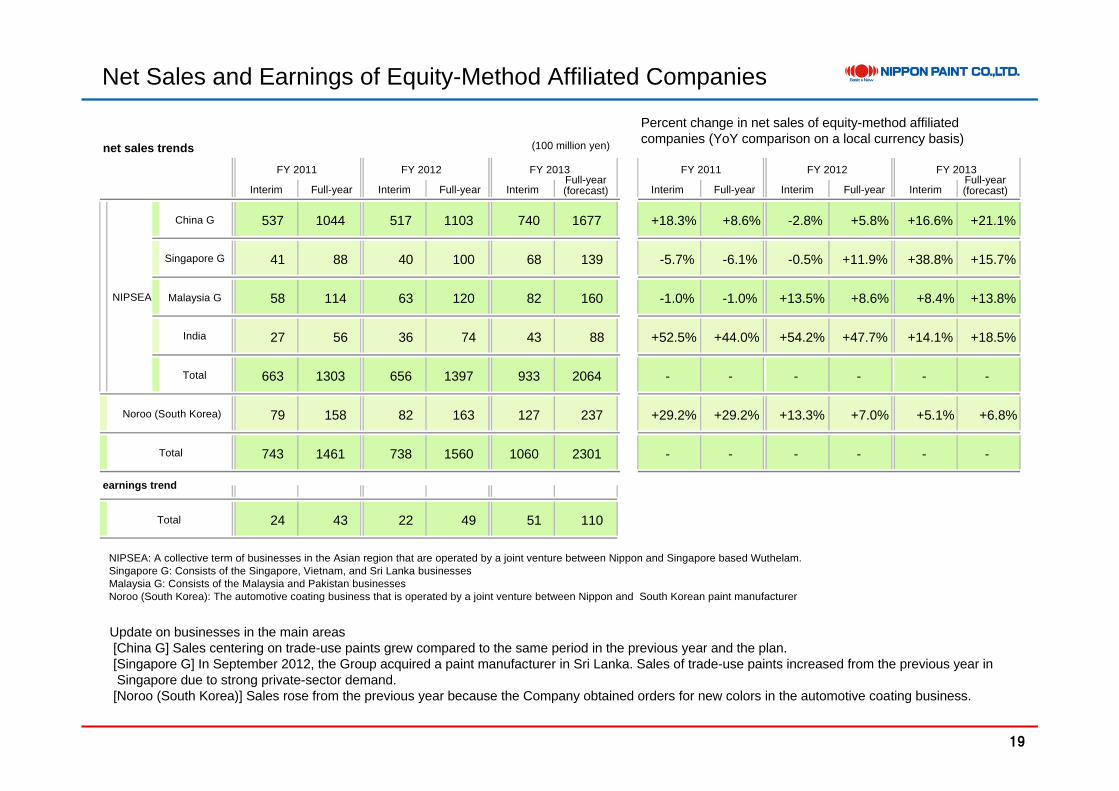
Net Sales and Earnings of Equity-Method Affiliated Companies
Update on businesses in the main areas[China G] Sales centering on trade-use paints grew compared to the same period in the previous year and the plan.[Singapore G] In September 2012, the Group acquired a paint manufacturer in Sri Lanka. Sales of trade-use paints increased from the previous year in Singapore due to strong private-sector demand.[Noroo (South Korea)] Sales rose from the previous year because the Company obtained orders for new colors in the automotive coating business.
net sales trends (100 million yen)
Percent change in net sales of equity-method affiliated companies (YoY comparison on a local currency basis)
Interim Full-year Interim Full-year InterimFull-year (forecast) Interim Full-year Interim Full-year Interim
China G 537 1044 517 1103 740 1677 +18.3% +8.6% -2.8% +5.8% +16.6% +21.1%
41 88 40 100 68 139 -5.7% -6.1% -0.5% +11.9% +38.8% +15.7%
58 114 63 120 82 160 -1.0% -1.0% +13.5% +8.6% +8.4% +13.8%
27 56 36 74 43 88 +52.5% +44.0% +54.2% +47.7% +14.1% +18.5%
663 1303 656 1397 933 2064 - - - - - -
79 158 82 163 127 237 +29.2% +29.2% +13.3% +7.0% +5.1% +6.8%
743 1461 738 1560 1060 2301 - - - - - -
24 43 22 49 51 110
NIPSEA: A collective term of businesses in the Asian region that are operated by a joint venture between Nippon and Singapore based Wuthelam. Singapore G: Consists of the Singapore, Vietnam, and Sri Lanka businessesMalaysia G: Consists of the Malaysia and Pakistan businessesNoroo (South Korea): The automotive coating business that is operated by a joint venture between Nippon and South Korean paint manufacturer
Total
Noroo (South Korea)
NIPSEA
earnings trend
FY 2011 FY 2012 FY 2013
Total
FY 2011 FY 2012 FY 2013Full-year (forecast)
Singapore G
Malaysia G
India
Total
20
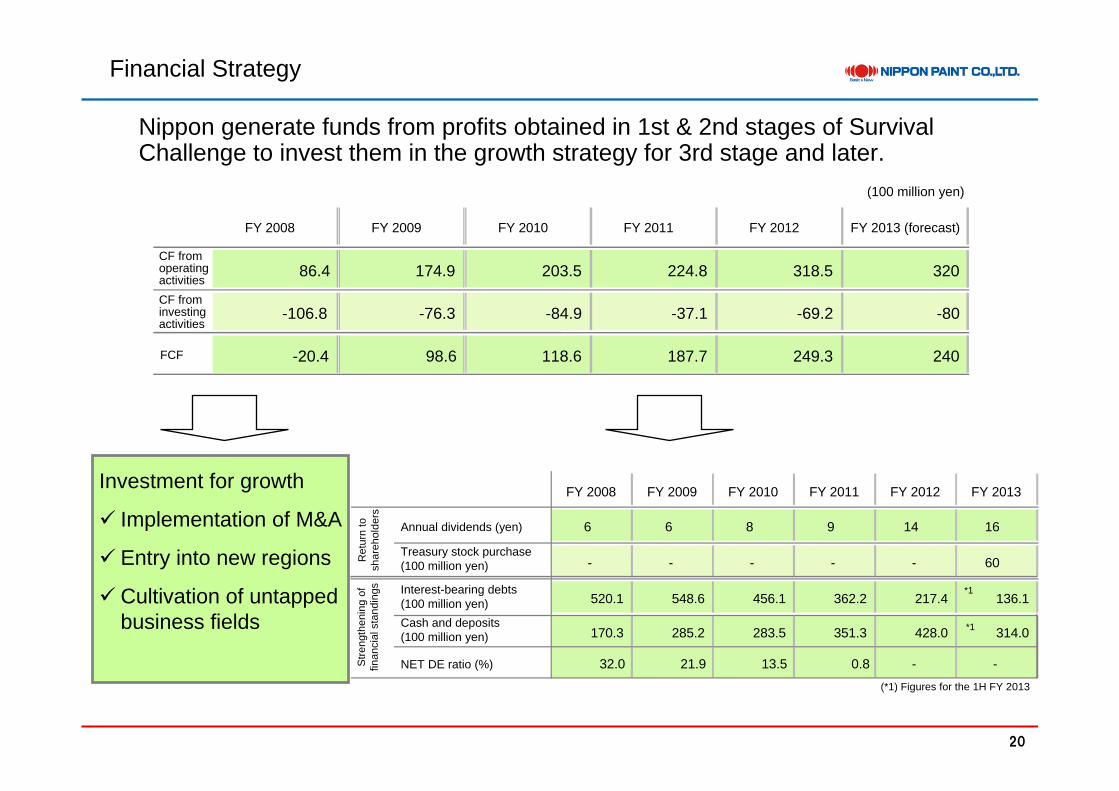
Financial Strategy
Nippon generate funds from profits obtained in 1st & 2nd stages of Survival Challenge to invest them in the growth strategy for 3rd stage and later.
Investment for growth
Implementation of M&A
Entry into new regions
Cultivation of untapped business fields
(100 million yen)
FY 2008 FY 2009 FY 2010 FY 2011 FY 2012 FY 2013 (forecast)
CF from operating activities
86.4 174.9 203.5 224.8 318.5 320
CF from investing activities
-106.8 -76.3 -84.9 -37.1 -69.2 -80
FCF -20.4 98.6 118.6 187.7 249.3 240
FY 2008 FY 2009 FY 2010 FY 2011 FY 2012 FY 2013
Annual dividends (yen) 6 6 8 9 14 16
Treasury stock purchase (100 million yen) - - - - - 60
Interest-bearing debts (100 million yen) 520.1 548.6 456.1 362.2 217.4 136.1
Cash and deposits (100 million yen) 170.3 285.2 283.5 351.3 428.0 314.0
NET DE ratio (%) 32.0 21.9 13.5 0.8 - -(*1) Figures for the 1H FY 2013
Stre
ngth
enin
g of
fin
anci
al s
tand
ings
Ret
urn
to
shar
ehol
ders
*1
*1
21
3. Progress of 2014 Middle-Term Management Plan
22
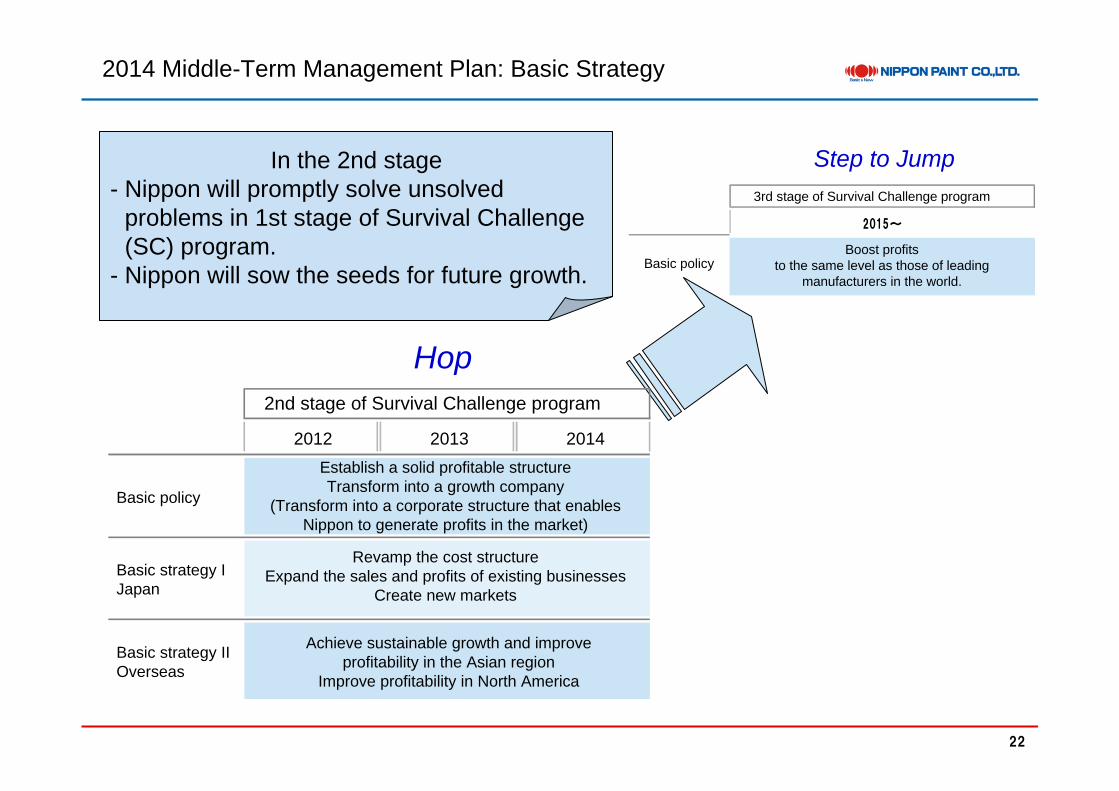
2014 Middle-Term Management Plan: Basic Strategy
Hop
Step to JumpIn the 2nd stage - Nippon will promptly solve unsolved
problems in 1st stage of Survival Challenge (SC) program.
- Nippon will sow the seeds for future growth. Basic policy
3rd stage of Survival Challenge program
2015~
Boost profitsto the same level as those of leading
manufacturers in the world.
2012 2013 2014
Basic policy
Basic strategy IJapan
Basic strategy IIOverseas
Revamp the cost structureExpand the sales and profits of existing businesses
Create new markets
Achieve sustainable growth and improve profitability in the Asian region
Improve profitability in North America
2nd stage of Survival Challenge program
Establish a solid profitable structureTransform into a growth company
(Transform into a corporate structure that enables Nippon to generate profits in the market)
23
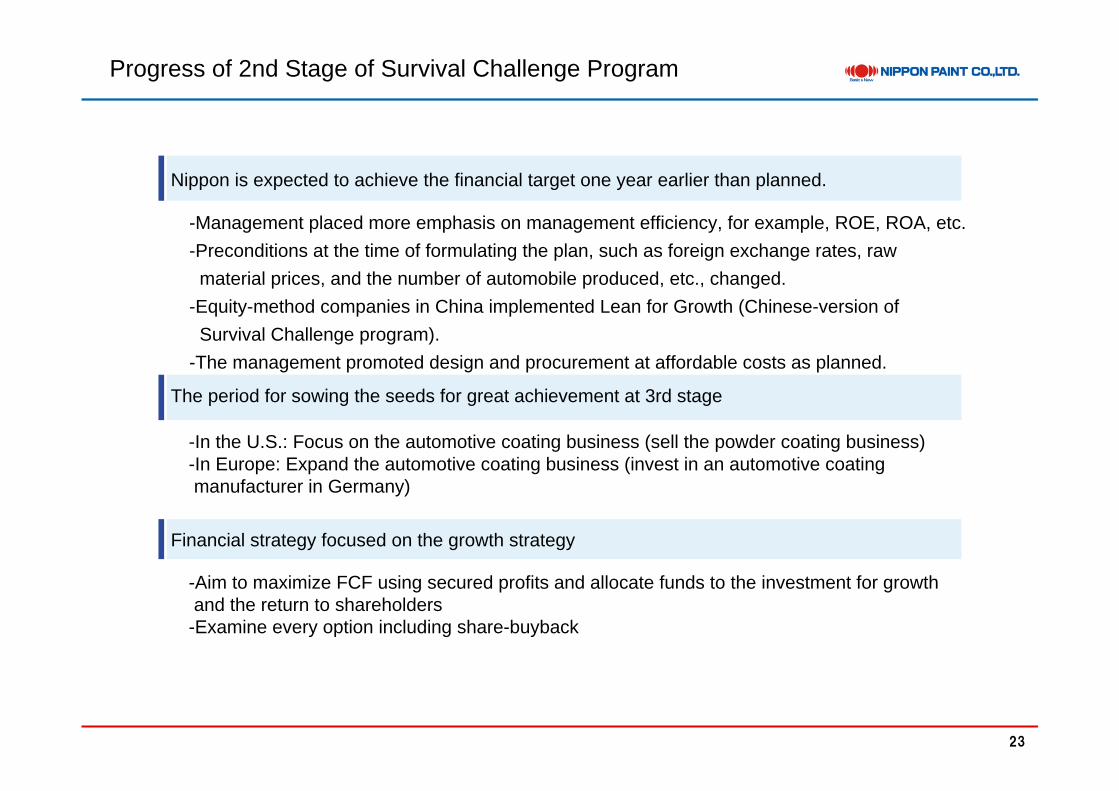
Progress of 2nd Stage of Survival Challenge Program
Nippon is expected to achieve the financial target one year earlier than planned.
-Management placed more emphasis on management efficiency, for example, ROE, ROA, etc.-Preconditions at the time of formulating the plan, such as foreign exchange rates, raw
material prices, and the number of automobile produced, etc., changed.-Equity-method companies in China implemented Lean for Growth (Chinese-version of
Survival Challenge program).-The management promoted design and procurement at affordable costs as planned.
The period for sowing the seeds for great achievement at 3rd stage
-In the U.S.: Focus on the automotive coating business (sell the powder coating business)-In Europe: Expand the automotive coating business (invest in an automotive coating manufacturer in Germany)
Financial strategy focused on the growth strategy
-Aim to maximize FCF using secured profits and allocate funds to the investment for growth and the return to shareholders
-Examine every option including share-buyback
24
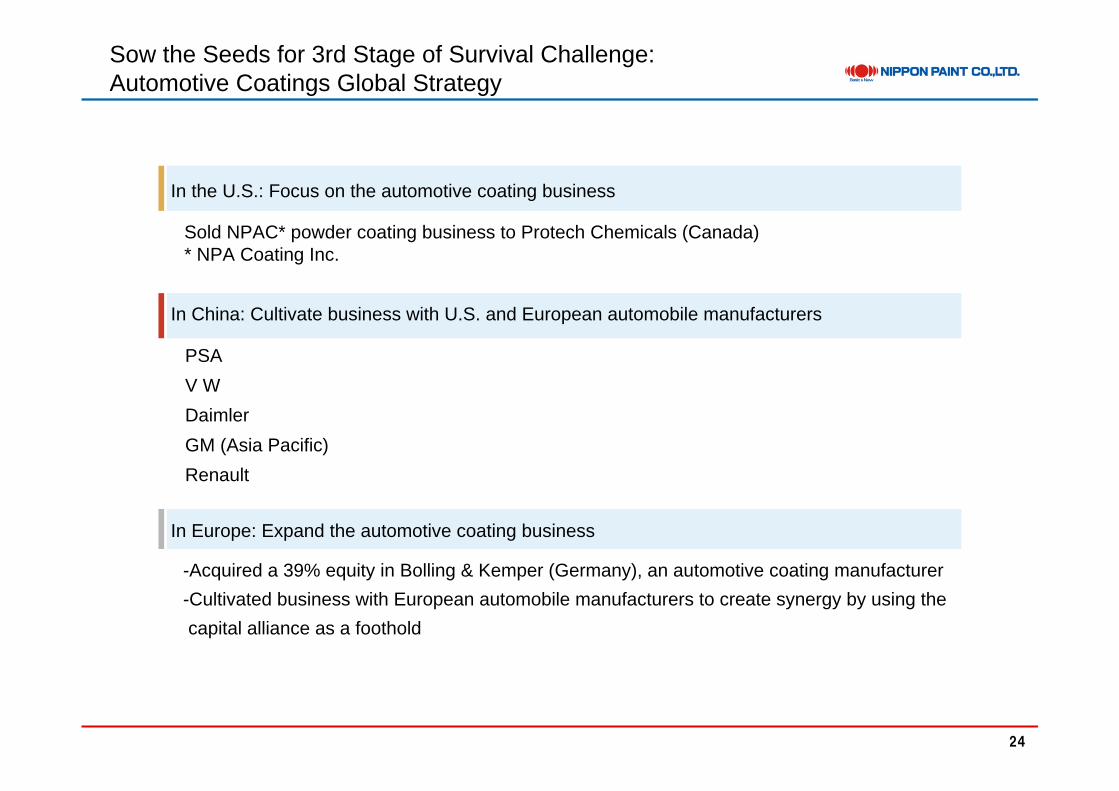
Sow the Seeds for 3rd Stage of Survival Challenge: Automotive Coatings Global Strategy
In the U.S.: Focus on the automotive coating business
Sold NPAC* powder coating business to Protech Chemicals (Canada)* NPA Coating Inc.
In China: Cultivate business with U.S. and European automobile manufacturers
PSAV W Daimler GM (Asia Pacific)Renault
In Europe: Expand the automotive coating business
-Acquired a 39% equity in Bolling & Kemper (Germany), an automotive coating manufacturer-Cultivated business with European automobile manufacturers to create synergy by using thecapital alliance as a foothold

25
Automotive Coatings Global Strategy:
Europe
CY2012 20.17 million unitsCY2020 22.00 million units
South Korea
CY2012 4.60 million unitsCY2020 4.50 million units
Asia
CY2012 9.31 million unitsCY2020 15.00 million units
Japan
CY2012 9.94 million unitsCY2020 7.50 million units
China
CY2012 19.27 million unitsCY2020 25.00 million units
CY2012 83.54 million unitsCY2020 97.50 million units
North America
CY2012 15.80 million unitsCY2020 18.00 million units
South America
CY2012 4.45 million unitsCY2020 5.50 million units
*1: India, Thailand, and Indonesia, etc. excluding Japan, China, and South Korea
*2: United States, Canada, and Mexico
Around 2.0 million units
CY 2012: Figures from the automobile industry association in each countryCY 2020: Company’s estimate
Japanese market will become smaller, but global market is expanding.

26
Automotive Coatings Global Strategy: New Target -Regions, Customers and Products -
Nippon aims to become one of top three companies as full lineup global supplier.
Examples of measures New painting process and shortening
of manufacturing processEnvironmentally friendly productsProduct design based on local consumption of locally produced products
Implementation of global alliance strategy
Expansion of profits of existing businesses and <New Target> × <Localization>
Regions, customers and products
Local consumption of locally produced
products
Under implementation
Regional strategy
×Customer strategy
South Korean automobiles
European automobiles
Chinese automobiles
Japanese automobiles
American automobiles
Japan Other AsiaSouth
AmericaChina Europe North America
No market

27
Acquired a 39% of Equity in B&K, a German Paint Manufacturer
Company name: BOLLIG & KEMPER GmbH & CO. KG
Establishment: 1919Location: Cologne, GermanyCapital stock: 5.7 million EurosNet sales: Around 10,000 million yen (in 2012)Main bases: Headquarters and plant: Cologne, Germany;
Plant: Fleury, FranceMain businesses: Automotive coatings [primer surfacer and
top coat], automotive component (plastic) paints
Main customers: VW, Daimler, PSA, BMW (U.S.), etc.
Nippon will accelerate the expansion of supplies to European autNippon will accelerate the expansion of supplies to European automobile omobile manufacturers in China and Europe.manufacturers in China and Europe.
Nippon will aim to globally grow and develop the automotive coatNippon will aim to globally grow and develop the automotive coatings business ings business in the future.in the future.
[Front gate]
[Company’s building at the time of the establishment]
28
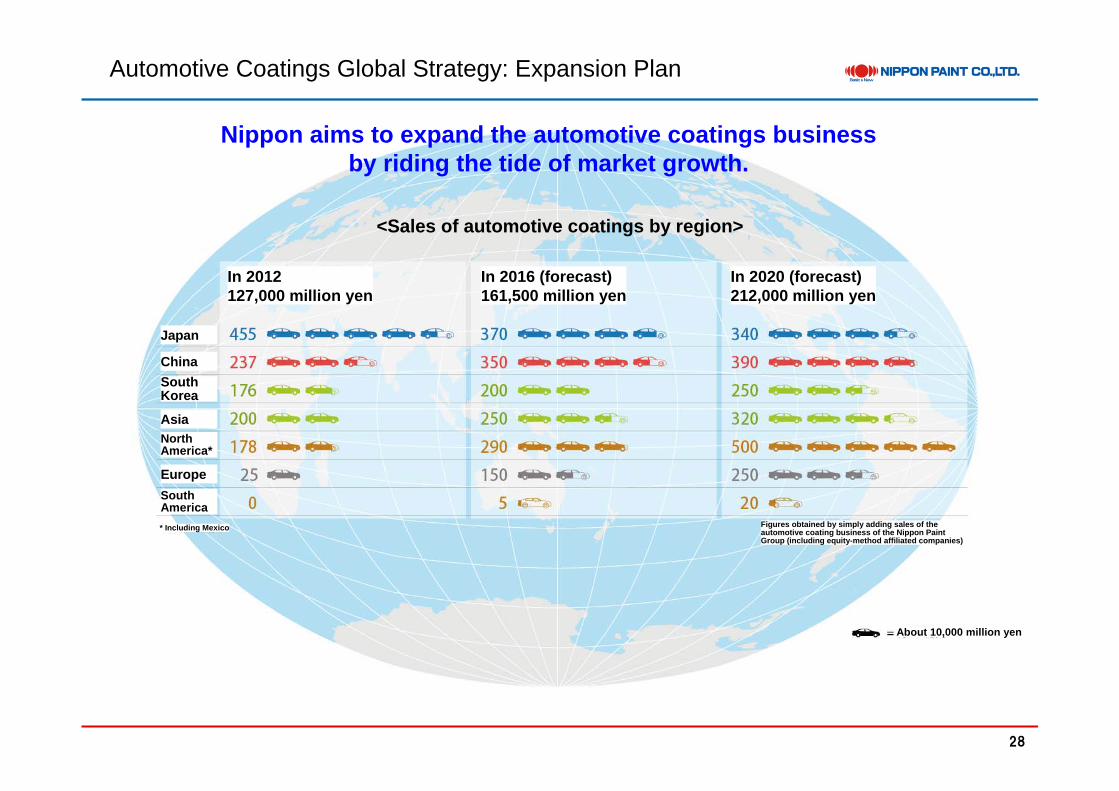
Automotive Coatings Global Strategy: Expansion Plan
<Sales of automotive coatings by region>
Nippon aims to expand the automotive coatings business by riding the tide of market growth.
Japan
ChinaSouth Korea
Europe
North America*
South America* Including Mexico
In 2012127,000 million yen
In 2016 (forecast)161,500 million yen
In 2020 (forecast)212,000 million yen
Figures obtained by simply adding sales of the automotive coating business of the Nippon Paint Group (including equity-method affiliated companies)
About 10,000 million yen
Asia

29
30
<Reference Materials>
31
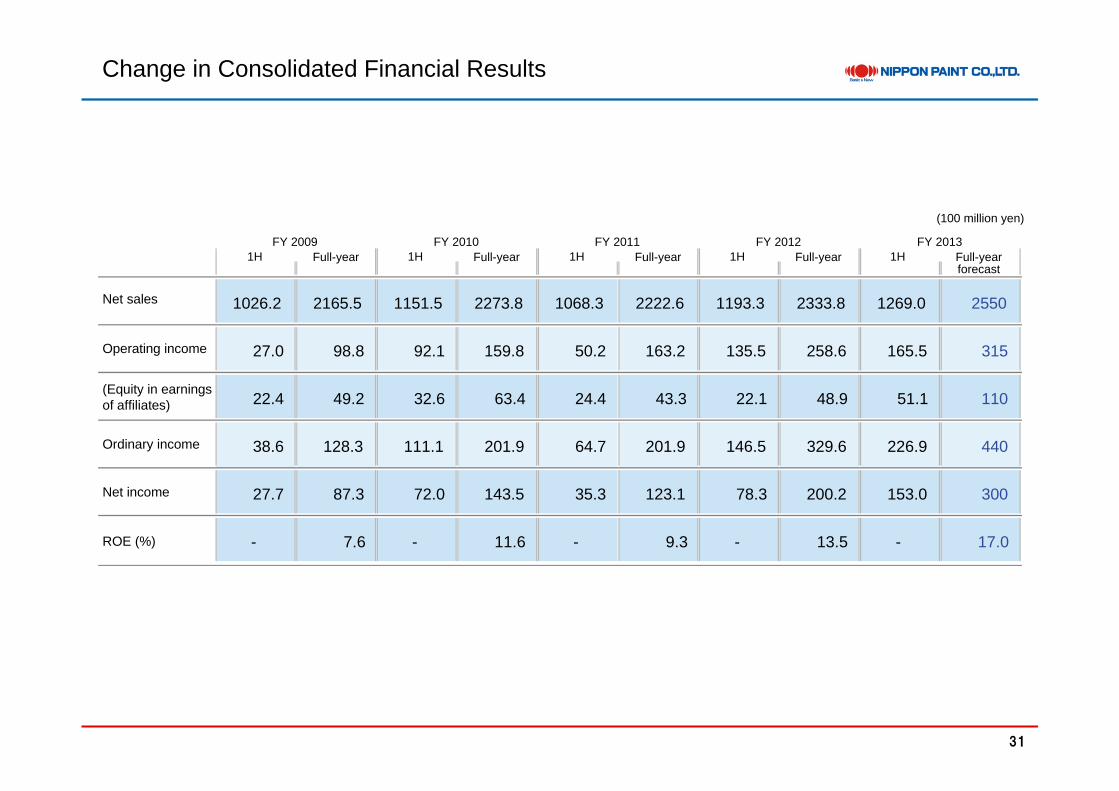
Change in Consolidated Financial Results
(100 million yen)
1026.2 2165.5 1151.5 2273.8 1068.3 2222.6 1193.3 2333.8 1269.0 2550
27.0 98.8 92.1 159.8 50.2 163.2 135.5 258.6 165.5 315
22.4 49.2 32.6 63.4 24.4 43.3 22.1 48.9 51.1 110
38.6 128.3 111.1 201.9 64.7 201.9 146.5 329.6 226.9 440
27.7 87.3 72.0 143.5 35.3 123.1 78.3 200.2 153.0 300
- 7.6 - 11.6 - 9.3 - 13.5 - 17.0
1H Full-year FY 2009 FY 2010 FY 2011 FY 2012 FY 2013
1H Full-year 1H Full-year 1H Full-year 1H Full-year forecast
Net sales
Operating income
(Equity in earnings of affiliates)
Ordinary income
Net income
ROE (%)
32
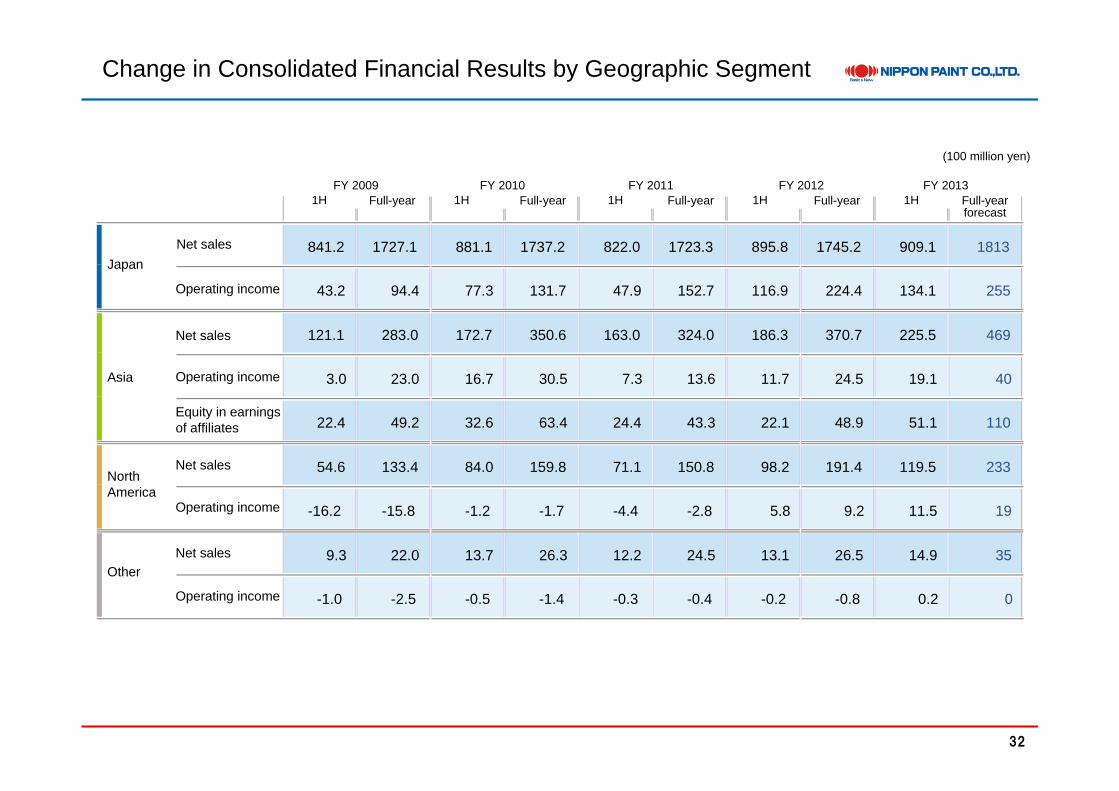
Change in Consolidated Financial Results by Geographic Segment
841.2 1727.1 881.1 1737.2 822.0 1723.3 895.8 1745.2 909.1 1813
43.2 94.4 77.3 131.7 47.9 152.7 116.9 224.4 134.1 255
121.1 283.0 172.7 350.6 163.0 324.0 186.3 370.7 225.5 469
3.0 23.0 16.7 30.5 7.3 13.6 11.7 24.5 19.1 40
22.4 49.2 32.6 63.4 24.4 43.3 22.1 48.9 51.1 110
54.6 133.4 84.0 159.8 71.1 150.8 98.2 191.4 119.5 233
-16.2 -15.8 -1.2 -1.7 -4.4 -2.8 5.8 9.2 11.5 19
9.3 22.0 13.7 26.3 12.2 24.5 13.1 26.5 14.9 35
-1.0 -2.5 -0.5 -1.4 -0.3 -0.4 -0.2 -0.8 0.2 0
(100 million yen)
1H Full-yearFY 2009 FY 2010 FY 2011 FY 2012 FY 2013
1H Full-year 1H Full-year 1H Full-year 1H Full-year forecast
Net sales
Operating income
Net sales
Operating income
Equity in earnings of affiliates
Net sales
Operating income
Net sales
Operating income
Other
Japan
Asia
North America

33
Change in Consolidated Net Sales by Business Segment
Consolidated total net sales
297.0 676.0 386.6 747.5 328.7 724.1 414.7 812.9 457.4 910
217.8 428.3 211.4 416.9 191.9 397.6 220.0 437.7 243.4 481
179.9 371.9 205.1 409.3 211.2 421.3 220.1 436.4 233.5 467
273.3 561.2 279.8 567.4 268.3 545.0 272.8 516.9 262.7 548
967.9 2037.3 1083.0 2141.0 1000.1 2088.1 1127.5 2203.9 1197.0 2406
58.3 128.1 68.6 132.8 68.2 134.5 65.8 129.9 72.0 144
1026.2 2165.5 1151.5 2273.8 1068.3 2222.6 1193.3 2333.8 1269.0 2550
(100 million yen)
1H Full-year FY 2009 FY 2010 FY 2011 FY 2012 FY 2013
1H Full-year 1H Full-year 1H Full-year 1H Full-year forecast
Automotive coatings
Trade-use paints
Industrial-use coatings
Other paints and coatings
Sub-total
Paint business
Fine Chemicals business
Total
34
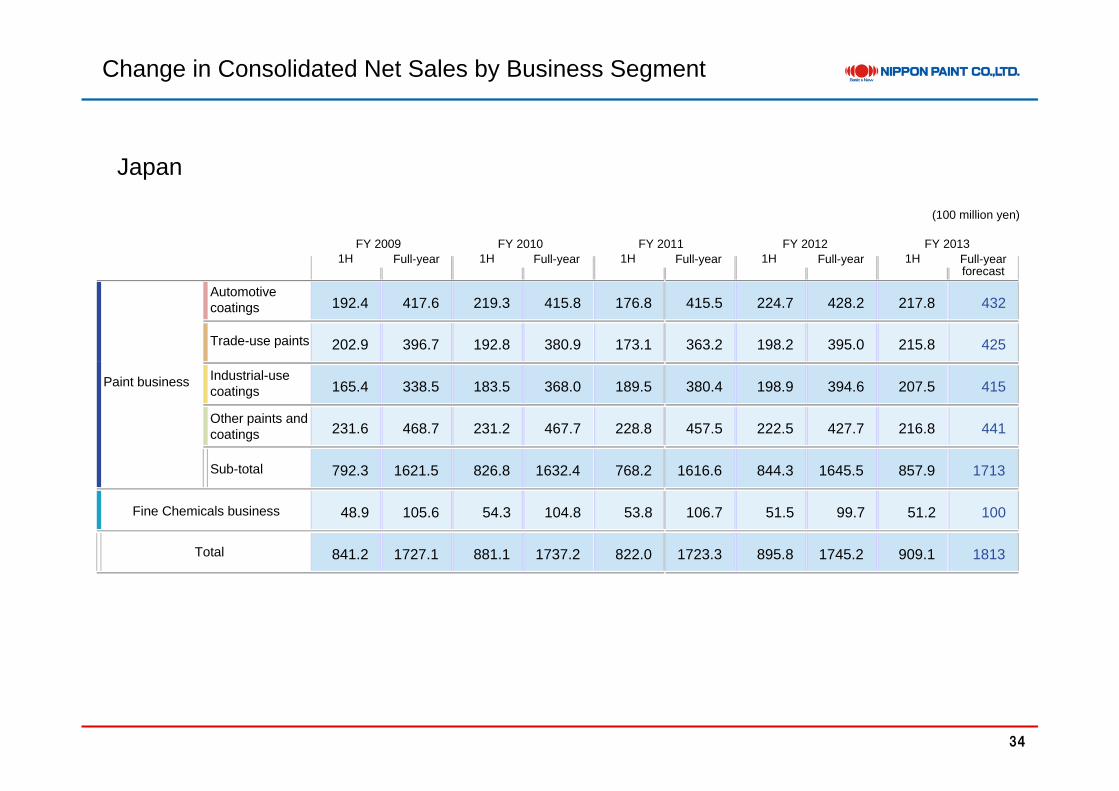
Change in Consolidated Net Sales by Business Segment
Japan
192.4 417.6 219.3 415.8 176.8 415.5 224.7 428.2 217.8 432
202.9 396.7 192.8 380.9 173.1 363.2 198.2 395.0 215.8 425
165.4 338.5 183.5 368.0 189.5 380.4 198.9 394.6 207.5 415
231.6 468.7 231.2 467.7 228.8 457.5 222.5 427.7 216.8 441
792.3 1621.5 826.8 1632.4 768.2 1616.6 844.3 1645.5 857.9 1713
48.9 105.6 54.3 104.8 53.8 106.7 51.5 99.7 51.2 100
841.2 1727.1 881.1 1737.2 822.0 1723.3 895.8 1745.2 909.1 1813
(100 million yen)
1H Full-year FY 2009 FY 2010 FY 2011 FY 2012 FY 2013
1H Full-year 1H Full-year 1H Full-year 1H Full-year forecast
Automotive coatings
Trade-use paints
Industrial-use coatings
Other paints and coatings
Sub-total
Paint business
Fine Chemicals business
Total

35
Change in Consolidated Net Sales by Business Segment
Asia
46.5 113.0 75.4 156.3 73.9 143.8 84.5 179.1 111.7 224
14.9 31.6 18.6 36.0 18.8 34.4 21.8 42.7 27.6 56
14.6 33.4 21.6 41.3 21.7 40.9 21.2 41.8 26.0 52
35.7 82.4 42.8 89.0 34.2 77.1 44.5 76.9 39.4 93
111.7 260.4 158.4 322.6 148.6 296.2 172.0 340.5 204.7 425
9.4 22.6 14.3 28.0 14.4 27.8 14.3 30.2 20.8 44
121.1 283.0 172.7 350.6 163.0 324.0 186.3 370.7 225.5 469
1H Full-year FY 2009 FY 2010 FY 2011 FY 2012 FY 2013
1H Full-year 1H Full-year 1H Full-year 1H Full-year forecast
Automotive coatings
Trade-use paints
Industrial-use coatings
Other paints and coatings
Sub-total
Paint business
Fine Chemicals business
Total
(100 million yen)

36
Change in Consolidated Capital Expenditures, Depreciation, and R&D Expenses
Capital Expenditures 32.9 67.5 29.8 55.5 18.9 35.5 27.2 51.1 27.8 60
Depreciation 43.1 90.4 42.3 82.9 37.5 75.3 31.7 64.2 30.0 65
R&D Expenses 37.8 77.1 35.1 70.3 33.0 65.7 30.6 60.2 29.1 60
1H Full-year FY 2009 FY 2010 FY 2011 FY 2012 FY 2013
1H Full-year 1H Full-year 1H Full-year 1H Full-year forecast
(100 million yen)

37
Changes in Consolidated Cash Flows
Cash flows from operating activities 50.9 174.9 70.4 203.5 21.6 224.8 101.8 318.5 75.5
Cash flows from investing activities -49.1 -76.3 -42.0 -84.9 -14.0 -37.1 -26.2 -69.2 -29.2
Cash flows from financing activities 38.0 14.5 -84.9 -115.8 -85.4 -119.4 -153.8 -187.4 -171.4
1H Full-year FY 2009 FY 2010 FY 2011 FY 2012 FY 2013
1H Full-year 1H Full-year 1H Full-year 1H
(100 million yen)
38
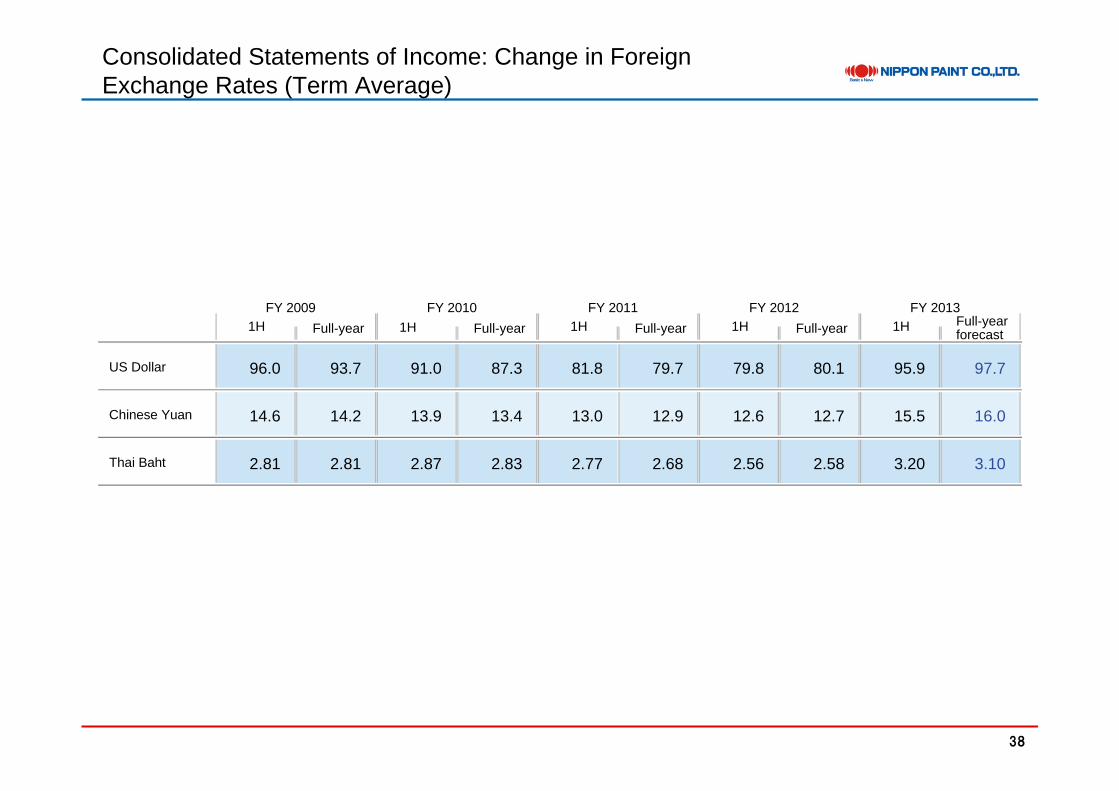
Consolidated Statements of Income: Change in Foreign Exchange Rates (Term Average)
US Dollar 96.0 93.7 91.0 87.3 81.8 79.7 79.8 80.1 95.9 97.7
Chinese Yuan 14.6 14.2 13.9 13.4 13.0 12.9 12.6 12.7 15.5 16.0
Thai Baht 2.81 2.81 2.87 2.83 2.77 2.68 2.56 2.58 3.20 3.10
1HFull-year1H Full-year 1H Full-year forecast
FY 2009 FY 2010 FY 2011 FY 2012 FY 2013Full-year 1H Full-year 1H
39
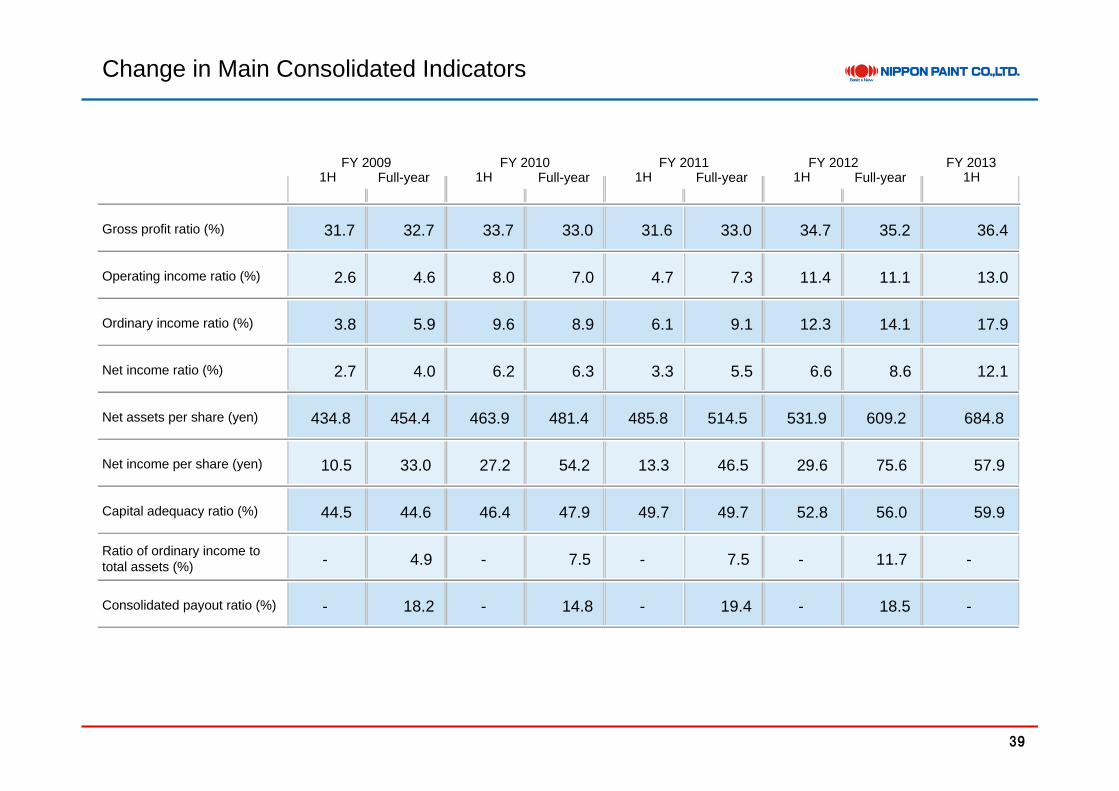
Change in Main Consolidated Indicators
Gross profit ratio (%) 31.7 32.7 33.7 33.0 31.6 33.0 34.7 35.2 36.4
Operating income ratio (%) 2.6 4.6 8.0 7.0 4.7 7.3 11.4 11.1 13.0
Ordinary income ratio (%) 3.8 5.9 9.6 8.9 6.1 9.1 12.3 14.1 17.9
Net income ratio (%) 2.7 4.0 6.2 6.3 3.3 5.5 6.6 8.6 12.1
Net assets per share (yen) 434.8 454.4 463.9 481.4 485.8 514.5 531.9 609.2 684.8
Net income per share (yen) 10.5 33.0 27.2 54.2 13.3 46.5 29.6 75.6 57.9
Capital adequacy ratio (%) 44.5 44.6 46.4 47.9 49.7 49.7 52.8 56.0 59.9
Ratio of ordinary income to total assets (%) - 4.9 - 7.5 - 7.5 - 11.7 -
Consolidated payout ratio (%) - 18.2 - 14.8 - 19.4 - 18.5 -
1H Full-yearFY 2009 FY 2010 FY 2011 FY 2012 FY 2013
1H Full-year 1H Full-year 1H Full-year 1H

40
Market Condition: Change in Japan-Produced Naphtha Prices
(Yen/kg)
FY 2010 49,700 42,700 45,100 52,400
FY 2011 59,000 54,900 51,700 54,100
FY 2012 60,600 49,800 55,800 63,800
FY 2013 65,500 63,900
* The figure for the 2nd half of FY 2013 is the Company’s estimate.
66,000
4Q1Q 2Q 3Q

41
Market Condition: Change in the Number of Automobiles Produced in Japan
(10,000 units)
FY 2010 478 421 899
FY 2011 390 537 927
FY 2012 490 465 955
FY 2013 474 490 964
* The figures for the 2nd half and full-year of FY 2013 are the Company’s estimates.
1H 2H Full-year
42
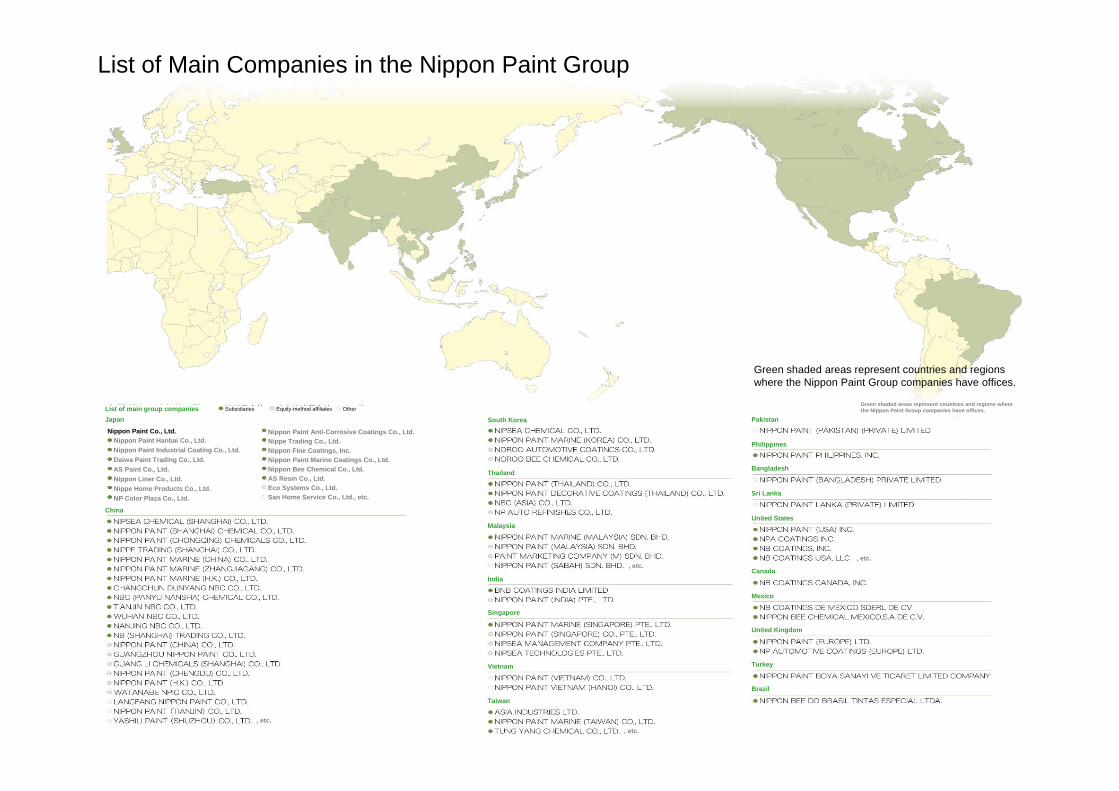
List of Main Companies in the Nippon Paint Group
Green shaded areas represent countries and regions where the Nippon Paint Group companies have offices.
List of main group companies Subsidiaries Equity-method affiliates Other
Japan
Nippon Paint Hanbai Co., Ltd.Nippon Paint Industrial Coating Co., Ltd.Daiwa Paint Trading Co., Ltd.AS Paint Co., Ltd.Nippon Liner Co., Ltd.Nippe Home Products Co., Ltd.NP Color Plaza Co., Ltd.
Nippon Paint Co., Ltd. Nippon Paint Anti-Corrosive Coatings Co., Ltd.Nippe Trading Co., Ltd.Nippon Fine Coatings, Inc.Nippon Paint Marine Coatings Co., Ltd.Nippon Bee Chemical Co., Ltd.AS Resin Co., Ltd.Eco Systems Co., Ltd.San Home Service Co., Ltd., etc.
China
, etc.
South Korea
Thailand
Malaysia
India
Singapore
Vietnam
Taiwan
, etc.
, etc., etc.
Pakistan
Philippines
Bangladesh
Sri Lanka
United States
Canada
Mexico
United Kingdom
Turkey
Brazil
Green shaded areas represent countries and regions where the Nippon Paint Group companies have offices.

43