analysts meeting q2 2012 - dassault systèmes · 2013-05-16 · increasing v6 footprint in q2 total...
TRANSCRIPT
1
3DS
.CO
M ©
Das
saul
t Sys
tèm
es
| Q2
2012
Ear
ning
s P
rese
ntat
ion
3D
S.C
OM
© D
assa
ult S
ystè
mes
| Q
2 20
12 E
arni
ngs
Pre
sent
atio
n
Analysts Meeting Q2 2012
Bernard Charles, President and CEO
Thibault de Tersant, Senior EVP and CFO

2
3DS
.CO
M ©
Das
saul
t Sys
tèm
es
| Q2
2012
Ear
ning
s P
rese
ntat
ion
Statements herein that are not historical facts but express expectations or objectives for the future, including but not limited to statements regarding the Company’s
non-IFRS financial performance objectives, are forward-looking statements.
Such forward-looking statements are based on Dassault Systèmes management's current views and assumptions and involve known and unknown risks and
uncertainties. Actual results or performances may differ materially from those in such statements due to a range of factors. If global economic and business
conditions continue to be volatile or deteriorate, the Company’s business results may not develop as currently anticipated and may decline below their earlier levels
for an extended period of time. Furthermore, due to factors affecting sales of the Company’s products and services, there may be a substantial time lag between
any change in global economic and business conditions and its impact on the Company’s business results.
In preparing such forward-looking statements, the Company has in particular assumed an average U.S. dollar to euro exchange rate of US$1.30 per €1.00 and an
average Japanese yen to euro exchange rate of JPY110 to €1.00 for the 2012 third quarter; for 2012, the Company has assumed an average U.S. dollar to euro
exchange rate of US$1.30 per €1.00 and an average Japanese yen to euro exchange rate of JPY107 to €1.00; however, currency values fluctuate, and the
Company’s results of operations may be significantly affected by changes in exchange rates. The Company’s actual results or performance may also be materially
negatively affected by changes in the current global economic context, difficulties or adverse changes affecting its partners or its relationships with its partners,
changes in exchange rates, new product developments, and technological changes; errors or defects in its products; growth in market share by its competitors; and
the realization of any risks related to the integration of any newly acquired company and internal reorganizations. Unfavorable changes in any of the above or other
factors described in the Company’s regulatory reports, including the 2011 Document de référence, which was filed with the French Autorité des marchés financiers
(AMF) on March 29, 2012, could materially affect the Company’s financial position or results of operations.
Forward Looking Information

3
3DS
.CO
M ©
Das
saul
t Sys
tèm
es
| Q2
2012
Ear
ning
s P
rese
ntat
ion
Readers are cautioned that the supplemental non-IFRS information presented in this press release is subject to inherent limitations. It is not based on any
comprehensive set of accounting rules or principles and should not be considered as a substitute for IFRS measurements. Also, the Company’s supplemental
non-IFRS financial information may not be comparable to similarly titled non-IFRS measures used by other companies. Further specific limitations for individual
non-IFRS measures, and the reasons for presenting non-IFRS financial information, are set forth in the Company’s annual report for the year ended December 31,
2011 included in the Company’s 2011 Document de référence filed with the AMF on March 29, 2012.
In the tables accompanying this press release the Company sets forth its supplemental non-IFRS figures for revenue, operating income, operating margin, net
income and diluted earnings per share, which exclude the effect of adjusting the carrying value of acquired companies’ deferred revenue, stock-based
compensation expense, the expenses for the amortization of acquired intangible assets, other income and expense, net, certain one-time items included in
financial revenue and other, net, and the income tax effect of the non-IFRS adjustments. The tables also set forth the most comparable IFRS financial measure
and reconciliations of this information with non-IFRS information.
When the Company believes it would be helpful for understanding trends in its business, the Company provides percentage increases or decreases in its revenue
(in both IFRS as well as non-IFRS) to eliminate the effect of changes in currency values, particularly the U.S. dollar and the Japanese yen, relative to the euro.
When trend information is expressed herein "in constant currencies", the results of the "prior" period have first been recalculated using the average exchange rates
of the comparable period in the current year, and then compared with the results of the comparable period in the current year.
Forward Looking Information
4
3DS
.CO
M ©
Das
saul
t Sys
tèm
es
| Q2
2012
Ear
ning
s P
rese
ntat
ion
Organic double-digit revenue growth
Growing interest for 3DEXPERIENCE platform
Awareness increasing with advertising campaigns
Successfully closing Gemcom Software acquisition
Updating 2012 objectives targeting now FY12 revenue ~ €2 billion
Q2 2012 Highlights
5
3DS
.CO
M ©
Das
saul
t Sys
tèm
es
| Q2
2012
Ear
ning
s P
rese
ntat
ion
1 Q2 2012 Business & Strategy Review
2 Q2 2012 Business Highlights
3 Q3 & FY12 Financial Objectives
4 Financial Information Appendix
Agenda
6
3DS
.CO
M ©
Das
saul
t Sys
tèm
es
| Q2
2012
Ear
ning
s P
rese
ntat
ion
1. Q2 2012 Performance
2. Advertising Campaigns
3. Gemcom Acquisition Closing
Q2 2012 Business & Strategy Review

7
3DS
.CO
M ©
Das
saul
t Sys
tèm
es
| Q2
2012
Ear
ning
s P
rese
ntat
ion
Q2 2012 Performance Non-IFRS*
* For a reconciliation to IFRS financial information, please refer to the tables in the Appendix.
Continuation of Q1 positive business
trends with larger proportion of new
rentals in Q2 compared to previous
quarters
Strong EPS growth driven by revenue
growth and margin expansion
€ millions Q2 12 YTD 12
Revenue 502.9 965.3
Growth +17% +15%
Growth ex FX +10% +10%
New Licenses Growth ex FX +9% +13%
Operating Margin 29.2% 29.2%
Operating Margin Growth +1.2pt +1.0pt
EPS (€) 0.76 1.47
EPS Growth +19% +15%

8
3DS
.CO
M ©
Das
saul
t Sys
tèm
es
| Q2
2012
Ear
ning
s P
rese
ntat
ion
Good quarter for both PLM and
SOLIDWORKS
SOLIDWORKS performance showing
continued dynamic for 3DS market
Revenue by Product Line Non-IFRS*
Q2 12 YTD 12
PLM +9% +9%
CATIA +8% +7%
ENOVIA +9% +13%
Other PLM SW +13% +12%
SOLIDWORKS +15% +14%
Total Software +11% +10%
Software Revenue Growth ex FX by Product Line
* For a reconciliation to IFRS financial information, please refer to the tables in the Appendix.
9
3DS
.CO
M ©
Das
saul
t Sys
tèm
es
| Q2
2012
Ear
ning
s P
rese
ntat
ion
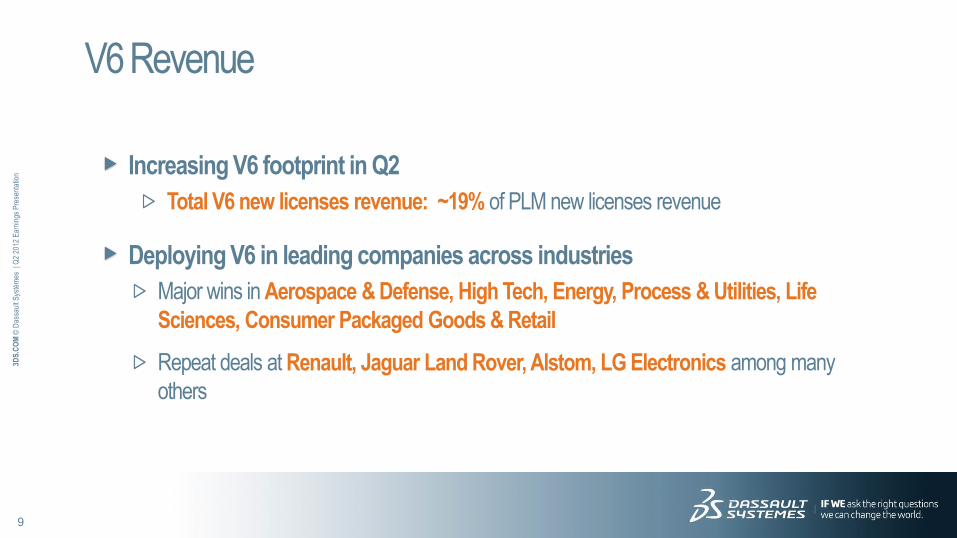
Increasing V6 footprint in Q2
Total V6 new licenses revenue: ~19% of PLM new licenses revenue
Deploying V6 in leading companies across industries
Major wins in Aerospace & Defense, High Tech, Energy, Process & Utilities, Life
Sciences, Consumer Packaged Goods & Retail
Repeat deals at Renault, Jaguar Land Rover, Alstom, LG Electronics among many
others
V6 Revenue
10
3DS
.CO
M ©
Das
saul
t Sys
tèm
es
| Q2
2012
Ear
ning
s P
rese
ntat
ion
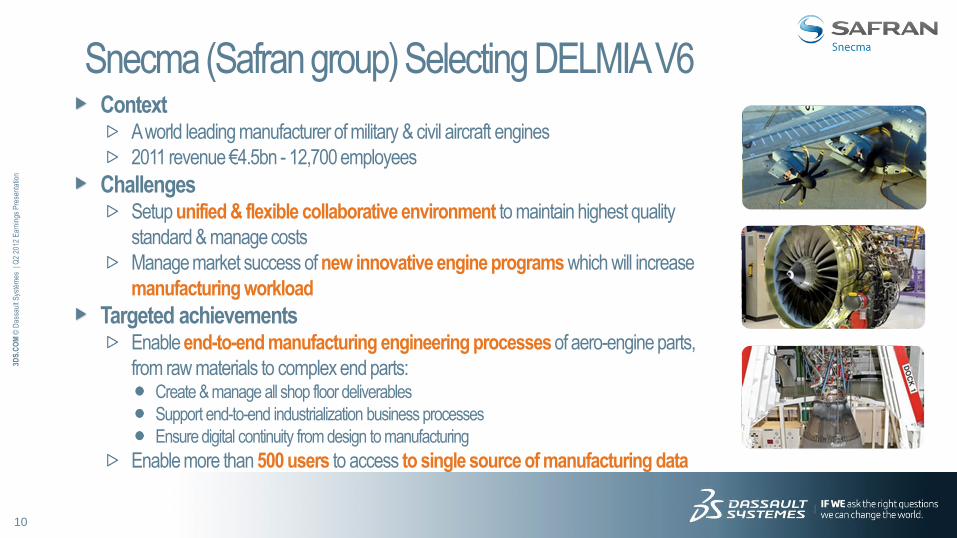
Context A world leading manufacturer of military & civil aircraft engines
2011 revenue €4.5bn - 12,700 employees
Challenges Setup unified & flexible collaborative environment to maintain highest quality
standard & manage costs
Manage market success of new innovative engine programs which will increase
manufacturing workload
Targeted achievements Enable end-to-end manufacturing engineering processes of aero-engine parts,
from raw materials to complex end parts: Create & manage all shop floor deliverables
Support end-to-end industrialization business processes
Ensure digital continuity from design to manufacturing
Enable more than 500 users to access to single source of manufacturing data
Snecma (Safran group) Selecting DELMIA V6

11
3DS
.CO
M ©
Das
saul
t Sys
tèm
es
| Q2
2012
Ear
ning
s P
rese
ntat
ion
Context US-based division of Fujitsu Limited of Japan (FY11 revenue: ~$50bn)
Leading optical solutions provider
Challenges Speed time to market
Gather customer requirements for increasingly complex products, develop solutions and test them on schedules that continue to accelerate
Achievements Selected 3DS Mechatronics Systems Design Experience built on ENOVIA V6 to integrate requirements and test case management processes
Replaced 13 applications – 11 more targeted
30-40% improvement in requirements management including traceability and reuse of requirements
Reduced significantly number of employees assigned to change management issues
Fujitsu Network Communications Selecting ENOVIA V6
“Our systems engineers are able to
spend more time doing requirements
analysis and engineering work” Peter Servi, Senior Manager, Enterprise PLM and
Engineering Applications, Fujitsu

12
3DS
.CO
M ©
Das
saul
t Sys
tèm
es
| Q2
2012
Ear
ning
s P
rese
ntat
ion
Context
Leading Steel Company
2011 revenue : 68B$ - 17,000 employees
Challenges
POSCO achieved 68B$ revenue in 2011 and plan to increase
it to 200B$ by 2020
Achievement
Introduced V6 with ENOVIA , DELMIA, 3DVIA and SIMULIA
Single 3D Database
Business Process Coverage
Provided Asset lifecycle management based on 3D data
Adopted Virtual Factory
POSCO Selecting V6

13
3DS
.CO
M ©
Das
saul
t Sys
tèm
es
| Q2
2012
Ear
ning
s P
rese
ntat
ion
Context World’s largest motorcycle manufacturer and one of the leading
automakers - Headquartered in Japan
2011 revenue: ~ $107bn
Challenges Speed time-to-market while maintaining high quality
Achievements
Selected SIMULIA for:
Selection and optimization in early design phases
Nonlinear simulations, vibration noise
Design iterations automation
Winning with SIMULIA at HONDA
Make critical design decisions and
achieve optimal designs without the
cost and timely process of building
physical prototypes

14
3DS
.CO
M ©
Das
saul
t Sys
tèm
es
| Q2
2012
Ear
ning
s P
rese
ntat
ion
1. Q2 2012 Performance
2. Advertising Campaigns
3. Gemcom Acquisition Closing
Q2 2012 Business & Strategy Review

15
3DS
.CO
M ©
Das
saul
t Sys
tèm
es
| Q2
2012
Ear
ning
s P
rese
ntat
ion
WHO
WHAT
HOW
Executives of 12 targeted Industries
Increase Awareness as The 3DEXPERIENCE Company
Advertising Campaign (TV, Press in geo, Trade, Online,
Airport, Local up-weight …)
Advertising Campaigns
2 waves of communication: May-June 2012 and Sept-Oct 2012

16
3DS
.CO
M ©
Das
saul
t Sys
tèm
es
| Q2
2012
Ear
ning
s P
rese
ntat
ion

17
3DS
.CO
M ©
Das
saul
t Sys
tèm
es
| Q2
2012
Ear
ning
s P
rese
ntat
ion

18
3DS
.CO
M ©
Das
saul
t Sys
tèm
es
| Q2
2012
Ear
ning
s P
rese
ntat
ion

19
3DS
.CO
M ©
Das
saul
t Sys
tèm
es
| Q2
2012
Ear
ning
s P
rese
ntat
ion
1. Q2 2012 Performance
2. Advertising Campaigns
3. Gemcom Acquisition Closing
Q2 2012 Business & Strategy Review

20
3DS
.CO
M ©
Das
saul
t Sys
tèm
es
| Q2
2012
Ear
ning
s P
rese
ntat
ion
Successfully completing Gemcom acquisition on July 11th, 2012
Closing transaction on time
Paid €292m in cash*
A confirmed solid situation for 2012
FY11 revenue: ~ €65m
Expecting FY12 revenue to be up ~15% YoY
Estimated positive impact on 2012 non-IFRS EPS of ~ +2%
* less assumed liabilities
Successfully Closing Gemcom Acquisition
21
3DS
.CO
M ©
Das
saul
t Sys
tèm
es
| Q2
2012
Ear
ning
s P
rese
ntat
ion
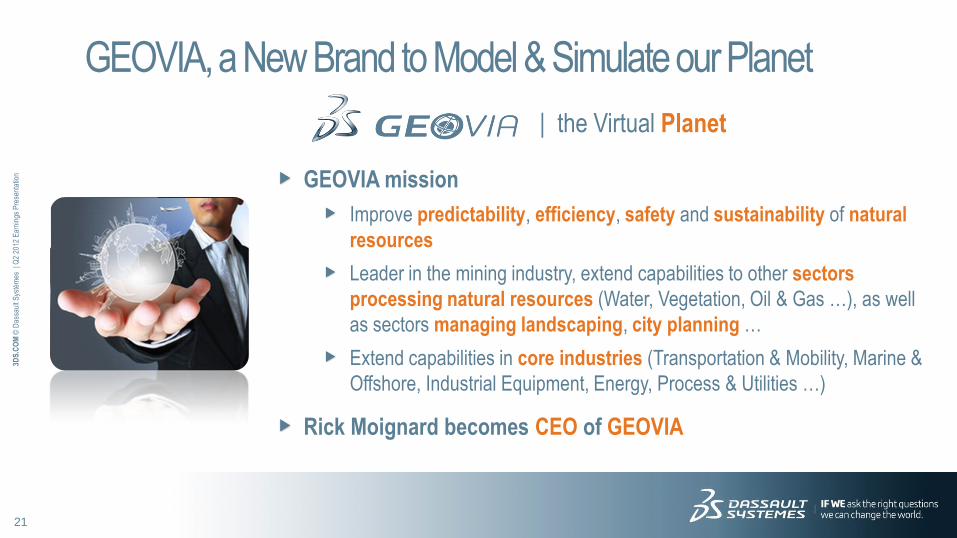
GEOVIA, a New Brand to Model & Simulate our Planet
| the Virtual Planet
GEOVIA mission
Improve predictability, efficiency, safety and sustainability of natural
resources
Leader in the mining industry, extend capabilities to other sectors
processing natural resources (Water, Vegetation, Oil & Gas …), as well
as sectors managing landscaping, city planning …
Extend capabilities in core industries (Transportation & Mobility, Marine &
Offshore, Industrial Equipment, Energy, Process & Utilities …)
Rick Moignard becomes CEO of GEOVIA

22
3DS
.CO
M ©
Das
saul
t Sys
tèm
es
| Q2
2012
Ear
ning
s P
rese
ntat
ion
1 Q2 2012 Business & Strategy Review
2 Q2 2012 Business Highlights
3 Q3 & FY12 Financial Objectives
4 Financial Information Appendix
Agenda
23
3DS
.CO
M ©
Das
saul
t Sys
tèm
es
| Q2
2012
Ear
ning
s P
rese
ntat
ion
209.4
248.2
110.4127.9
-
50m€
100m€
150m€
200m€
250m€
300m€
YTD11 YTD12 2Q11 2Q12
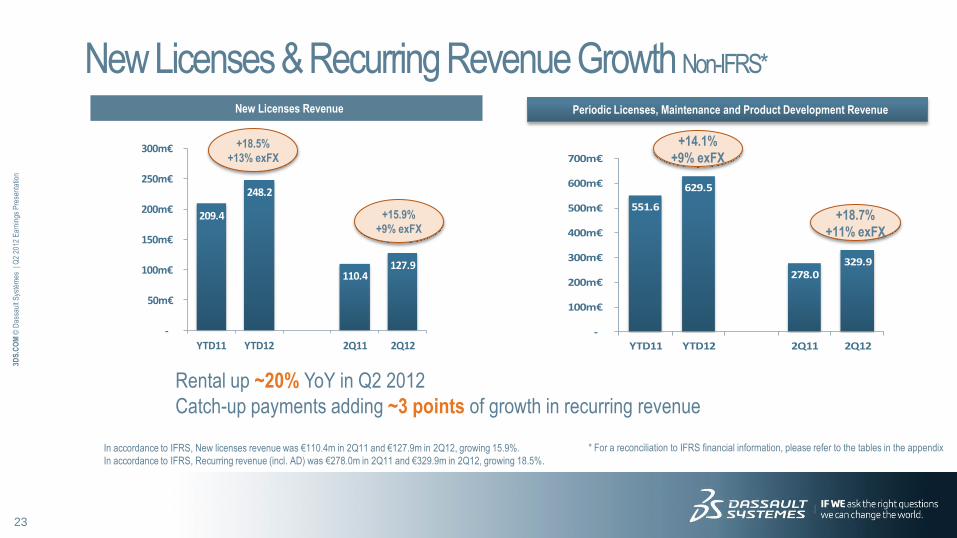
New Licenses & Recurring Revenue Growth Non-IFRS*
New Licenses Revenue
Rental up ~20% YoY in Q2 2012
Catch-up payments adding ~3 points of growth in recurring revenue
Periodic Licenses, Maintenance and Product Development Revenue
* For a reconciliation to IFRS financial information, please refer to the tables in the appendix
+15.9%
+9% exFX
+18.5%
+13% exFX
551.6
629.5
278.0329.9
-
100m€
200m€
300m€
400m€
500m€
600m€
700m€
YTD11 YTD12 2Q11 2Q12
+14.1%
+9% exFX
+18.7%
+11% exFX
In accordance to IFRS, New licenses revenue was €110.4m in 2Q11 and €127.9m in 2Q12, growing 15.9%.
In accordance to IFRS, Recurring revenue (incl. AD) was €278.0m in 2Q11 and €329.9m in 2Q12, growing 18.5%.

24
3DS
.CO
M ©
Das
saul
t Sys
tèm
es
| Q2
2012
Ear
ning
s P
rese
ntat
ion
Increased sales cycle in the Americas
Continued healthy growth in Europe
Korea performing well - Continued
improvement in Japan
Revenue by Region Non-IFRS*
Q2 12 YTD 12
Americas +0% +4%
Europe +19% +14%
Asia +8% +11%
Total Revenue +10% +10%
Revenue Growth ex FX by Region
* For a reconciliation to IFRS financial information, please refer to the tables in the appendix

25
3DS
.CO
M ©
Das
saul
t Sys
tèm
es
| Q2
2012
Ear
ning
s P
rese
ntat
ion
Service Revenue & Margin Evolution Non-IFRS*
Service Revenue
* For a reconciliation to IFRS financial information, please refer to the tables in the Appendix.
Service Gross Margin (1) (10.6%) 2.1% (15.7%) 5.1%
Improved service margin
77.5
87.6
40.245.1
-
10m€
20m€
30m€
40m€
50m€
60m€
70m€
80m€
90m€
100m€
YTD11 YTD12 2Q11 2Q12
+12.2%
+6% exFX
+13.0%
+8% exFX

26
3DS
.CO
M ©
Das
saul
t Sys
tèm
es
| Q2
2012
Ear
ning
s P
rese
ntat
ion
1.28
1.47
0.640.76
-
0.20€
0.40€
0.60€
0.80€
1.00€
1.20€
1.40€
1.60€
YTD11 YTD12 2Q11 2Q12
Operating Income 28.2% 29.2% 28.0% 29.2%
236.3
282.3
120.2
147.0
-
50m€
100m€
150m€
200m€
250m€
300m€
YTD11 YTD12 2Q11 2Q12
+19.5%
Operating Income Evolution & EPS Non-IFRS*
Operating Income EPS
Operating margin expansion reflecting essentially operating leverage (favorable impact of currencies 0.5 pt)
Strong EPS growth * For a reconciliation to IFRS financial information, please refer to the tables in the appendix
+22.3% +18.8%
+14.8%

27
3DS
.CO
M ©
Das
saul
t Sys
tèm
es
| Q2
2012
Ear
ning
s P
rese
ntat
ion
+85+26
+77
-9+41
-87
+39
1,386
1,294
-8
-72
Net Financial Position Q1 2012
Net Income Non cash P&L items
Change in working capital
Capital expenditure
Acquisitions and other investing
Share Repurchase DS stock option exercise
Cash dividend paid FX Impact Net Financial Position Q2 2012
Change in Net Financial Position – 2Q12 IFRS
Note: Net financial position is defined as Cash and Cash Equivalents + Short Term Investments – Long-term debt
The Q1 and Q2 2012 net financial position are also net of the €200 million financial debt which has been reclassified from long-term to short-term debt as of December 31, 2011
Operating cash flow: +€188m, compared to +€148m in 2Q11

28
3DS
.CO
M ©
Das
saul
t Sys
tèm
es
| Q2
2012
Ear
ning
s P
rese
ntat
ion
1 Q2 2012 Business & Strategy Review
2 Q2 2012 Business Highlights
3 Q3 & FY12 Financial Objectives
4 Financial Information Appendix
Agenda

29
3DS
.CO
M ©
Das
saul
t Sys
tèm
es
| Q2
2012
Ear
ning
s P
rese
ntat
ion
Upgrading 2012 financial objectives for full Q2 revenue over-performance
and better Q3 than originally anticipated
Including Gemcom acquisition
Excluding Transcat PLM spin-off
Factoring tax items rise for ~€7m (social charges, local charges, income tax)
Updating currency rate assumptions for the 2 remaining quarters from US$1.36 per €1.00 to US$1.30 FY12 : US$1.30
from JPY115.0 per €1.00 to JPY 110.0 FY12: JPY107.0
Upgrading FY 2012 Financial Objectives

30
3DS
.CO
M ©
Das
saul
t Sys
tèm
es
| Q2
2012
Ear
ning
s P
rese
ntat
ion
2.00
2.25
2.50
2.75
3.00
3.25
3.50
Initial Obj.
FX impact
Activity Tax rate& shares
New Obj. Old
perimeter
Gemcom Transcat New Obj. New
perimeter
3.10 - 3.20
3.15 - 3.25
3.20 - 3.30
+0.09
-0.05 -0.01
+0.01 +0.06
1,700
1,750
1,800
1,850
1,900
1,950
2,000
2,050
2,100
Initial Obj. FX impact Activity Q2
ActivityH2
New Obj. Old
perimeter
Gemcom Transcat New Obj. New
perimeter
1,905 - 1,935
1,965 - 1,985
1,990 - 2,010
+42+8
-10+5
+35
Objectives change: from April to July Non-IFRS
Mid-range 1,920 2,000
Revenue (€m) EPS (€)
Mid-range 3.15 3.25
ExFX Growth +8-9% Growth +6-10% +6-8% +10-13%

31
3DS
.CO
M ©
Das
saul
t Sys
tèm
es
| Q2
2012
Ear
ning
s P
rese
ntat
ion
Non-IFRS
Proposed Objectives
€ millions 3Q 2012 FY 2012
Revenue 480-490 1,990-2,010
Growth +11-13% +12-13%
Growth ex FX +8-10% +8-9%
Operating Margin 31-32% ~31%
Operating Margin Growth ~flat ~+1pt
EPS (€) 0.78-0.82 3.20-3.30
EPS Growth +1-6% +10-13%
€/$ rates 1.30 1.30
€/¥ rates (before hedging) 110.0 107.0

32
3DS
.CO
M ©
Das
saul
t Sys
tèm
es
| Q2
2012
Ear
ning
s P
rese
ntat
ion
1 Q2 2012 Business & Strategy Review
2 Q2 2012 Business Highlights
3 Q3 & FY12 Financial Objectives
4 Financial Information Appendix
Agenda
33
3DS
.CO
M ©
Das
saul
t Sys
tèm
es
| Q2
2012
Ear
ning
s P
rese
ntat
ion
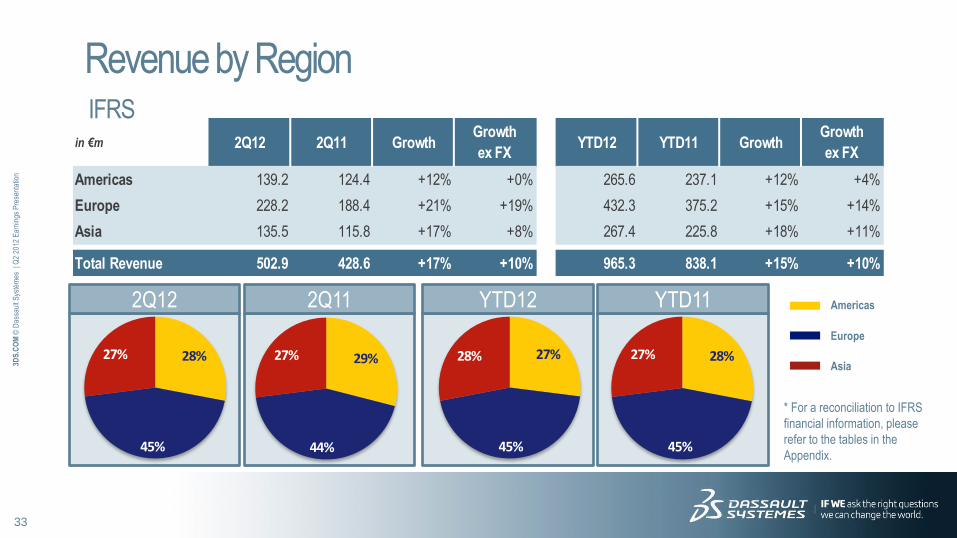
Revenue by Region IFRS
* For a reconciliation to IFRS
financial information, please
refer to the tables in the
Appendix.
Americas
Europe
Asia
2Q11 YTD11 2Q12 YTD12
in €m 2Q12 2Q11 GrowthGrowth
ex FXYTD12 YTD11 Growth
Growth
ex FX
Americas 139.2 124.4 +12% +0% 265.6 237.1 +12% +4%
Europe 228.2 188.4 +21% +19% 432.3 375.2 +15% +14%
Asia 135.5 115.8 +17% +8% 267.4 225.8 +18% +11%
Total Revenue 502.9 428.6 +17% +10% 965.3 838.1 +15% +10%
28%
45%
27% 29%
44%
27% 27%
45%
28% 28%
45%
27%

34
3DS
.CO
M ©
Das
saul
t Sys
tèm
es
| Q2
2012
Ear
ning
s P
rese
ntat
ion
Revenue by Region Non-IFRS*
* For a reconciliation to IFRS
financial information, please
refer to the tables in the
Appendix.
Americas
Europe
Asia
2Q11 YTD11 2Q12 YTD12
in €m 2Q12 2Q11 GrowthGrowth
ex FXYTD12 YTD11 Growth
Growth
ex FX
Americas 139.2 124.4 +12% +0% 265.6 237.2 +12% +4%
Europe 228.2 188.4 +21% +19% 432.3 375.2 +15% +14%
Asia 135.5 115.8 +17% +8% 267.4 226.1 +18% +11%
Total Revenue 502.9 428.6 +17% +10% 965.3 838.5 +15% +10%
28%
45%
27% 29%
44%
27% 27%
45%
28% 28%
45%
27%

35
3DS
.CO
M ©
Das
saul
t Sys
tèm
es
| Q2
2012
Ear
ning
s P
rese
ntat
ion
Revenue by Product Line IFRS
2Q11 YTD11 2Q12 YTD12 CATIA SW
ENOVIA SW
Other PLM SW
SOLIDWORKS SW
Services
in €m 2Q12 2Q11 GrowthGrowth
ex FXYTD12 YTD11 Growth
Growth
ex FX
PLM SW 356.3 307.0 +16% +9% 677.8 595.1 +14% +9%
CATIA SW 208.5 183.1 +14% +8% 398.4 359.7 +11% +7%
ENOVIA SW 65.8 55.9 +18% +9% 123.9 103.9 +19% +13%
Other PLM SW 82.0 68.0 +21% +13% 155.5 131.5 +18% +13%
SOLIDWORKS SW 101.5 81.4 +25% +15% 199.9 165.5 +21% +14%
Services 45.1 40.2 +12% +6% 87.6 77.5 +13% +8%
Total Revenue 502.9 428.6 +17% +10% 965.3 838.1 +15% +10%
42%
13%
16%
20%
9%
43%
13%
16%
19%
9%
41%
13%16%
21%
9%
43%
12%
16%
20%
9%

36
3DS
.CO
M ©
Das
saul
t Sys
tèm
es
| Q2
2012
Ear
ning
s P
rese
ntat
ion
in €m 2Q12 2Q11 GrowthGrowth
ex FXYTD12 YTD11 Growth
Growth
ex FX
PLM SW 356.3 307.0 +16% +9% 677.8 595.5 +14% +9%
CATIA SW 208.5 183.1 +14% +8% 398.4 360.1 +11% +7%
ENOVIA SW 65.8 55.9 +18% +9% 123.9 103.9 +19% +13%
Other PLM SW 82.0 68.0 +21% +13% 155.5 131.5 +18% +12%
SOLIDWORKS SW 101.5 81.4 +25% +15% 199.9 165.5 +21% +14%
Services 45.1 40.2 +12% +6% 87.6 77.5 +13% +8%
Total Revenue 502.9 428.6 +17% +10% 965.3 838.5 +15% +10%
Revenue by Product Line Non-IFRS*
CATIA SW
ENOVIA SW
Other PLM SW
SOLIDWORKS SW
Services
* For a reconciliation to IFRS
financial information, please
refer to the tables in the
Appendix.
2Q11 YTD11 2Q12 YTD12
42%
13%
16%
20%
9%
43%
13%
16%
19%
9%
41%
13%16%
21%
9%
43%
12%
16%
20%
9%

37
3DS
.CO
M ©
Das
saul
t Sys
tèm
es
| Q2
2012
Ear
ning
s P
rese
ntat
ion
As reported
exFX
24,021
27,252
11,89313,844
0
5,000
10,000
15,000
20,000
25,000
30,000
YTD11 YTD12 2Q11 2Q12
SOLIDWORKS Dynamic
Note: assuming a 45% average VAR margin.
Number of Units ASP (€)
+5.1%
-3% exFX
+16%
+13%
€ 5,359 € 5,578 € 5,274 € 5,542
€ -
€ 1,000
€ 2,000
€ 3,000
€ 4,000
€ 5,000
€ 6,000
YTD11 YTD12 2Q11 2Q12
+4.1%
-2% exFX

38
3DS
.CO
M ©
Das
saul
t Sys
tèm
es
| Q2
2012
Ear
ning
s P
rese
ntat
ion
-
100m€
200m€
300m€
400m€
500m€
600m€
700m€
800m€
900m€
1,000m€
YTD11 YTD12 2Q11 2Q12
Software Reccurring Revenue Evolution Non-IFRS*
% of Software Revenue
Recurring Software Revenue growth exFX of +11% in 2Q12 YoY
NB: Recurring software revenue excludes product development
Reccuring
Non-reccuring
29%
72%
* For a reconciliation to IFRS financial information, please refer to the tables in the Appendix.
28%
71%
29% 71%
29%
72%
28%
39
3DS
.CO
M ©
Das
saul
t Sys
tèm
es
| Q2
2012
Ear
ning
s P
rese
ntat
ion
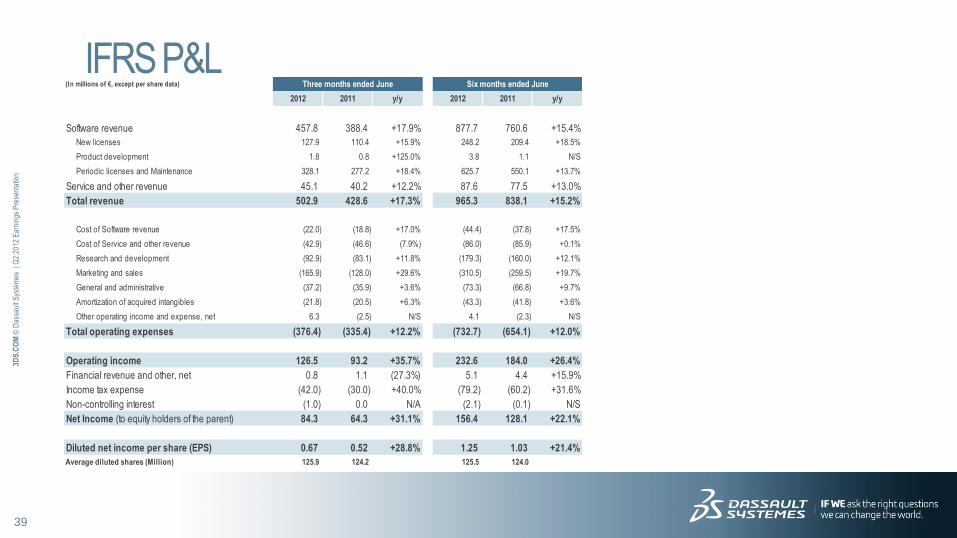
IFRS P&L (In millions of €, except per share data) Three months ended June Six months ended June
2012 2011 y/y 2012 2011 y/y
Software revenue 457.8 388.4 +17.9% 877.7 760.6 +15.4%
New licenses 127.9 110.4 +15.9% 248.2 209.4 +18.5%
Product development 1.8 0.8 +125.0% 3.8 1.1 N/S
Periodic licenses and Maintenance 328.1 277.2 +18.4% 625.7 550.1 +13.7%
Service and other revenue 45.1 40.2 +12.2% 87.6 77.5 +13.0%
Total revenue 502.9 428.6 +17.3% 965.3 838.1 +15.2%
Cost of Software revenue (22.0) (18.8) +17.0% (44.4) (37.8) +17.5%
Cost of Service and other revenue (42.9) (46.6) (7.9%) (86.0) (85.9) +0.1%
Research and development (92.9) (83.1) +11.8% (179.3) (160.0) +12.1%
Marketing and sales (165.9) (128.0) +29.6% (310.5) (259.5) +19.7%
General and administrative (37.2) (35.9) +3.6% (73.3) (66.8) +9.7%
Amortization of acquired intangibles (21.8) (20.5) +6.3% (43.3) (41.8) +3.6%
Other operating income and expense, net 6.3 (2.5) N/S 4.1 (2.3) N/S
Total operating expenses (376.4) (335.4) +12.2% (732.7) (654.1) +12.0%
Operating income 126.5 93.2 +35.7% 232.6 184.0 +26.4%
Financial revenue and other, net 0.8 1.1 (27.3%) 5.1 4.4 +15.9%
Income tax expense (42.0) (30.0) +40.0% (79.2) (60.2) +31.6%
Non-controlling interest (1.0) 0.0 N/A (2.1) (0.1) N/S
Net Income (to equity holders of the parent) 84.3 64.3 +31.1% 156.4 128.1 +22.1%
Diluted net income per share (EPS) 0.67 0.52 +28.8% 1.25 1.03 +21.4%
Average diluted shares (Million) 125.9 124.2 125.5 124.0
40
3DS
.CO
M ©
Das
saul
t Sys
tèm
es
| Q2
2012
Ear
ning
s P
rese
ntat
ion
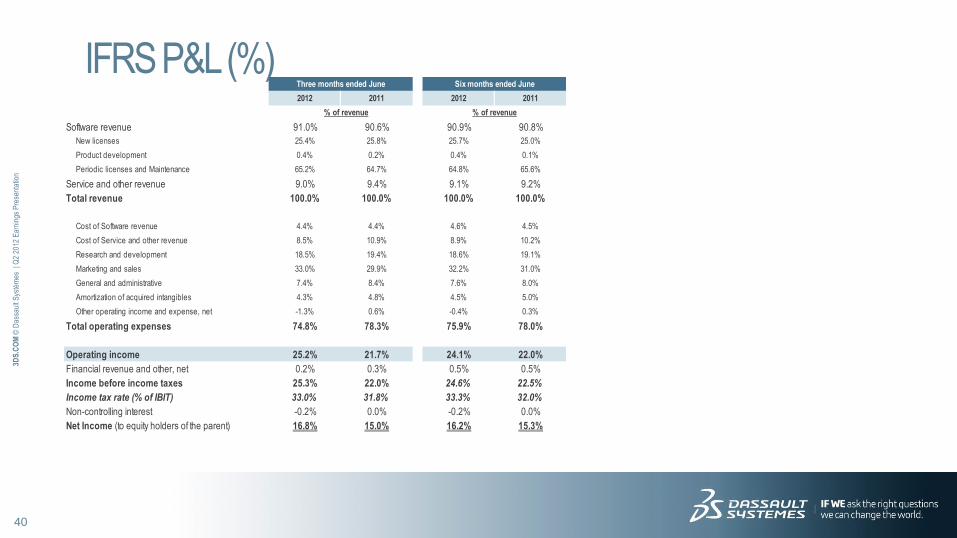
IFRS P&L (%) Three months ended June Six months ended June
2012 2011 2012 2011
% of revenue % of revenue
Software revenue 91.0% 90.6% 90.9% 90.8%
New licenses 25.4% 25.8% 25.7% 25.0%
Product development 0.4% 0.2% 0.4% 0.1%
Periodic licenses and Maintenance 65.2% 64.7% 64.8% 65.6%
Service and other revenue 9.0% 9.4% 9.1% 9.2%
Total revenue 100.0% 100.0% 100.0% 100.0%
Cost of Software revenue 4.4% 4.4% 4.6% 4.5%
Cost of Service and other revenue 8.5% 10.9% 8.9% 10.2%
Research and development 18.5% 19.4% 18.6% 19.1%
Marketing and sales 33.0% 29.9% 32.2% 31.0%
General and administrative 7.4% 8.4% 7.6% 8.0%
Amortization of acquired intangibles 4.3% 4.8% 4.5% 5.0%
Other operating income and expense, net -1.3% 0.6% -0.4% 0.3%
Total operating expenses 74.8% 78.3% 75.9% 78.0%
Operating income 25.2% 21.7% 24.1% 22.0%
Financial revenue and other, net 0.2% 0.3% 0.5% 0.5%
Income before income taxes 25.3% 22.0% 24.6% 22.5%
Income tax rate (% of IBIT) 33.0% 31.8% 33.3% 32.0%
Non-controlling interest -0.2% 0.0% -0.2% 0.0%
Net Income (to equity holders of the parent) 16.8% 15.0% 16.2% 15.3%

41
3DS
.CO
M ©
Das
saul
t Sys
tèm
es
| Q2
2012
Ear
ning
s P
rese
ntat
ion
Non-IFRS P&L (In millions of €, except per share data) Three months ended June Six months ended June
2012 2011 y/y 2012 2011 y/y
Software revenue 457.8 388.4 +17.9% 877.7 761.0 +15.3%
New licenses 127.9 110.4 +15.9% 248.2 209.4 +18.5%
Product development 1.8 0.8 +125.0% 3.8 1.1 N/S
Periodic licenses and Maintenance 328.1 277.2 +18.4% 625.7 550.5 +13.7%
Service and other revenue 45.1 40.2 +12.2% 87.6 77.5 +13.0%
Total revenue 502.9 428.6 +17.3% 965.3 838.5 +15.1%
Cost of Software revenue (22.0) (18.7) +17.6% (44.3) (37.7) +17.5%
Cost of Service and other revenue (42.8) (46.5) (8.0%) (85.8) (85.7) +0.1%
Research and development (90.5) (81.2) +11.5% (174.3) (156.3) +11.5%
Marketing and sales (164.6) (127.0) +29.6% (307.8) (257.5) +19.5%
General and administrative (36.0) (35.0) +2.9% (70.8) (65.0) +8.9%
Total operating expenses (355.9) (308.4) +15.4% (683.0) (602.2) +13.4%
Operating income 147.0 120.2 +22.3% 282.3 236.3 +19.5%
Financial revenue and other, net 1.0 (0.6) N/S 2.7 (0.6) N/S
Income before income taxes 148.0 119.6 +23.7% 285.0 235.7 +20.9%
Income tax expense (51.5) (39.9) +29.1% (98.5) (77.2) +27.6%
Non-controlling interest (1.0) 0.0 N/A (2.1) (0.1) N/S
Net Income (to equity holders of the parent) 95.5 79.7 +19.8% 184.4 158.4 +16.4%
Diluted net income per share (EPS) 0.76 0.64 +18.8% 1.47 1.28 +14.8%
Average diluted shares (Million) 125.9 124.2 125.5 124.0
42
3DS
.CO
M ©
Das
saul
t Sys
tèm
es
| Q2
2012
Ear
ning
s P
rese
ntat
ion
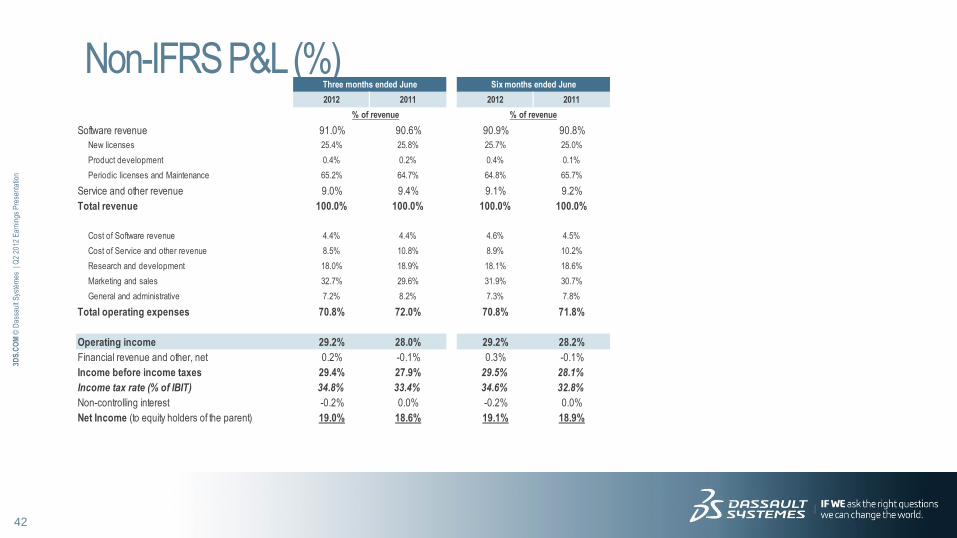
Non-IFRS P&L (%) Three months ended June Six months ended June
2012 2011 2012 2011
% of revenue % of revenue
Software revenue 91.0% 90.6% 90.9% 90.8%
New licenses 25.4% 25.8% 25.7% 25.0%
Product development 0.4% 0.2% 0.4% 0.1%
Periodic licenses and Maintenance 65.2% 64.7% 64.8% 65.7%
Service and other revenue 9.0% 9.4% 9.1% 9.2%
Total revenue 100.0% 100.0% 100.0% 100.0%
Cost of Software revenue 4.4% 4.4% 4.6% 4.5%
Cost of Service and other revenue 8.5% 10.8% 8.9% 10.2%
Research and development 18.0% 18.9% 18.1% 18.6%
Marketing and sales 32.7% 29.6% 31.9% 30.7%
General and administrative 7.2% 8.2% 7.3% 7.8%
Total operating expenses 70.8% 72.0% 70.8% 71.8%
Operating income 29.2% 28.0% 29.2% 28.2%
Financial revenue and other, net 0.2% -0.1% 0.3% -0.1%
Income before income taxes 29.4% 27.9% 29.5% 28.1%
Income tax rate (% of IBIT) 34.8% 33.4% 34.6% 32.8%
Non-controlling interest -0.2% 0.0% -0.2% 0.0%
Net Income (to equity holders of the parent) 19.0% 18.6% 19.1% 18.9%

43
3DS
.CO
M ©
Das
saul
t Sys
tèm
es
| Q2
2012
Ear
ning
s P
rese
ntat
ion
IFRS – Non-IFRS Reconciliation – 2Q12 Revenue and Gross Margin
1. In the reconciliation schedule herewith, (i) all adjustments to IFRS
revenue data reflect the exclusion of the deferred revenue adjustment
of acquired companies.
2. The non-IFRS percentage increase (decrease) compares non-IFRS
measures for the two different periods. In the event there is a non-
IFRS adjustment to the relevant measure for only one of the periods
under comparison, the non-IFRS increase (decrease) compares the
non-IFRS measure to the relevant IFRS measure.
* No amortization of acquired intangibles is included in Software Gross
margin calculation
(€ million, except % and per share data)
2012 IFRSAdjustment
(1)
2012
non-IFRS2011 IFRS
Adjustment
(1)
2011
non-IFRSIFRS Non-IFRS (2)
TOTAL REVENUE 502.9 428.6 +17.3%
Total Revenue breakdown by activity
Software revenue 457.8 388.4 +17.9%
New Licenses revenue 127.9 110.4 +15.9%
Product Development 1.8 0.8
Periodic and Maintenance revenue 328.1 277.2 +18.4%
Recurring portion of Software revenue 72% 71%
Service and other revenue 45.1 40.2 +12.2%
Total Revenue breakdown by segment
PLM SW revenue 356.3 307.0 +16.1%
of which CATIA SW revenue 208.5 183.1 +13.9%
of which ENOVIA SW revenue 65.8 55.9 +17.7%
SOLIDWORKS revenue 101.5 81.4 +24.7%
Service and other revenue 45.1 40.2 +12.2%
Total Revenue breakdown by geography
Americas revenue 139.2 124.4 +11.9%
Europe revenue 228.2 188.4 +21.1%
Asia revenue 135.5 115.8 +17.0%
Gross Margin
Cost of Software revenue (22.0) (18.8) 0.1 (18.7) +17.0% +17.6%
Software Gross margin* 95.2% 95.2% 95.2%
Cost of Service and other revenue (42.9) 0.1 (42.8) (46.6) 0.1 (46.5) (7.9% ) (8.0% )
Service Gross margin 4.9% 5.1% (15.9%) (15.7% )
Increase (Decrease)Three months ended June 30,

44
3DS
.CO
M ©
Das
saul
t Sys
tèm
es
| Q2
2012
Ear
ning
s P
rese
ntat
ion
IFRS – Non-IFRS Reconciliation – 2Q12 Expenses & Earnings
1. In the reconciliation schedule herewith, (i) adjustments to
IFRS operating expenses data reflect the exclusion of the
amortization of acquired intangibles, share based
compensation expense, and other operating income and
expense, (iii) adjustments to IFRS financial revenue and
other, net reflect the exclusion of certain one-time financial
gains and losses in 2011 and 2012, and (iv) all
adjustments to IFRS income data reflect the combined
effect of these adjustments, plus with respect to net
income and diluted net income per share, the income tax
effect of the non IFRS adjustments.
2. The non-IFRS percentage increase (decrease) compares
non-IFRS measures for the two different periods. In the
event there is a non-IFRS adjustment to the relevant
measure for only one of the periods under comparison, the
non-IFRS increase (decrease) compares the non-IFRS
measure to the relevant IFRS measure.
3. Based on a weighted average of 125.9 million diluted
shares for Q2 2012 and 124.2 million diluted shares for Q2
2011.
(€ million, except % and per share data)
2012 IFRSAdjustment
(1)
2012
non-IFRS2011 IFRS
Adjustment
(1)
2011
non-IFRSIFRS Non-IFRS (2)
Total Operating Expenses (376.4) 20.5 (355.9) (335.4) 27.0 (308.4) +12.2% +15.4%
Stock-based compensation expense (5.0) 5.0 - (4.0) 4.0 - - -
Amortization of acquired intangibles (21.8) 21.8 - (20.5) 20.5 - - -
Other operating income and expense, net 6.3 (6.3) - (2.5) 2.5 - - -
Operating Income 126.5 20.5 147.0 93.2 27.0 120.2 +35.7% +22.3%
Operating Margin 25.2% 29.2% 21.7% 28.0%
Financial revenue & other, net 0.8 0.2 1.0 1.1 (1.7) (0.6) (27.3%) (266.7%)
Income tax expense (42.0) (9.5) (51.5) (30.0) (9.9) (39.9) +40.0% +29.1%
Non-controlling interest impact (1.0) 0.0 (1.0) 0.0 -
Net Income 84.3 11.2 95.5 64.3 15.4 79.7 +31.1% +19.8%
Diluted net income per share, in € (3) 0.67 0.09 0.76 0.52 0.12 0.64 +28.8% +18.8%
(€ million)
Cost of rev enue (64.9) 0.1 (64.8) (65.4) 0.2 (65.2)
Research and dev elopment (92.9) 2.4 (90.5) (83.1) 1.9 (81.2)
Marketing and sales (165.9) 1.3 (164.6) (128.0) 1.0 (127.0)
General and administrativ e (37.2) 1.2 (36.0) (35.9) 0.9 (35.0)
Total stock-based compensation expense 5.0 4.0
2011 IFRS2011
non-IFRS
2012
non-IFRS
Increase (Decrease)Three months ended June 30,
Adjust.
Three months ended June 30,
2012 IFRS Adjust.

45
3DS
.CO
M ©
Das
saul
t Sys
tèm
es
| Q2
2012
Ear
ning
s P
rese
ntat
ion
IFRS – Non-IFRS Reconciliation – YTD12 Revenue and Gross Margin
1. In the reconciliation schedule herewith, (i) all adjustments to IFRS
revenue data reflect the exclusion of the deferred revenue adjustment
of acquired companies.
2. The non-IFRS percentage increase (decrease) compares non-IFRS
measures for the two different periods. In the event there is a non-
IFRS adjustment to the relevant measure for only one of the periods
under comparison, the non-IFRS increase (decrease) compares the
non-IFRS measure to the relevant IFRS measure.
* No amortization of acquired intangibles is included in Software Gross
margin calculation
(€ million, except % and per share data)
2012 IFRSAdjustment
(1)
2012
non-IFRS2011 IFRS
Adjustment
(1)
2011
non-IFRSIFRS Non-IFRS (2)
TOTAL REVENUE 965.3 838.1 0.4 838.5 +15.2% +15.1%
Total Revenue breakdown by activity
Software revenue 877.7 760.6 0.4 761.0 +15.4% +15.3%
New Licenses revenue 248.2 209.4 +18.5%
Product Development 3.8 1.1
Periodic and Maintenance revenue 625.7 550.1 0.4 550.5 +13.7% +13.7%
Recurring portion of Software revenue 71% 72% 72%
Service and other revenue 87.6 77.5 +13.0%
Total Revenue breakdown by segment
PLM SW revenue 677.8 595.1 0.4 595.5 +13.9% +13.8%
of which CATIA SW revenue 398.4 359.7 0.4 360.1 +10.8% +10.6%
of which ENOVIA SW revenue 123.9 103.9 +19.2%
SOLIDWORKS revenue 199.9 165.5 +20.8%
Service and other revenue 87.6 77.5 +13.0%
Total Revenue breakdown by geography
Americas revenue 265.6 237.1 0.1 237.2 +12.0% +12.0%
Europe revenue 432.3 375.2 +15.2%
Asia revenue 267.4 225.8 0.3 226.1 +18.4% +18.3%
Gross Margin
Cost of Software revenue (44.4) 0.1 (44.3) (37.8) 0.1 (37.7) +17.5% +17.5%
Software Gross margin* 94.9% 95.0% 95.0% 95.0%
Cost of Service and other revenue (86.0) 0.2 (85.8) (85.9) 0.2 (85.7) +0.1% +0.1%
Service Gross margin 1.8% 2.1% (10.8%) (10.6%)
Six months ended June 30, Increase (Decrease)

46
3DS
.CO
M ©
Das
saul
t Sys
tèm
es
| Q2
2012
Ear
ning
s P
rese
ntat
ion
IFRS – Non-IFRS Reconciliation – YTD12 Expenses & Earnings
1. In the reconciliation schedule herewith, (i) adjustments to
IFRS operating expenses data reflect the exclusion of the
amortization of acquired intangibles, share based
compensation expense, and other operating income and
expense, (iii) adjustments to IFRS financial revenue and
other, net reflect the exclusion of certain one-time financial
gains and losses in 2011 and 2012, and (iv) all
adjustments to IFRS income data reflect the combined
effect of these adjustments, plus with respect to net
income and diluted net income per share, the income tax
effect of the non IFRS adjustments.
2. The non-IFRS percentage increase (decrease) compares
non-IFRS measures for the two different periods. In the
event there is a non-IFRS adjustment to the relevant
measure for only one of the periods under comparison, the
non-IFRS increase (decrease) compares the non-IFRS
measure to the relevant IFRS measure.
3. Based on a weighted average of 125.5 million diluted
shares for YTD 2012 and 124.0 million diluted shares for
YTD 2011.
(€ million, except % and per share data)
2012 IFRSAdjustment
(1)
2012
non-IFRS2011 IFRS
Adjustment
(1)
2011
non-IFRSIFRS Non-IFRS (2)
Total Operating Expenses (732.7) 49.7 (683.0) (654.1) 51.9 (602.2) +12.0% +13.4%
Stock-based compensation expense (10.5) 10.5 - (7.8) 7.8 - - -
Amortization of acquired intangibles (43.3) 43.3 - (41.8) 41.8 - - -
Other operating income and expense, net 4.1 (4.1) - (2.3) 2.3 - - -
Operating Income 232.6 49.7 282.3 184.0 52.3 236.3 +26.4% +19.5%
Operating Margin 24.1% 29.2% 22.0% 28.2%
Financial revenue & other, net 5.1 (2.4) 2.7 4.4 (5.0) (0.6) +15.9% (550.0%)
Income tax expense (79.2) (19.3) (98.5) (60.2) (17.0) (77.2) +31.6% +27.6%
Non-controlling interest impact (2.1) 0.0 (2.1) (0.1) -
Net Income 156.4 28.0 184.4 128.1 30.3 158.4 +22.1% +16.4%
Diluted net income per share, in € (3) 1.25 0.22 1.47 1.03 0.25 1.28 +21.4% +14.8%
(€ million)
Cost of rev enue (130.4) 0.3 (130.1) (123.7) 0.3 (123.4)
Research and dev elopment (179.3) 5.0 (174.3) (160.0) 3.7 (156.3)
Marketing and sales (310.5) 2.7 (307.8) (259.5) 2.0 (257.5)
General and administrativ e (73.3) 2.5 (70.8) (66.8) 1.8 (65.0)
Total stock-based compensation expense 10.5 7.8
Six months ended June 30,
Six months ended June 30, Increase (Decrease)
2012 IFRS Adjust. 2011 IFRS2011
non-IFRS
2012
non-IFRSAdjust.
47
3DS
.CO
M ©
Das
saul
t Sys
tèm
es
| Q2
2012
Ear
ning
s P
rese
ntat
ion
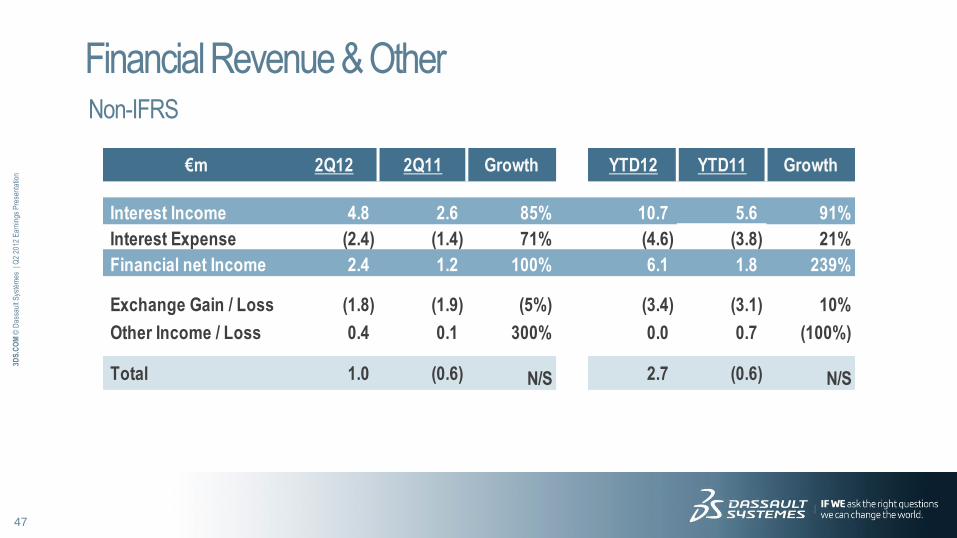
Financial Revenue & Other Non-IFRS
€m 2Q12 2Q11 Growth YTD12 YTD11 Growth
Interest Income 4.8 2.6 85% 10.7 5.6 91%
Interest Expense (2.4) (1.4) 71% (4.6) (3.8) 21%
Financial net Income 2.4 1.2 100% 6.1 1.8 239%
Exchange Gain / Loss (1.8) (1.9) (5%) (3.4) (3.1) 10%
Other Income / Loss 0.4 0.1 300% 0.0 0.7 (100%)
Total 1.0 (0.6) N/S 2.7 (0.6) N/S

48
3DS
.CO
M ©
Das
saul
t Sys
tèm
es
| Q2
2012
Ear
ning
s P
rese
ntat
ion
Exchange Rate Evolution From assumptions to actual data
Breakdown of P&L by currency for 2Q12
USD JPY
Revenue (As a % of Revenue)
35.5% 15.8%
Of which was hedged - ~9%
Operating Expenses (As a % of Expenses)
36.6% 5.9%
Average Exchange rates
$/€ – 2Q12 / 2Q11 Variance ¥/€ – 2Q12 / 2Q11 Variance
2Q11: 1.44
in average
Average ¥/€
rate -12.6%
Average $/€
rate -11.0%
2Q12: 1.28
in average
2Q11:
117.4
in average
2Q12:
102.6
in average
2012 2011 % change
YTD USD 1.30 1.40 -7.7%
JPY 103.3 115.0 -10.2%
Quarter USD 1.28 1.44 -11.0%
JPY 102.6 117.4 -12.6%

49
3DS
.CO
M ©
Das
saul
t Sys
tèm
es
| Q2
2012
Ear
ning
s P
rese
ntat
ion
Comparing 2Q12 with Objectives Non-IFRS
RevenueOperating
Expenses
Operating
Profit
Operating
Margin
2Q12 Guidances 475.0 342.0 133.0 28.0%
Growth YoY +10.8% +10.9% +10.6% +0.0pts
$ Impact on Rev./Exp. +10.6 +7.6 +3.0
JPY Impact on Rev./Exp. +9.2 +2.6 +6.6
Other incl. GBP, WON and Hedging -0.1 +1.2 -1.3
Total FX +19.7 +11.4 +8.3 +0.6pts
Activity / Cost Control / Other +8.2 +2.5 +5.7 +0.6pts
Delta: Reported vs guidances +27.9 +13.9 +14.0 +1.2pts
2Q12 Reported 502.9 355.9 147.0 29.2%
Growth YoY +17.3% +15.4% +22.3% +1.2pts
2Q11 Reported 428.6 308.4 120.2 28.0%

50
3DS
.CO
M ©
Das
saul
t Sys
tèm
es
| Q2
2012
Ear
ning
s P
rese
ntat
ion
Estimated FX impact on 2Q12 Op. Results Non-IFRS*
* For a reconciliation to IFRS financial information, please refer to the tables in the Appendix.
€ millions QTDTotal
Revenue
Operating
Expenses
Operating
Income
Operating
Margin
2Q12 Reported 502.9 (355.9) 147.0 29.2%
2Q11 Reported 428.6 (308.4) 120.2 28.0%
Growth as reported +17.3% +15.4% +22.3% +1.2 pts
Impact of Actual Currency Rates
USD impact 19.7 (13.5) 6.2
JPY impact (Not hedged) 9.5 (2.6) 6.9
Other curencies impact and Hedging (1.3) (1.2) (2.5)
Total FX Impact adjustment 27.9 (17.3) 10.6
2Q11 @ 2Q12 rates 456.5 (325.7) 130.8 28.7%
Growth exFX +10% +9% +12% +0.5 pts

51
3DS
.CO
M ©
Das
saul
t Sys
tèm
es
| Q2
2012
Ear
ning
s P
rese
ntat
ion
Estimated FX impact on YTD12 Op. Results Non-IFRS*
* For a reconciliation to IFRS financial information, please refer to the tables in the Appendix.
€ millions YTDTotal
Revenue
Operating
Expenses
Operating
Income
Operating
Margin
YTD 2012 Reported 965.3 (683.0) 282.3 29.2%
YTD 2011 Reported 838.5 (602.2) 236.3 28.2%
Growth as reported +15.1% +13.4% +19.5% +1.0 pts
Impact of Actual Currency Rates
USD impact 26.6 (18.4) 8.2
JPY impact (Not hedged) 15.2 (4.2) 11.0
Other curencies impact and Hedging (3.3) (1.7) (5.0)
Total FX Impact adjustment 38.5 (24.3) 14.2
YTD 2011 @ YTD 2012 rates 877.0 (626.5) 250.5 28.6%
Growth exFX +10% +9% +13% +0.6 pts

52
3DS
.CO
M ©
Das
saul
t Sys
tèm
es
| Q2
2012
Ear
ning
s P
rese
ntat
ion
Detailed Balance-Sheet IFRS
End of Variation End of Variation
(in millions of €) Jun-12 Mar-12 Jun-12 / Mar-12 Dec-11 Jun-12 / Dec-11
Cash and cash equivalents 1,461.3 1,343.0 +118.3 1,154.3 +307.0
Short-term investments 182.6 216.7 -34.1 268.7 -86.1
Accounts receivable, net 431.1 464.4 -33.3 494.3 -63.2
Other current assets 134.3 148.2 -13.9 139.4 -5.1
Total current assets 2,209.3 2,172.3 +37.0 2,056.7 +152.6
Property and equipment, net 110.9 107.3 +3.6 106.6 +4.3
Goodwill and Intangible assets, net 1,237.5 1,211.5 +26.0 1,241.9 -4.4
Other non current assets 131.6 127.2 +4.4 111.6 +20.0
Total Assets 3,689.3 3,618.3 +71.0 3,516.8 +172.5
Accounts payable 91.5 85.2 +6.3 99.9 -8.4
Unearned revenue 578.7 542.2 +36.5 492.0 +86.7
Short-term debt 229.0 226.5 +2.5 228.9 +0.1
Other current liabilities 299.1 300.8 -1.7 317.3 -18.2
Total current liabilities 1,198.3 1,154.7 +43.6 1,138.1 +60.2
Long-term debt 58.0 66.2 -8.2 72.4 -14.4
Other non current obligations 229.5 214.3 +15.2 222.6 +6.9
Total long-term liabilities 287.5 280.5 +7.0 295.0 -7.5
Non-controlling interest 16.0 16.3 -0.3 17.5 -1.5
Parent Shareholders' equity 2,187.5 2,166.8 +20.7 2,066.2 +121.3
Total Liabilities and Shareholders' Equity 3,689.3 3,618.3 +71.0 3,516.8 +172.5

53
3DS
.CO
M ©
Das
saul
t Sys
tèm
es
| Q2
2012
Ear
ning
s P
rese
ntat
ion
Trade Accounts Receivables / DSO IFRS
75 7679
83
7579
67
7780
7672
7883
74 75 7783
78 76
8689
7671
80
91
7673
8790
77
0 days
10 days
20 days
30 days
40 days
50 days
60 days
70 days
80 days
90 days
100 days
1Q05 2Q05 3Q05 4Q05 1Q06 2Q06 3Q06 4Q06 1Q07 2Q07 3Q07 4Q07 1Q08 2Q08 3Q08 4Q08 1Q09 2Q09 3Q09 4Q09 1Q10 2Q10 3Q10 4Q10 1Q11 2Q11 3Q11 4Q11 1Q12 2Q12

54
3DS
.CO
M ©
Das
saul
t Sys
tèm
es
| Q2
2012
Ear
ning
s P
rese
ntat
ion
Consolidated Statement of Cash Flows IFRS (in millions of €)
2Q12 2Q11 Variation YTD12 YTD11 Variation
Net income attributable to equity holders of the parent 84.3 64.3 +20.0 156.4 128.1 +28.3
Non-controlling interest 1.0 - +1.0 2.1 0.1 +2.0
Net income 85.3 64.3 +21.0 158.5 128.2 +30.3
Depreciation of property & equipment 7.0 6.0 +1.0 16.1 12.2 +3.9
Amortization of intangible assets 23.2 21.5 +1.7 45.7 43.6 +2.1
Other non cash P&L items (4.6) - -4.6 0.9 0.5 +0.4
Changes in working capital 77.2 55.8 +21.4 132.6 96.8 +35.8
Net Cash Provided by (Used in) Operating Activities (I) 188.1 147.6 +40.5 353.8 281.3 +72.5
Additions to property, equipment and intangibles (9.3) (13.1) +3.8 (23.7) (22.3) -1.4
Payment for acquisition of businesses, net of cash acquired (1.0) - -1.0 (19.1) (29.5) +10.4
Sale of fixed assets 0.1 - +0.1 0.3 0.1 +0.2
Sale (Purchase) of short-term investments, net 36.0 41.3 -5.3 86.9 (121.6) +208.5
Loans and others (7.5) 0.6 -8.1 (12.5) (2.6) -9.9
Net Cash Provided by (Used in) Investing Activities (II) 18.3 28.8 -10.5 31.9 (175.9) +207.8
Proceeds (Repayment) of short term and long term debt (14.0) (12.8) -1.2 (14.0) (12.8) -1.2
Repurchase of common stock (71.9) (61.2) -10.7 (71.9) (172.3) +100.4
Proceeds from exercise of stock-options 41.5 98.9 -57.4 74.2 179.0 -104.8
Cash dividend paid (86.5) (65.8) -20.7 (86.5) (65.8) -20.7
Net Cash Provided by (Used in) Financing Activities (III) (130.9) (40.9) -90.0 (98.2) (71.9) -26.3
42.8 (6.1) +48.9 19.5 (43.8) 63.3
Increase (Decrease) in Cash (V) = (I)+(II)+(III)+(IV) 118.3 129.4 -11.1 307.0 (10.3) +317.3
Cash and cash equivalents at Beginning of Period 1,343.0 836.8 1,154.3 976.5
Cash and cash equivalents at End of Period 1,461.3 966.2 1,461.3 966.2
Effect of exchange rate changes on cash and cash
equivalents (IV)
55
3DS
.CO
M ©
Das
saul
t Sys
tèm
es
| Q2
2012
Ear
ning
s P
rese
ntat
ion
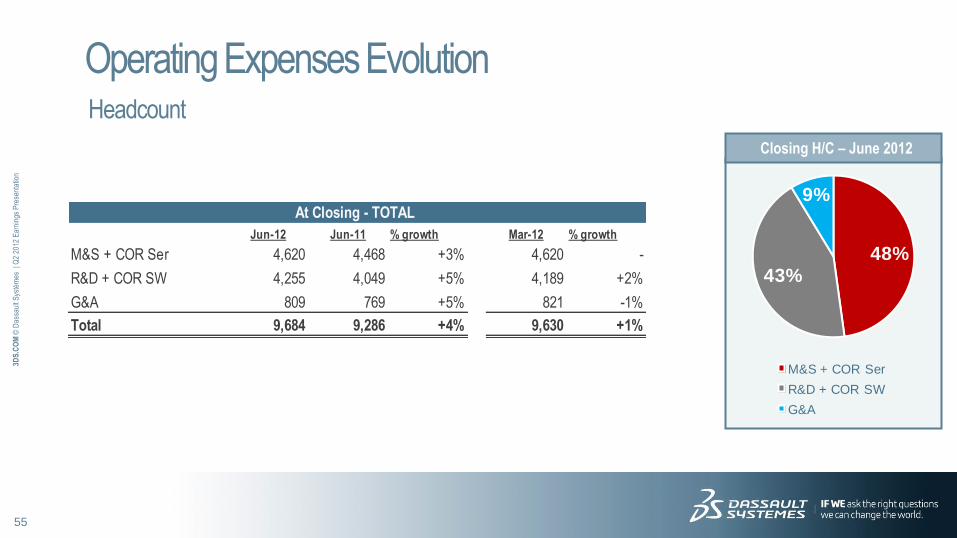
Operating Expenses Evolution Headcount
Closing H/C – June 2012
48%43%
9%
M&S + COR Ser
R&D + COR SW
G&A
At Closing - TOTAL At Closing - TOTAL
Jun-12 Jun-11 % growth Mar-12 % growth
M&S + COR Ser 4,620 4,468 +3% 4,620 -
R&D + COR SW 4,255 4,049 +5% 4,189 +2%
G&A 809 769 +5% 821 -1%
Total 9,684 9,286 +4% 9,630 +1%

56
3DS
.CO
M ©
Das
saul
t Sys
tèm
es
| Q2
2012
Ear
ning
s P
rese
ntat
ion
Accounting Elements Not Included in non-IFRS 2012 Objectives
IFRS 2012 Objectives
FY 2012 estimated deferred revenue write-down of about €0m
FY 2012 estimated share-based compensation expenses: ~€20m
FY 2012 estimated amortization of acquired intangibles: ~€85m for 2012
Other operating income and expense, net
2.2 m€ expense in Q1, 6.3m€ income in Q2, mostly coming from the sale of Transcat
No estimate for FY
Above non-IFRS adjustments do not take into account the impact of Gemcom acquisition for
which the accounting will be finalized in Q3 earnings announcement
These estimates do not include the impact of new stock options or share grants nor new
acquisitions or restructuring which could take place after July 26th, 2012

57
3DS
.CO
M ©
Das
saul
t Sys
tèm
es
| Q2
2012
Ear
ning
s P
rese
ntat
ion