analytic nfl alphas 2015-2016 - windows - microsoft · pdf fileanalytic investors nfl alphas...
TRANSCRIPT


SNATCHING DEFEAT FROM THE JAWS OF VICTORY
The finish of Super Bowl XLIX will go down as one of the greatest in history, as Malcolm
Butler of the New England Patriots intercepted a potential title-winning pass by Russell
Wilson of the Seattle Seahawks with 20 seconds left to seal a 28-24 Patriots victory. Pete
Carroll’s specious play call for a pass in lieu of a run resulted in our second consecutive
incorrect Super Bowl pick. As was made abundantly clear after Wes Welker’s infamous
drop in Super Bowl XLVI, our predictions do not take into account the effects of glaring
human error and alleged doctored footballs. Despite this setback, we are still 9-3 with our
selections dating back to our seminal analysis in 2004. We hope that the golden
anniversary of the game will also commemorate an end to our two-game losing streak as
swiftly and resoundingly as NFL owners voting to return the Rams to their rightful home in
Los Angeles. #WestCoastBias
In Roman numeral-less Super Bowl 50 (formerly known as L) the top seeds from each
conference are pitted against one another: the Carolina Panthers and the Denver Broncos.
Will it be probable league MVP Cam Newton capping off a dream season or Peyton
Manning potentially ending a great career with one last Lombardi Trophy? This, and many
other questions will hopefully be answered in the analysis that follows, and ultimately on
February 7th in San Francisco Santa Clara.
INTO THE WEEDS Our annual Super Bowl selection is predicated upon the investment return of each NFL team relative to sports wagering market expectations throughout the regular season. This year, we thought it might be a useful
exercise to break down precisely how this investment return is calculated. A fitting case study will be our very own Los Angeles Rams. Non-descript bettor “Stan” has $16 and heads to Las Vegas for each of the Rams’ 16 regular season games. Seconds before the kickoff of each game, Stan
places a $1 bet that the Rams will win (colloquially, a “money line” wager). If the Rams lose, Stan loses $1. At the end of Stan’s 16-game marathon in Las Vegas, he adds up his profit/loss from his 16 $1 wagers and determines his average return on investment (ROI). The result of this rather

ANALYTICINVESTORSNFLALPHAS2015-2016 3
simple calculation is the Rams’ “NFL Alpha”, and luckily, his calculation is not “staying in Las Vegas.” We repeat this same exercise for each of the other 31 NFL teams, creating the foundation for our analysis.
PURPLE REIGN, BROWN IN THE DUMPS
Spoiler alert, the Carolina Panthers ended the 2015-2016 season with the highest NFL Alpha at 61.5% (Table 1). This was predictable for two reasons: the Panthers had a much better record (15-1) than any other team in the NFL, and perhaps more importantly, the Panthers weren’t supposed to have a much better record than any other team in the NFL. An arguably more illustrative NFL Alpha example comes from this season’s runner-up: the Minnesota Vikings at 31.9% (Chart 1). The Vikings were one of the great stories of the season, finishing with an 11-5 record (13-3 against the point spread) and dethroning the Green Bay Packers as NFC North champions. After suffering a head-scratching loss to a remarkably inept Colin Kaepernick and his Santa Clara 49ers to start the season, the Vikings set bettor expectations to
a deserved minimum. However, the Vikings were able to right the ship thereafter, literally and figuratively. Despite being underdogs in the majority of their remaining fifteen games, they won eleven and became a very profitable investment. But as all loyal Vikings fans know, good times don’t last forever. Despite all their legwork to make the playoffs, they suffered a heartbreaking loss to the Seahawks when kicker Blair Walsh missed a potential game-winning 27-yard field goal in frigid Minneapolis. Look on the bright side, Minnesotans – at least your new stadium opens later this year, and it will be indoors.
At the opposite end of the spectrum were the infamously hard luck Cleveland Browns. The team finished with a 3-13 record and a league-worst -57.6% NFL Alpha (Chart 1). Despite being a literal dog for most of the season, only one of their three victories came as an underdog, which considerably damaged their ability to reward persistent investors. As if that weren’t bad
enough, they had to endure another season with the “Johnny Football” circus. Quarterback Johnny Manziel appeared lost on the field and was wishing he was lost off the field, as he culminated the year by skipping a mandatory concussion check-up to party in Vegas wearing a disguise. In typical NFL fashion, the team addressed this issue by firing both the head coach and general manager, and hired one of Major League Baseball’s foremost proponents of statistical analysis, Paul DePodesta – known to be an architect of “Moneyball.” As a quantitative manager, we inherently applaud the move but temper our excitement by
remembering that we’re discussing the Browns here. There is a silver lining though: for the second consecutive year, the team with the lowest NFL Alpha ended up with the 2nd overall pick in the draft. Here’s a hint to our fellow quants: the Titans are right in front of you with the #1 pick and they don’t need a QB.
Chart 1 CUMULATIVE ALPHAS: Minnesota Vikings vs. Cleveland Browns
-100
-75
-50
-25
0
25
50
1 2 3 4 5 6 7 8 9 10 11 12 13 14 15 16
%A
LPHA
GAMES
MinnesotaVikings
ClevelandBrowns

ANALYTICINVESTORSNFLALPHAS2015-2016 4
Table 1 ALPHAS FOR ALL 32 NFL TEAMS
A L P H A
2 0 1 5 - 2 0 1 6
Team 2015 - 2016 2014 - 2015 Alpha Change Record Favorite/ Underdog
Carolina Panthers 61.5% 8.1% 53.4% 15-1 14-2 Minnesota Vikings 31.9% -9.5% 41.4% 11-5 8-8
Denver Broncos 31.9% 3.6% 28.3% 12-4 12-4 Washington Redskins 31.5% -31.2% 62.7% 9-7 2-14
Arizona Cardinals 28.6% 41.6% -12.9% 13-3 15-1
Houston Texans 25.9% 5.0% 20.9% 9-7 6-10
Chicago Bears 23.4% -27.4% 50.8% 6-10 2-14
Cincinnati Bengals 20.4% 41.6% -21.2% 12-4 12-4
St Louis Rams 16.4% 14.2% 2.2% 7-9 7-9
Pittsburgh Steelers 13.8% 29.3% -15.5% 10-6 8-8
New York Jets 12.7% -41.5% 54.2% 10-6 13-3
Kansas City Chiefs 12.6% 13.4% -0.8% 11-5 12-4
Tampa Bay Buccaneers 11.6% -56.1% 67.7% 6-10 5-11
Oakland Raiders 9.4% -30.9% 40.3% 7-9 5-11
Atlanta Falcons 8.0% -20.8% 28.8% 8-8 9-7
New Orleans Saints 6.3% -27.2% 33.5% 7-9 7-9
Indianapolis Colts 5.8% 3.9% 1.9% 8-8 8-8
New England Patriots 5.7% 28.2% -22.4% 12-4 15-1
Philadelphia Eagles 2.1% 10.3% -8.3% 7-9 10-6
Detroit Lions 0.8% 12.8% -12.0% 7-9 6-10
Buffalo Bills -0.7% 30.2% -30.9% 8-8 7-9
Seattle Seahawks -3.4% 9.9% -13.2% 10-6 13-3
Green Bay Packers -4.6% 8.2% -12.8% 10-6 15-1
Miami Dolphins -6.0% -10.6% 4.6% 6-10 6-10
San Francisco 49ers -6.2% -12.2% 6.0% 5-11 0-16
Baltimore Ravens -15.6% 3.5% -19.1% 5-11 8-8
Jacksonville Jaguars -26.6% -57.8% 31.2% 5-11 5-11
New York Giants -28.3% -21.7% -6.6% 6-10 8-8
Dallas Cowboys -44.2% 55.5% -99.6% 4-12 5-11
San Diego Chargers -50.1% 10.2% -60.2% 4-12 6-10
Tennessee Titans -52.0% -74.6% 22.5% 3-13 3-13
Cleveland Browns -57.5% -6.0% -51.5% 3-13 4-12

ANALYTICINVESTORSNFLALPHAS2015-2016 5
A TALE OF TWO NFC NORTH ALPHAS When is a 6-10 team a better investment than a 10-6 one? When you examine NFL Alphas in the league’s “Black & Blue Division” (Chart 2). Although the Green Bay Packers finished 10-6 on the season, they managed a rather pedestrian NFL Alpha of -4.6%. The primary drivers of this perceived underperformance lie in the fact that they were favored in 15 of their 16 contests, and
they had no upset victories. At least Packers QB Aaron Rodgers gave us some great television moments − not those ubiquitous insurance commercials, but two last-second “Hail Mary” touchdown passes that defied logic. On the flip side, the Chicago Bears were Monsters of the Midway when it came to wagering. Despite being underdogs in 14 of their 16 games, the Bears exceeded expectations and shook off a 0-3 start, earning an NFL Alpha of
23.4%. New head coach John Fox may not have been good enough for Peyton Manning in Denver, but he had a noticeable effect on the notoriously disappointing Bears and their much maligned QB; Jay Cutler. Three impressive wins on the road against the Kansas City Chiefs, the (former) St. Louis Rams, and the underachieving Packers only served to sweeten the pot for loyal Bears investors.
Chart 2 CUMULATIVE ALPHAS: Green Bay Packers vs. Chicago Bears
-100
-80
-60
-40
-20
0
20
40
60
1 2 3 4 5 6 7 8 9 10 11 12 13 14 15 16
%ALPHA
GAMES
ChicagoBears
GreenBayPackers
CAN A CHANGE IN QB AFFECT ALPHA? In the 21st century NFL, a team’s fate is for better or worse a function of its quarterback caliber. Not surprisingly, we see this shake out in our NFL Alphas as well. When comparing the best year-over-year changes in Alphas, a trend emerges: the three most improved teams made a prudent quarterback change in 2015. We
use the passer rating as a benchmark, which is a statistic that measures a QB’s efficiency based on passing yards, touchdowns, attempts, completions, and interceptions. This metric is also used by the NFL to rank its passing leaders. The teams with the three most positive changes in NFL Alpha − the Tampa Bay Buccaneers (67.7%), Washington Redskins (62.7%), and New York Jets
(54.2%) all clearly made the correct switch at QB (Table 2). The Buccaneers’ change was a result of the team drafting QB Jameis Winston with the #1 pick, while the Redskins started Kirk Cousins in favor of the oft-injured and seldom effective Robert Griffin III. The Jets? They may have had one of the more unusual reasons for a QB shakeup in modern history. Last season’s starter, Geno Smith, suffered a

ANALYTICINVESTORSNFLALPHAS2015-2016 6
broken jaw in August after being sucker punched by a teammate over a $600 debt. Whether savvy or opportune, these QB changes
proved good investments for teams and investors alike. Yet, how did the Bucs reward head coach Lovie Smith for
outperforming expectations in this manner? By firing him, of course. Apparently our research does not resonate in Tampa.
Table 2 HIGHEST ALPHA CHANGE
Q U A R T E R B A C K
Team Alpha
Change 2015 - 2016
QB
2015 - 2016 Passer
Rating*
2014 - 2015 QB
2014 - 2015 Passer
Rating*
Rating Change
Tampa Bay Buccaneers 67.7% Jameis Winston 84.2 Josh McCown 70.5 13.7
Washington Redskins 62.7% Kirk Cousins 101.6 Robert Griffin III 86.9 14.7
New York Jets 54.2% Ryan Fitzpatrick 88.0 Geno Smith 77.5 10.5 *Source: NFL.com
WHO SAYS PLAYING THE LOTTERY DOESN’T PAY? As we’ve written about in a number of academic research papers, we utilize an investment approach that is based on the tenet that low risk equities tend to outperform their higher-risk counterparts within asset classes. This anomaly is not limited to equity markets; in fact, it’s not even limited to investable securities in general. Prior research at Analytic and beyond has demonstrated that this can be applied to sports wagering and can be referred to as the “favorite - longshot bias”. Empirically, the bias addresses the fact that bets placed on big favorites with lower payouts –
those with less risk – typically outperform riskier ones on heavy underdogs that pay out significantly more. This was the case in 2014 and in many of the previous 10 years, but 2015 has flipped the script. Low risk bets returned -15.3%, while high risk ones returned a whopping 46.7% (Chart 3). As it turns out, this is primarily attributable to a disproportionate amount of 9-to 11-point underdogs pulling off upsets. Does this mean gamblers should enter into Powerball-like office pools in the hopes of hitting the NFL’s version of the lottery? Not necessarily. This is the first time in the last decade that such a swing has happened in favor of a positive risk premium, with the last being the
2006 regular season (Chart 4). Ironically, that was also the year that Peyton Manning won his lone Super Bowl ring. Furthermore, favorites covered the spread 44% of the time this season, the lowest rate since – you guessed it – 2006 (43%). There are plenty of potential reasons for this: more parity in the league, a rash of injuries to teams’ top players, or perhaps this was just one of those “outlier” years. While the low volatility anomaly admittedly had an off-year in NFL wagering markets, we are proud to report that low risk outperformed high risk by 17.6% in 2015 (VMS from within the Russell 1000 Index).

ANALYTICINVESTORSNFLALPHAS2015-2016 7
Chart 3 LOW VOLATILITY ANALYSIS 2015-2016 SEASON
-20%
-10%
0%
10%
20%
30%
40%
50%
-9andbelow/Low -3.5to-8.5/Fair -3to+3/Average +3.5to+8.5/Moderate
+9andabove/High
AVGRE
TURN
TOM
ONEYLINEWAG
ER
LINE/VOLATILITY
Chart 4 YEARLY PAYOUTS BY RISK LEVEL
ANALYTICINVESTORSNFLALPHAS2015-2016 8
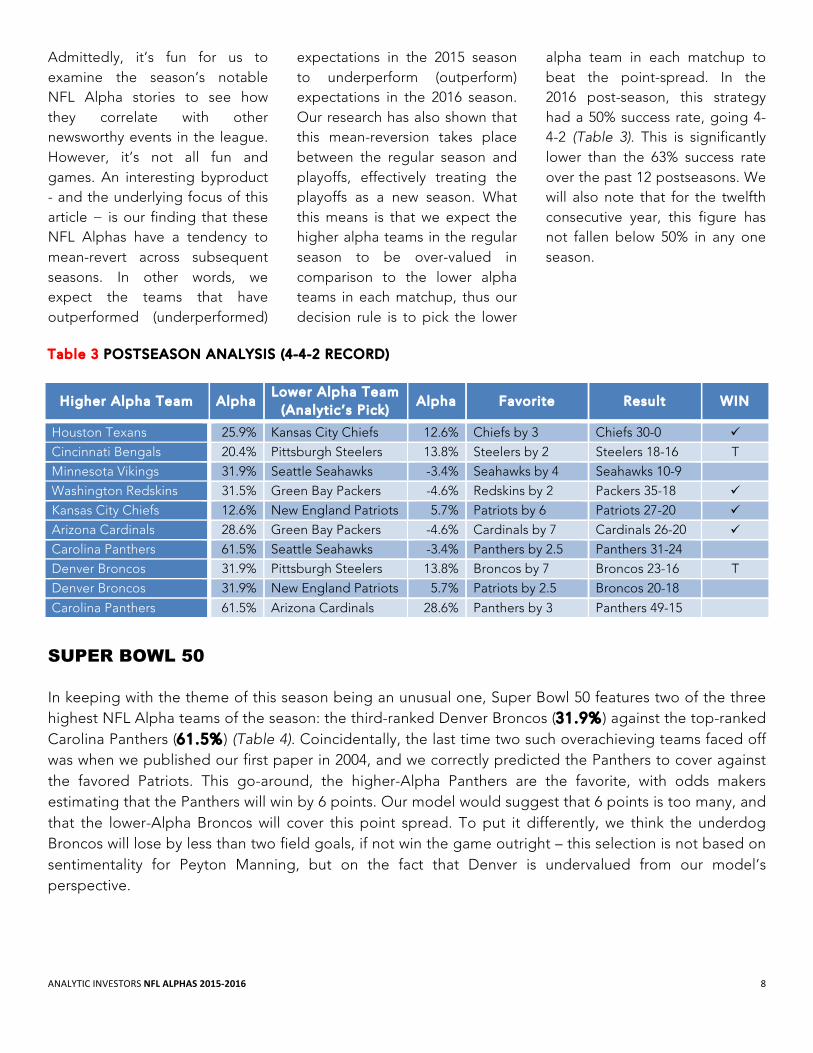
Admittedly, it’s fun for us to examine the season’s notable NFL Alpha stories to see how they correlate with other newsworthy events in the league. However, it’s not all fun and games. An interesting byproduct - and the underlying focus of this article − is our finding that these NFL Alphas have a tendency to mean-revert across subsequent seasons. In other words, we expect the teams that have outperformed (underperformed)
expectations in the 2015 season to underperform (outperform) expectations in the 2016 season. Our research has also shown that this mean-reversion takes place between the regular season and playoffs, effectively treating the playoffs as a new season. What this means is that we expect the higher alpha teams in the regular season to be over-valued in comparison to the lower alpha teams in each matchup, thus our decision rule is to pick the lower
alpha team in each matchup to beat the point-spread. In the 2016 post-season, this strategy had a 50% success rate, going 4-4-2 (Table 3). This is significantly lower than the 63% success rate over the past 12 postseasons. We will also note that for the twelfth consecutive year, this figure has not fallen below 50% in any one season.
Table 3 POSTSEASON ANALYSIS (4-4-2 RECORD)
Higher Alpha Team Alpha Lower Alpha Team
(Analytic’s Pick) Alpha Favorite Result WIN
Houston Texans 25.9% Kansas City Chiefs 12.6% Chiefs by 3 Chiefs 30-0 ü Cincinnati Bengals 20.4% Pittsburgh Steelers 13.8% Steelers by 2 Steelers 18-16 T
Minnesota Vikings 31.9% Seattle Seahawks -3.4% Seahawks by 4 Seahawks 10-9
Washington Redskins 31.5% Green Bay Packers -4.6% Redskins by 2 Packers 35-18 ü Kansas City Chiefs 12.6% New England Patriots 5.7% Patriots by 6 Patriots 27-20 ü Arizona Cardinals 28.6% Green Bay Packers -4.6% Cardinals by 7 Cardinals 26-20 ü Carolina Panthers 61.5% Seattle Seahawks -3.4% Panthers by 2.5 Panthers 31-24
Denver Broncos 31.9% Pittsburgh Steelers 13.8% Broncos by 7 Broncos 23-16 T
Denver Broncos 31.9% New England Patriots 5.7% Patriots by 2.5 Broncos 20-18
Carolina Panthers 61.5% Arizona Cardinals 28.6% Panthers by 3 Panthers 49-15
SUPER BOWL 50 In keeping with the theme of this season being an unusual one, Super Bowl 50 features two of the three highest NFL Alpha teams of the season: the third-ranked Denver Broncos (31.9%) against the top-ranked Carolina Panthers (61.5%) (Table 4). Coincidentally, the last time two such overachieving teams faced off was when we published our first paper in 2004, and we correctly predicted the Panthers to cover against the favored Patriots. This go-around, the higher-Alpha Panthers are the favorite, with odds makers estimating that the Panthers will win by 6 points. Our model would suggest that 6 points is too many, and that the lower-Alpha Broncos will cover this point spread. To put it differently, we think the underdog Broncos will lose by less than two field goals, if not win the game outright – this selection is not based on sentimentality for Peyton Manning, but on the fact that Denver is undervalued from our model’s perspective.

ANALYTICINVESTORSNFLALPHAS2015-2016 9
Table 4 SUPER BOWL RESULTS
SUPER BOWL
Date Higher Alpha
Team Lower Alpha Team
(Analytic’s Pick) Favorite Result
Prediction Correct
XXXVIII
2/1/2004 New England Patriots (67.0%)
Carolina Panthers (39.0%)
Patriots by 7 Patriots 32-29* ü
XXXIX 2/6/2005 New England Patriots (33.5%)
Philadelphia Eagles (12.6%)
Patriots by 7 Patriots 24-21* ü
XL 2/5/2006 Seattle Seahawks (25.0%)
Pittsburgh Steelers (11.4%)
Steelers by 4 Steelers 21-10 ü
XLI 2/4/2007 Chicago Bears (17.8%)
Indianapolis Colts (14.5%)
Colts by 6.5 Colts 29-17 ü
XLII 2/3/2008 New England Patriots (22.9%)
New York Giants (14.6%)
Patriots by 12.5 Giants 17-14 ü
XLII I 2/1/2009 Pittsburgh Steelers (33.6%)
Arizona Cardinals (-6.4%)
Steelers by 6.5 Steelers 27-23* ü
XLIV 2/7/2010 Indianapolis Colts (37.6%)
New Orleans Saints (12.8%)
Colts by 4.5 Saints 31-17 ü
XLV 2/6/2011 Pittsburgh Steelers (28.6%)
Green Bay Packers (1.3%)
Packers by 3 Packers 31-25 ü
XLVI 2/5/2012 New York Giants (32.8%)
New England Patriots (15.8%)
Patriots by 3 Giants 21-17
XLVII 2/3/2013 San Francisco 49ers (23.1%)
Baltimore Ravens (2.2%)
49ers by 4.5 Ravens 34-31 ü
XLVII I 2/2/2014 Seattle Seahawks (13.7%)
Denver Broncos (4.6%)
Broncos by 2 Seahawks 43-8
XLIX 2/1/2015 New England Patriots (28.2%)
Seattle Seahawks (9.9%)
Patriots by 1.5 Patriots 28-24
50 2/7/2016 Carolina Panthers (61.5%)
Denver Broncos (31.9%)
Panthers by 6 ? ?
*While in these games lower-Alpha teams did lose to the higher-Alpha teams, the predictions are correct because of the lower-Alpha teams covered their respective point spreads. The opinions expressed herein are those of Analytic Investors and are subject to change without notice. The research is prepared for general circulation and is circulated for general information only. It does not have regard to specific investment objectives, the financial situation and the particular needs of any specific person who may receive this report. NFL and Super Bowl are registered trademarks of the National Football League.
555 West Fifth Street, 50th Floor Los Angeles, California 90013 213.688.3015 www.aninvestor.com